Article

Development of Potato Mass Estimation System Based on Deep Learning

1
Department of Agricultural Engineering, National Academy of Agricultural Science, Rural Development Administration, Jeonju 54875, Republic of Korea
2
Department of Biosystems Machinery Engineering, Chungnam National University, Daejoen 34134, Republic of Korea
*
Author to whom correspondence should be addressed.
Appl. Sci. 2023, 13(4), 2614; https://doi.org/10.3390/app13042614
Submission received: 25 January 2023 / Revised: 15 February 2023 / Accepted: 16 February 2023 / Published: 17 February 2023
(This article belongs to the Special Issue AI,IoT and Remote Sensing in Precision Agriculture)

Abstract

:
Potato is one of the world’s four major food crops as an important resource cultivated in about 150 countries. As precision agriculture has recently attracted increasing attention for its role in improving productivity, interest in yield monitoring is also increasing. Yield monitoring is a precision agriculture technology, and it can help farmhouse business management in the future by contributing to variable fertilization and supply and demand control. The present study was carried out to develop and evaluate a system that uses machine vision and deep learning technologies to estimate potato mass to monitor potato yield. The system performs object classification using the YOLOv5 algorithm to sort out potatoes among various foreign substances, object tracking using the DeepSORT algorithm to track the sorted potatoes, and volume calculation using the lengths of the major axis and minor axis of the tracked potatoes. The results of analyzing the function of the developed yield monitoring system showed an object detection rate of 95.2% and a weight measurement error of 9%, indicating that the computation load must be reduced through algorithm optimization to improve the accuracy and that error correction needs to be performed based on the potato position within the view angle.

1. Introduction

Potato is one of the world’s four major food crops along with rice, wheat, and corn, and its estimated worldwide production was 356 million tons and its estimated cultivation area was 1.649 million hectares in 2020 [1]. In the case of Korea, its production was 550 thousand tons and its estimated cultivation area was 23,599 hectares in 2020, making it one of the field crops that represent major income sources for farmhouses [2]. Recently, the cost of labor in Korea has been increasing due to a decrease in the rural population and the aging of the population, thereby increasing the production costs of agricultural products [3]. Accordingly, precision agriculture—which reduces production costs while simultaneously increasing production—is becoming increasingly important. The objective of precision agriculture is to minimize input resources and increase production to fit the characteristics of each location by monitoring the state, environment, and conditions of farmland and crops and combining the result with the location information obtained by GPS [4].
The concept of precision agriculture was first established in 1929 along with the study on the measurement of the spatial variability of soil acidity carried out by Linsley and Bauer of Illinois University in 1929 [5,6], but the concept began to be studied in earnest with the commercialization of GPS and GIS technologies in the middle of the 1990s. Recently, in addition to being a solution for reducing the labor force, precision agriculture has been attracting attention as an alternative that can be used to minimize environmental pollution while using minimal input materials. In addition, interest in precision agriculture is also increasing as a result of sensor commercialization and price stabilization along with advancements in the technologies used.
The yield variability information of a field is essential information that can be used as a basis for understanding the cultivation result of the current year and establishing the farming plan for the next year. Further, a yield map created by combining yield information and GIS technology can be of a great help to farmhouse business management as it can allow for the yield information of the farmland to be intuitively determined.
For the measurement of the yield information, a method using load cells and machine vision has been studied extensively [7,8,9,10,11]. Load cells are most widely used for yield monitoring, and in the case of crops such as rice and wheat, systems using load cells attached inside a combine harvester have been commercialized in the USA, Europe, Japan, and so on. These crops can be accurately monitored by separating stems and products through post-harvest threshing, but it is difficult to use the same method for potatoes that are dug from a field and mixed with soil, stones, and stems in conveyor belts. For potatoes, studies have been carried out using machine vision, which is less constrained by space and can be configured in a relatively simple manner [12]. Larsson [13] attempted to measure potato sizes using the pixel count of a projected area by installing a CCD camera at the end of a conveyor belt, and Hofstee and Molema [14] developed a large-quantity estimation method using a line scan camera. Long et al. [15] measured the volume of potatoes by calculating depth information using stereo vision, and Lee [12] conducted a potato weight estimation study using a regression equation and the images of potatoes dug from a field. However, there was a problem in that the same overlapping potatoes had to be removed from continuously taken images and the potatoes located in the boundary part had to be excluded.
Artificial intelligence, which is attracting attention in a wide variety of industries, can present a solution to such a problem. Artificial neural networks that are used to detect objects include RCNN (region with convolutional network), fast RCNN, and faster RCNN. Such RCNN series methods use a two-stage detector comprised of two networks: one that selects the candidate in the image in which an object is presumed to exist (region proposal) and the other that classifies objects through a detector. While this method has the advantage of a high accuracy, it has a disadvantage of a limited processing speed. Since it is necessary to detect potatoes at each location in real-time to fertilize by location and yield maps based on yields in the field, this method was not suitable for use in this study. On the other hand, in the case of the one-stage detector that has recently come to be widely used for object detection, localization and classification are achieved at the same time as the region proposal step is removed from the existing two-stage detector and objects are detected at once. Although this method is very fast, its accuracy tends to be a little lower than that of the two-stage detector, and a representative one is the YOLO algorithm [16,17].
In general, the purpose of research on the yield monitoring of potatoes was to measure the number of potatoes harvested. However, since potatoes are not constant in size and weight for each individual, it is necessary to measure the real-time harvest weight for accurate yield monitoring. Therefore, the objective of the present study is to develop and evaluate a potato mass estimation system that can ultimately determine the yield of potatoes by sorting out and tracking in real time the potatoes being harvested using the camera in the harvester and deep learning technology and applying an estimation formula that can estimate the mass of potatoes to the result.

2. Materials and Methods

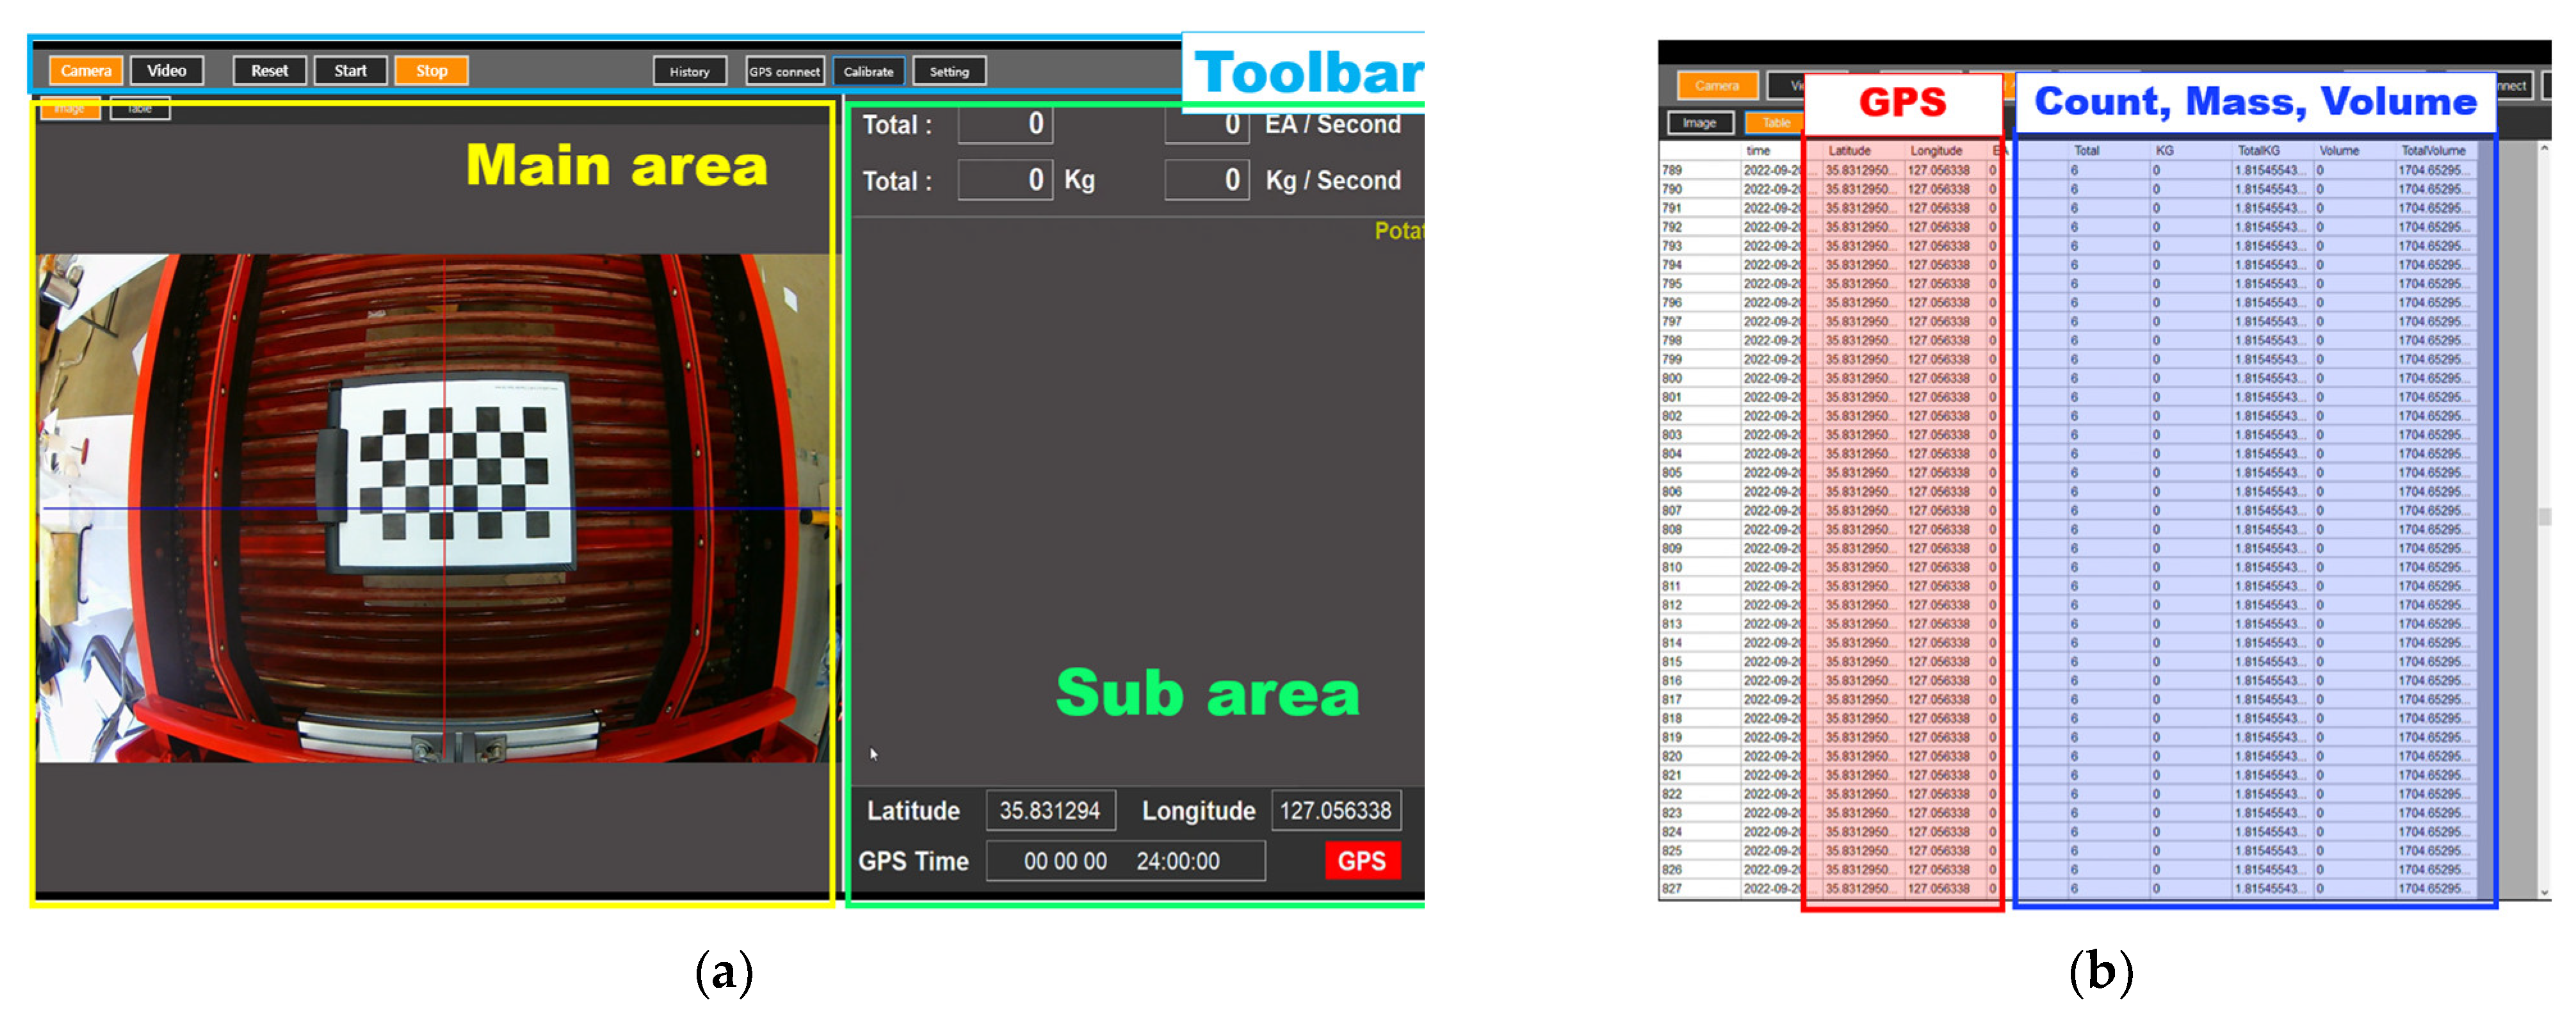
2.1. Potato Mass Estimation System

The system used to estimate the mass of potatoes in the present study is configured as follows. The sorting unit of the potato harvester is separately fabricated for the experiment, as shown in Figure 1, and the system is configured to photograph the images of the sorting unit and transmit them to the connected computer using a camera (KYT-U400-01M, KAYETON) installed on top of the system, and to collect locational information through the installed RTK-GPS (MRP-2000, MBC, the Republic of Korea). To ensure that accurate locational information is collected at this time, a GNSS and an LTE antenna are installed to reduce errors, and the specifications related to this are shown in Table 1.
The system used in the present study was fabricated by improving the potato yield monitoring system designed in Jang et al. [18] and adding a function for the estimation of the potato mass. The process used to estimate the potato mass is as follows: (1) the image photographed at the top end of the sorting unit of the potato harvester is transmitted to the connected computer. (2) The connected computer performs the distortion correction of the images transmitted by the camera and then calculates the length per pixel. (3) Then, it sorts out potatoes from foreign substances by applying YOLOv5—one of the deep learning algorithms—to the corrected images, and it tracks objects by applying DeepSORT—an object tracking algorithm—to the sorted potato object. (4) The volume of the tracked potato object is estimated by entering the lengths of the major axis and minor axis of the potato into the regression equation, (5) and the mass of the potato is estimated by multiplying the ultimately estimated volume and the density of potato. This process is illustrated in Figure 2.

2.1.1. Camera Calibration

In all image-based works, correction is an essential and the most important step for reducing errors. Raw images photographed using a camera are distorted by the lens. The checkerboard detection method proposed by Zhang [19] is generally used to correct such distortions. Although this is a method that was first presented in 2000, it continues to be used in many image fields to this day as it has the advantages of a high accuracy and stability. Since the raw images of the camera developed in the present study were also distorted by the fisheye lens, distortion correction using the checkerboard detection method was carried out first. A checkerboard, on which 5 × 8 squares of 35 mm in width and height are printed, was used, and distortion correction was carried out using OpenCV after photographing the board from various positions within the viewing angle, as shown in Figure 3. After the distortion correction, to match each pixel and the actual length, the actual length (mm) was divided by the number of pixels occupied by one square of the checkerboard to calculate the length per unit pixel.

2.1.2. Classification
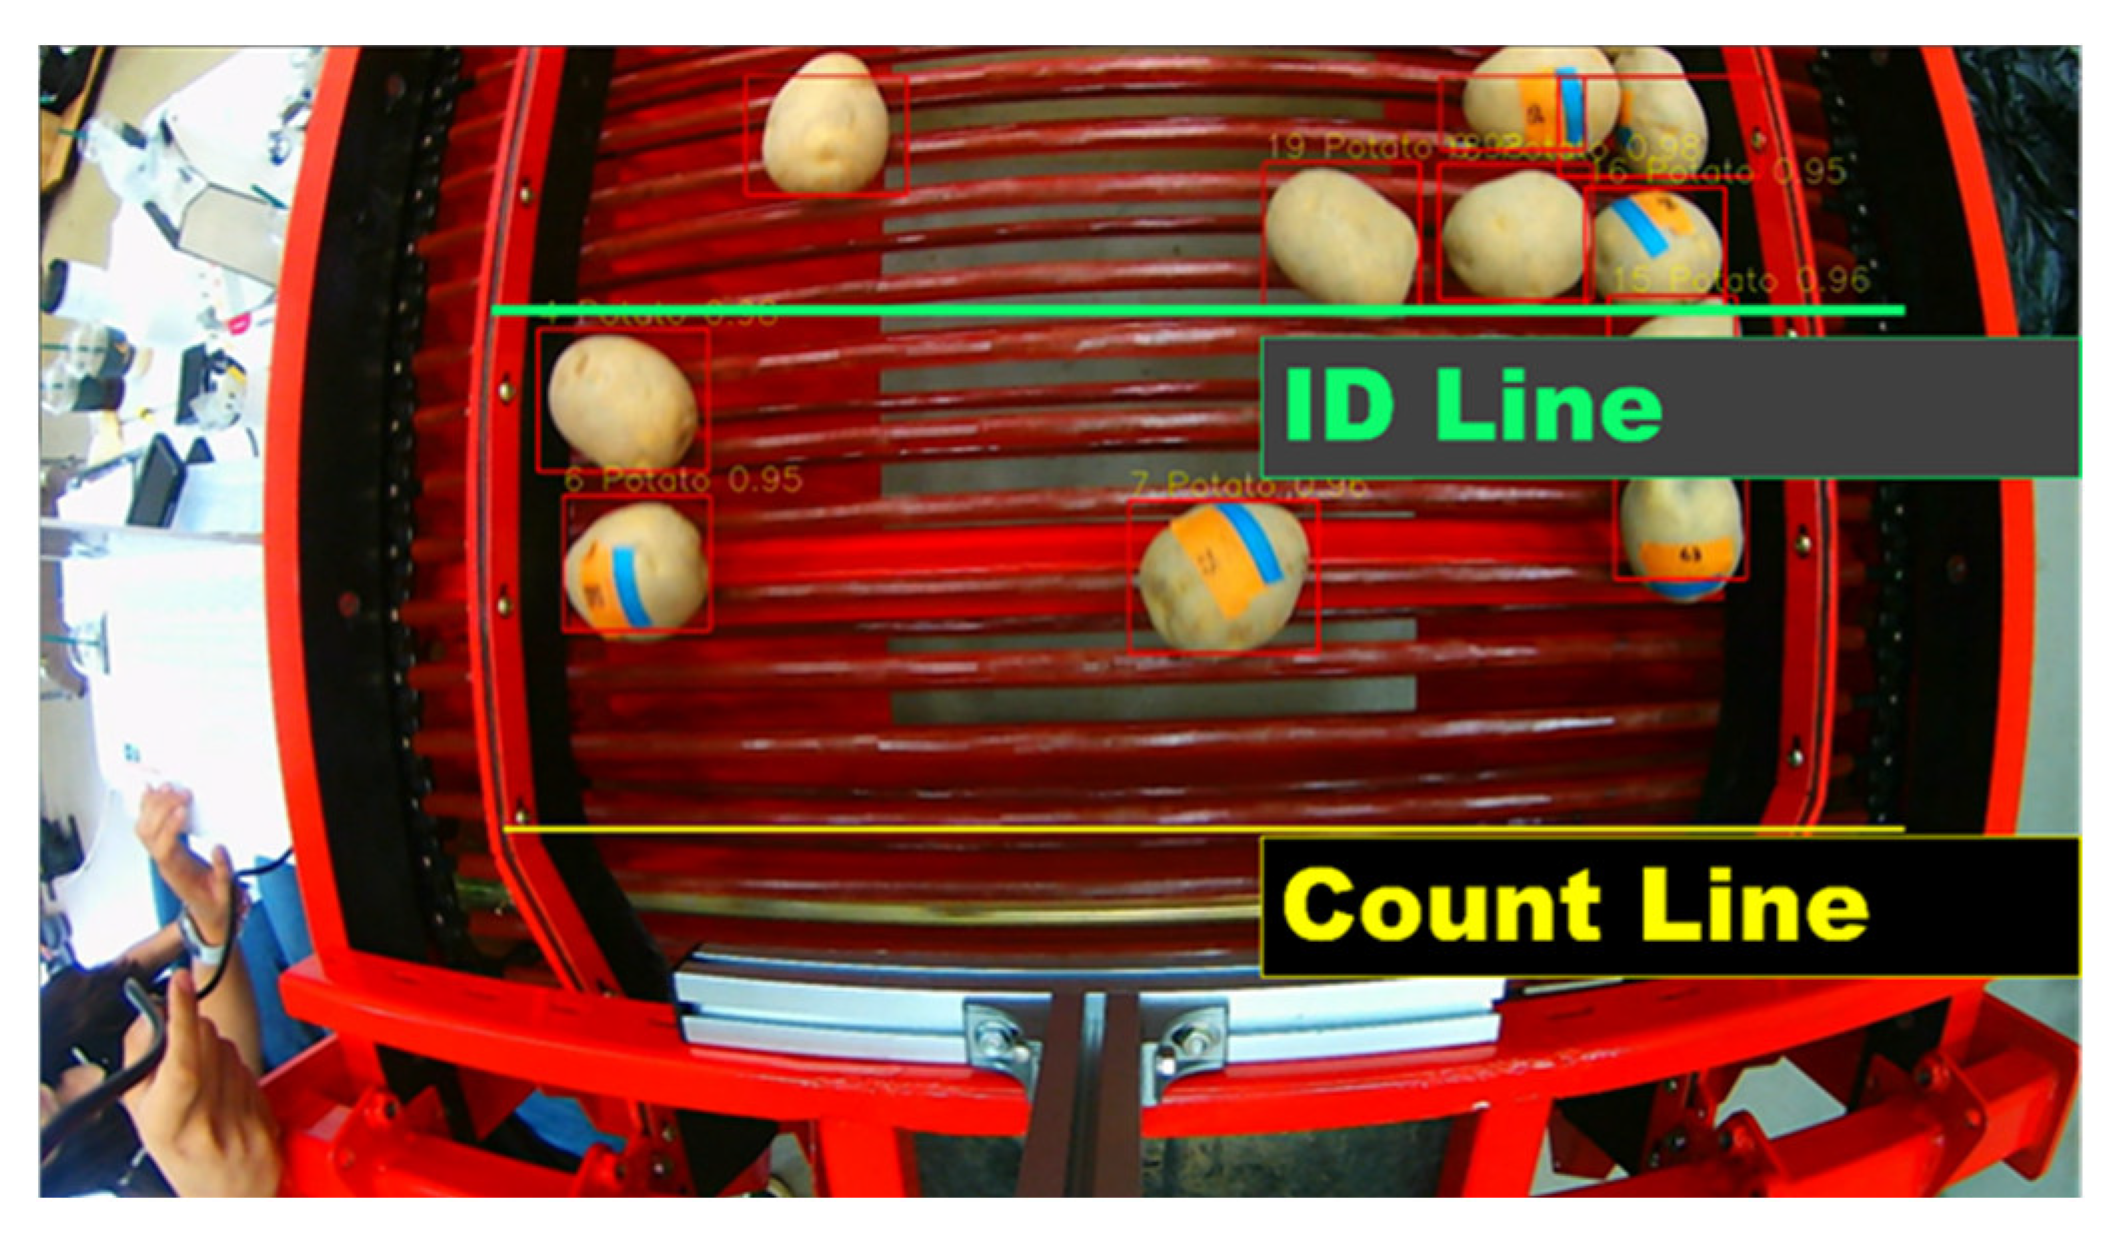
The potatoes that are dug using a harvester go through the conveying unit and the sorting unit and are finally put into a ton bag attached to the collection unit. The sorting unit, in which a camera is installed, contains foreign substances such as soil, stems, stones, etc., in addition to potatoes. Therefore, potatoes must be sorted out from the foreign substances to determine the accurate yield.
In the present study, YOLOv5, one of the deep learning algorithms, is used to classify potatoes and foreign substances. In essence, YOLO divides the image into n × n grids, estimates the bounding box and confidence score of each grid, and then adjusts the position of the bounding box by performing NMS (non-maximum suppression) in the process of merging each grid before finally performing object classification [16]. The YOLOv5 algorithm is divided into several models depending on the network size and image size and, in the present study, the YOLOv5n model—which has a relatively lower classification accuracy but shows a high processing speed—is used while taking into account the sizes of the potatoes in the harvester, conveying speed, and the load of image processing and follow-up works applied to the computer. In this study, the model was developed using 227,838 images (original 9906 and augmentation 217,932) labeled (potatoes, stems, soil, and others) using PyTorch, and the batch-size and epoch were set to 64,300, respectively.

2.1.3. Tracking

To accurately estimate the mass of potatoes in a field, it is necessary to accurately determine the number of potatoes entering into the collection unit. Representative object tracking algorithms include the SORT algorithm, which is a method that uses the Kalman Filter and the Hungarian algorithm. The SORT algorithm tracks the positions of objects based on their locational information; it has a disadvantage in that its accuracy is low although its calculation speed is fast. In the present study, to make up for such a drawback, the DeepSORT algorithm, which has an enhanced accuracy due to the addition of a CNN to the existing SORT, is used. Although the DeepSORT algorithm is very similar to the SORT algorithm, it can improve the object estimation accuracy by going through a process of calculating the cosine distance using the objects’ feature vectors of the previous frame and the next frame and adding the Mahalanobis distance value and cosine distance value of two frames to judge the sameness within the frames [20,21,22].
An ID line (I.L.) and a count line (C.L.) are designated at the middle and end points of the collection unit in the image, respectively, as shown in Figure 4, and the system is configured such that an ID is assigned when each object passes through the I.L., and counting is done when a potato, to which an ID is assigned, passes through the C.L. At this time, a cumulative method is used lest no same ID should be assigned to different potatoes [18].

2.2. Mass Estimation Equation

In the present study, we intend to calculate potato mass after first estimating the volume of potatoes for the estimation of potato mass using the regression equation. Accordingly, the length of the major axis, the length of the minor axis, and the volume were examined to develop a potato volume estimation model, and the density was examined to estimate the mass from the volume.
The samples used for the examination were Superior, Atlantic, and Jopung, which are the three varieties that are most widely cultivated in Korea. In total, 240 samples—80 of each variety—were examined by selecting twenty samples from each of the four groups of each variety, of which the masses were 100 g or less, 100 to 150 g, 150 to 200 g, and 200 g or more. In the present study, potato mass is estimated using real-time images of potatoes that are conveyed during harvest. Since each potato can be assumed to have an oval figure [23], the lengths of the major axis and minor axis in the acquired image vary depending on the direction in which the conveyed potato is laid. Accordingly, the major axis length and minor axis length of each sample are examined from the front and the side of the potato, respectively, as shown in Figure 5.
Potato volume is measured using the seed replacement method by filling a beaker with millet seeds, emptying the seeds and keeping them separate, placing a potato in the beaker, filling the empty space of the beaker with the seeds, and finally measuring the volume of the remaining seeds [24]. The mass of the potato is measured using a scale (WZ-3A, CAS, Korea). The methods used to measure the volumes and masses of the potatoes are shown in Figure 6.
The density of the potato is calculated using the ratio of the measured volume and mass (1).
ρ = m V
where ρ = density of potatoes, kg m−3, m = mass of potatoes, kg, and V = volume of potatoes, m3.
To estimate the volume of the potato using the measured lengths of the major axis and the minor axis, the data obtained by examining the lengths of the major axis and the minor axis from the front and the side are mixed together utilizing the statistical analysis software SAS 9.4 (SAS Institute Inc., Cary, NC, USA) and is used as an independent variable, while the volume is used as a dependent variable. A linear regression analysis is carried out for each of the three varieties, and a linear regression analysis is carried out by summing up the values obtained by measuring the three varieties.

2.3. Potato Mass Estimation System Performance Analysis

The objective of the potato mass estimation system developed in the present study is to estimate the mass of potatoes in real time using deep learning technology and a camera. To evaluate the estimation accuracy of the developed system, 200 potatoes are randomly selected from four groups (100 g or less, 100 to 150 g, 150 to 200 g, and 200 g or more) to measure their actual weights and sequentially put into the system to comparatively analyze them using the calculated estimates. Moreover, to evaluate the potato object detection rate of the system and the total mass error considering the actual harvest work, randomly selected potato objects are put in the conveyor with a rate of three potato objects per second. The test is repeated three times to improve the data reliability; in each test, 400 potato objects are put. At this time, the potato variety used for the test is superior.

3. Results and Discussion

3.1. Implement Results of Potato Mass Estimation System

The potato mass estimation system developed in the present study is implemented in C# language. The program is largely comprised of a main area, a sub-area, and a toolbar at the top, as shown in Figure 7. The main area is comprised of an image part (Figure 7a) where images can be identified in real time, and a recording part (Figure 7b), in which the work details are recorded in a table. The sub-area is divided into a real-time work area, a graph area, and a location information area. The real-time work area is configured to display the count and weight of the harvested potatoes per second and the cumulative count and mass in real time, the graph area is used to display the cumulative potato weight, and the location information area is designed to display the latitude, longitude, and time.
The camera calibration process that is carried out first before using the potato mass estimation system is configured to be carried out in a separate window using the button within the toolbar, as shown in Figure 8. The calibration window is largely comprised of a viewing area, a parameter input area, a calibration process area, a pixel calculation area, and an ROI (region of interest) setting area and it carries out distortion correction and then the matching of the pixel and the actual length after the parameter of the checkerboard is entered. Lastly, the system is configured such that the area in which the actual work is carried out is designated through the ROI setting area to reduce the computation load applied to the computer, and the final counting line is designated to adjust the point where the potato objects are counted. The calibration result is as shown in Figure 9.
After the camera calibration process has been carried out, potato detection, tracking, and counting works are sequentially carried out using the detection start button in the toolbar area. The lengths of the major axis and the minor axis are calculated using the bounding box of the counted object, while the volume of the potato is calculated by applying the regression equation analyzed in Section 3.2.2. Then, the mass of the potato is estimated by multiplying the calculated volume and the density, and the result is finally recorded in the table along with the locational information. Figure 10 shows the operation screen of the potato mass estimation system developed in the present study.

3.2. Mass Estimation Equation

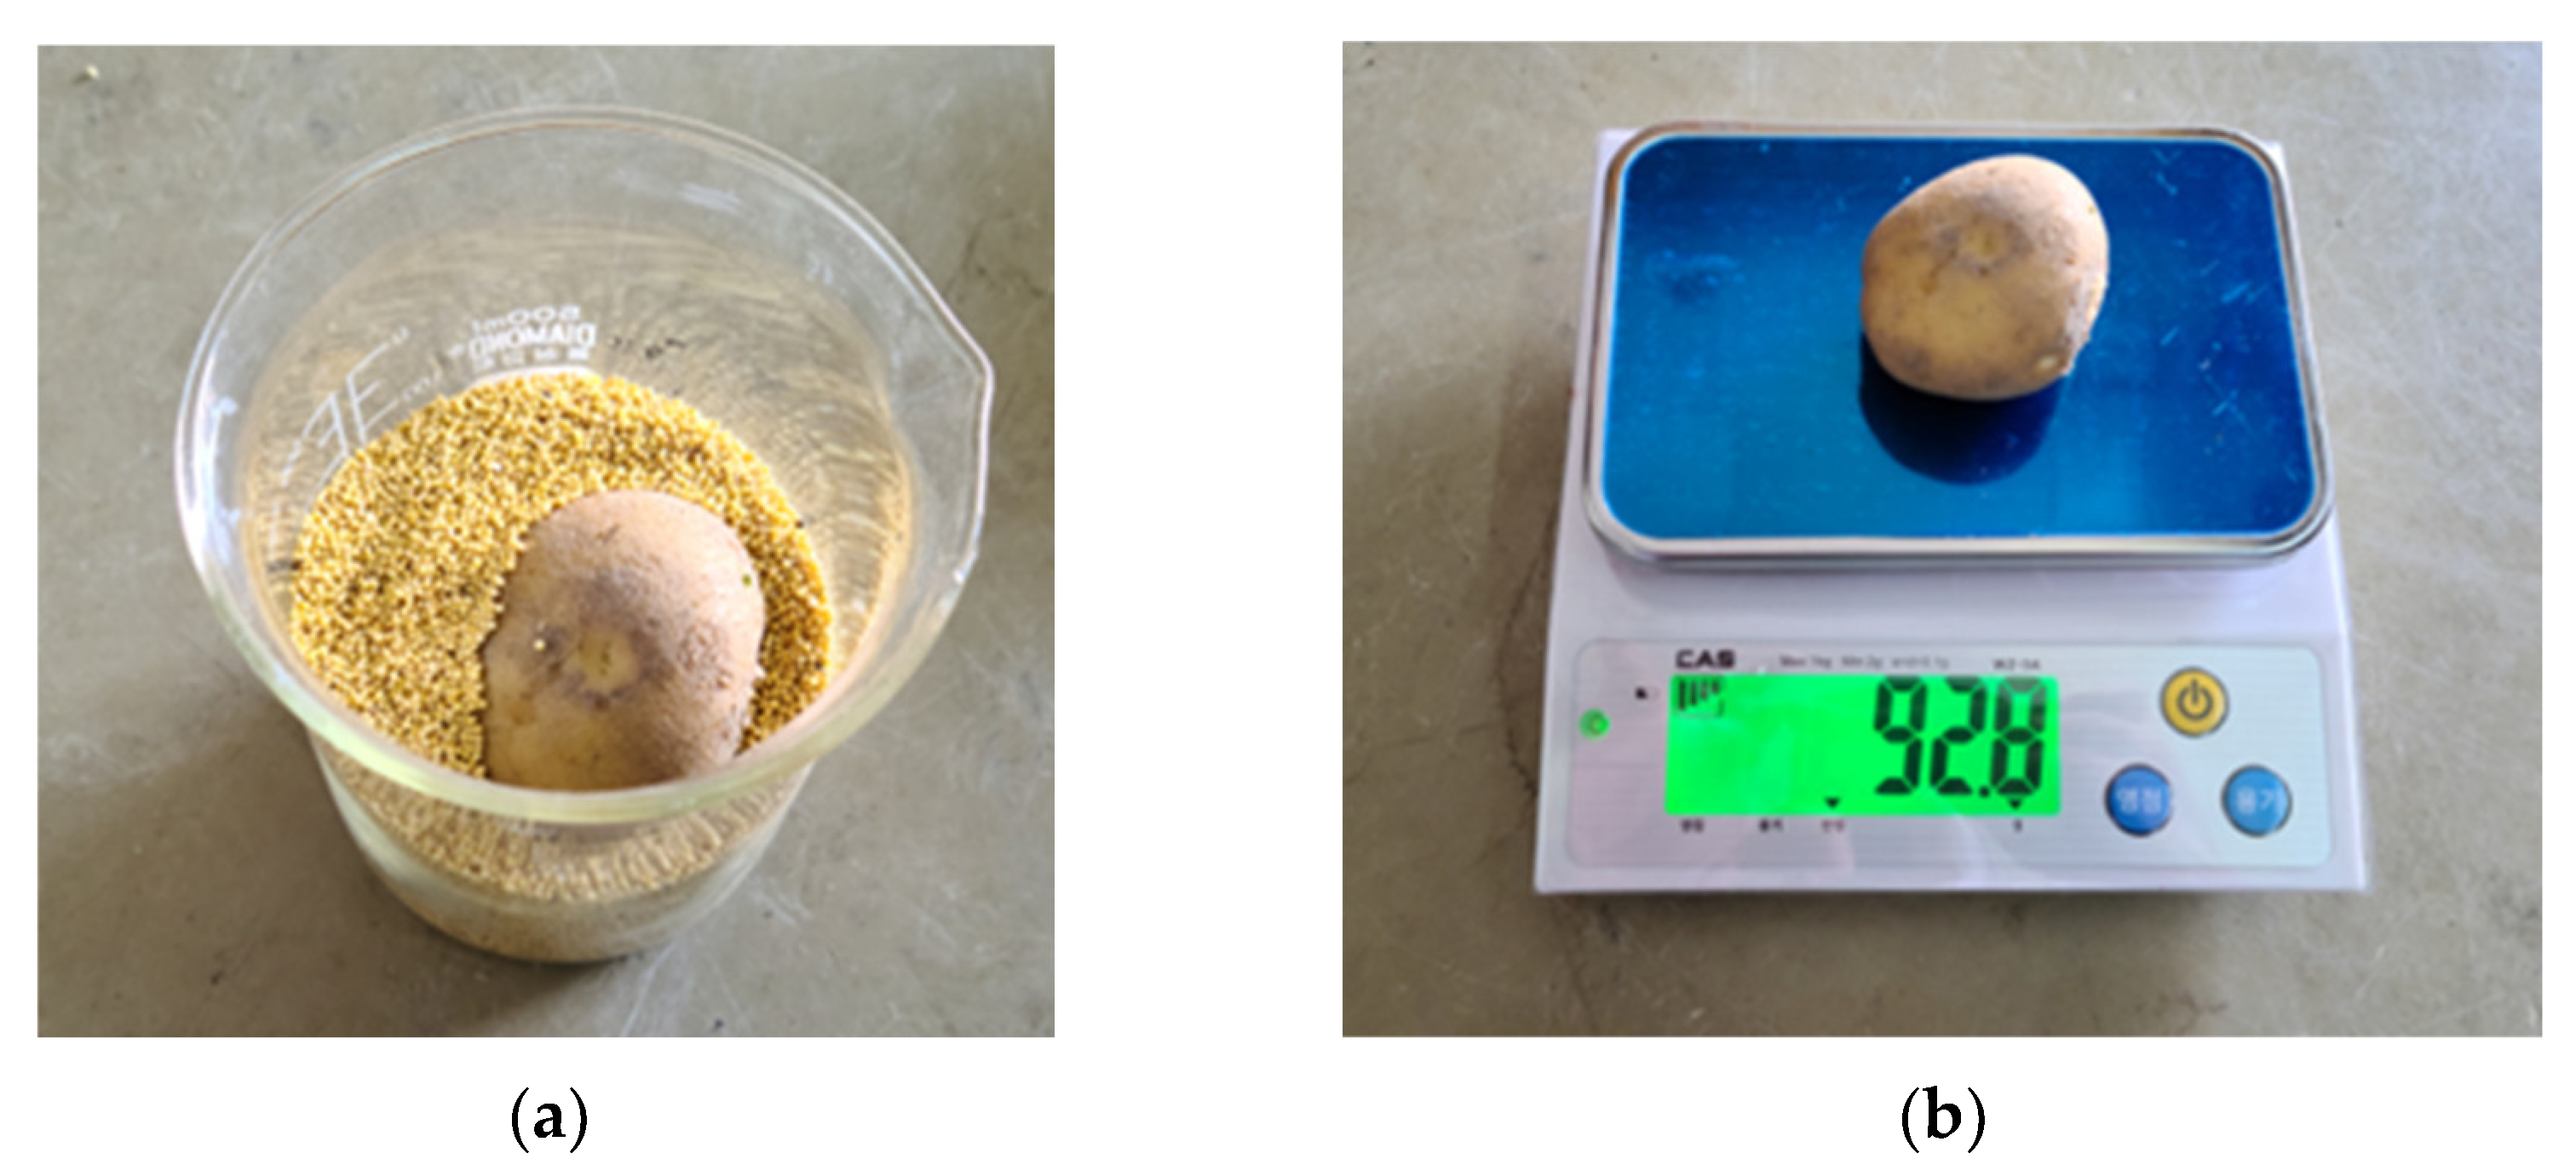
3.2.1. Physical Properties of Potatoes

Table 2 shows the result of examining the major axis length, minor axis length, volume, mass, and density of the potatoes of the three varieties of Superior, Atlantic, and Jopung. As a result of measuring the major axis length and minor axis length of potatoes from the front and the side, the minor axis length showed differences ranging from 10 to 15 mm depending on the direction of the examination. Accordingly, it is judged that the direction of the potato in the acquired image will substantially affect the estimation of the potato mass, and that there will be a need for a volume estimation model that takes this into account. The densities of the three varieties of Superior, Atlantic, and Jopung were found to be 1085.3 kg m−3, 1080.7 kg m−3, and 1043.9 kg m−3, respectively, showing no substantial differences between the varieties.

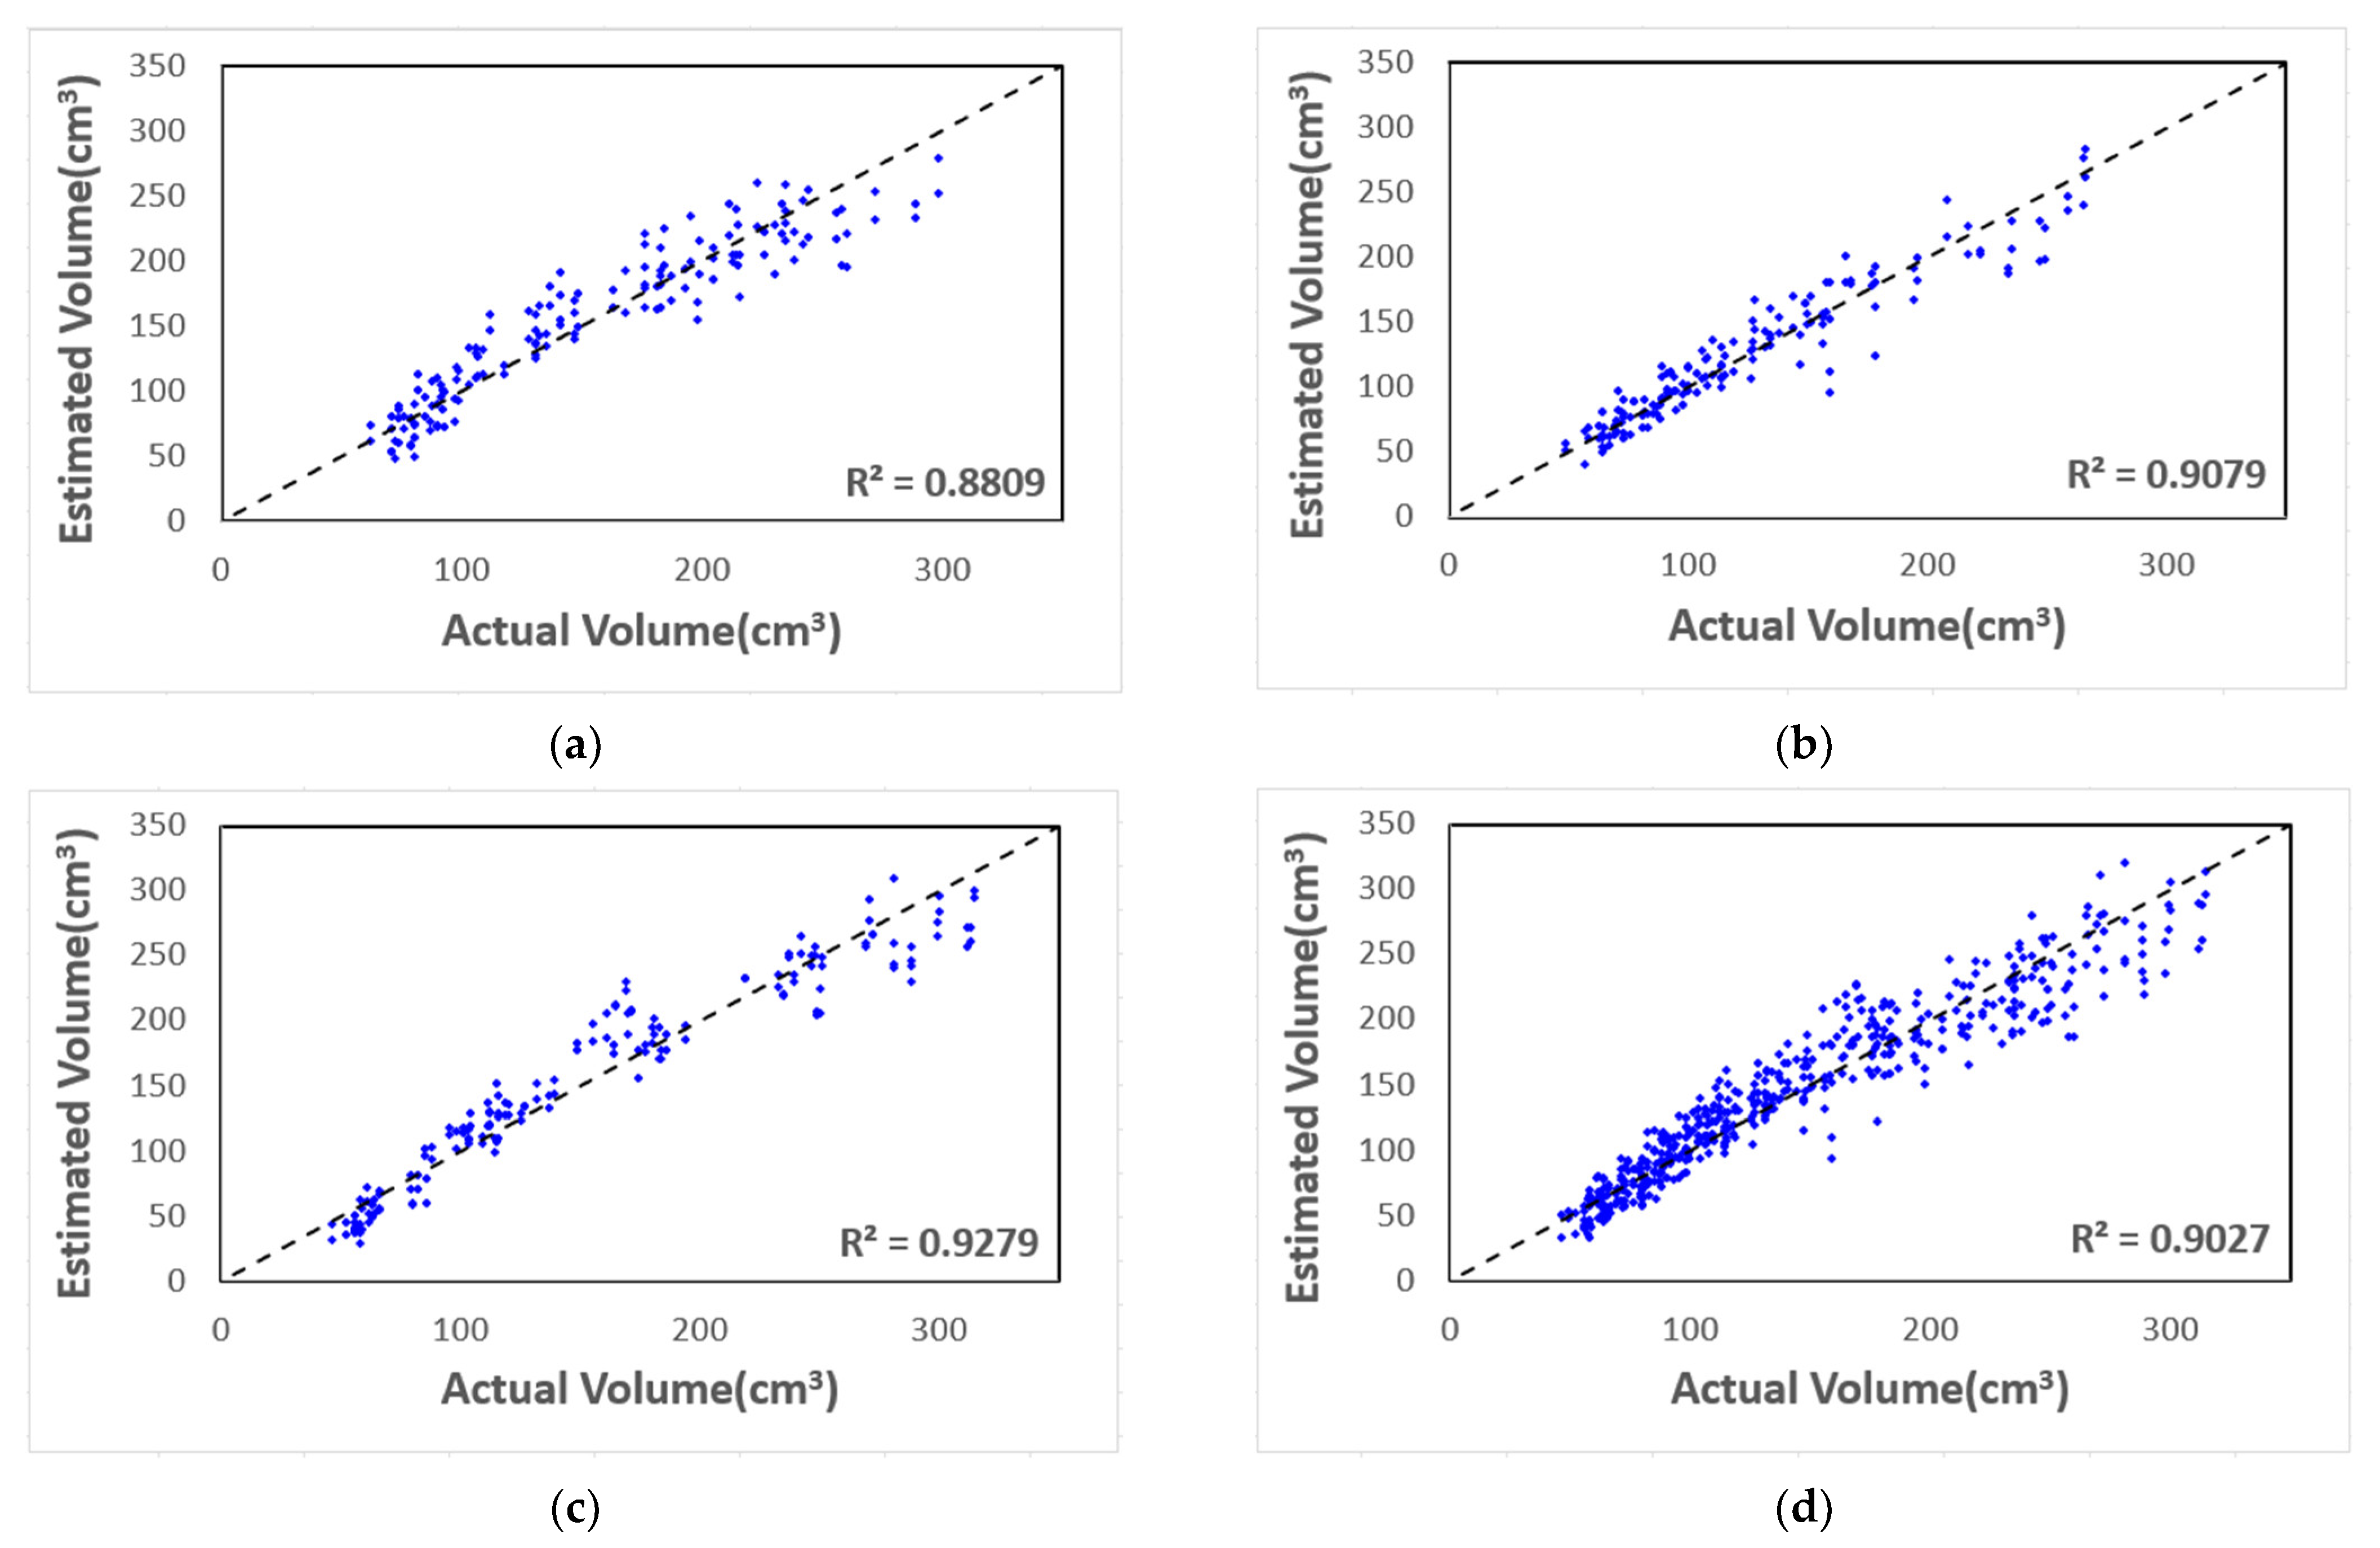
3.2.2. Volume Estimation Equation

As a result of carrying out a linear regression analysis using the major axis length and the minor axis length as independent variables and the volume as a dependent variable, the root mean square errors (RMSEs) of Superior, Atlantic, and Jopung were found to be 22.11 cm3, 17.15 cm3, and 21.66 cm3, respectively, and the determination coefficient (R2) values were found to be 0.88, 0.90, and 0.92, respectively. As a result of carrying out a regression analysis using the data obtained by summing up the values of the three varieties, RMSE was found to be 21.50 cm3, whereas the determination coefficient was 0.90 (Table 3). Accordingly, since the major axis length and the minor axis length showed a high correlation in all the varieties examined (Figure 11), it was judged that the potato volume could be estimated using the major axis and minor axis lengths. Further, since the regression model created by mixing all three varieties also showed a high correlation, such as the regression model by variety, it was judged that a result similar to the case of using a regression model of each variety could be obtained.

3.2.3. Result of Mass Estimation

Table 4 presents the result of estimating the mass using the average density value of each variety after calculating the volume using the volume estimation model. Jopung showed the lowest RMSD of 20.48 g and the lowest average error of 12.67%. The varieties of Superior and Atlantic showed average errors of 14.9% and 14.23%, respectively, which were similar to each other, and the average error of the model created by mixing all the varieties together was found to be 14.03%. Accordingly, in configuring the system, it was judged to be advantageous to use the volume estimation model and density values of mixing all varieties together rather than using a separate estimation model for each variety.

3.3. Performance Analysis Result of Potato Mass Estimation System

The result of comparing the actual and estimated values of potatoes for the performance evaluation of the potato mass estimation system developed in the present study is shown in Figure 12. As a result of comparing the actual mass and the estimated mass of 200 potatoes, R2, which represents the explanatory power of the model applied in the system, was found to be 0.90. The RMSE (root mean square error), which is one of the indicators that show the mass error of each object, was analyzed to be 26.59 g. The errors in the individual potato mass were found to be 13.09% on average, 0.03% at minimum, and 55.43% at maximum.
The result of putting in potatoes at a speed of three potatoes per second, taking into account the actual harvesting speed, is presented in Table 5. The total weight of the potatoes actually put in was 60.20 kg, 380.66 potatoes were detected on average as a result of making three measurements, and the error in the total mass estimation was found to be 9.0%. The reason why the detection rate was not 100% when three potatoes were put in per second was presumed to be because several potatoes were detected by the system at the same time, and an instantaneous frame drop occurred due to an increase in the computation load as a result of the calculation. To solve this phenomenon, the computation performance needs to be enhanced by improving the performance of the computer currently in use, and the location of the C.L. at the bottom needs to be readjusted to widen the detection area, thus preventing the frame drop phenomenon.

4. Conclusions

(1)
A system was developed that carries out potato object tracking and counting by applying YOLOv5, one of the deep learning algorithms, and DeepSORT, one of the object tracking algorithms, to the real-time image obtained by a camera installed on top of the potato harvester sorting unit, and this system estimates the mass of a detected potato by calculating its volume using the major axis and minor axis lengths of its bounding box and then multiplying this by the density.
(2)
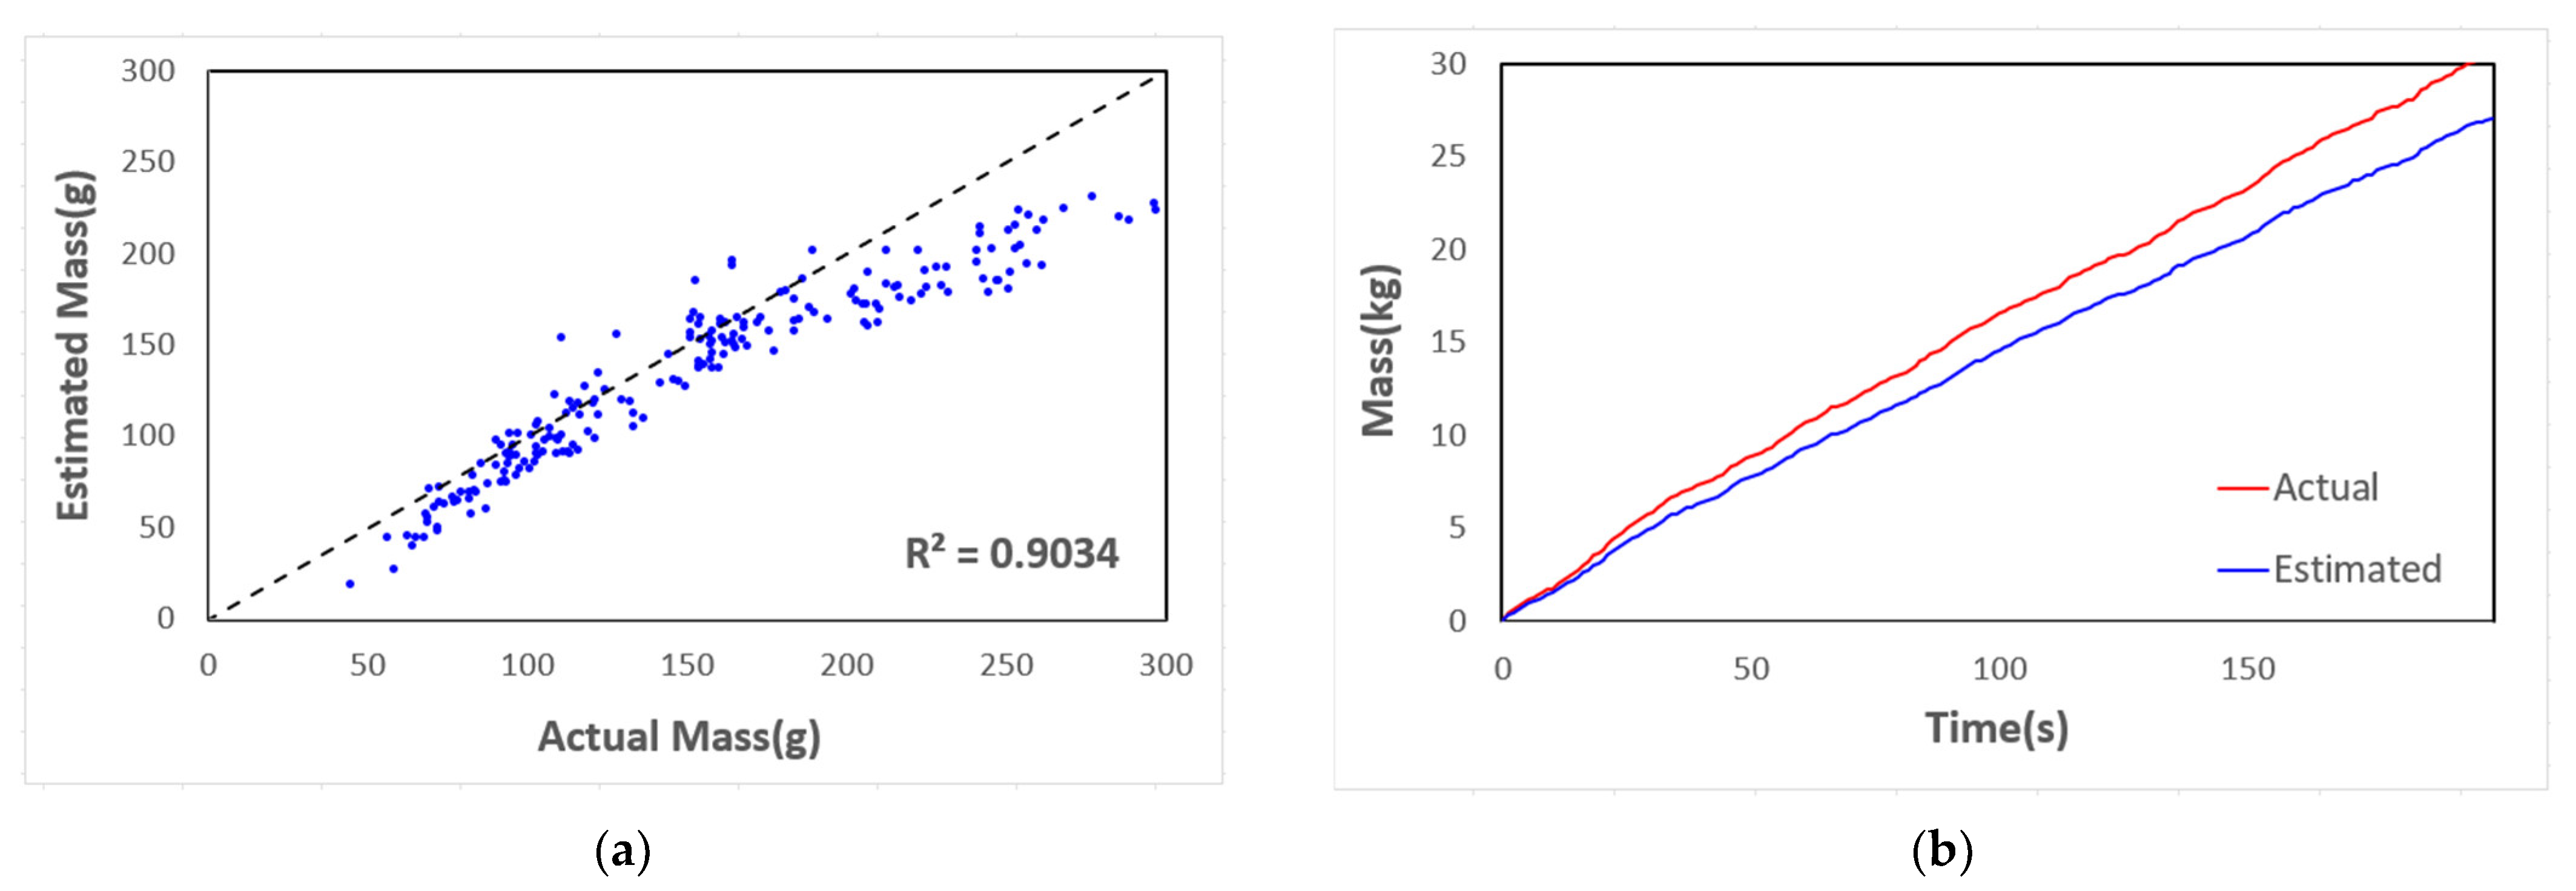
As a result of estimating the mass of individual potatoes using the developed system, R2 was 0.9034 and the average error was found to be 13.09%. As a result of continuously putting in potatoes to match the actual harvesting speed, the potato object detection rate was found to be 95.2%, whereas the error of the total measured mass was 9%.
(3)
To improve the accuracy and reduce the error, a weighted value needs to be applied to the location of potato within the view angle of the camera. It is also necessary to improve the performance of the computer, and the phenomenon wherein potatoes are not counted due to frame drop must be prevented by widening the counting range to reduce the computation load. To reduce the error of the system, a regression model is required to be improved by dividing a dataset into calibration and validation.
(4)
The potato mass estimation system examined in the present study was developed and evaluated in a laboratory environment. The result of the evaluation indicates that the performance of the system and the algorithm used need to be improved. An additional study needs to be carried out in the future to apply an optimum algorithm and improve the problems found by conducting an actual field test, such as noise filtering caused by the vibration of the harvester and optimization of the integration time to improve the accuracy according to sunlight exposure.
(5)
An additional study needs to be carried out for the visualization of yield information within a lot by combining the yield information from the system and collecting GPS information to prepare a yield map, and it is judged that the yield monitoring of other underground crops such as onion would be possible by applying the same system used in the present study.

Author Contributions

Software, writing—original draft preparation, S.-H.J.; performed experiments and analysis, S.-P.M. and Y.-J.K.; writing—review and editing, S.-H.L. All authors have read and agreed to the published version of the manuscript.

Funding

This research was funded by Korea Rural Development Administration (RDA), research number PJ01569501.

Institutional Review Board Statement

Not applicable.

Informed Consent Statement

Not applicable.

Data Availability Statement

Data is contained within the article.

Conflicts of Interest

The authors declare no conflict of interest.

References

  1. Food and Agriculture Organization of the United Nations (FAO), Crops and Livestock Products. Available online: https://www.fao.org/ (accessed on 25 September 2022).
  2. Korea Statistical Information Service (KOSIS), Potatoes Production (Field). Available online: https://kosis.kr/ (accessed on 25 September 2022).
  3. Choi, M.K. An analysis for the changing trends of residential environment based on the change of residents in rural areas. J. Korean Inst. Rural. Archit. 2012, 14, 9–16. [Google Scholar]
  4. Bongiovanni, R.; Lowenberg-DeBoer, J. Precision agriculture and sustainability. Precis. Agric. 2004, 5, 359–387. [Google Scholar] [CrossRef]
  5. Linsley, C.M.; Bauer, F.C. Test Your Soil for Acidity; Circular, No. 346; University of Illinois, Agricultural Experiment Station: Urbana, IL, USA, 1929. [Google Scholar]
  6. Usery, E.L.; Pocknee, S.; Boydell, B. Precision farming data management using geographic information systems. Photogramm. Eng. Remote Sens. 1995, 61, 1383–1392. [Google Scholar]
  7. Chosa, T. Investigation of the deviation of the yield in a direct sowing paddy field. Jpn. J. Farm Work. Res. 1998, 33, 27–28. [Google Scholar]
  8. Kobayashi, T. Prototype yield monitoring combines (head feeding type). Jpn. J. Farm Work. Res. 1998, 33, 29–30. [Google Scholar]
  9. Reyns, P.; Missotten, B.; Ramon, H.; De Baerdemaeker, J. A review of combine sensors for precision farming. Precis. Agric. 2002, 3, 169–182. [Google Scholar] [CrossRef]
  10. Chinchuluun, R.; Lee, W. Machine vision-based citrus yield mapping system. In Proceedings of the Florida State Horticultural Society, Portland, OR, USA, 9–12 July 2006; pp. 142–147. [Google Scholar]
  11. Persson, D.; Eklundh, L.; Algerbo, P.-A. Evaluation of an optical sensor for tuber yield monitoring. Trans. ASAE 2004, 47, 1851. [Google Scholar] [CrossRef]
  12. Lee, Y.J. Development of Potato Yield Monitoring System Using Machine Vision. Master’s Thesis, Kangwon National University, Chuncheon-si, Republic of Korea, 2019. [Google Scholar]
  13. Larsson, K. Bildbehandlingsteknik för Sortering av Potatis; Jordbrukstekniska Institutet: Uppsala, Sweden, 1994. [Google Scholar]
  14. Hofstee, J.; Molema, G. Machine vision based yield mapping of potatoes. In Proceedings of the 2002 ASAE Annual Meeting, Chicago, IL, USA, 28–31 July 2002; p. 1. [Google Scholar]
  15. Long, Y.; Wang, Y.; Zhai, Z.; Wu, L.; Li, M.; Sun, H.; Su, Q. Potato volume measurement based on RGB-D camera. IFAC-Pap. 2018, 51, 515–520. [Google Scholar] [CrossRef]
  16. Redmon, J.; Divvala, S.; Girshick, R.; Farhadi, A. You only look once: Unified, real-time object detection. In Proceedings of the IEEE Conference on Computer Vision and Pattern Recognition, San Juan, PR, USA, 17–19 June 1997; pp. 779–788. [Google Scholar]
  17. Adarsh, P.; Rathi, P.; Kumar, M. YOLO v3-Tiny: Object Detection and Recognition using one stage improved model. In Proceedings of the 2020 6th International Conference on Advanced Computing and Communication Systems (ICACCS), Coimbatore, India, 6–7 March 2020; pp. 687–694. [Google Scholar]
  18. Jang, S.H.; Lee, S.H.; Choi, Y.; Kim, T.H.; Shin, S.Y. Design of a potato yield monitoring system using deep-learning. J. Korea Acad. Ind. 2022, 23, 217–224. [Google Scholar]
  19. Zhang, Z. A flexible new technique for camera calibration. IEEE Trans. Pattern Anal. Mach. Intell. 2000, 22, 1330–1334. [Google Scholar] [CrossRef] [Green Version]
  20. Bewley, A.; Ge, Z.; Ott, L.; Ramos, F.; Upcroft, B. Simple online and realtime tracking. In Proceedings of the 2016 IEEE International Conference on Image Processing (ICIP), Phoenix, AZ, USA, 25–28 September 2016; pp. 3464–3468. [Google Scholar]
  21. Wojke, N.; Bewley, A.; Paulus, D. Simple online and realtime tracking with a deep association metric. In Proceedings of the 2017 IEEE International Conference on Image Processing (ICIP), Beijing, China, 17–20 September 2017; pp. 3645–3649. [Google Scholar]
  22. Yang, S.; Jung, I.; Kang, D.; Baek, H. Real-time multi-object tracking using mixture of SORT and DeepSORT. J. Korean Inst. Inf. Technol. 2021, 19, 1–9. [Google Scholar]
  23. Pitts, M.J.; Hyde, G.M.; Cavalieri, R.P. Modeling potato tuber mass with tuber dimensions. Trans. ASAE 1987, 30, 1154–1159. [Google Scholar] [CrossRef]
  24. Pyler, E. Physical and chemical test methods. Bak. Sci. Technol. 1979, 2, 891–895. [Google Scholar]
Figure 1. Sorting unit of potato harvester.
Applsci 13 02614 g001
Figure 2. Schematic diagram of potato mass estimation system.
Applsci 13 02614 g002
Figure 3. Checkerboard images for camera distortion calibration.
Applsci 13 02614 g003
Figure 4. Baseline for potato tracking.
Applsci 13 02614 g004
Figure 5. Measurement of major and minor axis lengths: (a) top view; (b) side view.
Applsci 13 02614 g005
Figure 6. Measurement of the volume and mass of a potato: (a) volume; (b) mass.
Applsci 13 02614 g006
Figure 7. Potato mass estimation system: (a) imaging part; (b) recording part.
Applsci 13 02614 g007
Figure 8. Camera calibration window: (a) viewing area; (b) parameter input area; (c) calibration process area; (d) pixel calculation area; (e) region of interest (ROI) setting area.
Applsci 13 02614 g008
Figure 9. Results before (a) and after (b) correction of fisheye distortion in the camera.
Applsci 13 02614 g009
Figure 10. Operation screen of the potato mass estimation system.
Applsci 13 02614 g010
Figure 11. Volume estimation model linearity of each potato variety: (a) Superior; (b) Atlantic; (c) Jopung; (d) all varieties mixed together.
Applsci 13 02614 g011
Figure 12. Results of linearity (a) and cumulative mass (b) of the potato mass estimation system.
Applsci 13 02614 g012
Table 1. Specifications of RTK-GPS.
ItemsSpecification
Width × height × depth (mm)46.5 × 96.4 × 24
Power (W)5
Weight (g)98
Operation temperature (°C)−25~85
RTK accuracy0.010 m + 1 ppm CEP
RTK fix time (s)10~60
GNSS TTFF (s)Cold start: 25~28, aided start: 2
Input port I/FGNSS: MCx, DMB: SMA, LTE: MMCX
Output I/FRS232 Serial (D-sub 9 pin)
Output typeNMEA-0183
Table 2. Physical properties of different potato varieties.
VarietyPositionMajor Axis
(mm)
Minor Axis
(mm)
Volume
(cm3)
Mass
(g)
Density
(kg m−3)
SuperiorTop81.6 ± 12.971.2 ± 11.6154.5 ± 63.9164.3 ± 60.41085.3 ± 81.7
Side82.2 ± 13.158.9 ± 9.1
AtlanticTop75.4 ± 15.064.4 ± 10.0126.2 ± 56.3136.3 ± 61.51080.7 ± 68.7
Side76.2 ± 15.054.8 ± 7.9
JopungTop87.1 ± 20.970.6 ± 13.4157.9 ± 80.4166.1 ± 86.91043.9 ± 72.5
Side88.7 ± 22.155.9 ± 9.5
Table 3. Result of regression analysis for the major and minor axis lengths and the volume of each potato variety.
VarietyRMSE (cm3)R2
Superior22.110.88
Atlantic17.150.90
Jopung21.660.92
Mixed21.500.90
Table 4. Deviation and errors between actual and estimated mass of each potato variety.
VarietyRMSD (g)Error (%)
Max.Min.Ave.
Superior23.3647.160.00114.90
Atlantic20.5348.070.06514.23
Jopung20.4851.220.10412.67
Mixed21.9249.140.01814.03
Table 5. Performance analysis of potato mass estimation system (when three potatoes per second are put into the system).
InputEstimationDetection RatioWeight Estimation Error
(ea)(kg)(ea)(kg)(%)(%)
40060.20380.6665.6295.29
Disclaimer/Publisher’s Note: The statements, opinions and data contained in all publications are solely those of the individual author(s) and contributor(s) and not of MDPI and/or the editor(s). MDPI and/or the editor(s) disclaim responsibility for any injury to people or property resulting from any ideas, methods, instructions or products referred to in the content.

