1. Introduction
Antennas provided with radomes and their influence on the radiated electromagnetic field were investigated as early as the 1980s [
1].
The antenna radome was originally intended as a form of physical protection of the antenna, connectors, cables, and all components of the antenna system against environmental influences. All these parts of such system can have a bad effect on the antenna reflection coefficients and, thus, affect the operation of the antenna at the desired wavelength. Several studies have been conducted that are focused on the antenna radome and its influence on the operation and parameters of antennas [
2,
3,
4,
5,
6,
7].
The authors in [
2] provide the design of a dielectric radome created to protect the antenna from environmental conditions via a series of conductors in the structure that enables a lower reflection coefficient of incident electromagnetic waves at the operating wavelength of the antenna.
A modified Paris’ model of a flat multi-layer radome structure (with anisotropic material) is presented in [
3], and it is combined with a measuring method for accurate determination of the dielectric constant and dielectric loss.
The study presented in [
4] reviews the design of antenna radomes (electrically thin, half-wave, A-sandwich, C-sandwich) and their influence on antenna parameters (RF reflection and insertion loss), and the authors conclude that a proper selection of the radome and its characteristics can help to improve the performance of the entire antenna system.
The quality and the impact of the dielectric-radome weather radar antenna are analyzed in [
5] from the radiation pattern point of view to verify the antenna and radome specifications of the new Hohenpeissenberg radar. Measurements obtained from three different source locations in the far field of the antenna show that all major parameters of the antenna (i.e., 3-dB beamwidth, beam squint, and sidelobe levels) are satisfied with and without the radome.
In article [
6], the author highlights a very important role of radar in air and sea communications, remote data reading, weather forecasting, and defense. The radome placed on the antenna serves several purposes. It protects the antenna and its constituent parts from external disturbances (such as snow, rain, wind, etc.), but research has shown that the exact choice of the material covering the antenna can significantly affect its properties and performance. The article explains the design and construction of the radome without compromising radar performance.
Another study [
7] also recommends radome types such as polycarbonate, Teflon, and polystyrene to maintain good antenna performance and a satisfactory reflection coefficient, i.e., materials with the lowest possible dielectric constant and tangent loss. This describes the medium through which electromagnetic waves propagate, their dielectric constants, their effects on impedance matching, the ideal distance of the radome from the antenna, and the results of the antenna radiation pattern when the antenna radome is properly selected.
Article [
8] deals with a similar topic in that the author describes in detail the properties and types of shield, the interaction with the antenna, the requirements for shielding, and the advantages of antenna shielding.
As can be seen from the above literature overview, covering antennas with a specific dielectric plays a very important role in the physical protection of antennas and radars and can even be used to improve antenna characteristics in the context of impedance matching, i.e., reflection coefficients [
9].
The authors in [
10] analyze the input admittance of a circular aperture antenna fed by a waveguide of a circular cross-section mounted on a spherical grounded surface. The analytical approach is based on the moment method in the spectral domain in the Fortran programming language. The aperture antenna is covered with a dielectric plate, and the changing of two parameters such as the thickness and permittivity of the radome has shown that it is possible to obtain rather good broadband admittance matching.
Similar research was carried out by the authors in [
11], but it involved an aperture antenna fed by a waveguide with a circular cross-section mounted on a grounded plane. Moreover, the opening of the antenna is covered with a dielectric plate, and the research results showed that by changing only two parameters of the dielectric, it is possible to influence the reduction in the reflection coefficient of the antenna in question. Software for numerical calculation of the reflection coefficient
S11 of an aperture antenna fed by a circular waveguide covered with a dielectric plate was Ansys HFSS (three-dimensional electromagnetic (EM) simulation software for the design and simulation of HF electronic element–antennas and antenna arrays). The theoretical and mathematical basis of the aforementioned software for solving problems in electromagnetism is the finite element method.
This article is a continuation of the research aimed at improving impedance matching of the aperture antenna and a detailed analysis of the structural and electromagnetic parameters of the dielectric plate placed on the antenna, [
10,
11,
12]. References [
10,
11,
12] analyze the influence of only two parameters (thickness and permittivity) of the dielectric on the admittance or reflection coefficient, whereas this article analyzes the influence of all parameters of the dielectric plate (thickness of the material d in mm, density of the dielectric ρ in kg·m
−3, relative permittivity ε
r, conductivity of the dielectric σ in S/m, losses in the dielectric tan δ and tan δ
μ, and relative permeability of the material µ
r), and finally, simulation is validated with measured values. The aim of the article is to achieve the lowest possible reflection coefficient of the circular aperture antenna in order to accomplish the best impedance matching of the antenna itself.
Further study [
13] considers polyurethane foams as dielectric materials in the construction of radomes. The study includes the following EM parameters of radomes: the relative dielectric constant and tangent loss at the frequencies ranging between 1 and 10 GHz.
The authors in [
14] deal with the influence of water on the electrical conductivity and dielectric parameters of a microwave absorber, clarifying the difference between losses due to electrical conductivity and dielectric losses in the dielectric material (polarization).
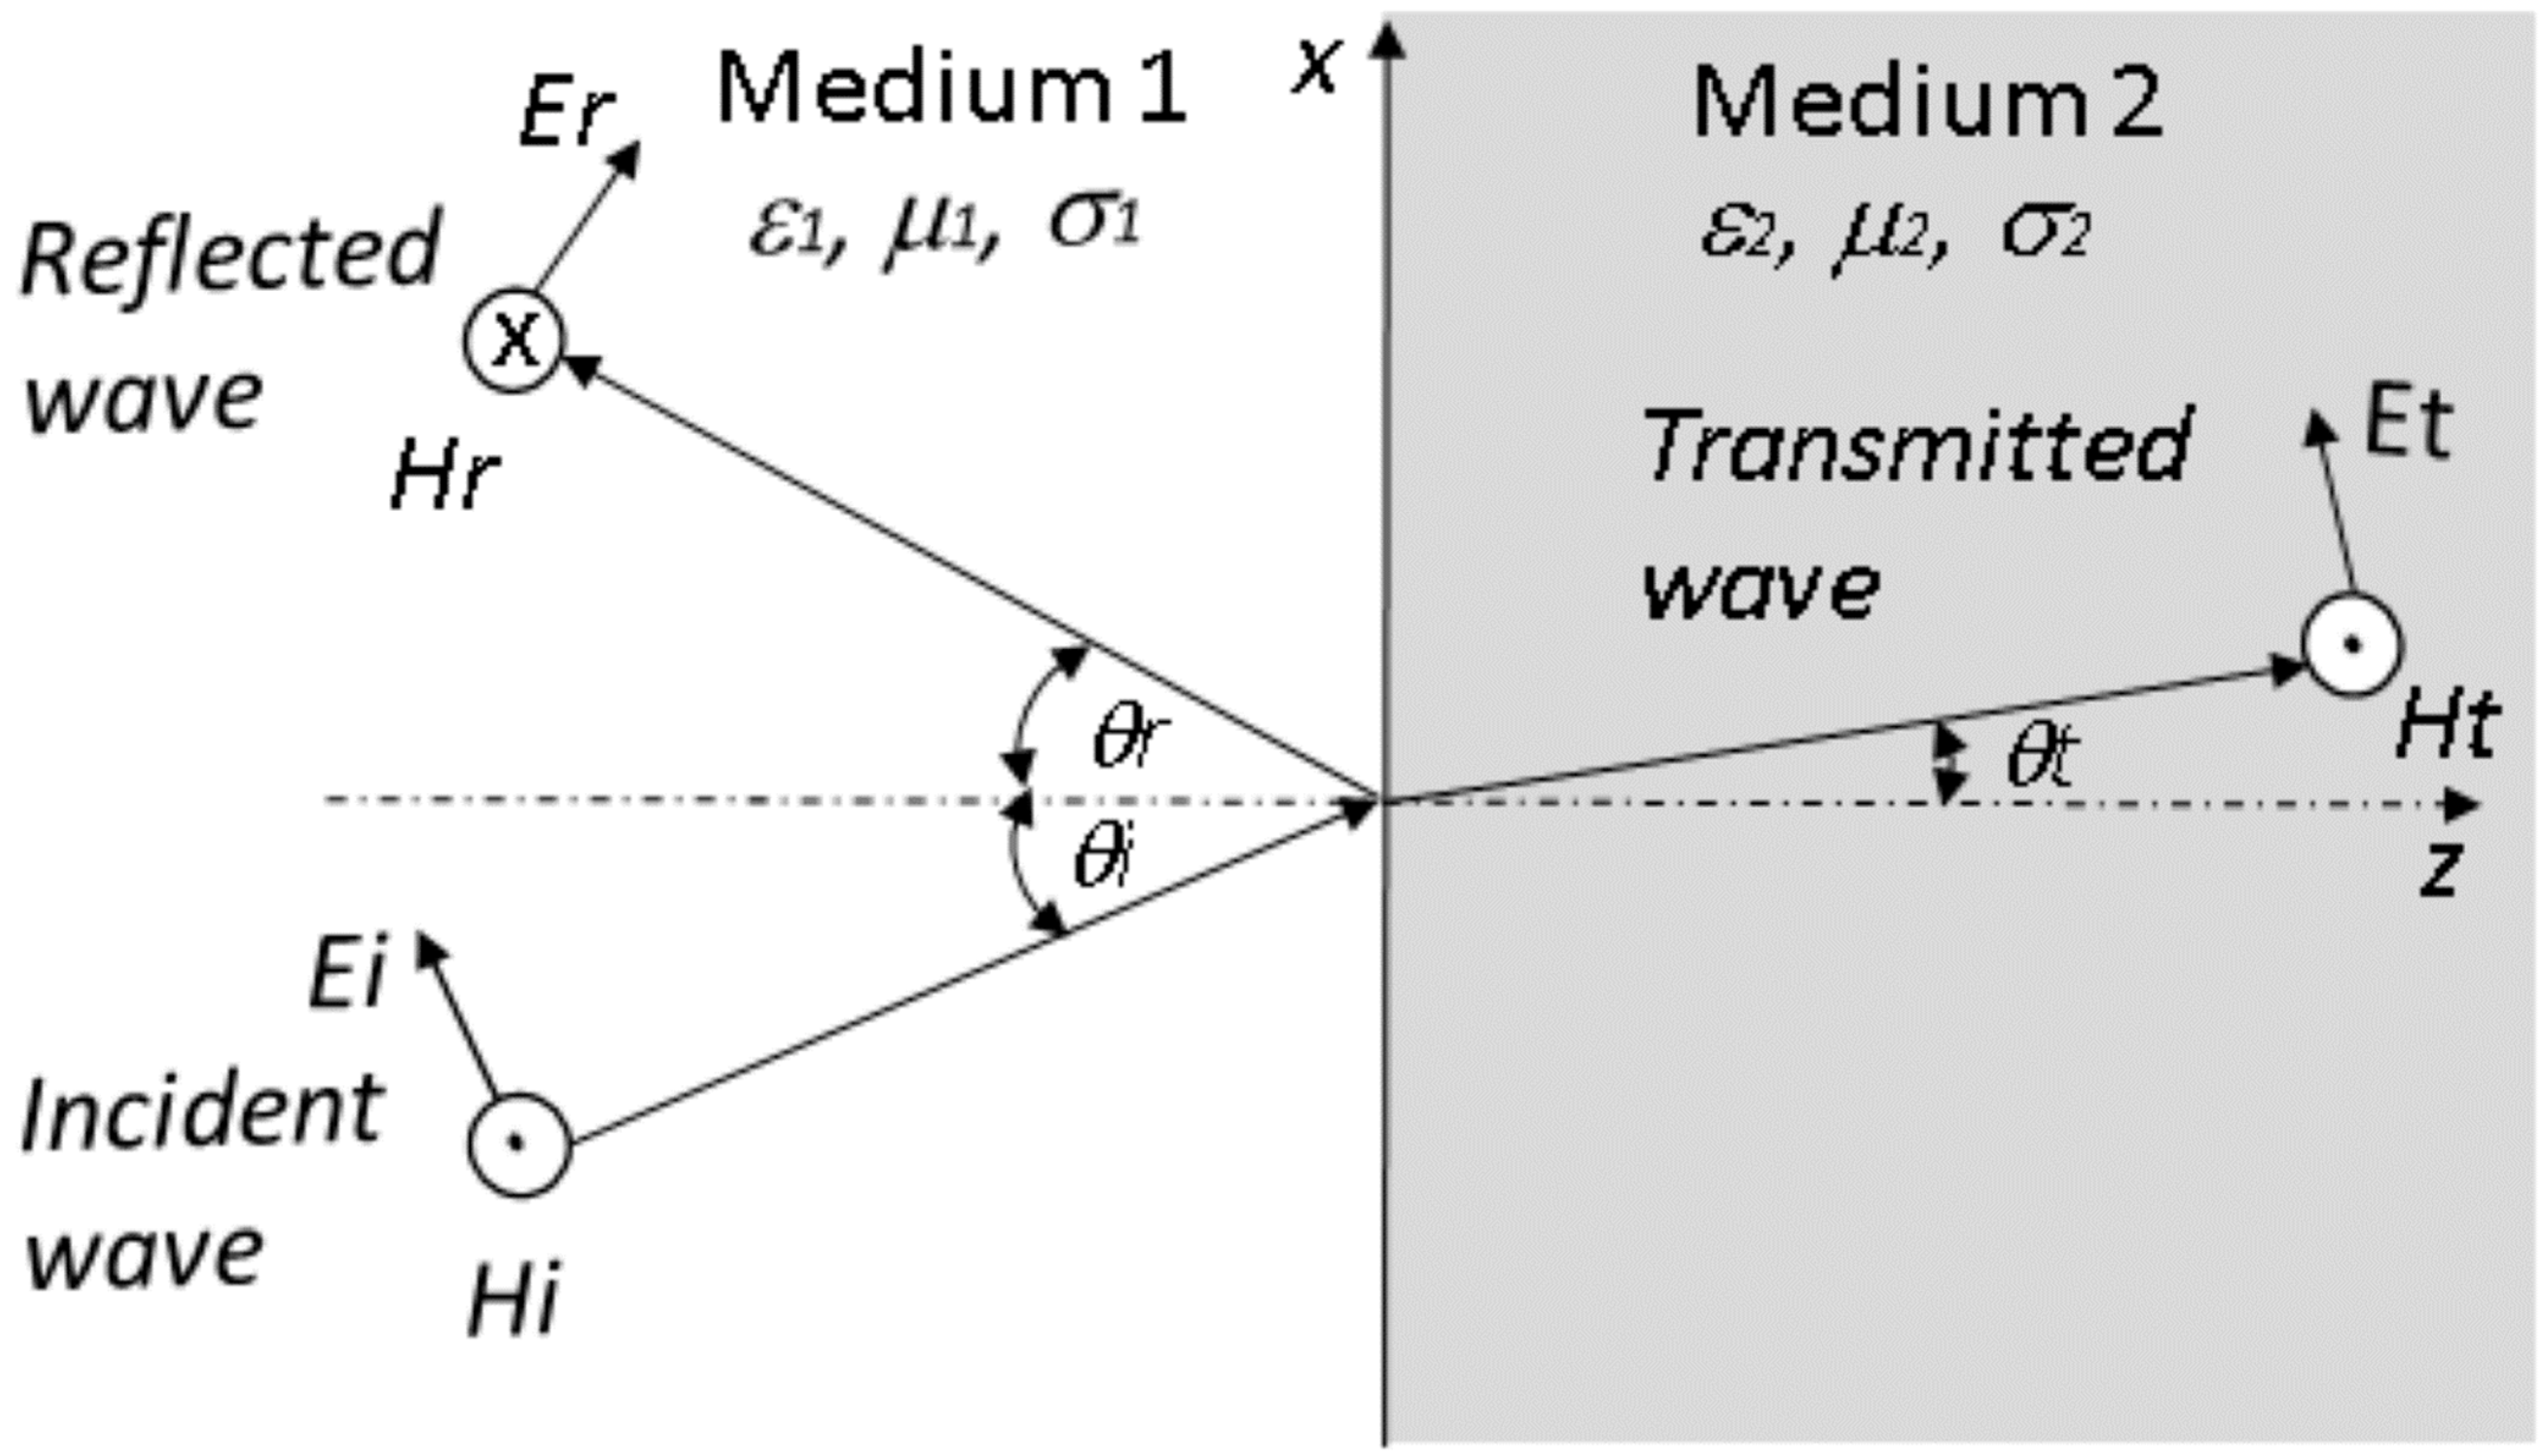
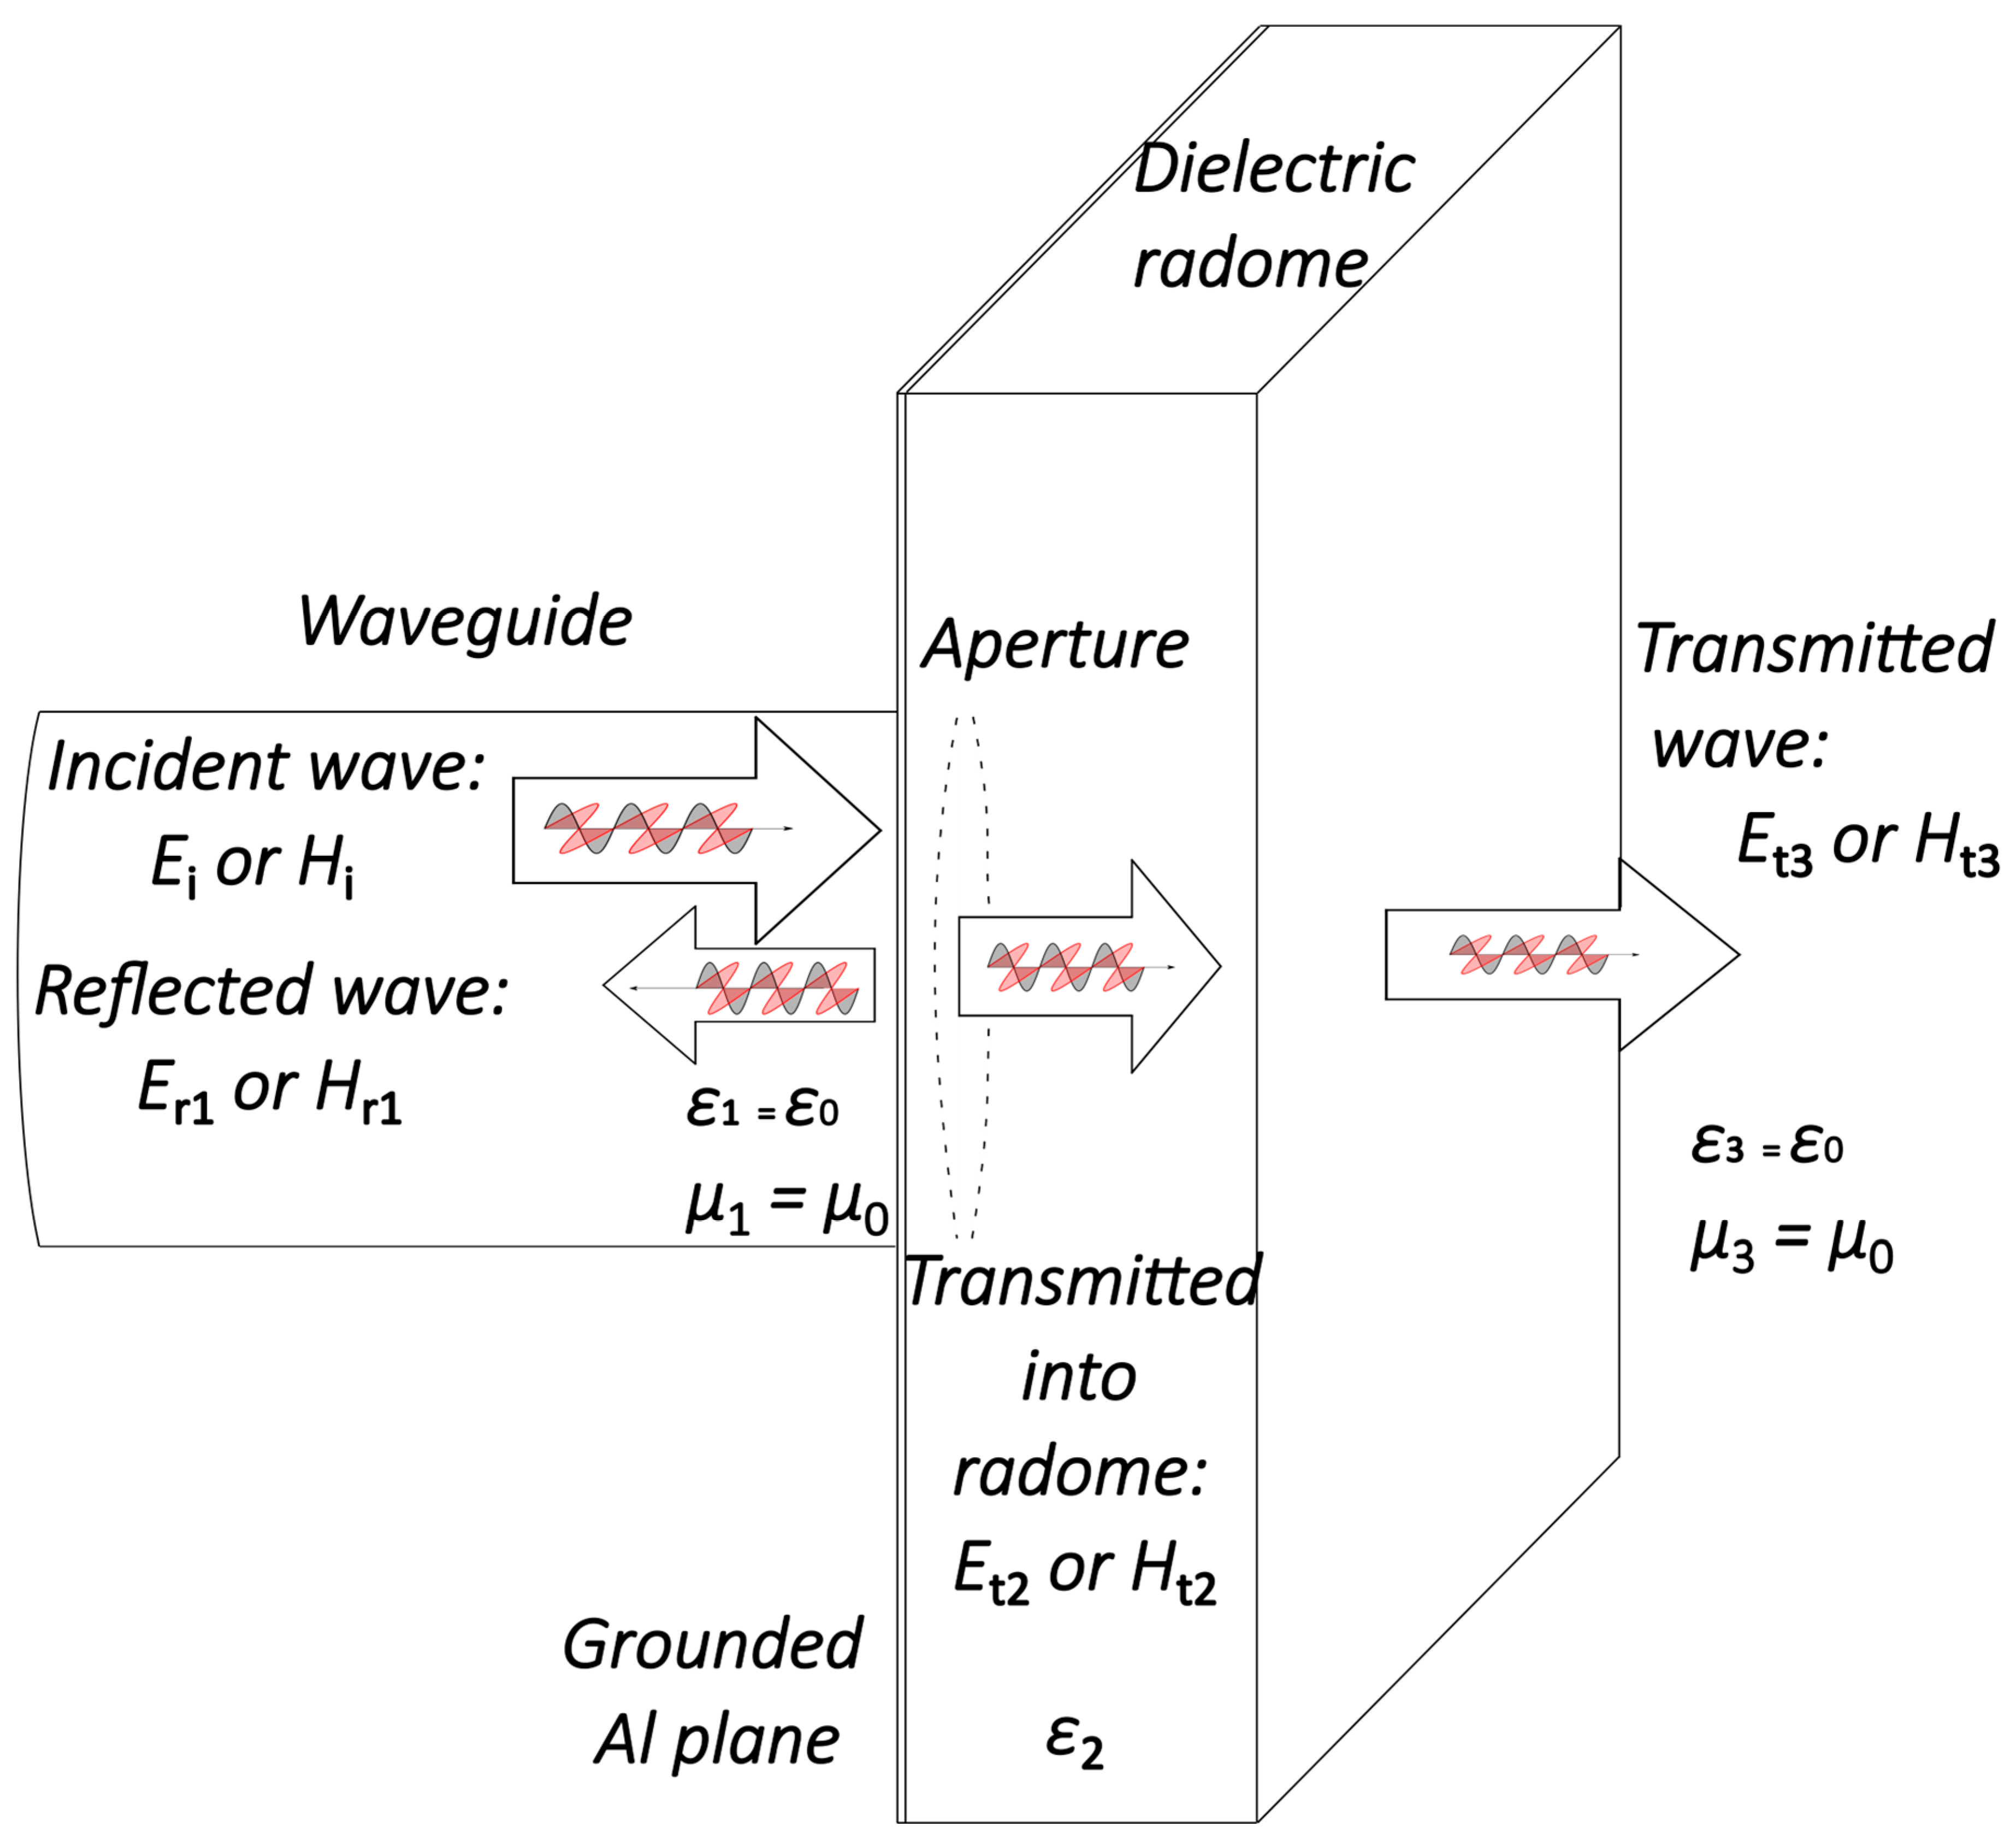
The first section provides an overview of existing research on the performance of the dielectric radome, its parameters, and its influence on the overall performance of the antennas on which it is mounted. In the second section, a theoretical description of the incident wave on a dielectric single-layer material is given with analytical equations of the material parameters of the dielectric plate. Furthermore, all structural–geometric and electromagnetic (EM) parameters of the dielectric single-layer plate are presented, which are processed in the article by both simulation and measurement.
Section 3 presents in detail the simulation results that describe the influence of the specified parameters of the dielectric plate on the aperture reflection coefficients of the antenna where the dielectric plate is located.
Section 4 contains the measurement results of the reflection coefficients that are compared with the simulation results. The last section provides a detailed explanation of the results obtained for the influence of the dielectric plate parameters on the reflection coefficients of the antenna aperture with the dielectric plate.
In this article, the reflection coefficient S11 of the TE11 mode aperture antenna fed by a circular waveguide covered with dielectric is simulated and measured.
3. Numerical Results
The goal of this article is to investigate the influence of all possible parameters of the dielectric plate on the change in the total reflection coefficient S11. The parameters are divided into structural–geometric (thickness d and dielectric density ρ) and electromagnetic parameters (relative dielectric constant εr, dielectric losses tg δ and tg δμ, dielectric conductivity σ, and relative dielectric permeability µr).
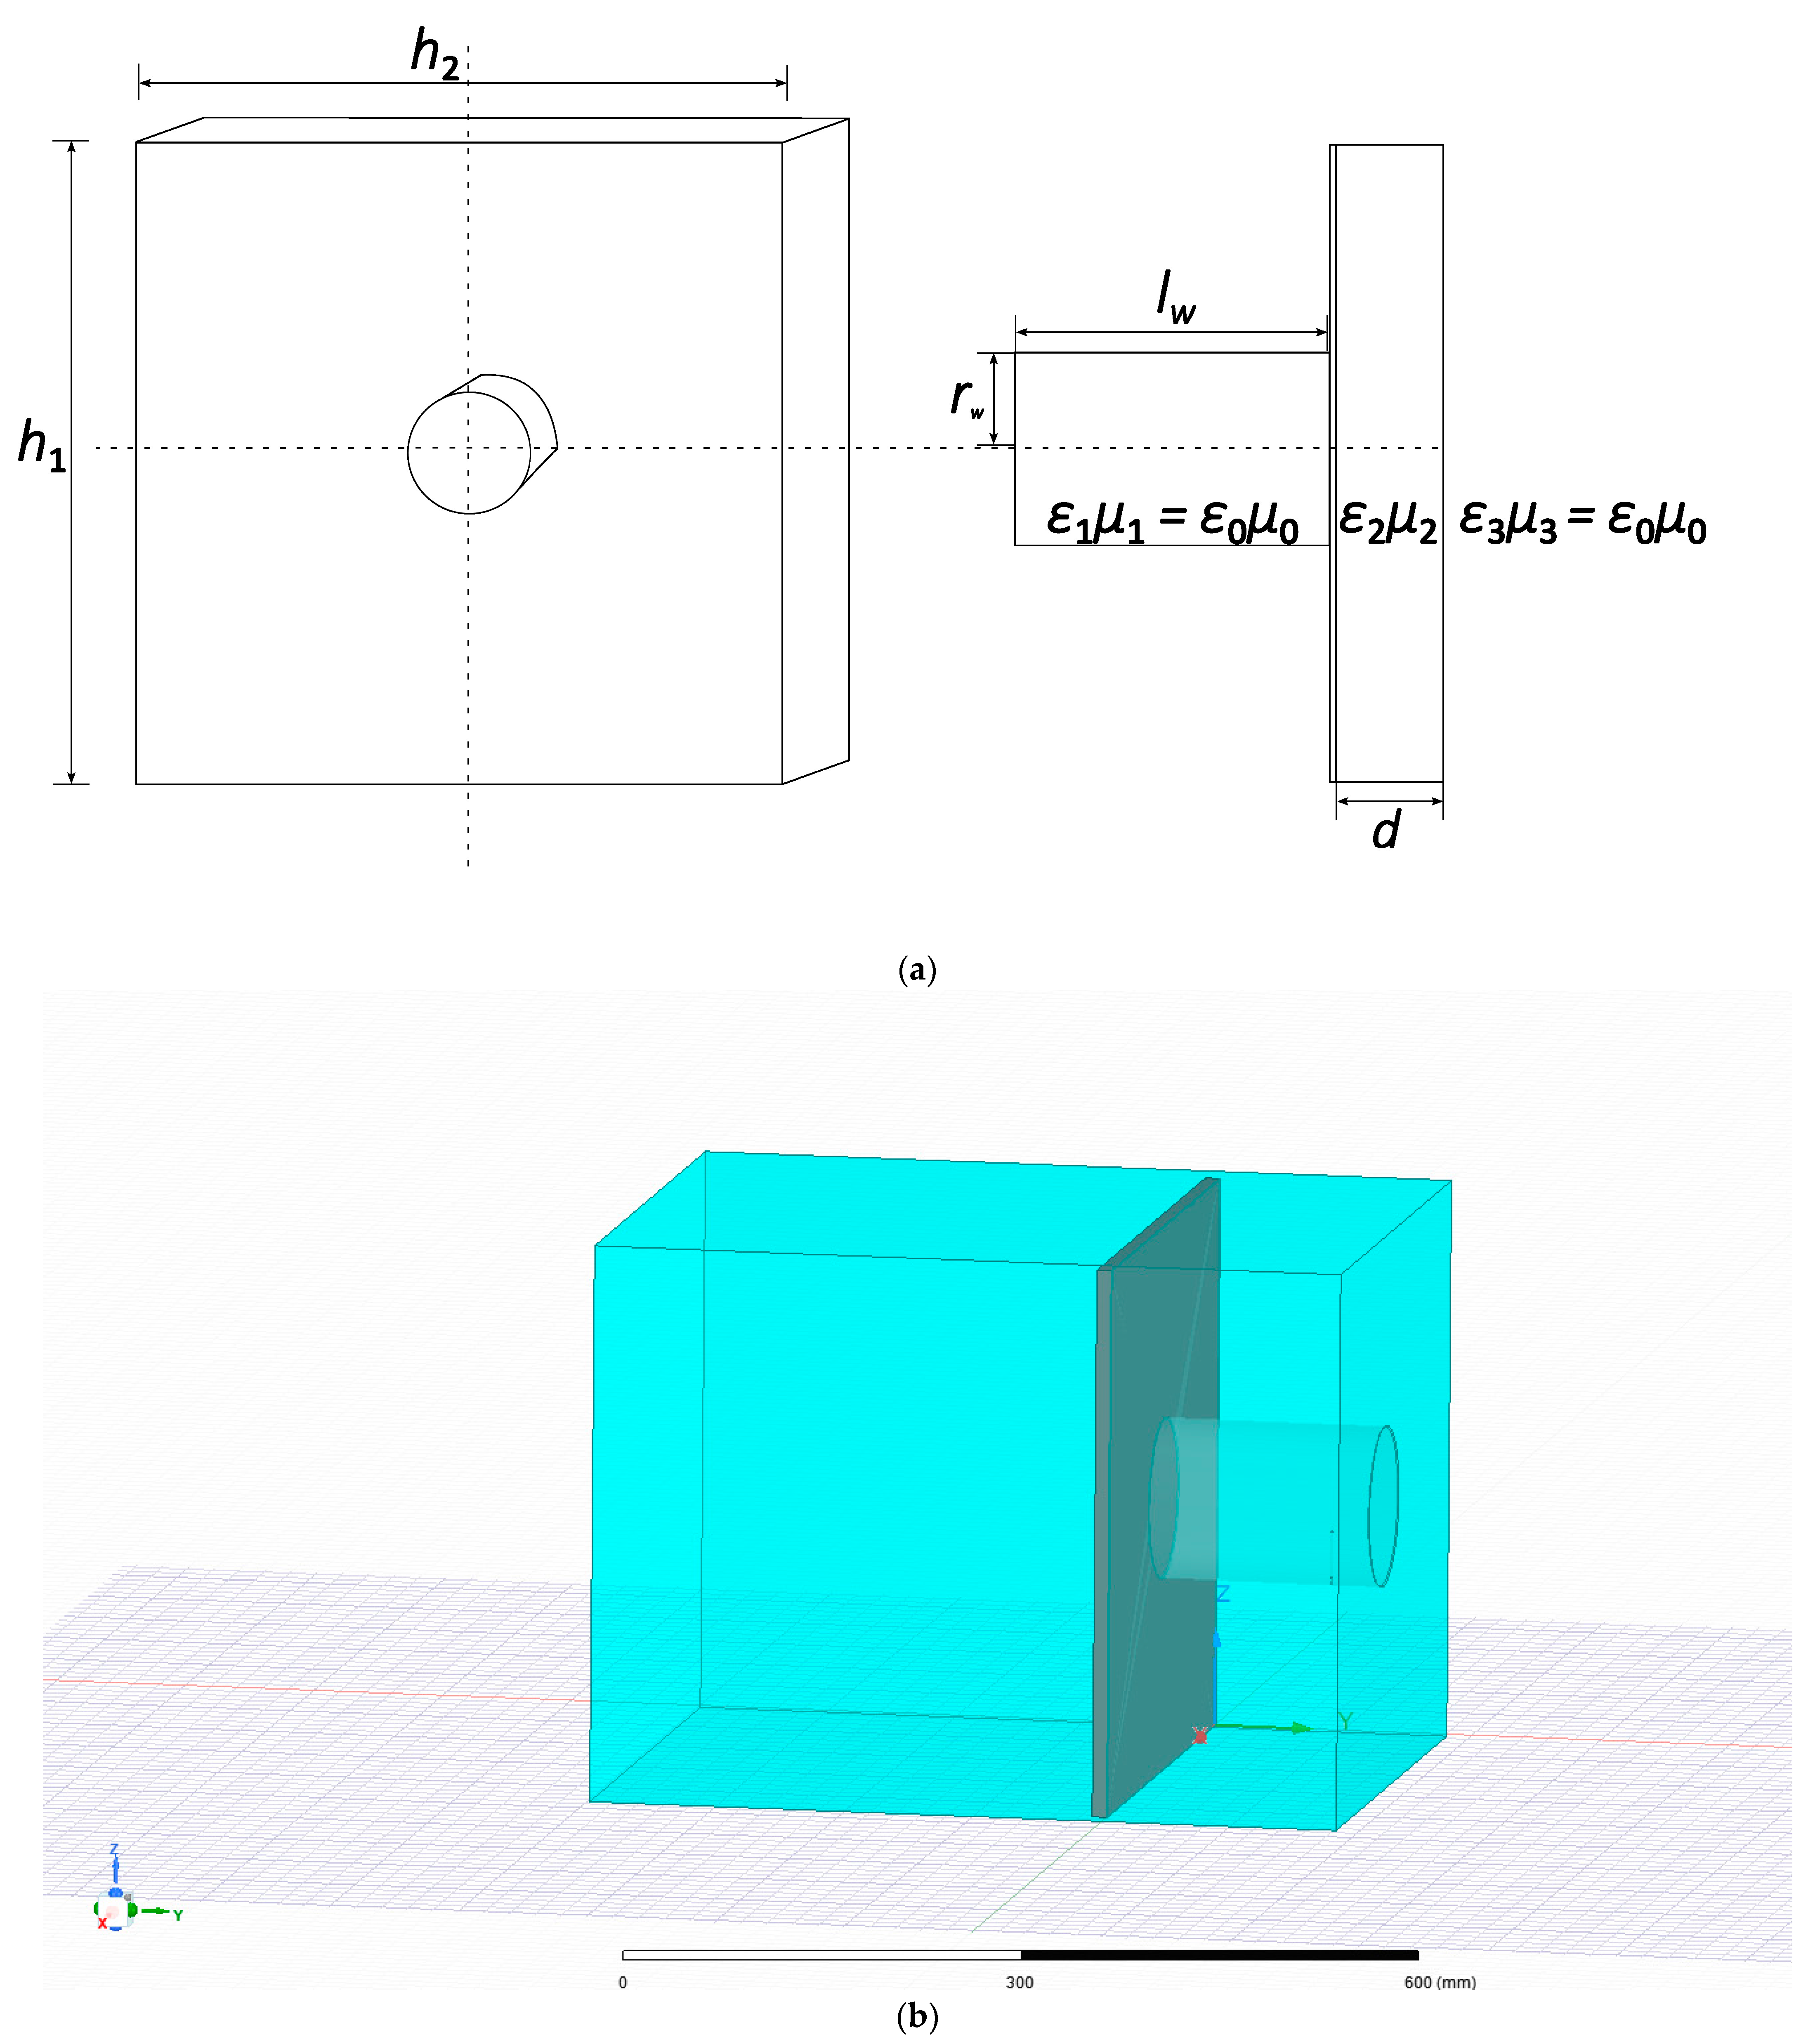
The antenna and the dielectric plate are modeled with Ansys HFSS simulation software for solving electromagnetic problems using the finite element method. The antenna model is shown in
Figure 6.
The dimensions (width h1, length h2) of the grounded plane and dielectric plate are h1 = 423 mm (2.51 λ) and h2 = 450 mm (2.67 λ), and the radius and length of the waveguide are rw = 61 mm (0.276 λ) and lw = 171 mm (1.02 λ), respectively. The space inside the waveguide is defined by ε1 and µ1 (the waveguide is air-filled). The dielectric plate is characterized by ε2, µ2, and the thickness d. The space following behind the dielectric plate is free space, and it is characterized by ε0, µ0.
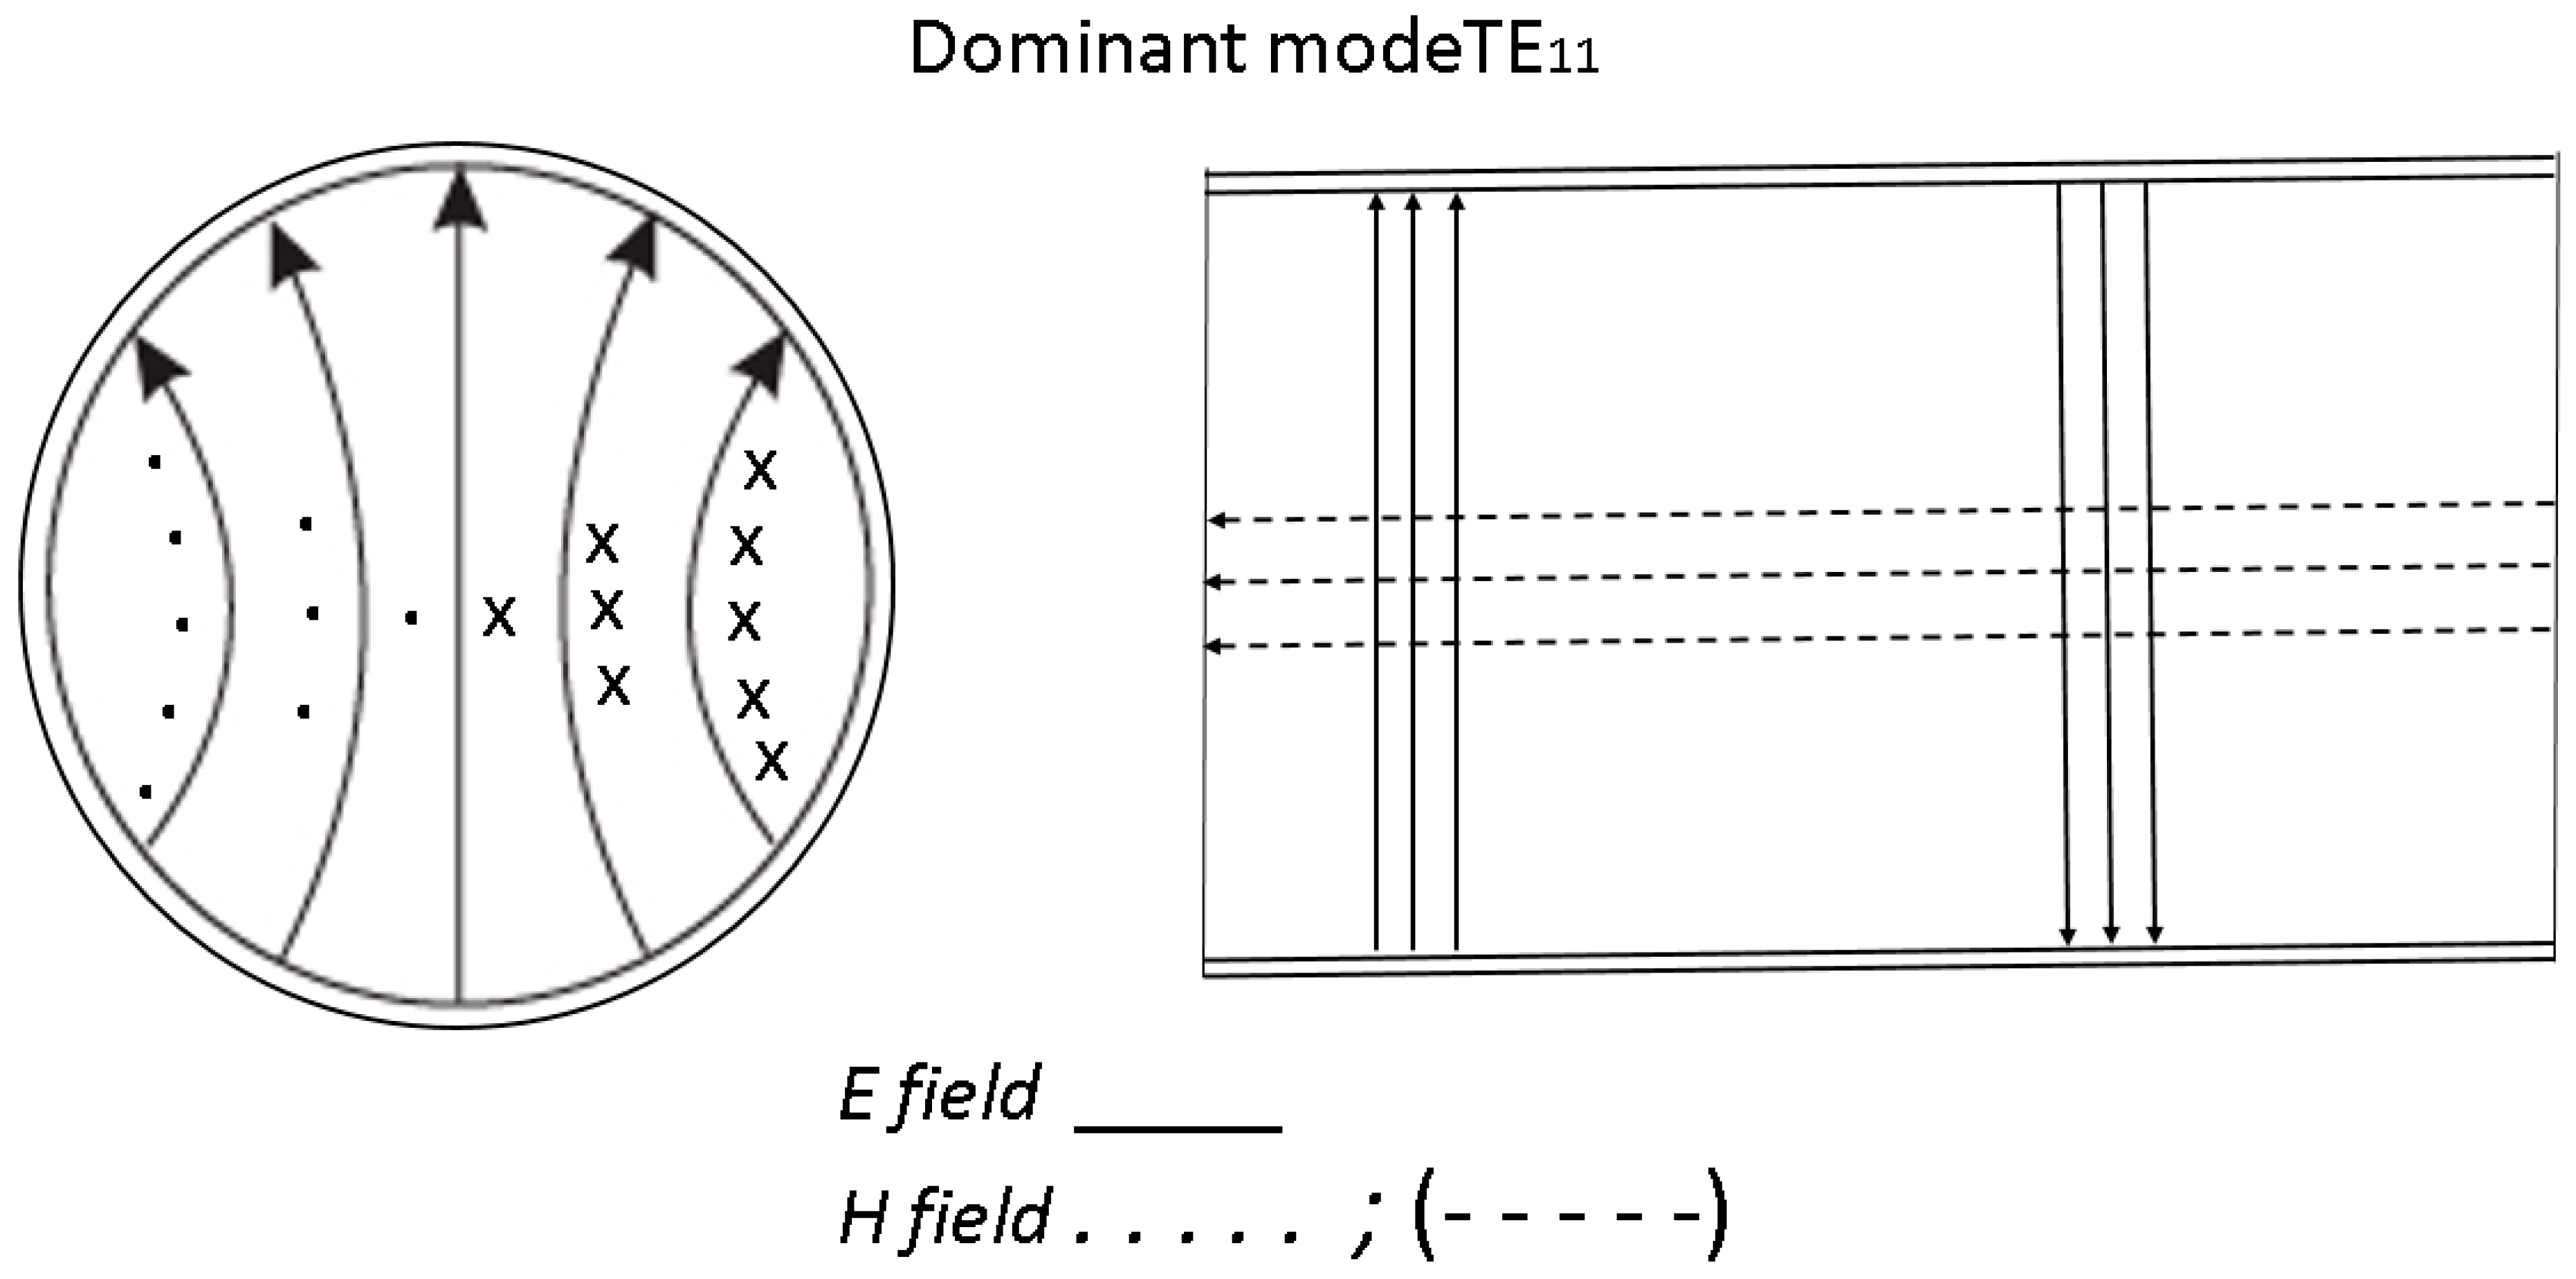
The dominant mode of the waveguide with a circular cross-section is TE11 with the corresponding cut-off frequency fcTE11. The next mode is TM01 with the cut-off frequency fcTM01. Therefore, numerical calculations were carried out in the frequency range fcTE11 < f < fcTM01.
3.1. The Influence of the Structural–Geometric Parameters of the Dielectric on S11
As already mentioned, the structural–geometric parameters of the dielectric include the thickness d in mm, dielectric plate dimensions h1 × h2, and the density ρ of the dielectric plate in kg·m−3.
3.1.1. Influence of Dielectric Plate Thickness d on the Reflection Coefficient
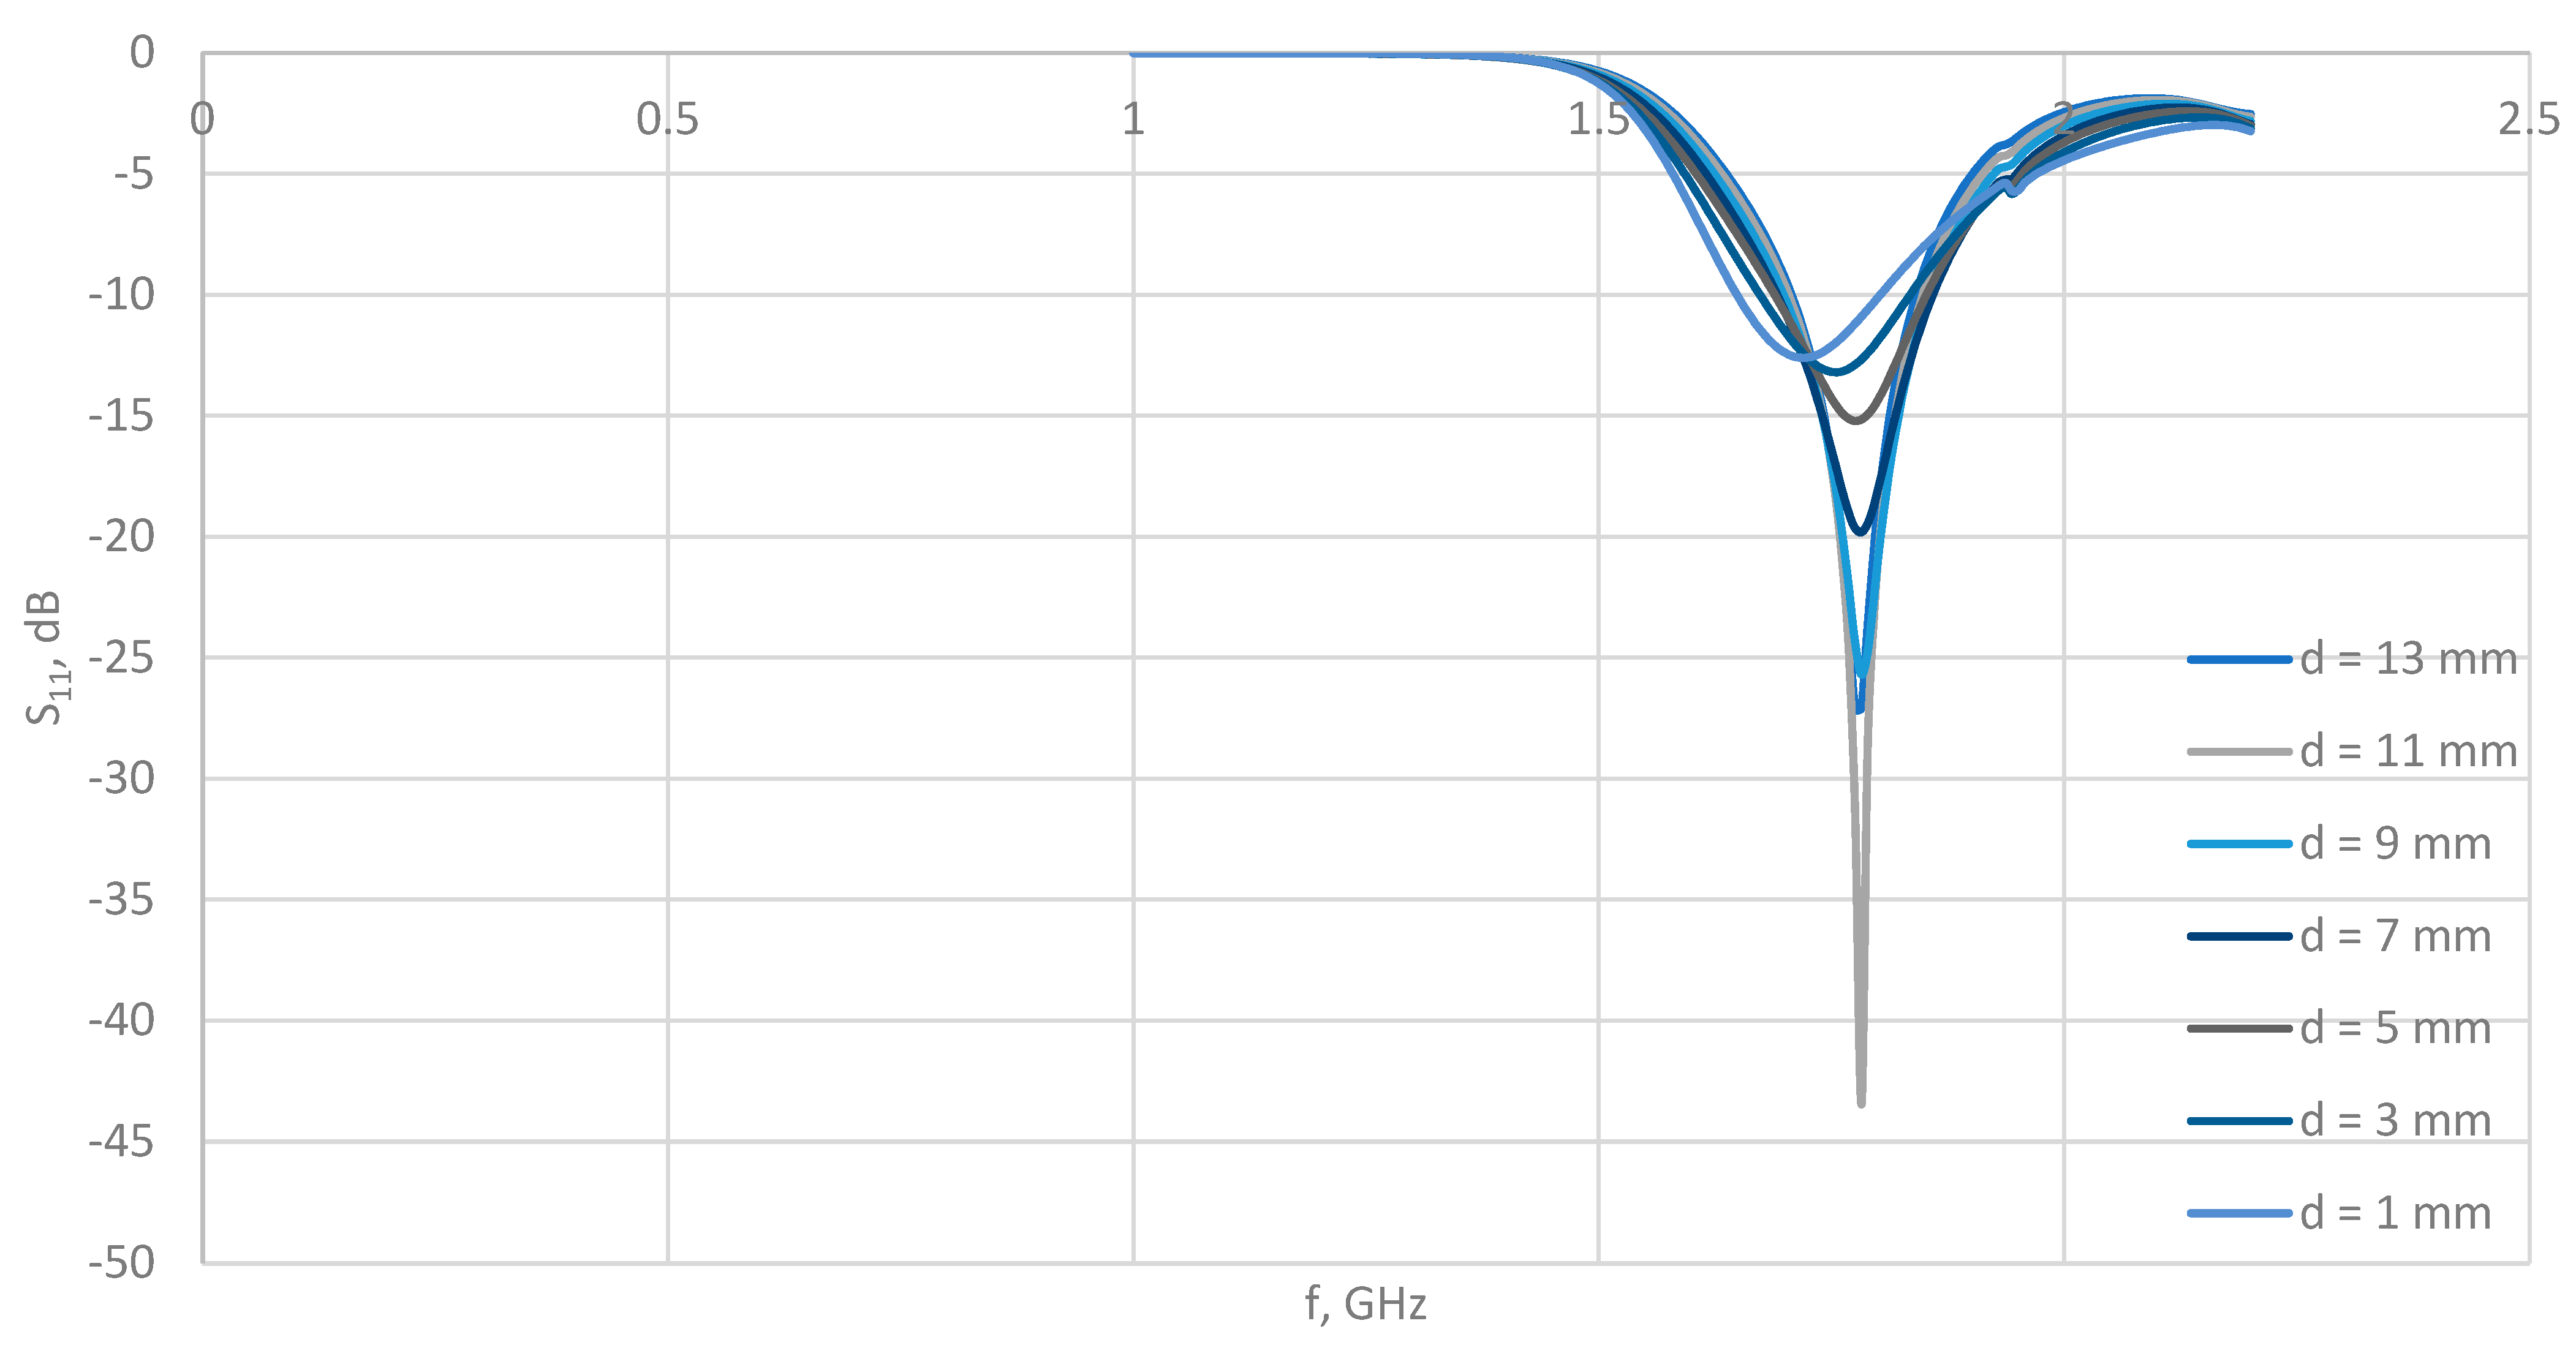
In this subsection, the focus is on the influence of the change in the thickness of the dielectric layer d on the reflection coefficient S
11 at the opening of the waveguide. The thickness d ranges from d = 0 mm to d = 13 mm, assuming all other parameters: ε
r = 2.5, µ
r = 1, σ = 0 S/m, tg δ = 0.09, tg δ
μ = 0. Some values of these parameters were carefully selected according to [
11,
17,
18].
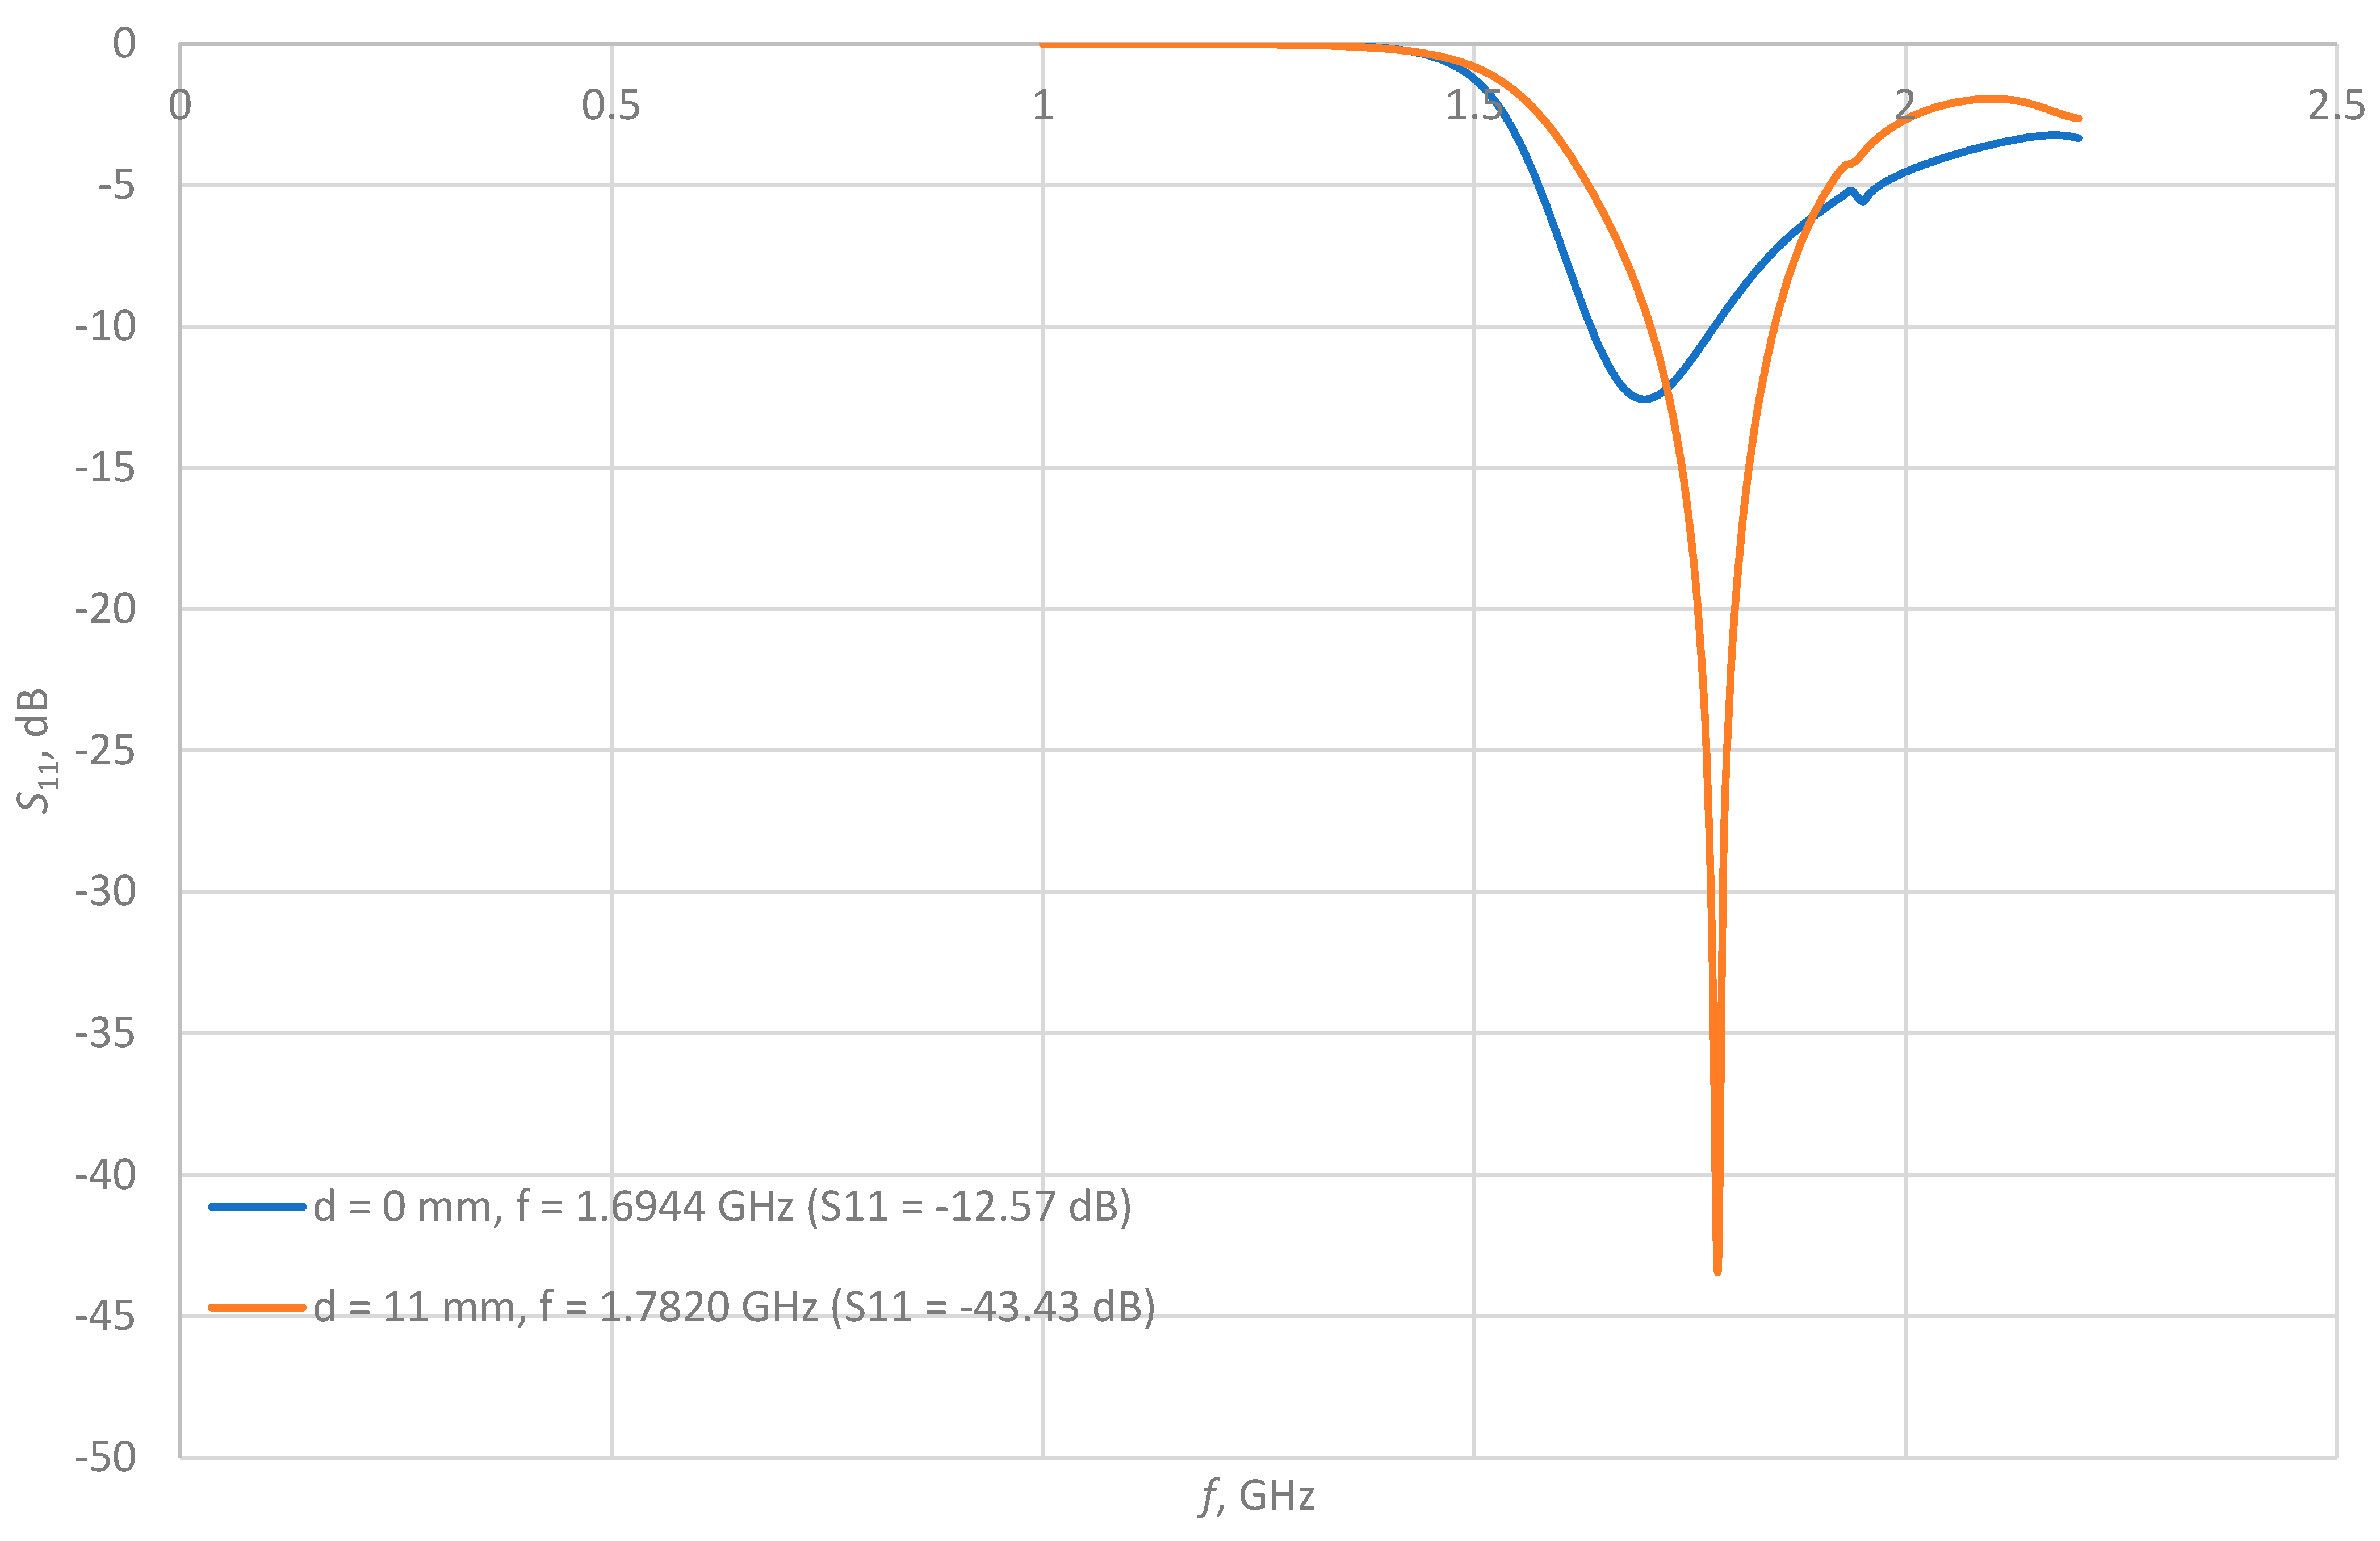
The simulation results show that the amplitude of the reflection coefficient S
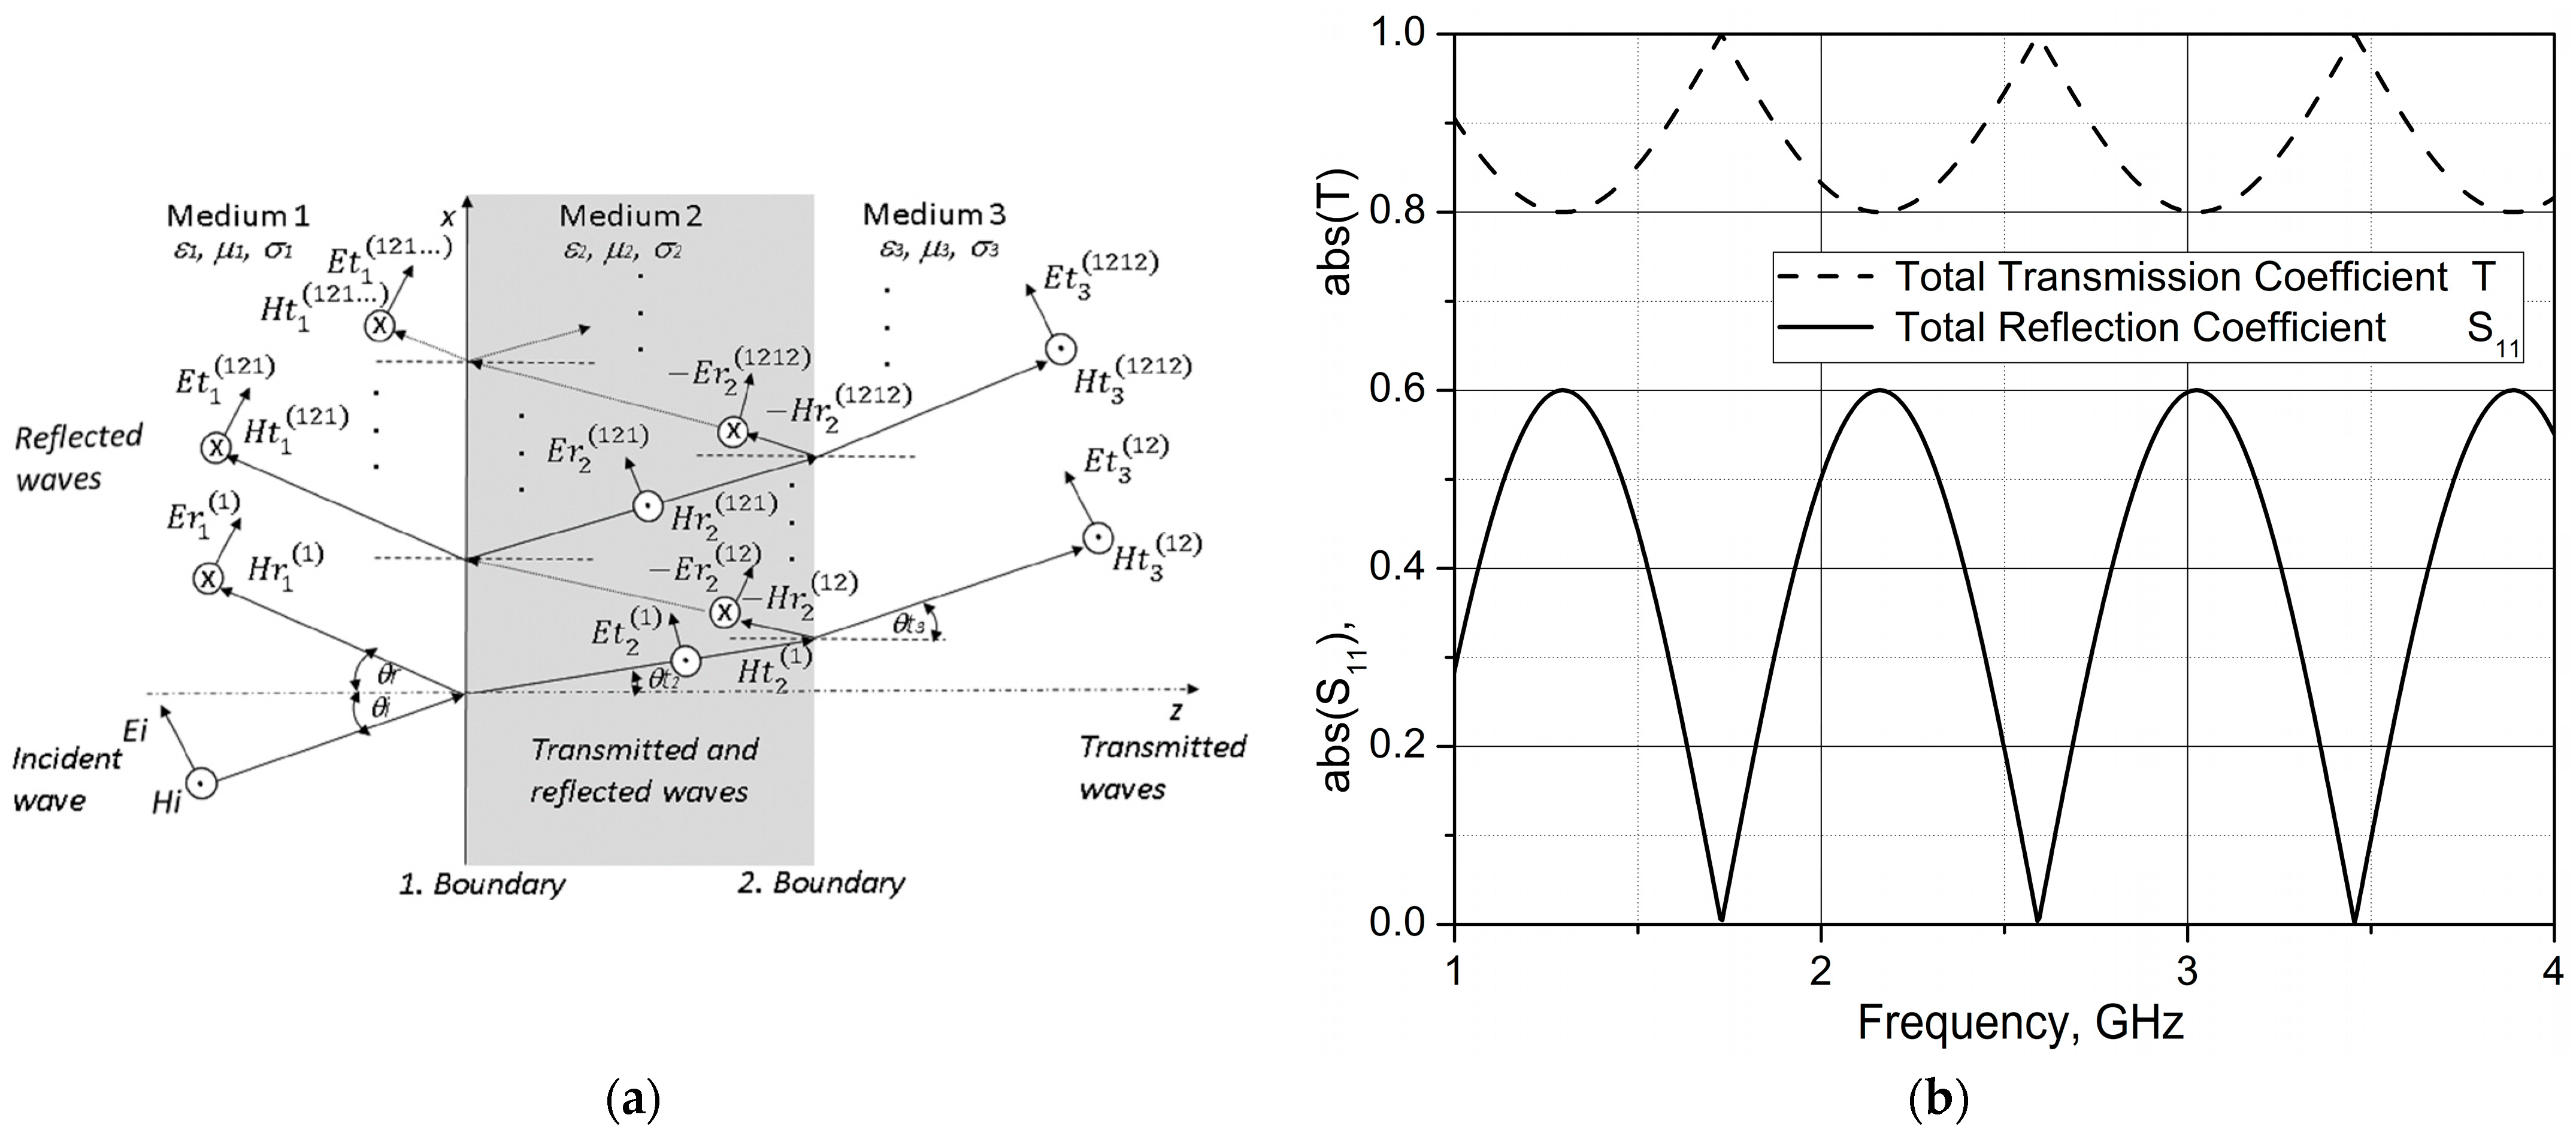
11 decreases with increasing dielectric plate thickness d, namely from −12.57 dB (d = 0 mm) to −43.43 dB (d = 11 mm). After that, for dielectric plate thickness of 13 mm, the value of the reflection coefficient increases (−27.10 dB). This is consistent with the theoretical considerations in
Section 2 and the minimum absolute value of the parameter S
11 (between 1 and 2 GHz) shown in
Figure 2b. It can be seen that the resonant frequency increases (shifts to the right) with increasing dielectric plate thickness at the antenna aperture. After reaching dielectric plate thickness of about 11 mm (and the minimum value of parameter S
11), the resonant frequency decreases with increasing dielectric plate thickness. The reason for this is that the reflected waves from the first (air-dielectric plate) and the second (dielectric plate-air) boundary at this thickness (about 11 mm) are in destructive interference, resulting in the minimum value of the reflection coefficient S
11.
Figure 7 and
Table 1 show the change in the reflection coefficient as a function of the change in the thickness of the dielectric d. The minimum values of the coefficient S
11 for certain values of d are listed in
Table 1 together with the associated frequency f.
3.1.2. Influence of the Dielectric Plate Dimension h1 × h2 (Width × Length) on the Reflection Coefficient and the Radiation Pattern of the Antenna Opening
First, it is necessary to point out that simulation calculations of the reflection coefficient S11 were performed to change the dimensions of the dielectric plate h1 × h2 by ±20%, which resulted in negligible changes in the reflection coefficient S11.
3.1.3. Influence of Dielectric Plate Density ρ on the Reflection Coefficient
The structural parameters of the dielectric covering the antenna include, as already mentioned, the density of paper ρ in kg·m
−3. The calculations showed a constant value of the reflection coefficient S
11 = −43.43 dB (f = 1.7820 GHz) for ρ
[500, 1800] kg·m
−3. Therefore, for all further simulations of the reflection coefficient according to [
19], it is assumed that ρ = 1200 kg·m
−3.
3.2. The Influence of the Electromagnetic Parameters of the Dielectric on S11
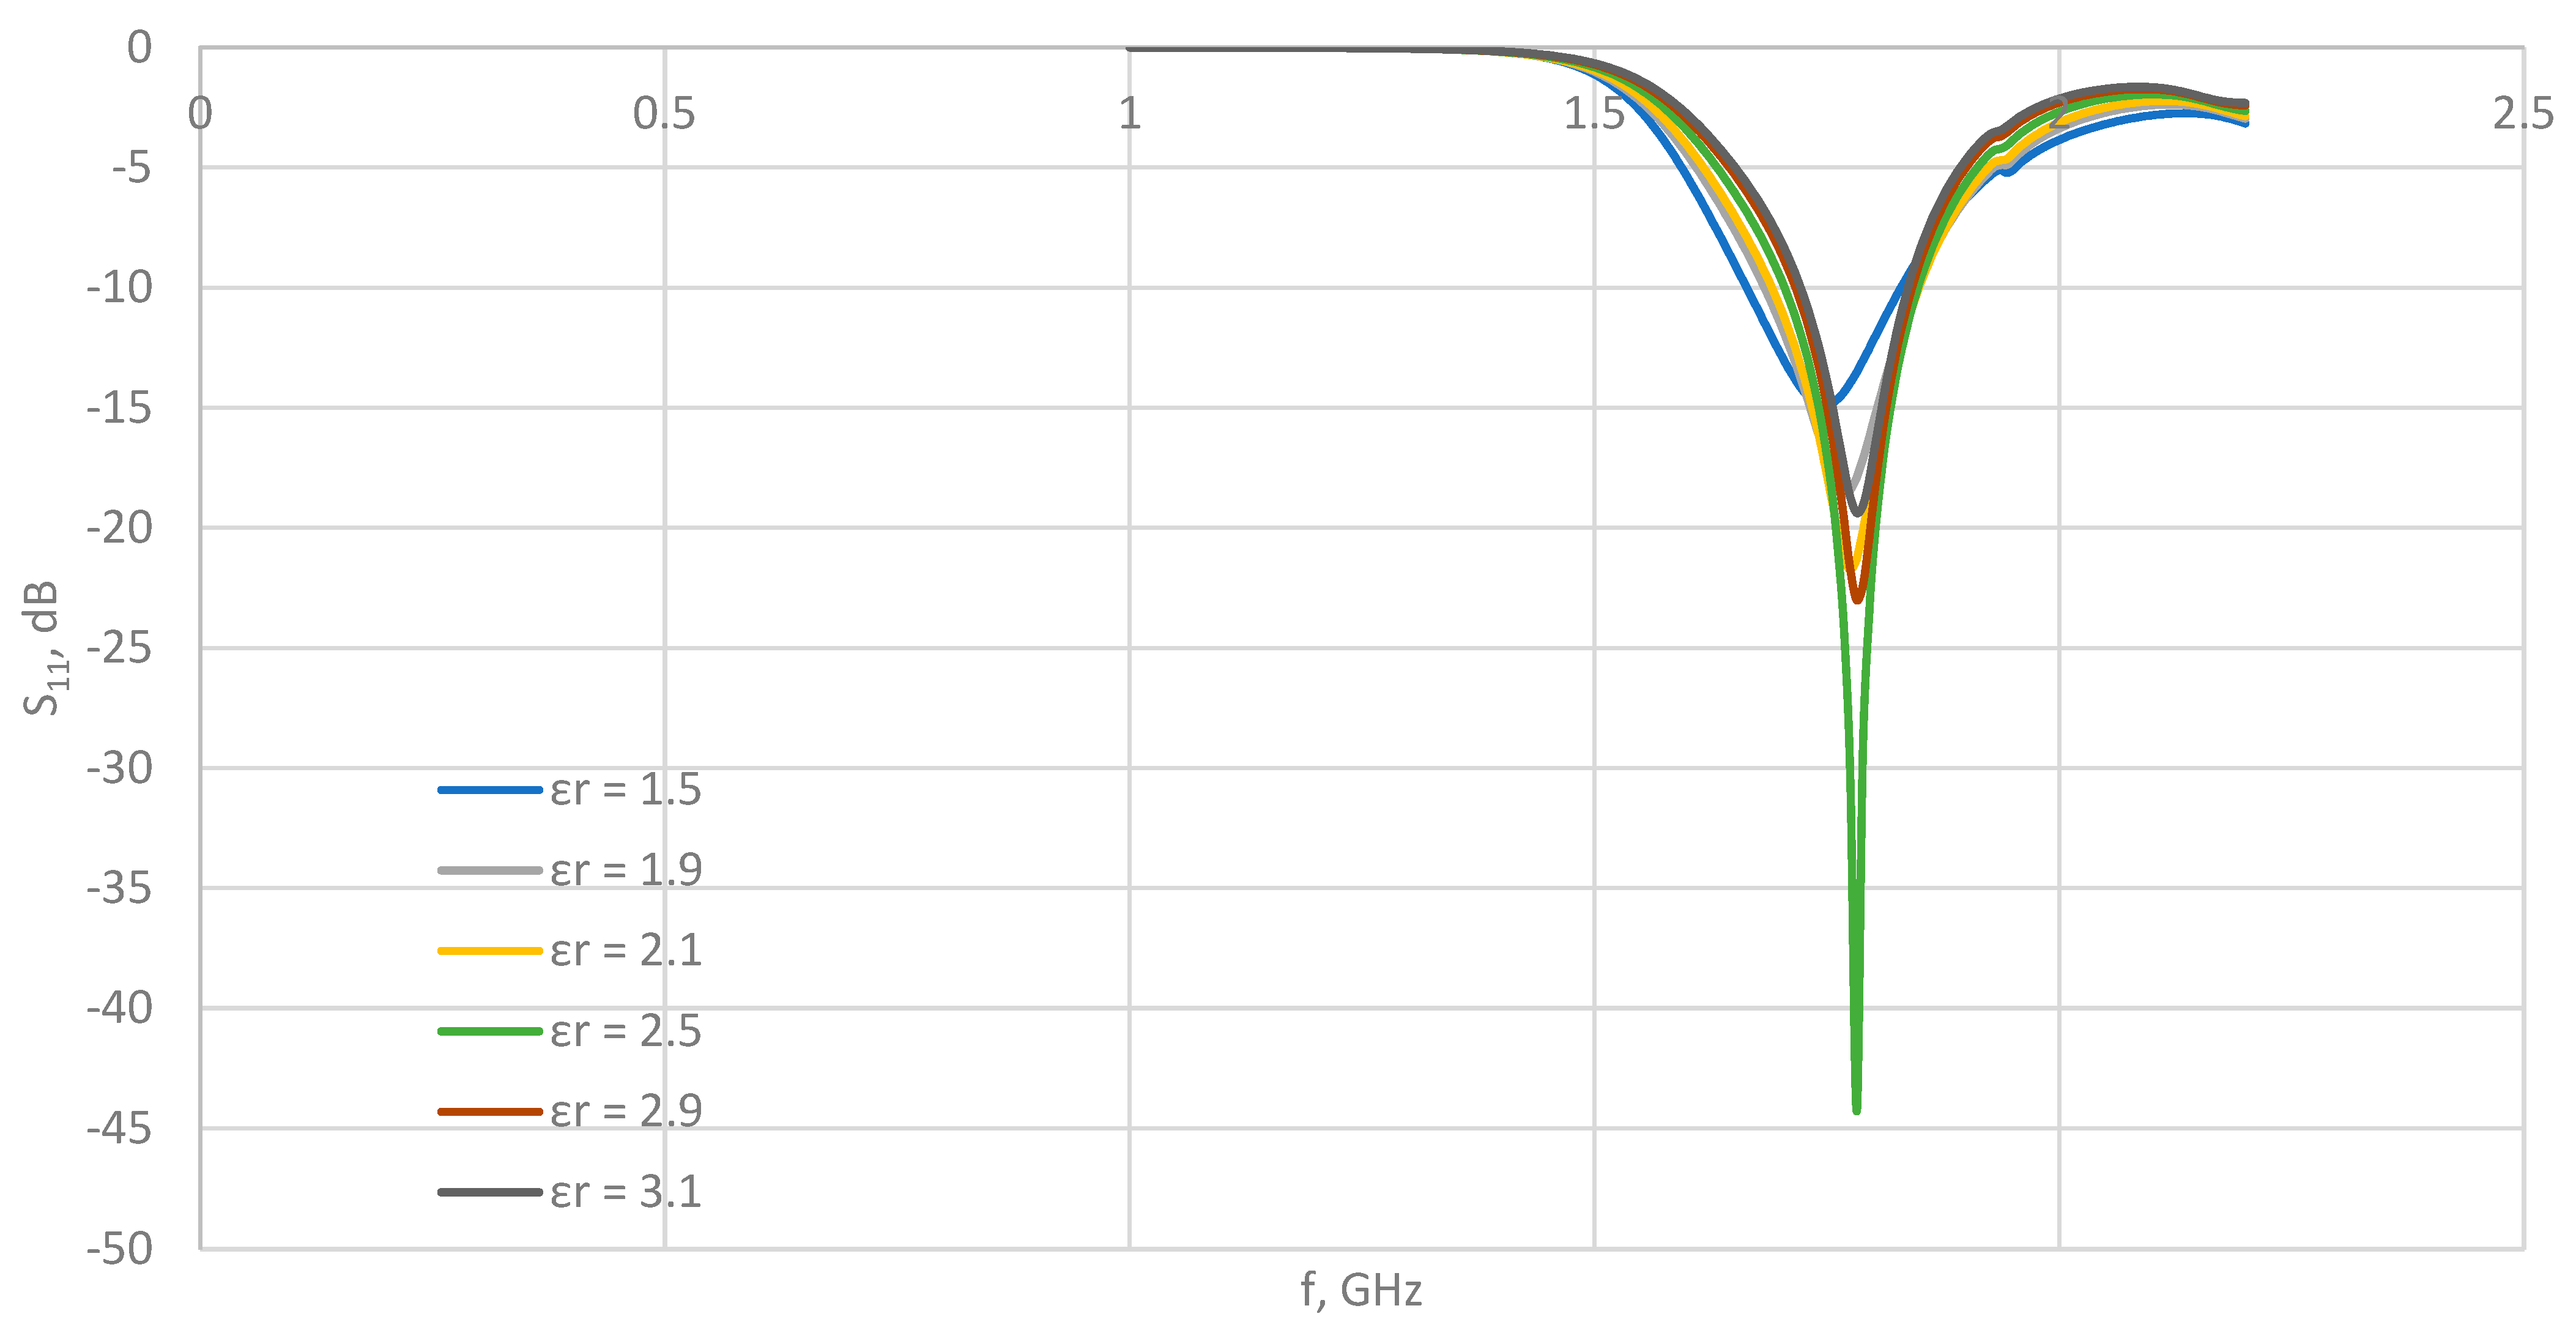
3.2.1. Influence of the Dielectric Plate Relative Permittivity εr on the Reflection Coefficient
In this study, simulations of the reflection coefficient S
11 for ε
r [1.5, 10] were carried out under the condition that the thickness of the dielectric d is fixed at 11 mm (the best value from the previous subsection). The other dielectric parameters remain as given in
Section 3.1.1. The simulation results are presented in
Figure 8 and
Table 2.
It can be seen from the simulations that the value of the reflection coefficient S11 is minimal at the dielectric constant εr = 2.5, which, according to the literature cited above, proves that a material with such dielectric constant value is an excellent choice for the antenna radome.
The frequency of the minimum value of the curve S11(f) and εr = const, which also corresponds to the resonant frequency of the aperture antenna, increases (it moves to the right towards higher frequencies) with an increase in the permittivity constant. This increase in resonance occurs up to the value of the permittivity 2.5, at which the value of the reflection coefficient S11 reaches the minimum value of −43.43 dB at the frequency 1.7820 GHz. With a further increase in the permittivity, the value of the resonant frequency decreases, whereas the minimum value of the curve S11(f), εr = const, increases.
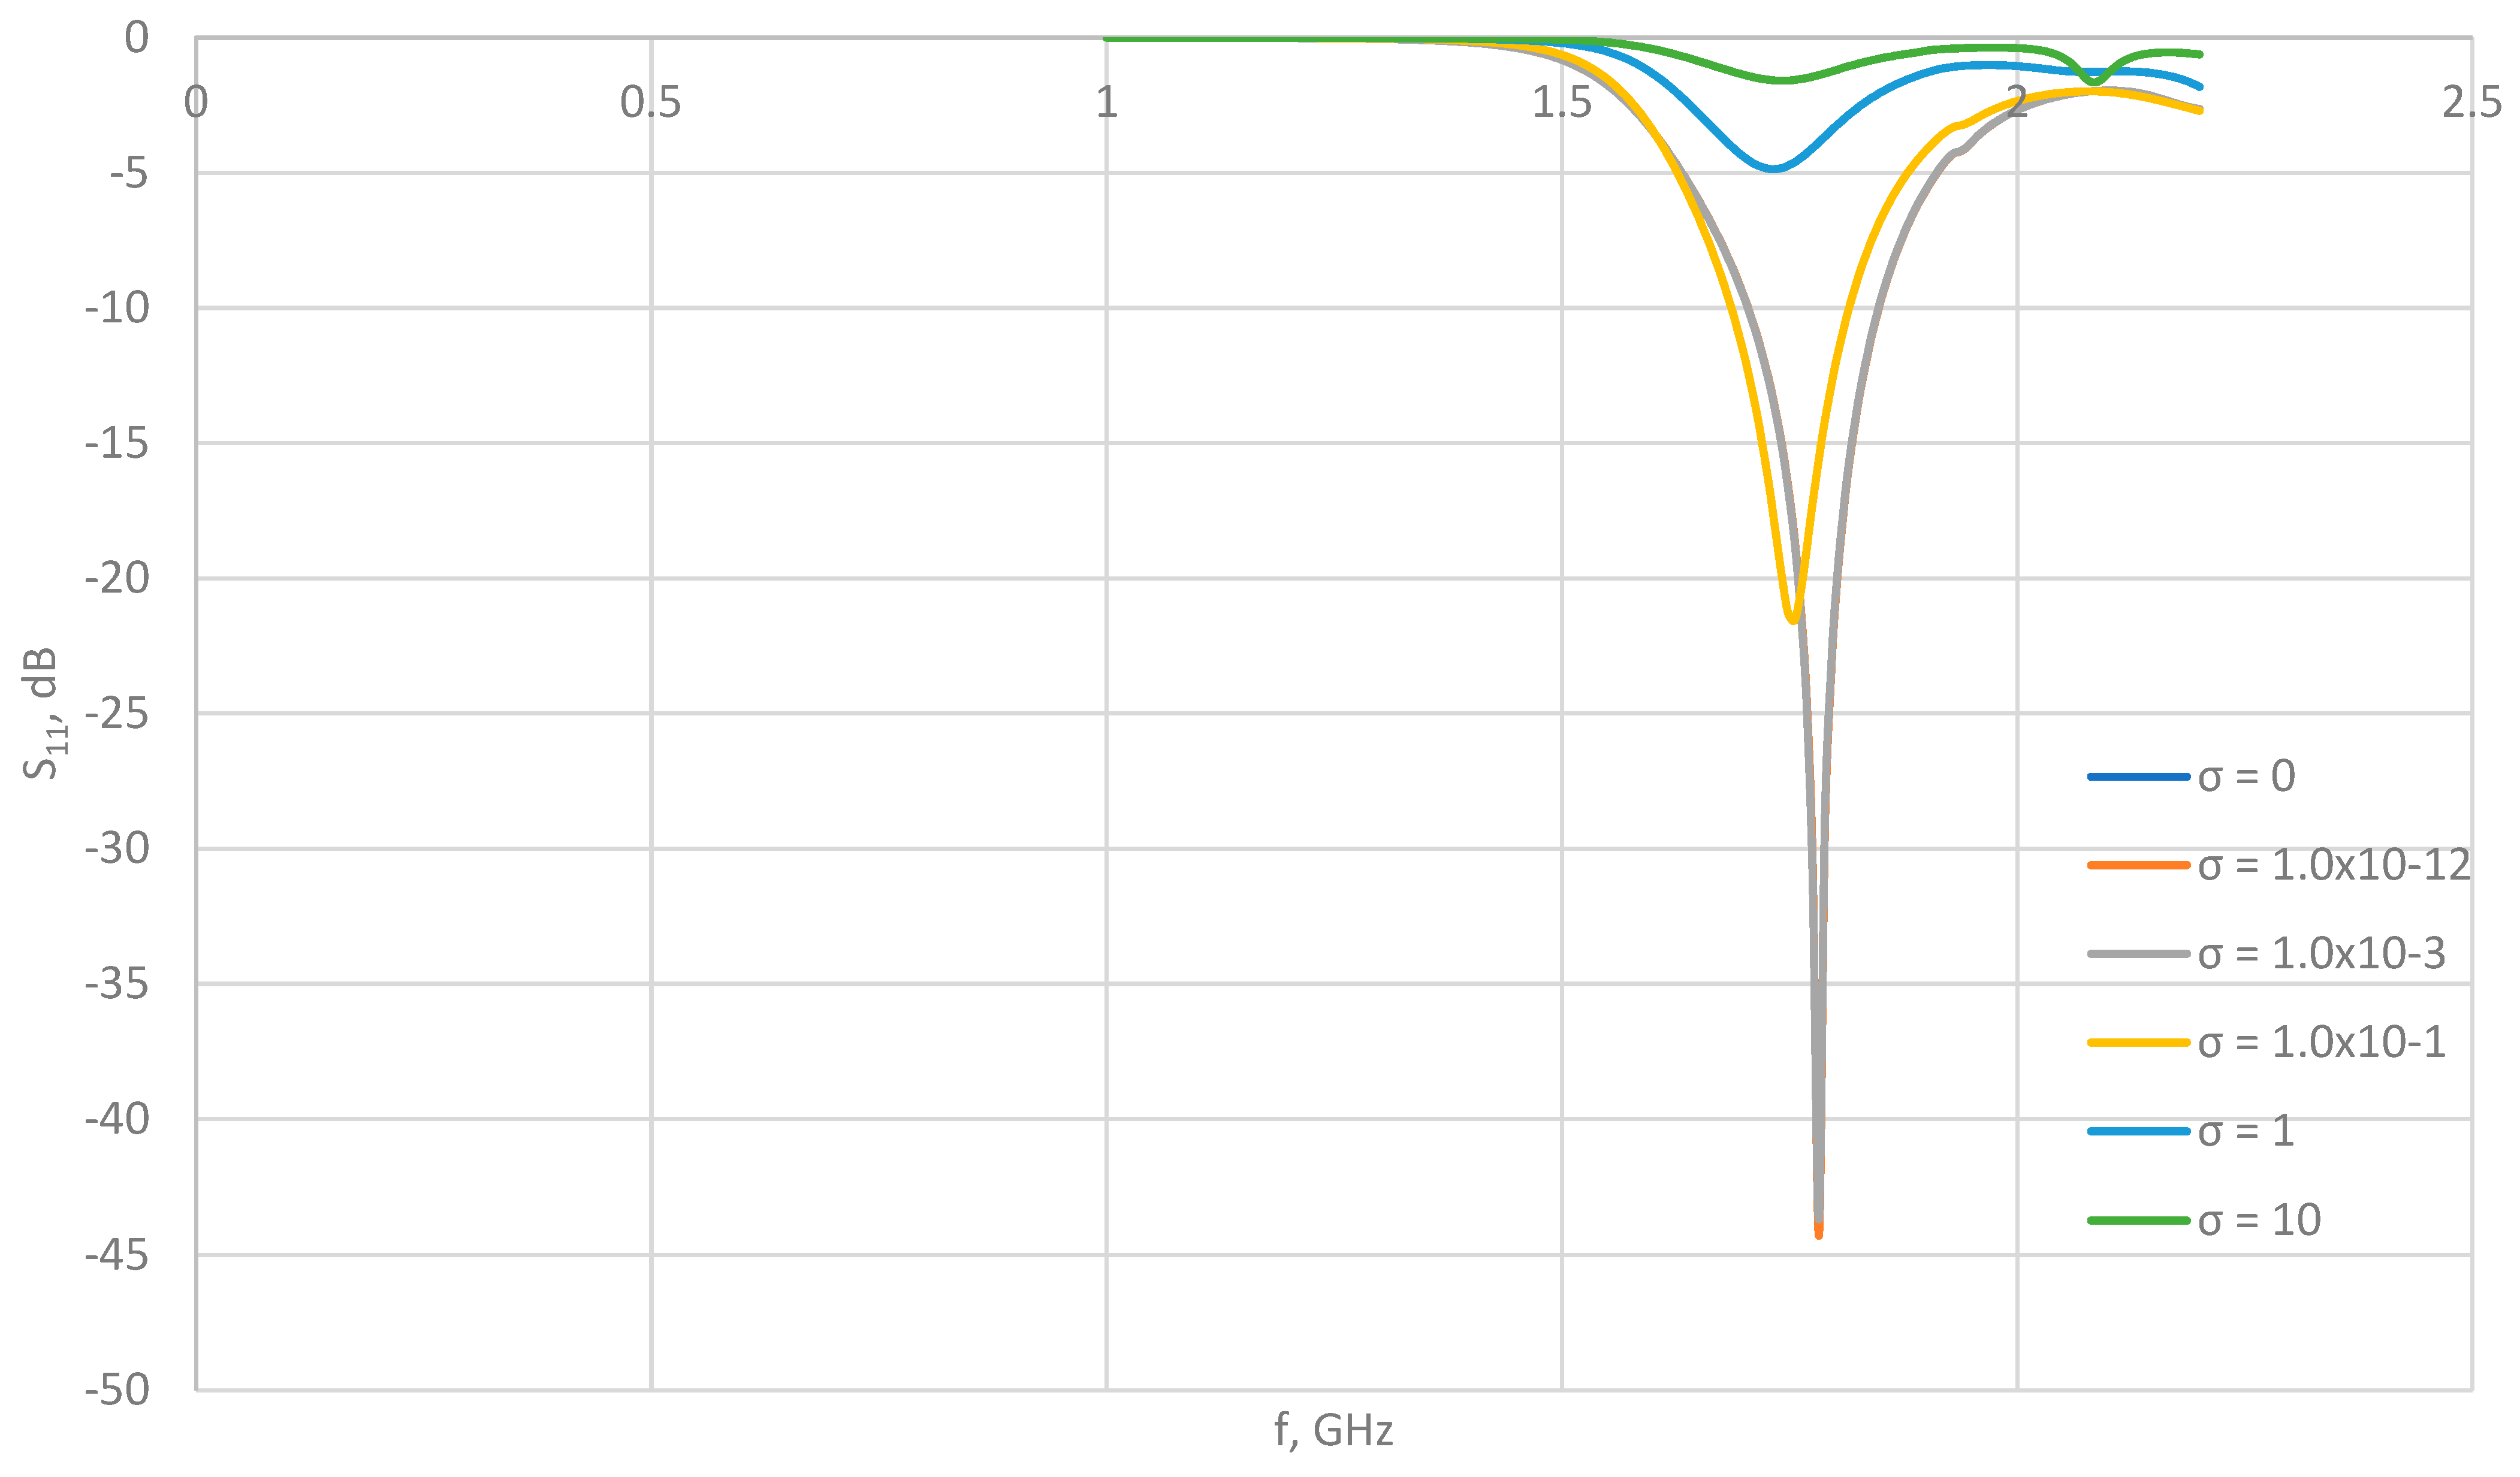
3.2.2. Influence of Dielectric Plate Electric Conductivity σ on the Reflection Coefficient
The electrical conductivity of the materials to be used as a dielectric shield should be as low as possible. With this analysis, we try to determine the influence of this electromagnetic parameter on the reflection coefficient of an aperture antenna protected by such a material. Simulations were performed for the reflection coefficient S
11 with a change in conductivity σ
[0, 10]. The calculated values of S
11 are given in
Table 3 and shown in
Figure 9. The other dielectric parameters remain as given in
Section 3.1.1, with d = 11 mm and ε
r = 2.5 (the last best achieved values).
The results show the best value of the reflection coefficient S11 = −43.43 dB at a dielectric conductivity of 0 S/m. With increasing conductivity values, S11 decreases drastically (for example, for σ = 1 S/m, S11 = −4.85 dB).
Therefore, in all other simulation calculations, electrical conductivity is set to 0 S/m.
By comparing the relative dielectric and conductive component of the imaginary part of the complex permittivity, the importance of each of them can be determined from Equation (11). Let us consider the case in which the minimization of the reflection coefficient is achieved. For the values of electrical conductivity for which the following condition is satisfied:
<<
(in the frequency range from 1 to 2.5 GHz), the reflection coefficient has a minimum value (
Table 4).
For those electrical conductivity values for which this condition is not met (from 1.0 × 10⁻¹ to 10 S/m), the electrical conductivity component prevails, and the material is no longer considered a good dielectric. Therefore, the reflection coefficient increases significantly, as expected for a conductive material. Thus, due to moisture in the dielectric material, which causes a change in electrical conductivity of the material, and depending on moisture content, electrical conductivity can cause a significant change in the reflection coefficient S11.
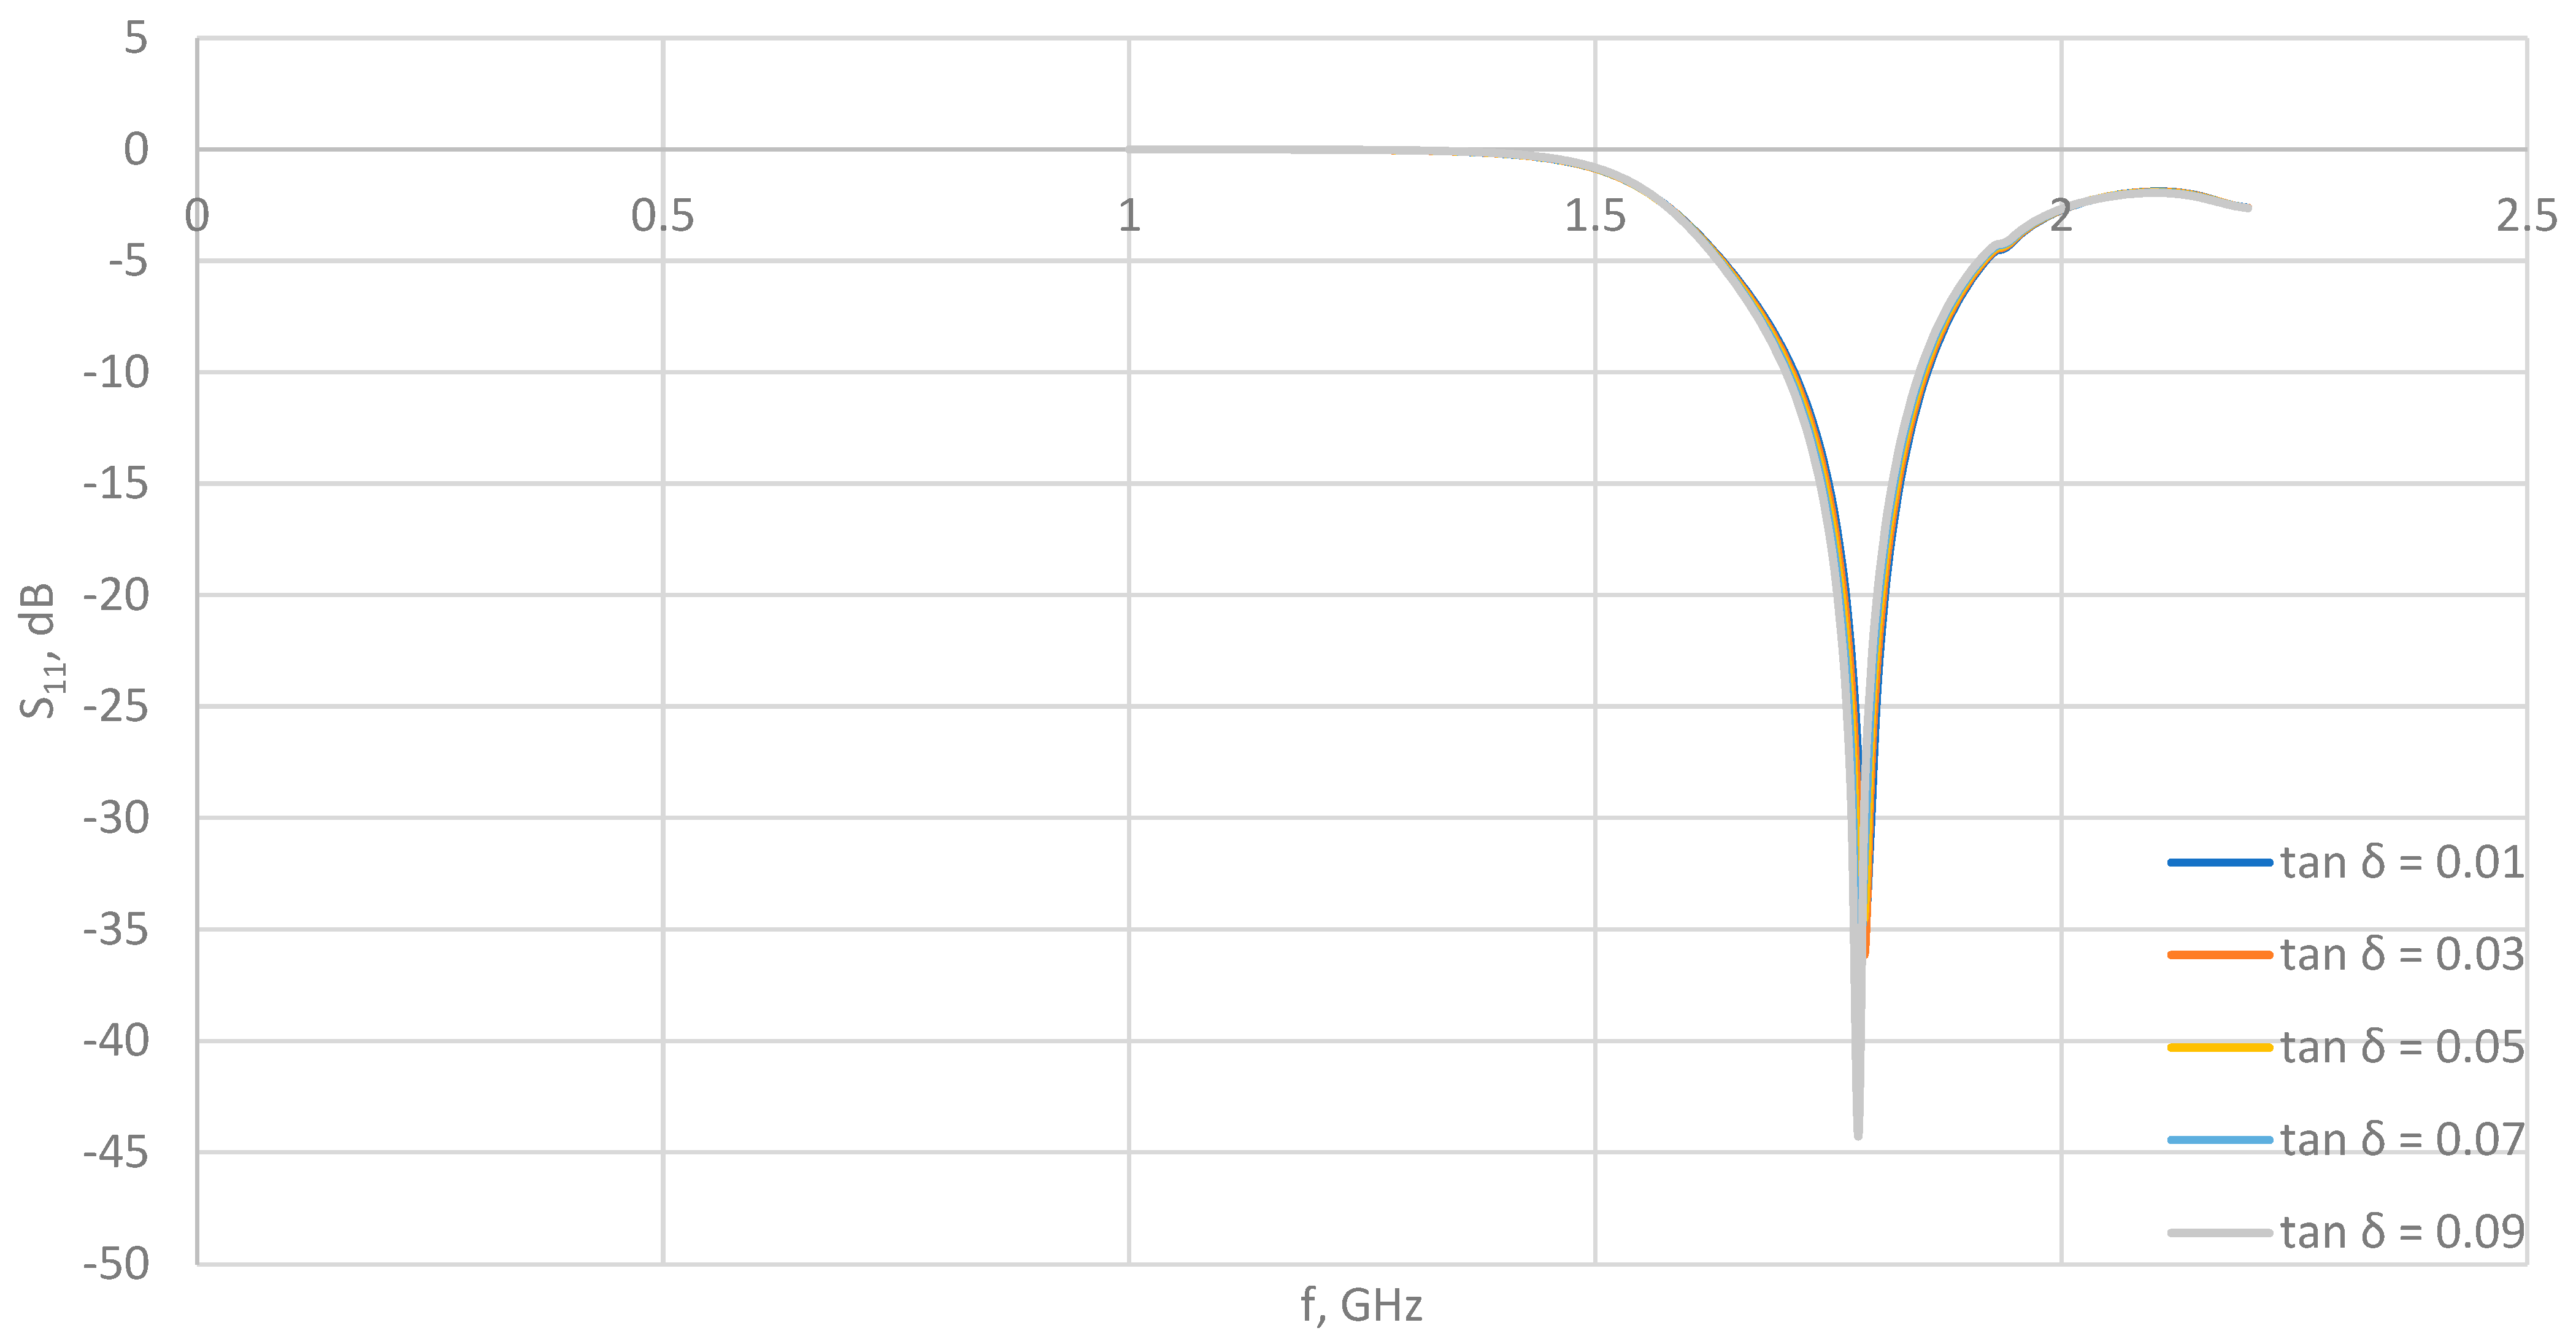
3.2.3. Influence of Dielectric Plate Dielectric Losses tan δ on the Reflection Coefficient
The imaginary part of the complex permittivity ε is a complex quantity that (
Section 2.2) indicates the dissipation in the material. Because the material we analyze is a dielectric that is not perfect, this part of the permittivity over the dielectric and conductive components speaks of losses in the dielectric and conductive part of the material that is in the electric field. In this simulation calculation, the focus is on the dielectric part of the imaginary component of the permittivity.
According to [
19], the loss tangent ranges up to about 0.09 in the frequency range of 0.5–2.5 GHz. With this tan δ range, simulations for S
11 were carried out, and the best value was achieved for tan δ = 0.09—
Figure 10 (i.e., S
11 = −43.43 dB).
All dielectric parameters were set as in
Section 3.1.1, and with the best values achieved in previous simulations.
Note: A large number of tan δ simulations were performed (very high resolution), but only the most relevant values are listed in
Table 5.
3.2.4. Influence of Dielectric Plate Relative Permeability μr and Magnetic Loss Tangent tan δµ on the Reflection Coefficient
Because only dielectrics are used as protective shields for antennas, the analysis includes materials with a value of relative permeability of approximately 1. Because the antenna is protected by dielectric materials (diamagnetic), all simulation calculations were performed for a material that has the complex permeability μ = μ′ − j μ″ = μ01 − j 0 (relative permeability is equal to 1, and plate magnetic loss tangent tan δµ = 0).
Simulation calculations were performed for changes in the real and the imaginary part of permeability (μr ranging from 0.9 to 1.1, and tan δµ ranging from 0 to 2), and they showed that a deviation from the defined values μr = 1 and tan δµ = 0 significantly degrades the value of the reflection coefficient S11.
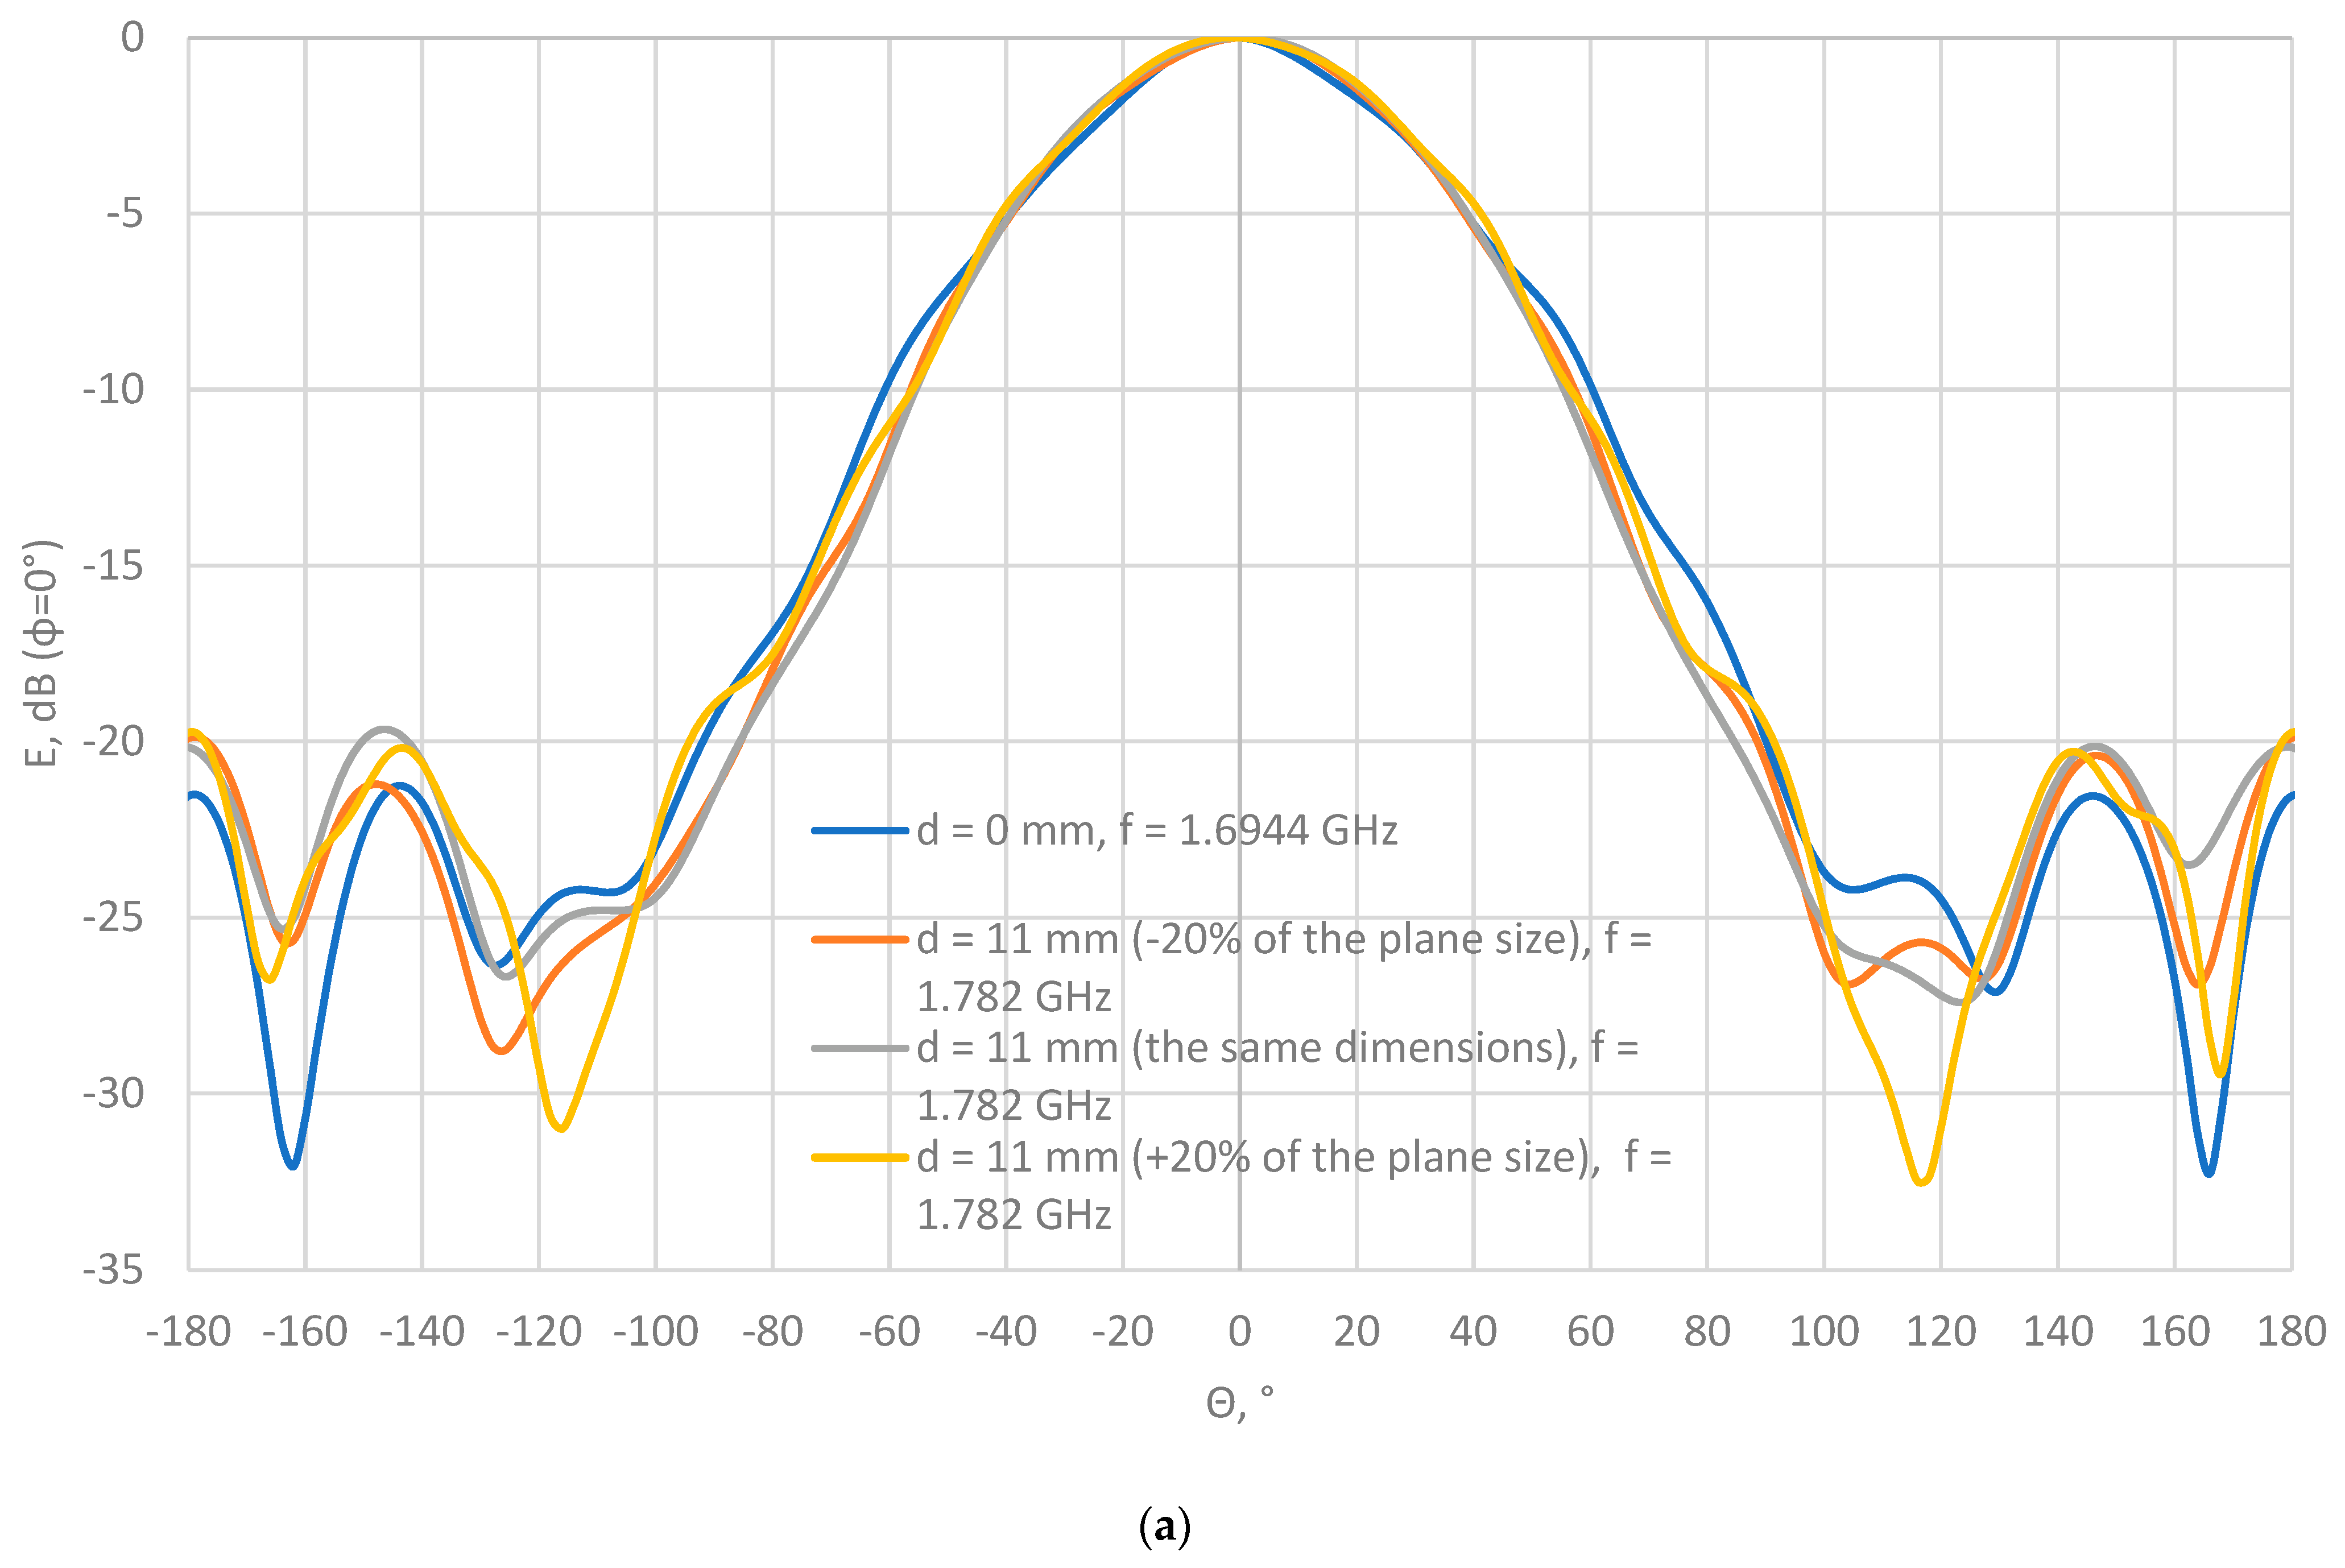
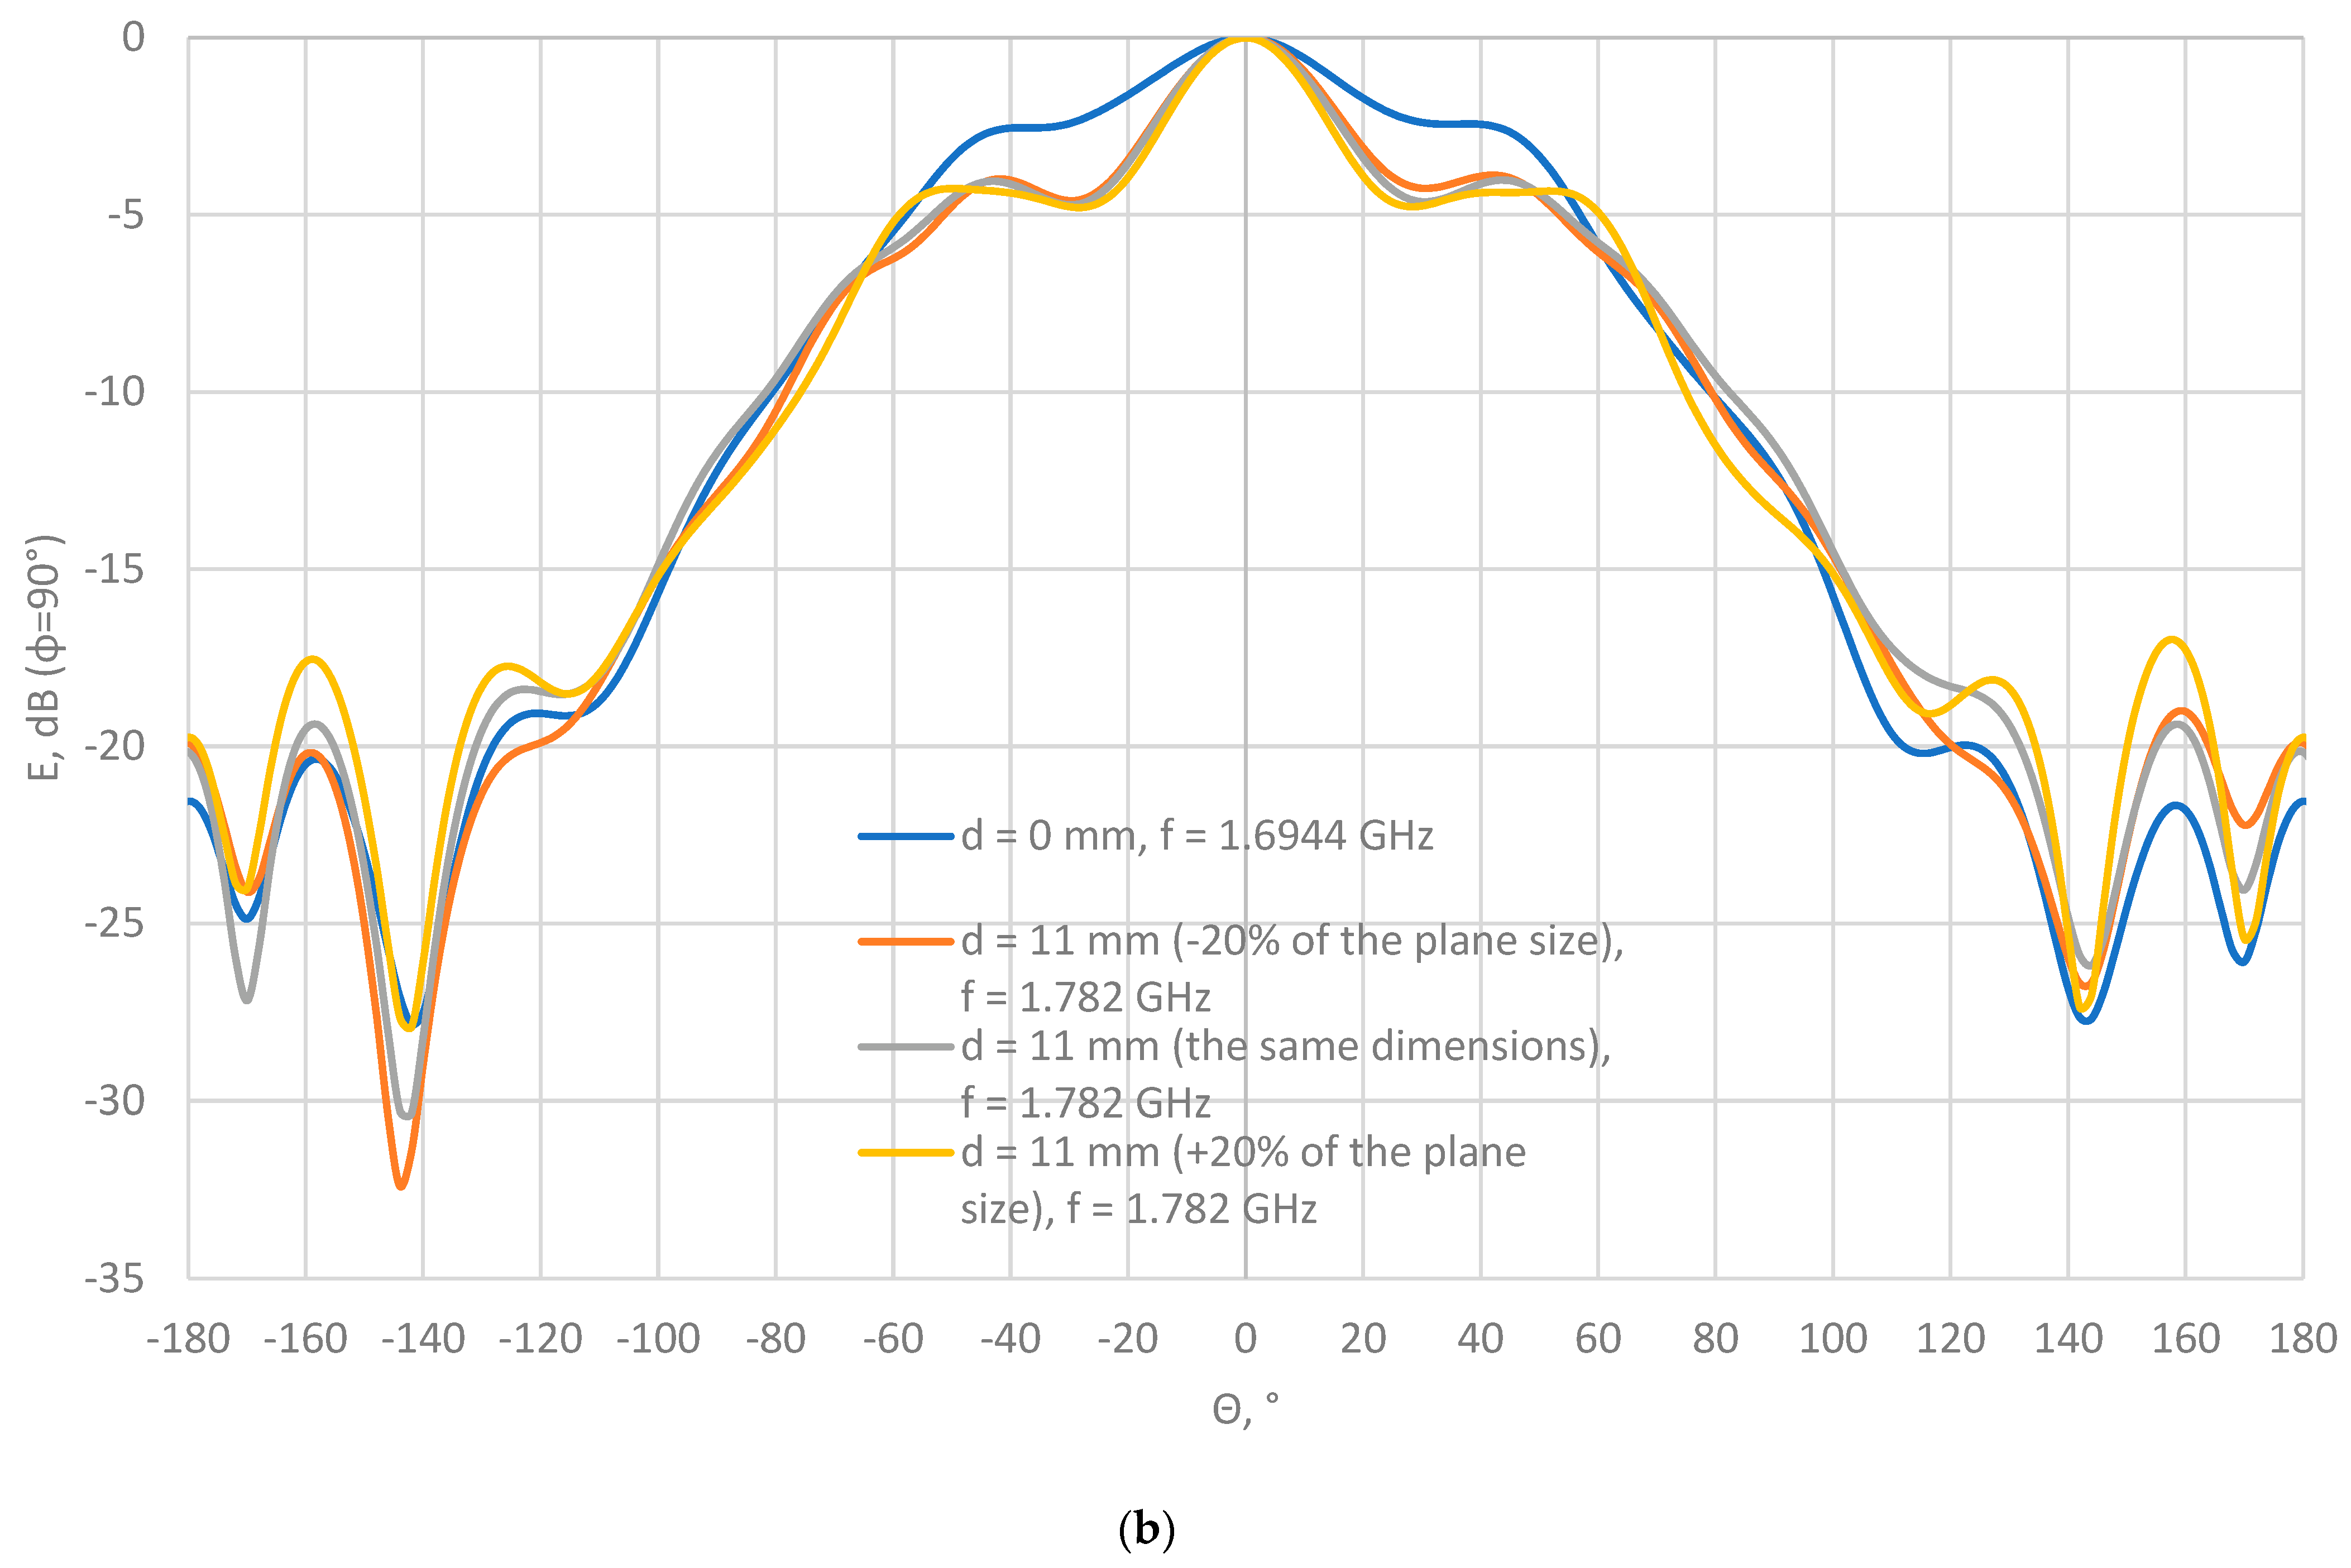
3.3. Simulation Calculation of the Radiation Pattern of a Circular Aperture Antenna with a Dielectric Plate
The effects of changes in the structural and electromagnetic parameters of the plate on the reflection coefficient of the aperture antenna with dielectric plate have been analyzed in previous subsections. It is necessary to determine whether changing the parameters of the dielectric plate while improving the reflection coefficient of the antenna distorts the radiation pattern of the antenna. Therefore, the simulation calculation results of the influence of the change in the dielectric plate parameters on the radiation pattern of the aperture antenna are analyzed in this subsection.
If we compare the radiation patterns of the aperture antenna with and without the dielectric plate (d = 0 and d = 11 mm for the same dimension of the dielectric material and the plane in
Figure 11) with the previously defined best values of the dielectric plate parameters (i.e., the thickness d = 11 mm, ε
r = 2.5, µ
r = 1, σ = 0 S/m, tg δ = 0.09, tg δ
μ = 0, h
1 × h
2 = 423 × 450 mm
2, ρ = 1200 kg·m
−3), it can be concluded that there are some changes in the radiation diagram. The largest deviations of −2.5 dB at ±25° (side lobes) and +5.0 dB at 158° (back lobe) can be seen in the
H plane and +9.0 dB at 165° (back lobes) in the
E plane, whereas deviations are negligible in the rest of the range of angles in both planes (
E and
H planes).
Furthermore, a variation in the width and length of the dielectric plate, which ranges from ±20% of the full size of the grounded plane (dimensions of the grounded plane are h
1 × h
2 = 423 × 450 mm
2), does not result in significant changes in the radiation pattern compared to the dielectric plate with dimension h
1 × h
2 = 423 × 450 mm
2 (
Figure 11). The largest deviations of +4.5 dB at ±158° (back lobes) can be seen in the
H plane, and +6.0 dB at 117 and 168° (back lobe) in the
E plane, whereas deviations are negligible in the rest of the range of angles in both planes (
E and
H planes).
Therefore, it can be concluded that the scattering at the edges of the grounded plane of such a circular aperture antenna (with an opening radius of 61 mm (0.36 λ)) with a grounded plane of dimensions 423 × 450 mm2 (2.51 × 2.67 λ) has an effect on the side and back lobes, but there is no main lobe and, therefore, it does not significantly affect the operation of this antenna. Lowering the side lobe in the H plane further slightly improves the radiation pattern.
4. Measurement Results
For long-term research to be meaningful, simulation, i.e., the simulated values of the reflection coefficient S
11, must be validated via laboratory measurements. What can be measured with certainty is S
11 for a given thickness d of the dielectric plate on the antenna. Laboratory measurements of S
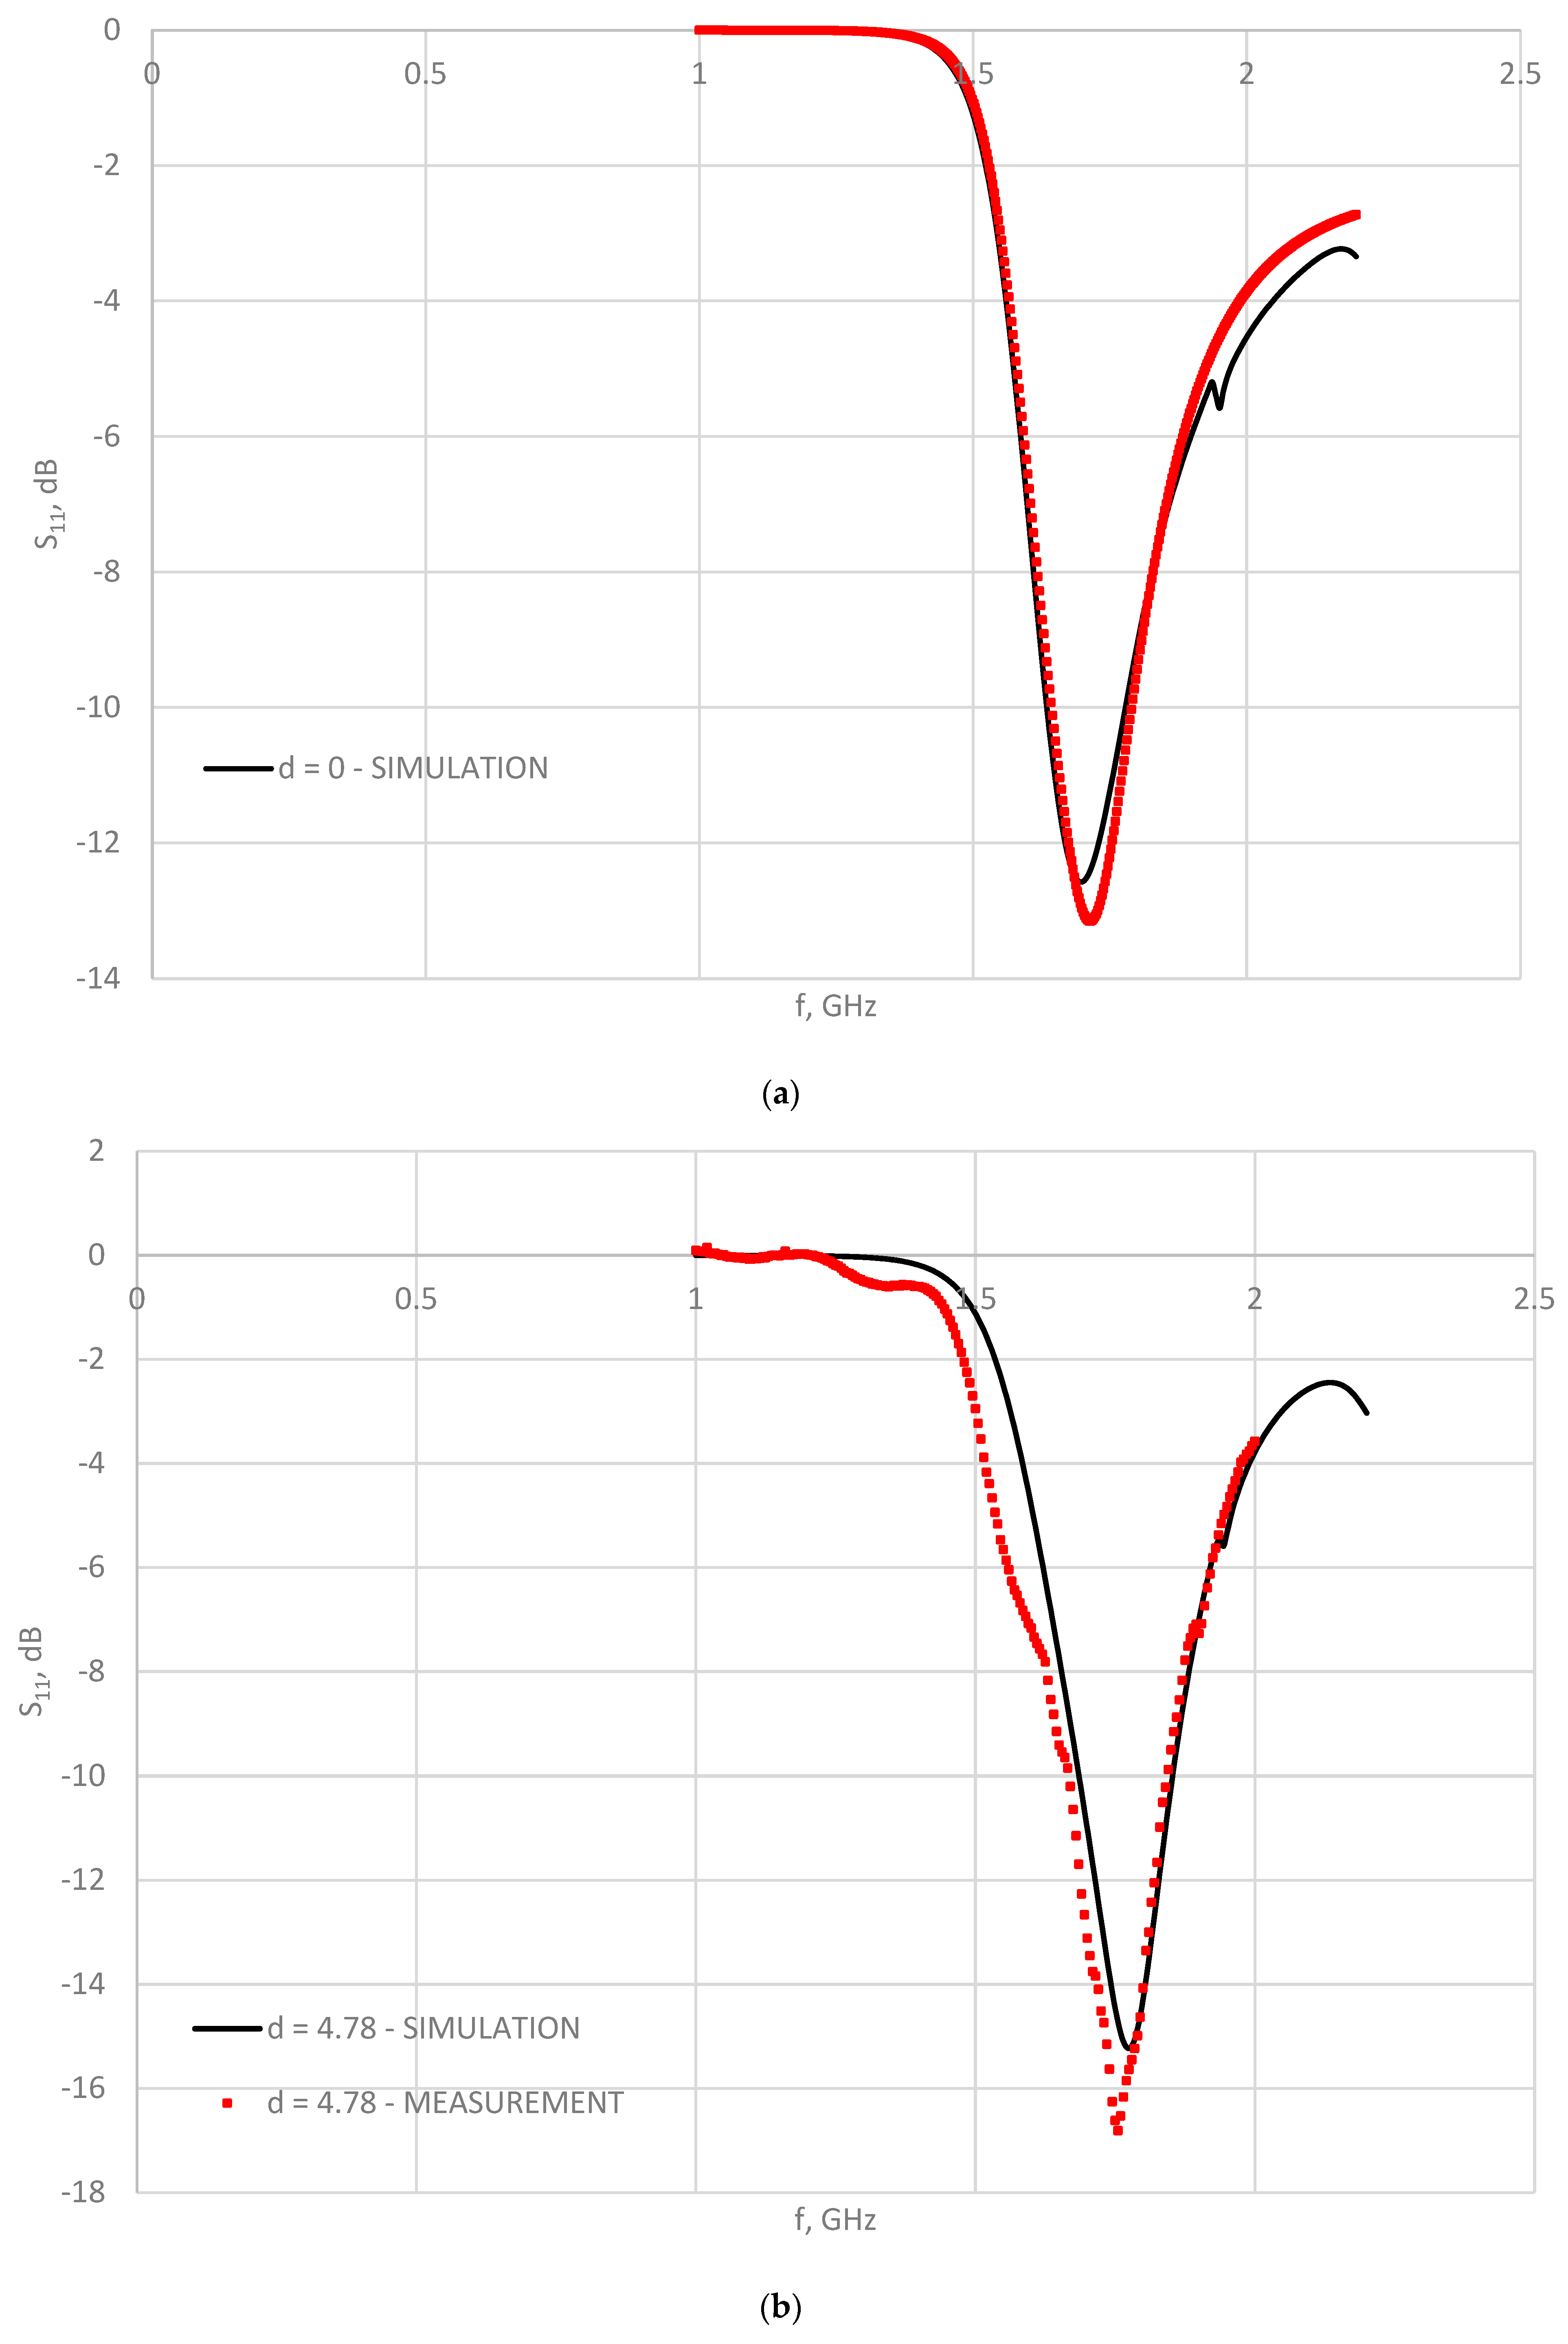
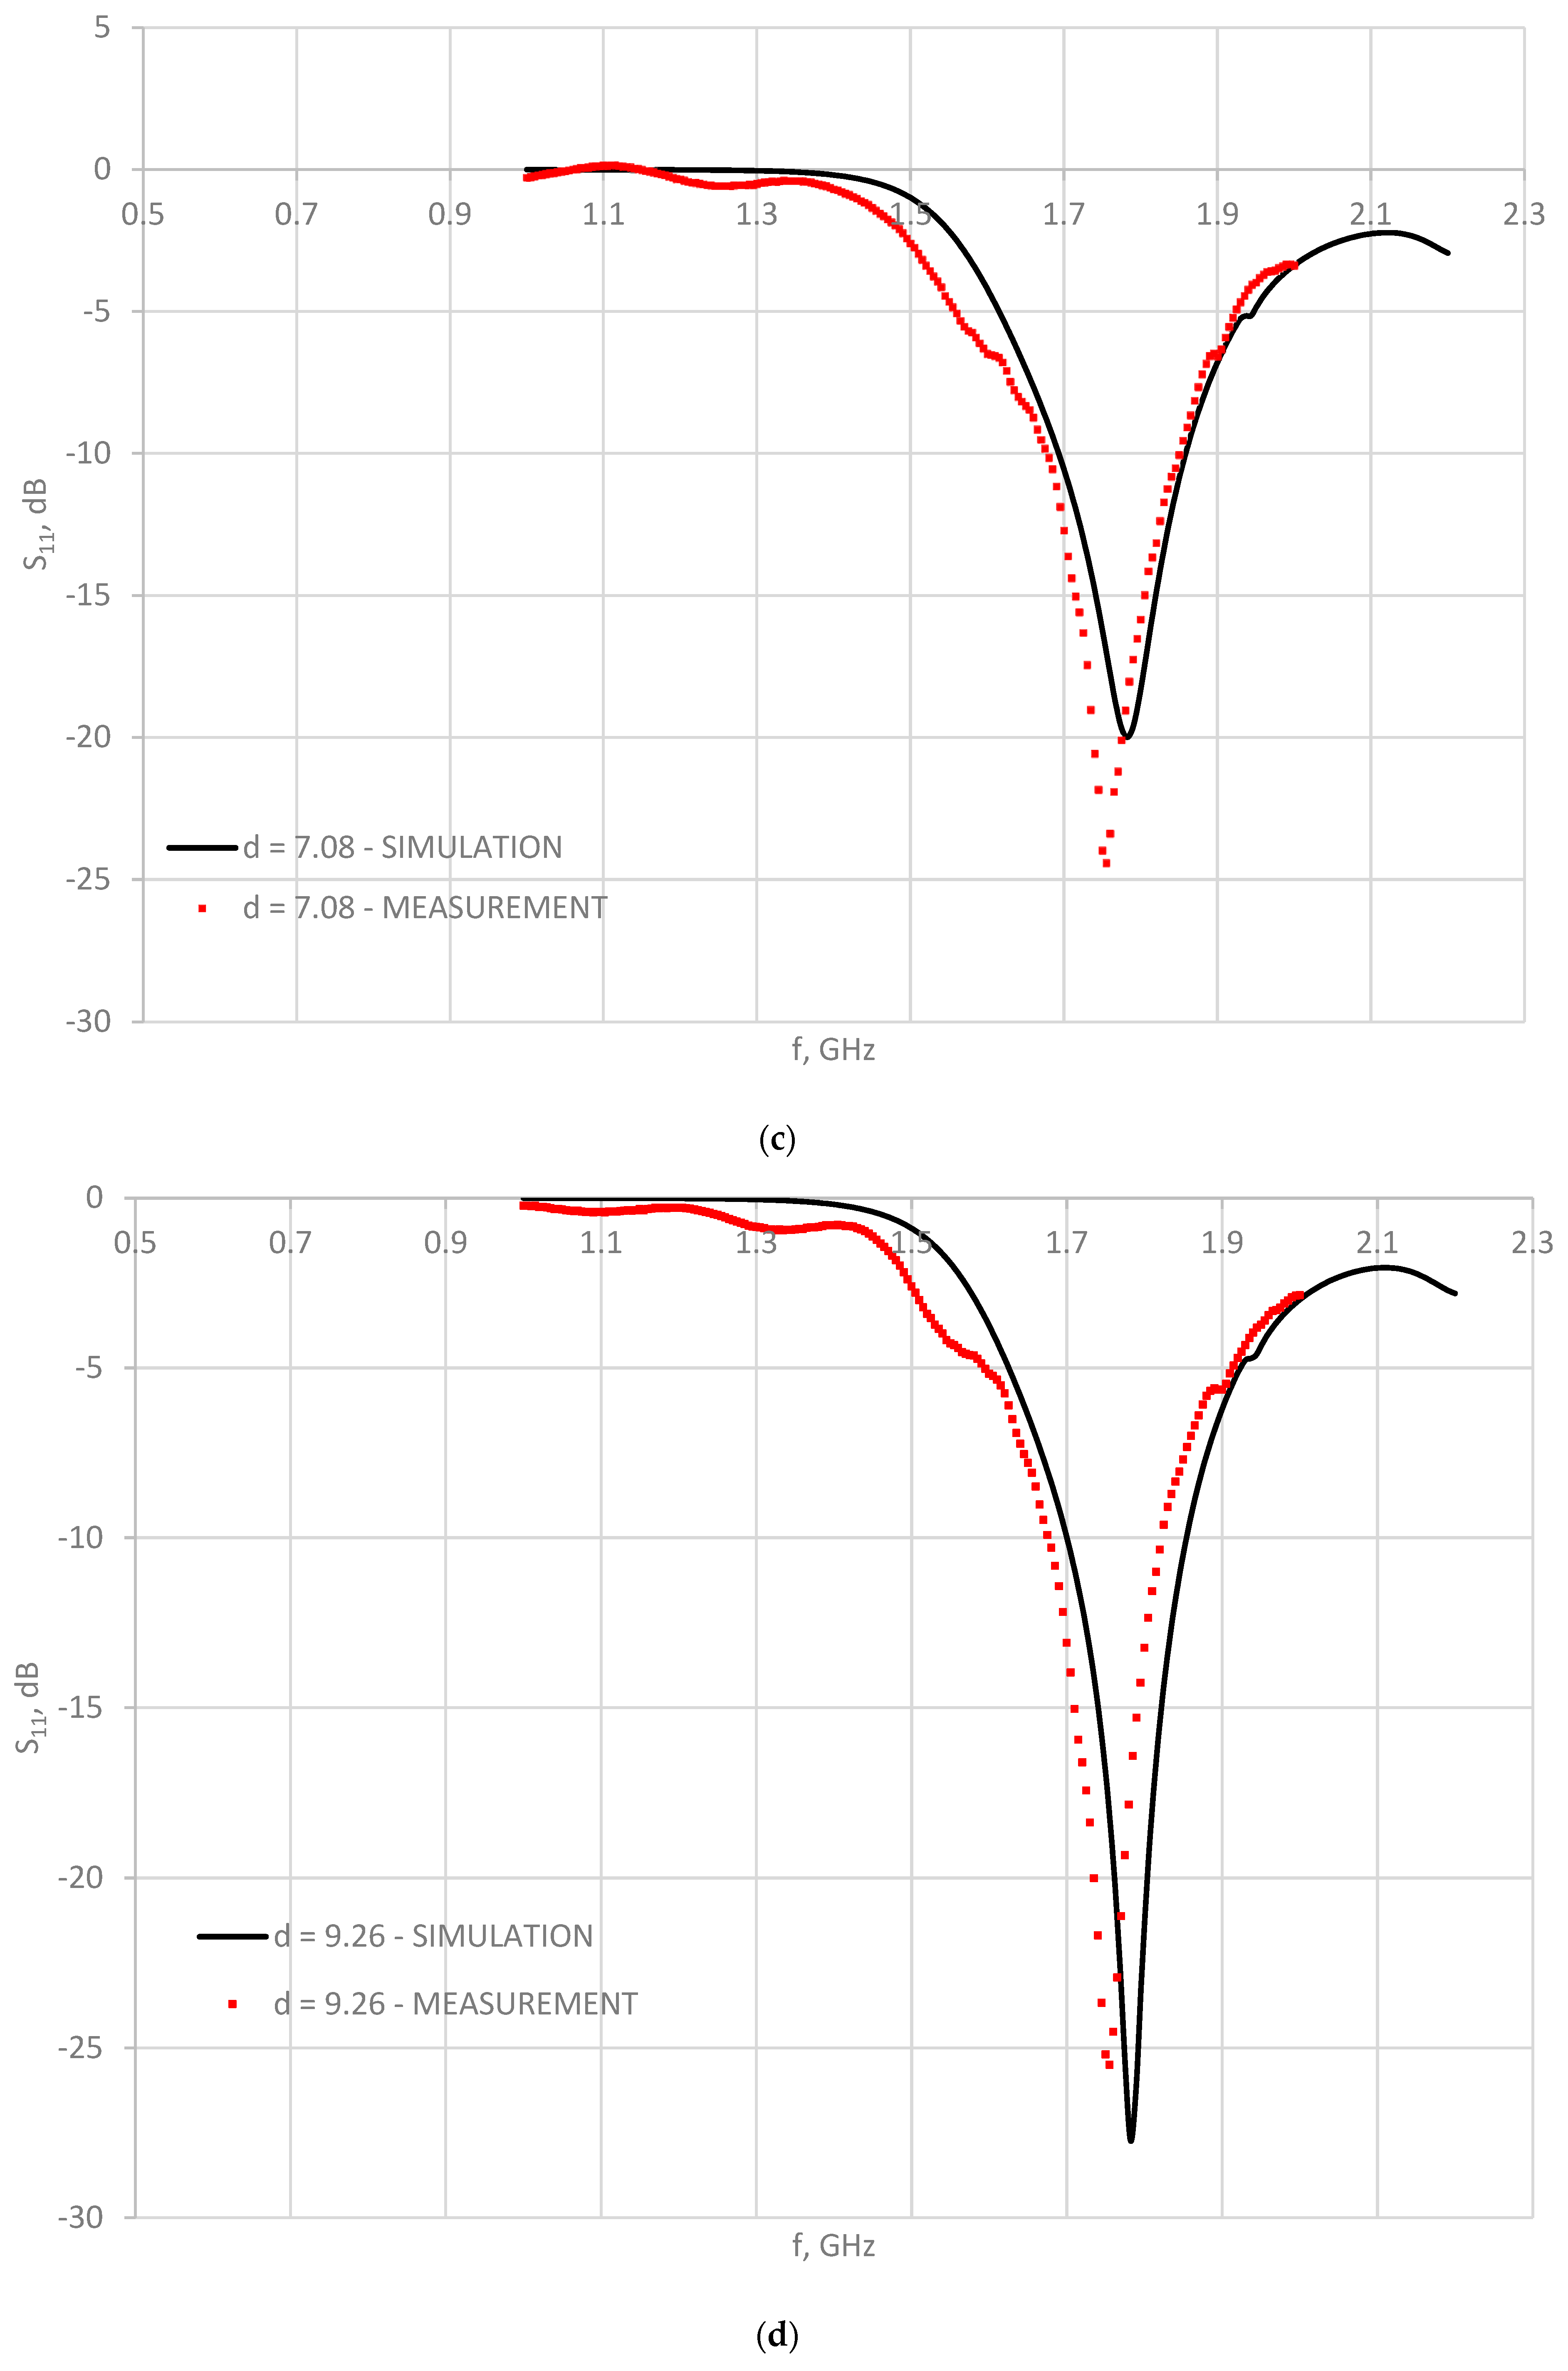
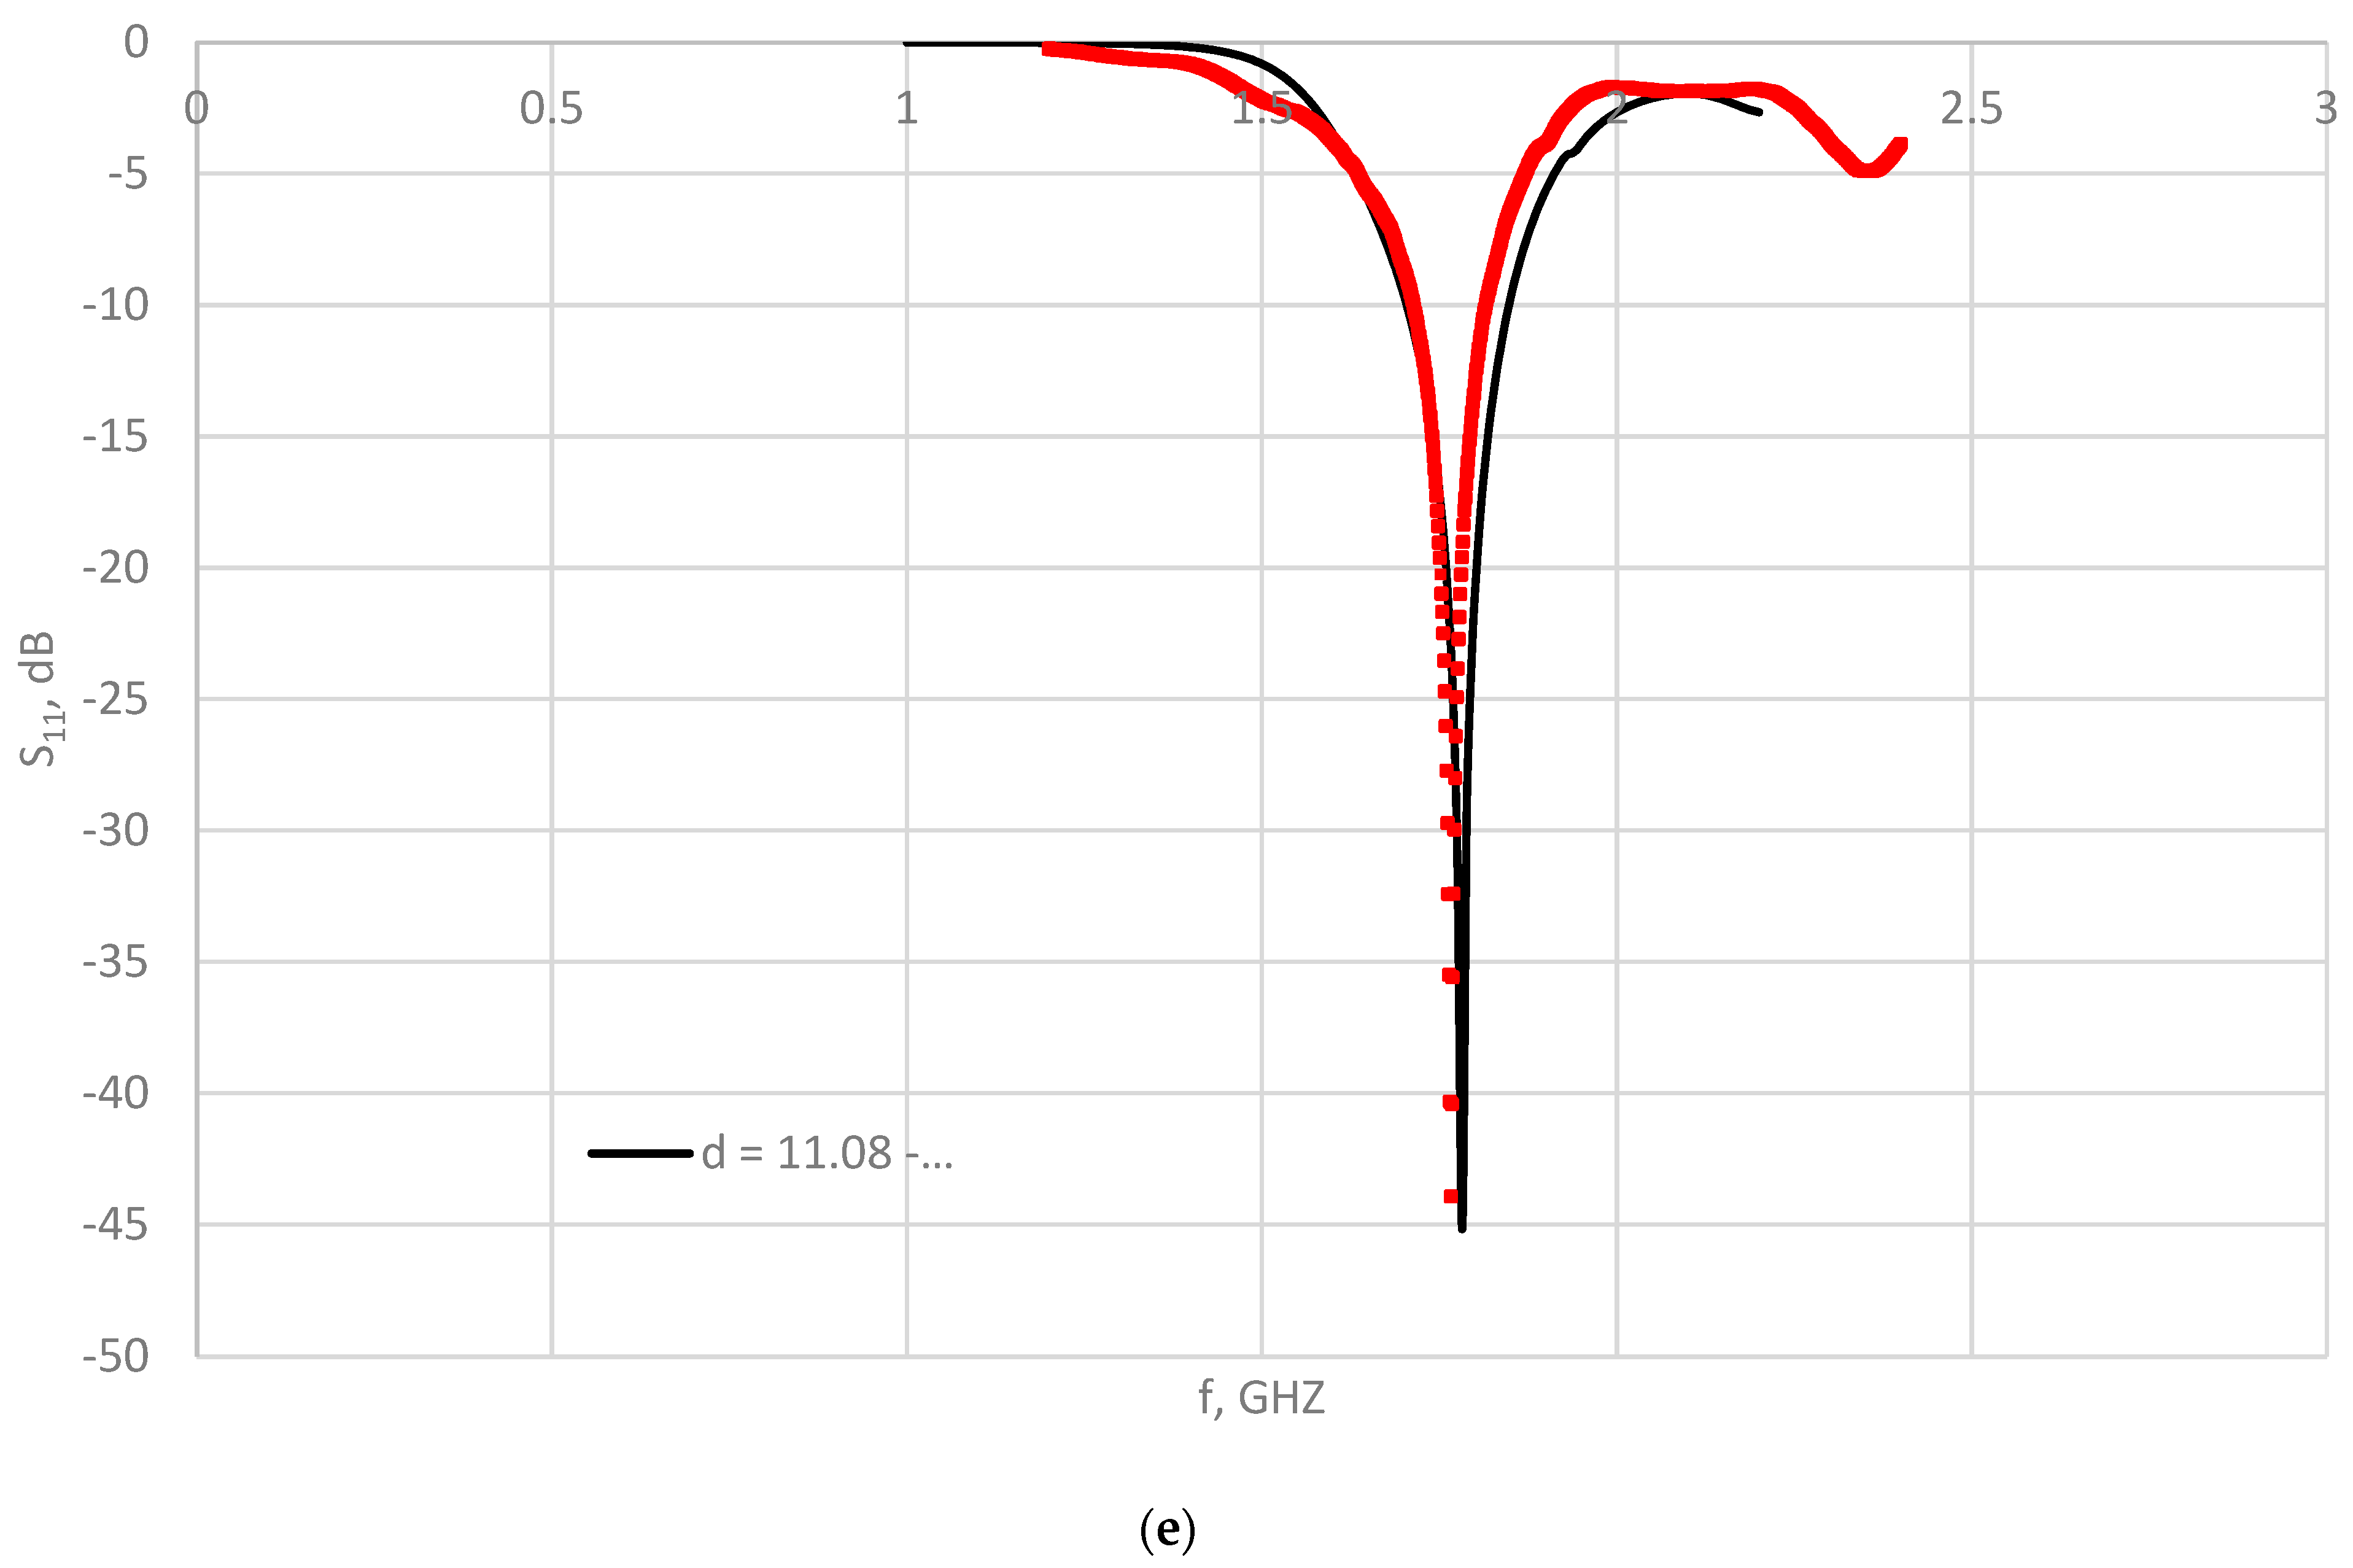
11 at the waveguide–free space boundary and the waveguide–dielectric boundary were performed for d = 0 mm, d = 4.78 mm, d = 7.08 mm, d = 9.26 mm, and d = 11.08 mm. Simulation calculation precedes the measurements for these dielectric plate thickness values by using paper as a dielectric. Comparison results of the simulated and measured values of S
11 are shown in
Figure 12a–e.
Table 6 shows the comparative values of the reflection coefficients (simulated and measured) for different values of dielectric thickness.
It can be seen that there are some differences between the simulated and the measured curves. The measured curves show a small shift towards lower frequencies. This can be explained by the fact that when the sheets of paper are stacked on top of each other to achieve the specified thickness of the dielectric plate, there is obviously an unwanted amount of air between the two sheets. This can be explained by the fact that simulation models do not take into account a number of factors that are present in the laboratory models on which the measurements were carried out. The measured results are affected by the calibration of the measuring device, the conditions under which the measurement is performed (a laboratory with an EM echo), the performance (errors) of the measurement model, and the lack of knowledge of the exact structural–geometric and electromagnetic parameters of the measured model.
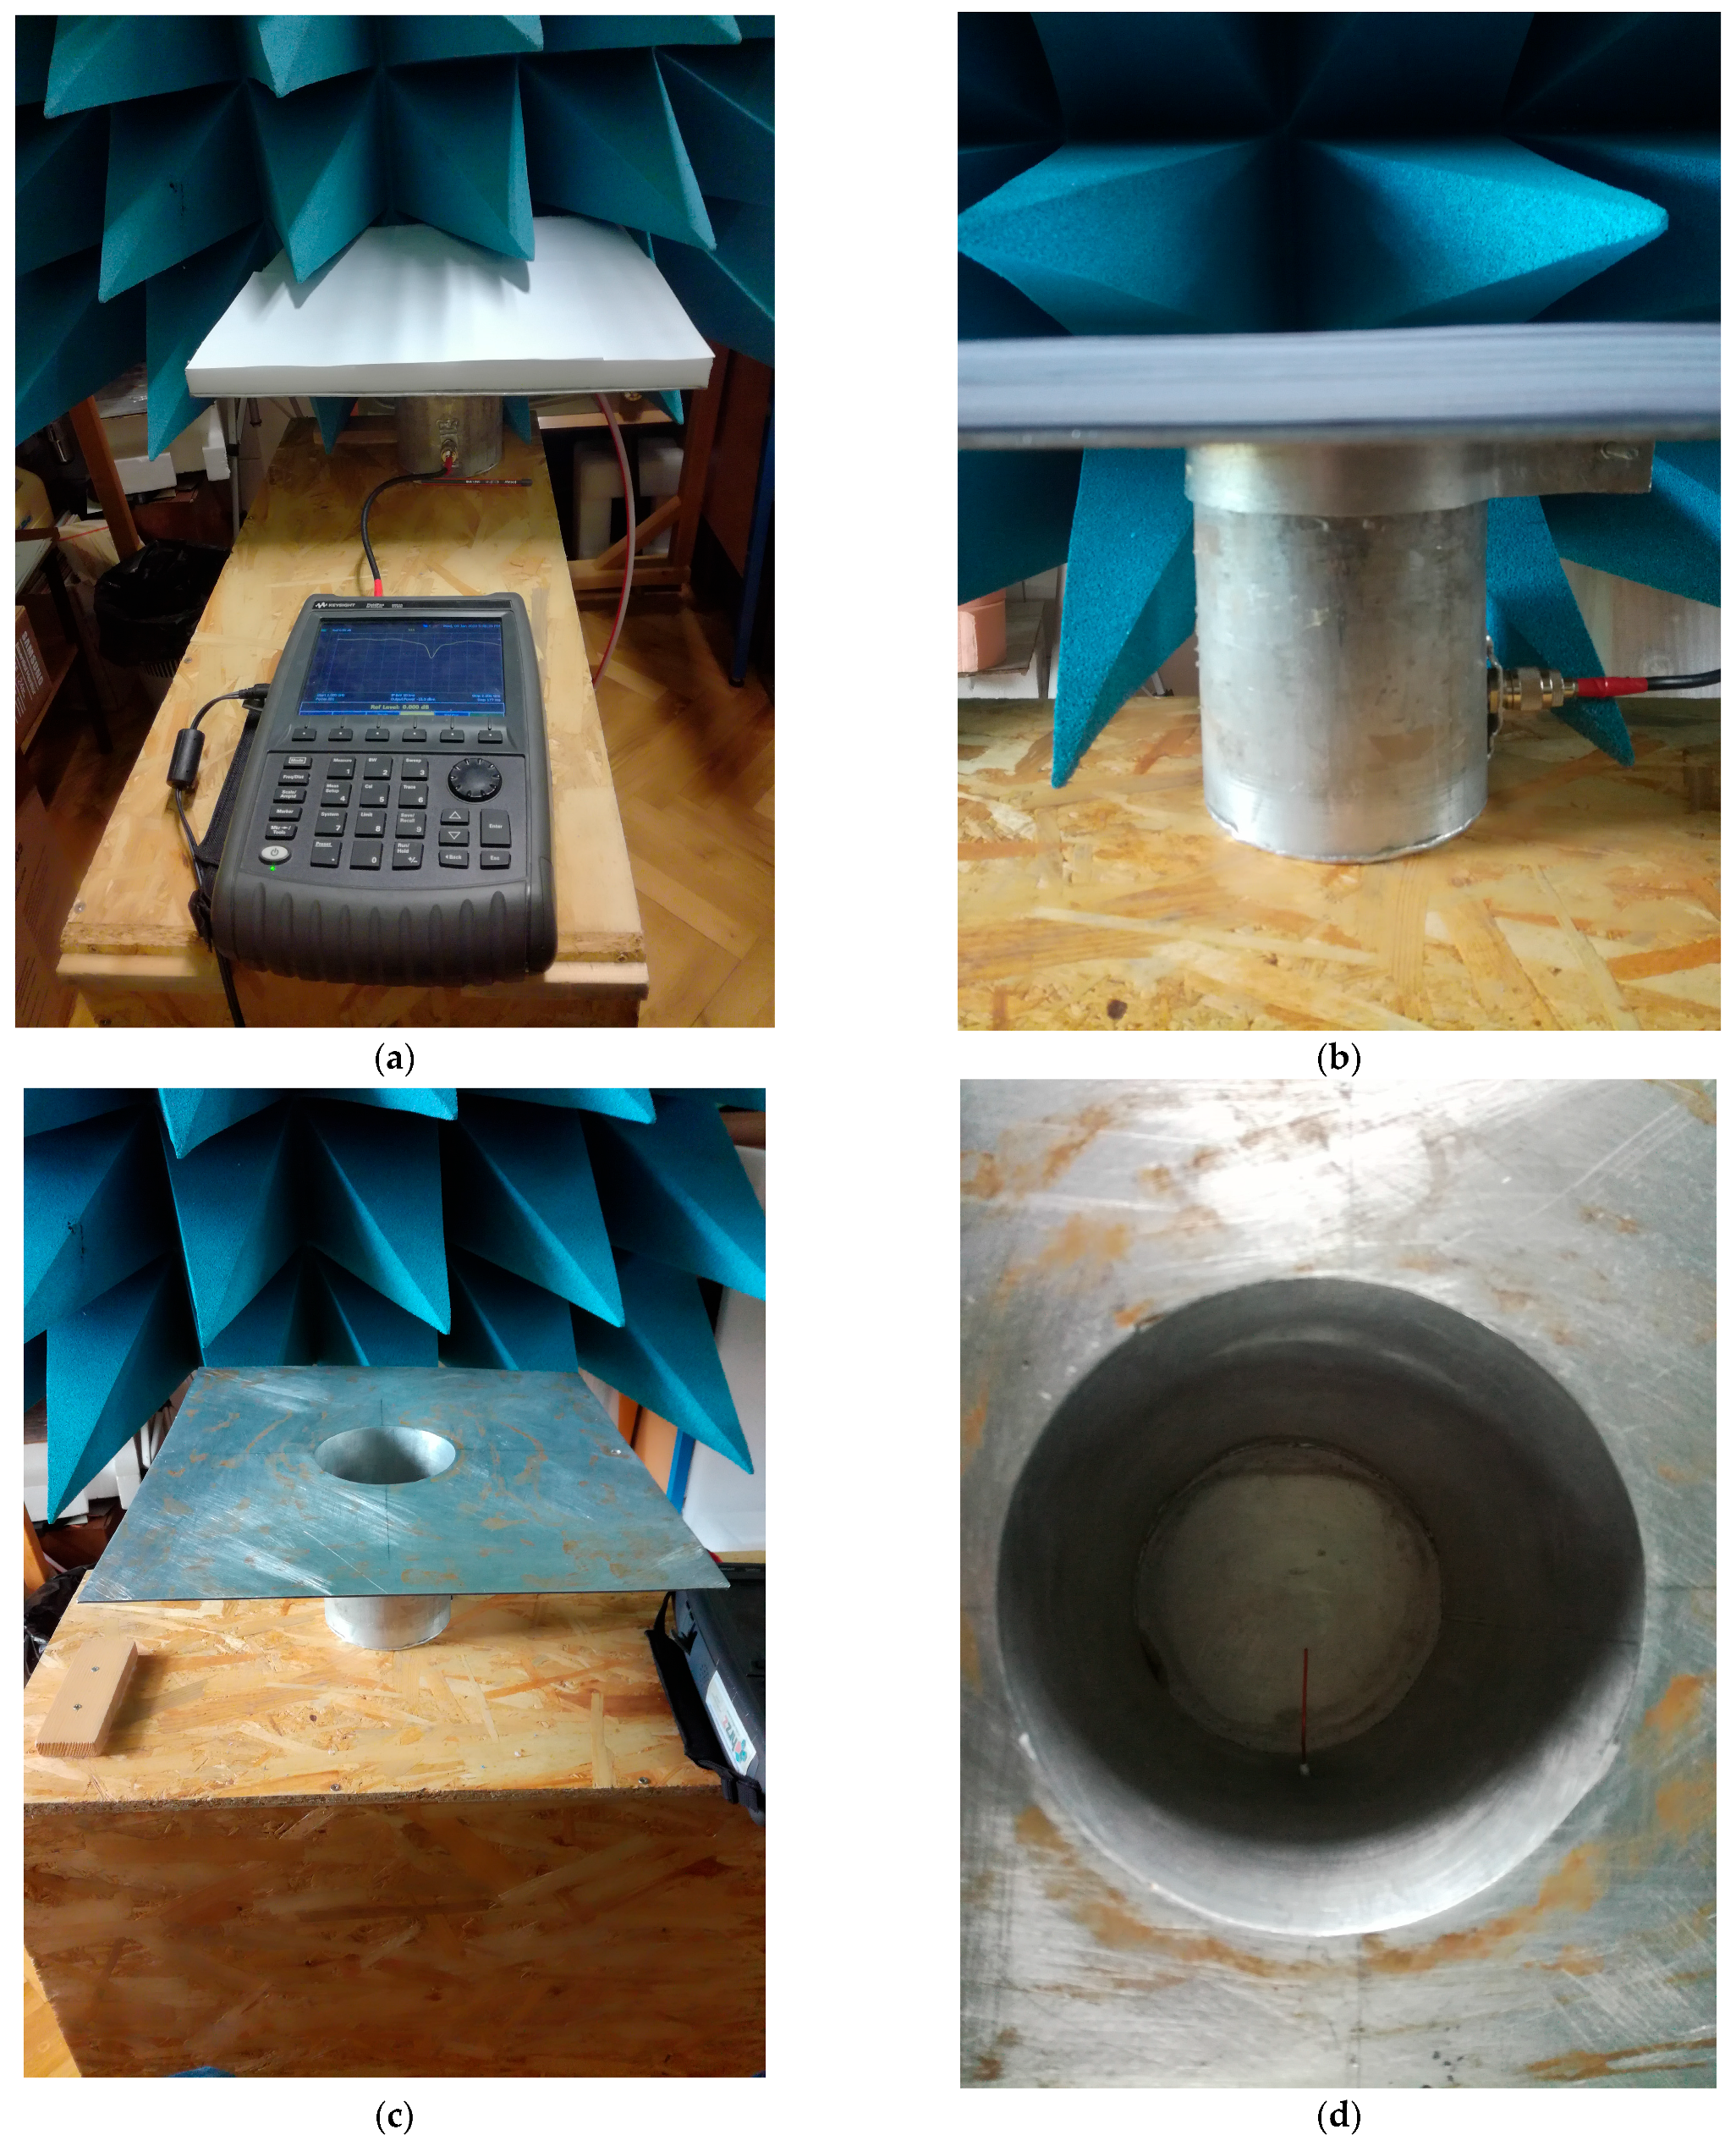
To conclude this section, the measurement of S
11 at the boundary between a waveguide-dielectric and a dielectric-free space was carried out by using an N9914A FieldFox Handheld RF spectrum analyzer, the operating range of which extends up to 6.5 GHz. The laboratory in which the reflection coefficient measurement was performed is not a chamber without an electromagnetic echo (
Figure 13).
5. Discussion
The radome placed on the antenna serves several purposes. It protects the antenna and constituent parts from external disturbances (e.g., snow, rain, wind, etc.), but research has shown that the exact choice of the material covering the antenna can significantly affect its properties and performance. The investigated materials that can constitute certain radomes are polycarbonate, Teflon, and polystyrene–dielectrics, because they are able to maintain good antenna performance and a satisfactory reflection coefficient, i.e., materials with the lowest possible dielectric constant and tangent loss.
This article analyzes the influence of all parameters (whether geometric or electromagnetic) on the change in the reflection coefficient at the aperture of the antenna covered with a dielectric. It can be concluded that by placing a dielectric plate on the antenna, the reduction in the reflection coefficient S
11 can be significantly affected, and with the proper selection of all dielectric parameters, this coefficient value can be brought to the minimum value.
Figure 14 clearly shows the situations in which no dielectric plate is placed on the antenna and in which a dielectric plate with the best parameter values achieved (d = 11 mm, ε
r = 2.5, µ
r = 1, ρ = 1200 kg·m
−3, σ = 0 S/m, tan δ = 0.09, tan δ
μ = 0) is placed on the antenna.
However, a systematic analysis of the known dielectric parameters (geometric and electromagnetic) and their influence on the reflection coefficient and, thus, on impedance matching, as well as the choice of the frequency range of the antenna itself, was carried out as a part of this study. The present article is intended as a detailed extension of previous studies on the influence of just two parameters (thickness and permittivity) on impedance matching or the reflection coefficient [
10,
12]. This article analyzes the influence of all parameters of the dielectric plate. The geometrical parameters taken in this analysis are the thickness d and width/length h
1/h
2 of the dielectric plate. The electromagnetic parameters used in this analysis are the real and the imaginary part of permittivity (ε
r, tan δ) and electrical conductivity of the dielectric plate (σ). Simulation calculation and analysis included other structural and electromagnetic parameters of the dielectric plate (density of the dielectric material, relative permeability, and magnetic loss tangent (ρ, µ
r, and tan δ
µ)), but the results showed that in the range of real values of dielectric parameters for the materials used for the dielectric plate, those three parameters had no significant influence on the reflection coefficient. Finally, simulation is validated with measured values. The aim of the study was to achieve the lowest possible reflection coefficient of the circular aperture antenna in order to accomplish the best impedance matching of the antenna itself.
The first part of the study involved simulation of the reflection coefficient of the antenna aperture fed by a circular waveguide using Ansys HFSS simulation software. The parameter analyzed, which significantly affects the performance of the antenna, is the thickness of the dielectric plate on the aperture. The thickness d ranges from 1 to 13 mm, and studies have shown that the best value of S11 = −43.43 dB is obtained for d = 11 mm.
A very significant contribution to the properties of the antenna is made by the change in the permittivity of the dielectric plate because it is basically the measure of the energy stored in the dielectric. In the simulations, the permittivity εr ranges from 1 to 10, and the best result of S11 is obtained for εr = 2.5. This εr value corresponds to the relative permittivity of the paper used as a dielectric material in the measurements, but such permittivity has some other materials suitable to be used for the antenna radome.
The total permittivity also consists of an imaginary component, the size of which provides information on how dissipative the dielectric material is in relation to the applied electric field. This component, in proportion to the aforementioned real part of the dielectric constant, forms loss tangent tan δ. The loss tangent tan δ ranges from 0.01 to 0.098, and the simulations showed the minimal value for tan δ = 0.09.
Electrical conductivity of the dielectric plate σ takes values from 0 to 10 S/m in the simulations, and, as expected, it showed the minimal value for σ = 0 S/m.
At the very end of the study of antenna behavior with and without a dielectric plate on the aperture, laboratory measurements of the reflection coefficient were obtained by using an N9914A FieldFox Handheld RF spectrum analyzer. The chamber in which laboratory measurements were obtained is a chamber with an electromagnetic echo. Because the laboratory is not isolated from electromagnetic interference and the dielectric plate can never be arranged as in the simulations (in practice, homogeneity of the dielectric plate is not perfect: there is an undesirable amount of air between the layers of paper), there is some variation in the values obtained for the reflection coefficients S
11. This statement is also evident in
Figure 12a–e, in which the graphs of the measured values show a frequency shift to the left, i.e., to lower frequency values. Another circumstance favors the difference between the simulated and the measured values; in practice, it is very difficult to adjust dielectric parameters to the value used by the simulation. The only parameter value that can be measured very accurately is the dielectric thickness d.
The focus of this article is not on the effects of edge scattering of the grounded plane of the aperture antenna. However, because the effects of edge scattering are visible on the side and back lobes, it is evident from this article that the effect of the finite edge must be included in the calculation in order to obtain more accurate results of the radiation patterns.
The measurement was possible for a larger number of dielectric thicknesses, and it was found that for the given aperture antenna, a dielectric plate thickness of 11.08 mm gives the minimum value of the reflection coefficient S
11 of −43.93 dB at the frequency of 1.7550 GHz. The minimum reflection coefficient obtained by additional simulation for d = 11.08 mm is −45.17 dB at the frequency of 1.7820 GHz. Apart from d, which is variable, other parameters are set within the limits given in [
17,
20].
Despite the differences mentioned between the measured and simulated values, it can be stated that the curves of the reflection coefficients match very well. Furthermore, the assumption was confirmed that by adjusting the value of the geometric and electromagnetic parameters of the dielectric plate placed on the antenna, the reflection coefficient can be significantly improved (minimized), which ultimately results in good impedance matching of the antenna opening.
In the context of this investigation (simulations and measurements), it was assumed that a dielectric is a linear, homogeneous, and isotropic material.
Future work will include investigations of the performance of an aperture antenna with multi-layer dielectric plates, dielectric plates composed of nonlinear materials and materials of different shapes, and dielectric plates of different positioning on the antenna aperture. Possible different excitation modes will also be analyzed in future work.


