Abstract
The chestnut tree (Castanea sativa, Mill.) is a widespread plant in Europe whose fruits and wood has a relevant economic impact. Chestnut wood (CW) is rich in high-value compounds that exhibit various biological activities, such as antioxidant as well as anticarcinogenic and antimicrobial properties. These metabolites can be mainly divided into monomeric polyphenols and tannins. In this piece of work, we investigated a sustainable protocol to isolate enriched fractions of the above-mentioned compounds from CW residues. Specifically, a sequential extraction protocol, using subcritical water, was used as a pre-fractionation step, recovering approximately 88% of tannins and 40% of monomeric polyphenols in the first and second steps, respectively. The optimized protocol was also tested at pre-industrial levels, treating up to 13.5 kg CW and 160 L of solution with encouraging results. Ultra- and nanofiltrations were used to further enrich the recovered fractions, achieving more than 98% of the tannin content in the heavy fraction, whilst the removed permeate achieved up to 752.71 mg GAE/gext after the concentration (75.3%). Samples were characterized by means of total phenolic content (TPC), antioxidant activity (DPPH· and ABTS·), and tannin composition (hydrolysable and condensed). In addition, LC-MS-DAD was used for semiqualitative purposes to detect vescalagin/castalagin and vescalin/castalin, as well as gallic acid and ellagic acid. The developed valorization protocol allows the efficient fractionation and recovery of the major polyphenolic components of CW with a sustainable approach that also evaluates pre-industrial scaling-up.
1. Introduction
Every year, all around the world, a huge amount of biowastes is generated from the agri-food production chain. Instead of considering them wastes that need to be disposed of, applying the concepts of circular economy and green extraction [1], they can result in a source of high-added-value compounds, rich in phenolics and antioxidant metabolites, concurrently saving money, recycling, and reducing residual matrices that should require disposal [2,3]. The chestnut tree (Castanea sativa, Mill.), also known as European chestnut, is a deciduous plant belonging to the Fagaceae family; it can be considered a tree of inestimable cultural and historical value for the foothill regions [4]. Present in the Mediterranean area since prehistoric times, before the import of potatoes and corn from America, chestnuts represented an indispensable source of carbohydrates in Europe [5]: this fact earned it the common name of “breadfruit”. The chestnut tree has always been cultivated to produce timber and for its fruit [6], rich in bioactive compounds, widely extracted and used in different applications [7,8]. Besides the common applications, chestnut wood (CW) is also attractive because of the presence of different type of extractives, in particular, polyphenols such as phenolic acids and tannins. This class of molecules, belonging to the larger family of plants’ secondary metabolites, is bioactive, with widely studied features [9]; for instance, they possess antioxidant [10], anti-inflammatory [11], antimicrobial [12], and anticancer properties [13]. In particular, the antioxidant power is generated by its capacity of scavenging reactive oxygen species (ROS) [14]. Compounds that can be derived from CW side-products lead to the provision of high-added-value substances, avoiding their synthesis and providing advantages for human health [15,16,17].
Furthermore, CW is a rich source of another class of complex polyphenolic molecules: tannins. They are commonly used in the leather industry, in cosmetics, and in the oenological field. This group of molecules are subdivided into Condensed (CTs) and Hydrolysable (HTs) tannins. The former is represented by polymers of flavonoids, while the latter is composed of a sugar moiety linked, by an ester bond, to ellagic and gallic acid units, forming, namely, ellagitannins and gallotaninns. The main compounds of this family include vescalagin and castalagin, positional isomers which differ only in the position of the OH- group at the C1 of the glycosidic chain [18]. Generally, the extraction protocols for polyphenol and tannin recovery involve both hot water maceration [19] and the use of organic solvents [20] or aqueous solution of them. In literature, it is possible to find a large number of works concerning the exploitation of chestnut residues aiming to extract polyphenols and other bioactive compounds, in different conditions, both by conventional solvent extraction [21] or by new green technologies. Among the most exploited green approaches, it is possible to enumerate ultrasound-assisted extraction (UAE), supercritical CO2 extraction [22], the use of ionic liquid [23], and deep eutectic solvents (DESs) [24].
The extractive protocol chosen, including the type of solvent, the temperature, and the applied technologies, can greatly affect the yield and the qualitative composition of the product [25]. Typically, polyphenol extraction involves the use of organic solvents leading to a final product characterized by the distribution of different compounds. For instance, aqueous ethanol is effective for the extraction of phenolic compounds with high DPPH radical scavenging activity [26]. Methanol is commonly considered efficient in the extraction of lower-weight polyphenols, whilst for heavier molecules (such as flavanols), aqueous acetone is usually selected [16]. In addition, ethanol is also widely applied for extraction purposes, being a GRAS solvent (Generally Recognized As Safe). Therefore, residual quantities in the final extract does not affect the safety of the products [27].
According to the ecological transition and the current necessity to deal with green approaches, several technologies have been developed and exploited with the aim of reducing solvent exploitation and saving money and energy, without affecting the overall features of the final products. In particular, several enabling technologies have been exploited to recover different metabolites from the most diverse matrices such as seaweeds [28,29], Cannabaceae [30,31], various residues from food processing [32,33] and also lignocellulosic materials [34,35]. In general, all these approaches focused their attention on achieving high-quality natural compounds [36]. In this work, the focus was pointed at water extraction and, in particular, its subcritical state, achieved by MW-assisted or conventional heating, both at the lab and semi-industrial level. Several other studies have already investigated subcritical water extraction (SWE) on different types of natural sources, including chestnut shell [37], bark [38], and bur, while CW is almost poorly studied. According to literature, few works are available concerning the investigation of CW water extraction. Some examples are present at relatively low temperatures (60–80 °C) [39], and also in subcritical conditions, by exploiting pressurized hot water extraction [39,40]. To the best of our knowledge, no extraction protocols of CW have been developed on MW-assisted systems, exploiting water in a subcritical state.
Water is an easily usable and non-hazardous solvent [41], capable of dissolving a huge variety of compounds and, in particular, polar molecules due to its high polarity. On the other hand, polyphenols and other compounds, desirable for extraction purposes, are characterized by a contained polarity. Therefore, using water in subcritical conditions can be a viable choice, exploiting the modification of the temperature-dependent solubility. Indeed, remaining above the boiling point and below the critical point (T: 374 °C), but in the liquid state (by means of an adequate counter pressure), the physico-chemical characteristics change. In particular, the polarity of the solvent can be tuned by choosing the required temperature, relying on the compounds of interest to be extracted, according to their structural properties [42,43].
The extraction of natural compounds from the raw material is a fundamental step, but the recovery and the isolation of the extractives are also crucial processes. The aqueous medium solubilizes the molecules of interest that must be then purified and separated from the extraction mixture [44]. The post-extraction operations also play an important role, from an industrial point of view, because they can account for 40/80% of the total cost of the production process [45]. For this purpose, different technologies are available, both conventional and innovative ones. Various conventional techniques, such as HPLC, possess a high capacity to discriminate between different compounds, achieving a high final purity. Unfortunately, these protocols usually employ their own analytical applications and are not feasible on a production scale. The implementation of preparative systems (prep-HPLC) widened the exploitability, but maintained high costs, thus being suitable only for extremely high-added-value compounds (i.e., pharmaceuticals). In the last decades, a growing interest has been addressed towards membrane filtration systems. This technique, based on the selective permeation of porous membranes with a pressure-driven process [46], allows the separation of desired compounds [47] with a simultaneous concentration of the sample, according to the mesh [48,49]. Several applications can be achieved according to the goal, depending on the system characteristics. Indeed, the molecule fractionation range depends on the molecular weight cut-off (MWCO)—leading to microfiltration (MF), ultrafiltration (UF), nanofiltration (NF), or reverse osmosis (RO)—and the membrane material (i.e., polysulphonic, polyamidic polymers, or ceramic) [46]. Membrane processes offer several advantages, such as saving energy and chemicals, being flexible and easy to control, with low operational and maintenance costs, and a low working temperature with the possibility to integrate a cooling system [50]. Moreover, because of all those typical features, this system can be considered to be easily scaled-up and exploited in a large-volume application [51,52].
In literature are reported some examples of membrane application to purify and concentrate extracts, derived from several natural sources, such as almond skins [53], Eucalyptus bark [54], and chestnut shells [55].
The aim of this work is to investigate the efficiency of a sequential extraction protocol, performed with SWE on CW. Its comprehensive purpose is the recovery of the monomeric polyphenol and tannin fractions. While exploiting this approach, two main goals were pursued: achieving high overall process yields and operating a “pre-fractionation”, between the two different metabolite classes, only by performing selective extraction at different working temperatures.
In the literature are reported some works studying the sequential extraction [56] of various vegetal matrices, exploiting several technologies, both conventional [57,58] and non-conventional ones, e.g., supercritical and subcritical fluid extraction [59] and UAE [60,61], in cross-flow mode. This procedure is exploited mainly in order to obtain higher yields and to preserve sensitive compounds [62].
In conclusion, since there are no previous studies investigating this approach on CW by using SWE, this piece of work focused attention on sequential extraction protocol optimization, extending the study on the downstream and the process scale-up, paving the way towards industrial feasibility.
2. Materials and Methods
A summary of adopted abbreviations is reported in Table 1.

Table 1.
List of abbreviations.
2.1. Chemicals
Reagents for colorimetric assays (Folin–Ciocalteau, DPPH·, sodium carbonate, ABTS·) and solvents were purchased from Sigma-Aldrich (St. Louis, MO, USA). Acetonitrile CHROMASOLV® (gradient grade, for HPLC, 99.9%) for LC-MS analysis was purchased from Sigma-Aldrich, and Milli-QH2O was obtained in the laboratory using a Milli-Q Reference A+System (Merck Millipore, Burlington, MA, USA).
2.2. Chestnut Wood Matrix
CW matrix was gently provided by SilvaTEAM SpA (San Michele Mondovì, Italy). Two different meshes were used: fine sawdust for lab-scale experiments, (CWS, approx. 1 mm) and chips (CWC, approx. 2–3 cm) for semi-industrial scale.
2.3. Microwave-Assisted Subcritical Water Extraction (MASWE)
CWS (30 g) were mixed with 300 mL of water, with a 1:10 solid/liquid ratio (S/L) and the mixture was soaked for 15 min in a US bath in a 1 L Teflon vessel. The vessel was then introduced into a MW multimodal reactor (SynthWAVE®, Milestone, Bergamo, Italy), able to work under the pressure of an external inert gas (N2).
Before each extraction, a suitable purging was performed with N2, to replace residual air trapped inside the system, thus avoiding oxidative degradation. The system was then pressurized with N2 to reach the subcritical conditions and avoid water ebullition (5 bar). The system was connected to a chiller (operating T: 8 °C).
The samples were treated at different temperatures (100 °C, 120 °C, and 150 °C) and, in all tests, the operating temperature was reached with a 5 min ramp with a maximum irradiation power of 1500 W.
The resulting extracts were separated by centrifugation at 4200 rpm for 5 min (Cence Hunan Xiangyi Laboratory Instrument Development Co., Ltd., Changsha, China) and the supernatant was filtered under vacuum. The residual biomass was washed three times with fresh solvent and, when planned, it was used for subsequent extractions. To recover the dry extract, the supernatant was freeze-dried (−60 °C, 0.2 mbar, Telstar Lyotest, Azbil Telstar SL, Terrassa, Spain).
2.4. Semi-Industrial-Scale Subcritical Water Extraction (SI-SWE)
Semi-industrial-scale subcritical water extraction (SI-SWE) was carried out on a pilot-scale customized prototype (Tropical Food Machinery SRL, Busseto, Italy).
This system provided is made up of a heating system consisting of a boiler (which generates superheated steam, up to 9 bar and 170–190 °C). Water at 90 °C is maintained in a 40 L hot recirculation tank, then it passes through a heat-exchanger (steam-fed), and it is heated to the desired temperature, in a closed loop. The reactor is composed of two 100 L stainless steel cylindrical extractors (usable separately), with respective loading and unloading connections, equipped with five perforated baskets (0.5 mm meshes), inside which the matrix to be extracted is placed. Once the baskets have been loaded with CWC and the system is sealed, the water is pumped inside the chambers. The extractions were carried out, loading only one chamber with CWC (13,5 kg), using a volume of 160 L of water (S/L ratio 1:10, approx.), for 30 and 60 min, respectively. The extract was sampled and freeze-dried to evaluate extraction yield and polyphenol content.
To concentrate and reduce the extract volume, an expansion bubble was applied, performing a flash evaporation reducing the temperature to 50–60 °C in a few minutes and then heated with a steam coil to concentrate it by means of a vacuum pump. The concentrated product can be dried with the spray-drying technology.
2.5. Membrane Filtration
The extract derived from both the lab-scale and pilot-scale treatment of CW was processed with a lab-scale membrane filtration skid (PB100, Hydro Air Research Srl, Lodi, Italy). A vacuum filtration was previously necessary to clarify the solution. The system is composed of a 3 L tank equipped with a DKU 1812 membrane (150–300 Da, 0.38 m2 filtering area) used for NF, and a SDR10-1812 membrane (1000 Da, 0.33 m2 filtering area) and SDR5-1812 membrane (5000 Da, 0.33 m2 filtering area) for UF. The retentate continuously recirculated in the feeding tank while the permeate was collected in a graduated cylinder and the filtration flow was monitored. Approx. 2–3 L of solution was processed with a suitable counterpressure (2 bar for UF, 5 bar for NF). Both the fractions were collected and freeze-dried, for further analysis. The retentate obtained from the NF process, operated on the semi-industrial extract, was dried with a spray-drying process, from a scalable point of view.
2.6. Spray Drying
The spray-drying process was adopted as an alternative method to remove water.
The system (KD-SD-2000, Zhengzhou Keda Machinery and Instrument Equipment Co., Ltd., Zhengzhou, China) is equipped with a peristaltic pump, an atomizer, an air heating system, a drying chamber, and a cyclone separator.
Approx. 3 L of permeate were processed by using 190–200 °C as atomizer temperature, 40% of venting, and 20% of peristaltic pump speed. Tests were performed without any excipient addition.
2.7. Colorimetric Assays
2.7.1. Total Polyphenol Content (TPC)—Folin–Ciocalteau Assay
The Folin–Ciocalteau assay was used to quantify the total polyphenol content (TPC) [63]. To determine the quantity of polyphenols in the samples, a calibration curve of gallic acid in water solution (with dilutions between 5 and 250 μg/mL) was used as a reference. Dried extracts were dissolved in de-ionized water in a range of concentrations between approx. 0.3 and 1 mg/mL. In each test tube, 250 μL of sample solution (or water for the blank) was added, followed by the sequential addition of: 4 mL of distilled water, 500 μL of Na2CO3 solution (10% w/v), and 250 μL of Folin–Ciocalteau solution. The solution obtained was shaken vigorously and stored at room temperature and away from light for 25 min. After this incubation period, the absorbance was read by using a UV-vis spectrophotometer (Cary 60, Agilent Technologies, Santa Clara, CA, USA), at 725 nm in a plastic cuvette (1 cm). The TPC was expressed as mg/g of gallic acid equivalents (GAE) over the dried extract and over the dried matrix. All the measurements were performed in triplicate.
2.7.2. Tannin Determination
Total Tannins—Cinchonine Hemisulfate Assays
Tannin determination was performed by using Peri and Pompei protocol [64], with some adjustments. Operationally, the analysis involves the addition of 600 µL of hemisulfate cinchonine solution (0.5% w/v) to 600 µL of the extract solution in a 1.5 mL Eppendorf tube. The solution obtained was shaken and then left overnight at 4 °C to promote the precipitation of the tannate cinchonine. After that, the sample was centrifuged at 26,000 rpm for 2 min at 10 °C (Allegra 64R, Beckman Coulter Srl, Italy). The supernatant consists of a polyphenol-rich solution (TPC1, Figure A1), while the precipitate represents the tannic fraction. The supernatant was separated and analysed with the Folin–Ciocalteau test. The total tannin semi-quantitative content was calculated by difference and expressed as GAE.
Hydrolysable and Condensed Tannins—Formaldehyde/HCl Assays
The tannic fraction was also analysed in terms of hydrolysable (HTs) and condensed tannins (CTs); an adaptation of Scalbert et al. method was used [65]. The precipitate gained before was resuspended in 600 µL of EtOHaq (1:1). Then, 500 µL of this suspension was mixed with 250 µL of H2O/HCl 36% (5:2 v/v) and 250 µL of an aqueous solution of formaldehyde 4.8%. The mixture was vigorously shaken and then incubated overnight, then centrifuged at 26,000 rpm for 5 min at 10 °C. The supernatant, containing the HT fraction (TPC2, Figure A1), was analysed by using Folin–Ciocalteau. The precipitate represents the CT fraction, precipitated by the formaldehyde. The amount of this fraction was determined by difference, between the total and the HTs.
2.7.3. Antioxidant Activity
DPPH Assay
The antioxidant activity of the extracts was evaluated following the method described by Brand-Williams et al. by using the stable free radical DPPH (2,2-diphenyl-1-picrilidrazile) [66]. The DPPH radical inhibition, caused by the CW extracts and measured by the decolouration of the solution (from violet to colourless), was monitored, and referred to a Trolox methanolic solution, considered as an antioxidant standard. The IC50 (the extract concentration able to inhibit 50% the DPPH∙ radical at equilibrium) was evaluated as the scavenging activity parameter. Different concentration solutions of the dry extracts were prepared, by operating subsequent dilutions, and the absorbance was read at 515 nm (Cary 60 UV-vis spectrophotometer, Agilent Technologies, Santa Clara, CA, USA). Bobo Least Squares software (ver. 0.9.1.) [67] was used to process the absorbance data obtained, to define a proper Probit regression. A blank containing only water and methanol was used to zero the instrument; a blank sample containing the dry extract, without the DPPH∙ radical, was used to evaluate the matrix effect; and a reference sample, containing water and DPPH∙ radical was used to normalize the results and verify the reactive absorbance.
ABTS Assay
An alternative assay was also used for the evaluation of the antioxidant activity of the extracts. This method can be used to evaluate if the analyses could be affected by a matrix effect or if the DPPH∙ suffers other interferences that may change the final result.
A modified procedure, starting from Re et al. protocol [68], was used. The radical is generated by the reaction of a strong oxidant (potassium persulfate) with the ABTS· salt (2,2’-azino-bis acid(3-ethyllbenzothiazolin-6-sulfonic). The disappearance of the typical green-blue colouration of ABTS·+, caused by the reduction by an HBD antioxidant, is then measured. A solution was prepared with 38.40 mg of ABTS· and 6.6 mg of K2S2O8 in 10 mL of water. The mixture was left in incubation overnight, under shaking and in the dark. The solution obtained was diluted 1:100 with methanol and absorbance read at a wavelength of 734 nm: this must have a value of 0.70 ± 0.02.
An aqueous solution of the extract was then prepared and used to set up six samples by subsequent dilutions (such as the method commonly used for the DPPH∙ test). In each test tube, 500 μL of stock solution of the extract (at decreasing concentrations) and 500 μL of ABTS·+MeOH reagent were combined. The tubes were kept at a constant temperature of 30 °C, during the 6 min incubation. At the end of these, the absorbance at a wavelength of 734 nm was read and the inhibition percentages are calculated from the recorded values. A methanolic solution of Trolox® 15 μM (IC50 = 7.94 μg/mL) was used for calibration.
2.8. LC-MS-DAD Characterization
LC-MS analyses were carried out with a Waters system: sampler (Waters FractionLink), diode array detector (DAD), and a single quadrupole mass spectrometer, supported by MassLynx V4.1 software. Mass analysis was performed in ESI+ (Cone: 20.00 V; Capillary: 3.00 kV; Source T: 110 °C; Desolvation T: 220 °C, m/z range 100–800). The chromatographic separation was performed with a Sinergy Hydro-RP column (Waters, 4 μm 80 Å, 250 × 4.6 mm)—eluents: A = water/CH3COOH 3%, B = ACN; gradient (min, %B): 0, 5; 9.98, 5; 42.38, 15; 57.34, 30; 69.80, 60; 76.29, 100; 88.75, 100. Flow: 1 mL/min; injection V: 20 μL. The DAD wavelength was set at 280 nm and 335 nm.
3. Results and Discussions
3.1. MASWE
Sequential Extraction Screening
The CWS were extracted in subcritical water (see Section 2.3), adopting a sequential step approach, investigating the possibility of enhancing the global efficiency of the process. According to that, the first step could act at the same time as the extraction and pre-treatment step, allowing us to improve the recovery of active compounds, achieving an efficient extraction performance. In addition, this approach would be investigated in terms of “pre-fractionation” of the final product achieved, hence exploiting the different solubilities and extraction thermodynamics/kinetics of metabolites, according to their mass weight, dimensions, and chemical features (i.e., flavonoids versus tannins)
In the starting extraction set, the study considered a quick first step at 120 °C for 5 min, followed by a subsequent step at 150 °C for 15 min. In order to monitor the extraction process, the TPC was followed, as a key metric for polyphenol recovery.
As reported in Table 2, the first step led to the highest yield (12.15 versus 5.48%) with concomitant TPC selectivity values (646.36 versus 242.77 mg GAE/gext). The polyphenols’ yield, expressed on the dry matrix (DM) treated, follows the trend and shows advantageous results for the former step (78.53 versus 13.30 mg GAE/gDM).
Table 2.
Extraction conditions, yield, and TPC of the sample obtained with the process performed at 120 °C and 150 °C.
To track the process outcomes, the cumulative yield of the protocol was also calculated, both as the dry product yield (16.97%) and polyphenol extraction total yield from the matrix (90.22 mg GAE/gDM); see Figure 1.
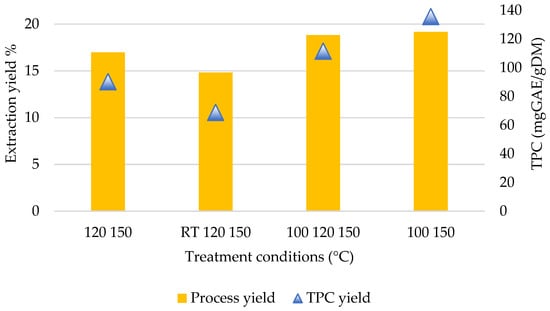
Figure 1.
Comparison of the overall process yield and the total polyphenols’ extraction yield, between different investigated treatments.
With the aim to enhance the overall selectivity of the protocol, a dedicated pre-treatment was implemented in the cascade. Thus, the biomass was treated at room temperature (RT) for 2 h to verify the removal of non-active co-extracts (Table 3).
Table 3.
Extraction conditions, yield, and TPC of the samples obtained with the process performed at RT, 120 °C, and 150 °C.
The pre-treatment led to a low yield (approx. 3%), not affecting in a positive way the following extraction step. The overall yield of the process was 14.83% (instead of 16.97%, in the first condition set; see Table 2 and Figure 1).
Despite the outcomes not being encouraging in terms of yield, the pre-treatment enhanced the selectivity of the following step (120 °C: increasing approx. 10%, 713.35 versus 646.36 mg GAE/gext; 150 °C: increasing approx. 15%, 288.13 versus 242.77 mg GAE/gext). This demonstrates the effectiveness of the pre-treatment, probably due to the swelling effect and the partial removal of non-active compounds (such as salts and saccharides). However, the resulting total TPC yield is moderate: from 1 g of the matrix, only 68.81 mg GAE can be recovered. In order to promote a fraction enrichment, a flash pre-treatment at a higher temperature was tested (100 °C, 5 min; see Table 4).
Table 4.
Extraction conditions, yield, and TPC of the samples obtained with the process performed at 100 °C, 120 °C, and 150 °C.
The latter achieved a good yield (11.83%), comparable to a direct treatment at 120 °C (12.15%, Table 2), additionally leading to interesting recoveries for the following steps. The overall yield of this extraction protocol reached 18.82%, the best performing among the treatments investigated before (see Figure 2).
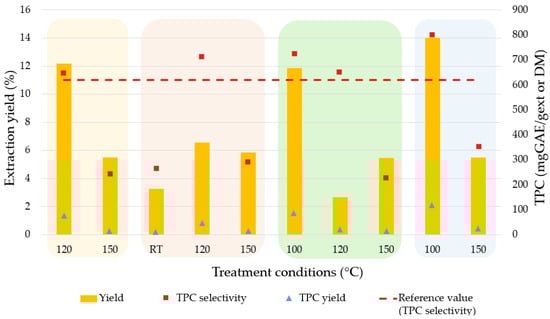
Figure 2.
Extraction yield and TPC: comparison with the commercial benchmark (SilvaFEED ENC).
The detected polyphenol content actually showed that, at 100 °C, the extraction is highly selective, and the subsequent TPC values (for the treatment at 120 °C and 150 °C) are quite similar if compared to the previous screening (Table 2 and Table 3).
It is interesting to note that, by modifying the first step from RT (which mainly represented a washing of the matrix) to a proper extraction performed at 100 °C, the total process yield stands approx. at 19% and the overall TPC yield is almost doubled, if compared to the previous pathway (111.43 versus 68.81 mg GAE/gDM, Table 4). To further investigate the extraction trend, a combination of the last two protocols was evaluated, aiming to reduce consumption and process costs (see Table 5).
Table 5.
Extraction conditions, yield, and TPC of the samples obtained with the process performed at 100 °C and 150 °C.
The adopted time for the first step was 10 min, instead of two distinct treatments of 5 min long. Similarly, the S/L ratio was modified to 1:20, to maintain the exploited solvent amount, without affecting the extraction driving force.
In this case, the overall yield surpasses 19%, achieving the best result (see Figure 2).
The TPC selectivity for both the steps is the highest between all the investigated conditions (802.84 mg GAE/gext and 350.74 mg GAE/gext, respectively). Similarly, the overall phenolic yield, 135.60 mg GAE/gDM, was the highest registered.
In order to evaluate the polyphenol recovery effectiveness, an industrial extract, directly supplied by SILVATEAM Spa (SilvaFEED ENC), was used as a benchmark, returning a value of 619.76 mg GAE/gext. For sake of comparison, all the obtained data were summarized in Figure 2 for an overview with the trade sample (SilvaFEED ENC).
Evaluating the process yield and the overall TPC yield, normalized per gram of dry extracted matrix, for each set of consecutive extractions, it can be noticed that these two parameters are following the same trend. Thus, the following treatment at 100 °C (10 min) and 150 °C (15 min) was the best performing one.
3.2. Antioxidant Activity, DPPH, and ABTS Assays
The samples achieved by means of the optimized sequential extraction (100 °C and 150 °C) were analysed for antioxidant activity with DPPH· and ABTS· assays. The results are expressed both in terms of IC50 and Trolox eq., to give a direct proportionality of the parameter (see Table 6 and Figure 3).
Table 6.
Evaluation of the antioxidant activity, with DPPH· and ABTS· assays.
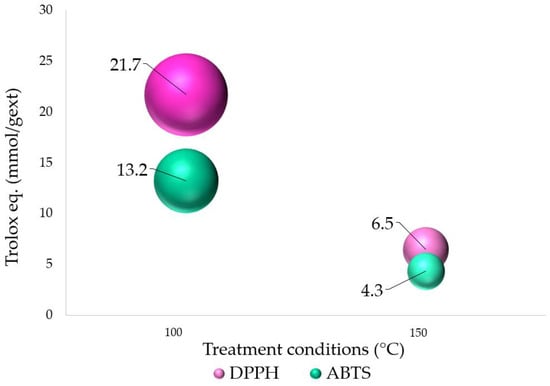
Figure 3.
Evaluation of the antioxidant activity, with DPPH· and ABTS· assays, expressed as Trolox equivalents.
These analyses agree with the observed trend for polyphenol recovery; hence, the extract achieved at 100 °C demonstrates a higher antioxidant activity, regardless of the applied test. Furthermore, the second extraction step still possesses interesting antioxidant features, with a decrease of approx. 30% in the Trolox eq. The IC50 values are generally very low, in the range of μg/mL for all the products. It is worth noticing that both the DPPH and ABTS assays showed a constant offset for all the samples (see ABTS/DPPH ratio in Table 5), thus confirming the suitability of these protocols due to the non-specific interaction with the different samples.
3.3. Tannin Analyses
Besides dry yields and TPC characterizations, this study aimed to understand how the sequential extraction approach could affect the selectivity in every step. To this purpose, considering the main composition of CWS, attention was paid to tannin distribution and composition. In particular, polyphenol/tannin ratios (Section 2.7.2) and hydrolysable (HTs) and condensed (CTs) tannin determinations (Section 2.7.3) were investigated for every extraction protocol.
3.3.1. Tannins Precipitation—Cinchonine Hemisulfate Assay
By considering the presence of tannins among the population of molecules which respond to the TPC test, it is possible to assume that, in general, tannins are largely present in all the extracts. The results presented in Figure 4 suggest that the lower the temperature used for the extraction, the higher the quantity of tannins recovered: thus, the extracts obtained at 150 °C present the lower amount, while the sample obtained at 100 °C and 120 °C led to a better recovery of this fraction.
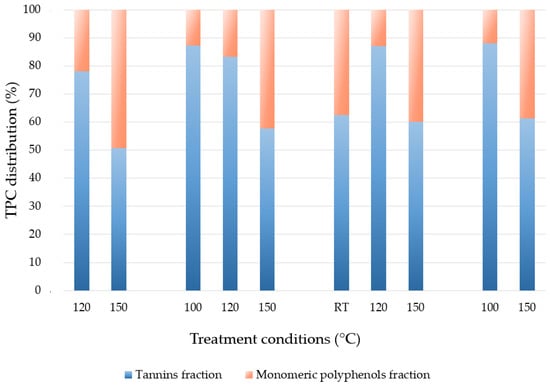
Figure 4.
Subdivision of TPC-responding molecules, between tannin fraction and free polyphenol fraction, expressed as percentage on TPC.
So far, the optimized sequential extraction conditions were defined according to the extraction yield and polyphenol selectivity. Reconsidering this protocol in view of the tannin content, it is possible to state that the first product (achieved at 100 °C, 10 min) is composed of 88% of the tannins, whilst these metabolites decreased by approx. 30% in the second step (150 °C, 15 min), resulting in more than 40% of monomeric polyphenols. This result shows an effective preliminary fractionation of the extractable compounds, achieved ahead of the process.
3.3.2. Tannins—Formaldehyde and HCl Assay
The results shown in Table 7 describe the trend of the HTs and CTs contained in the samples obtained by the different sequential extraction protocols. In general, it is possible to notice that the CT fraction (brown slice in Table 7) is more represented, with values that depend on the process conditions.
Table 7.
Distribution of HTs and CTs and monomeric polyphenols.
According to the optimized protocol (last row, in Table 7), it is possible to notice that the extract obtained at 100 °C is mainly composed of CTs (83%), followed by HTs and monomeric polyphenols (5% and 12%, respectively). Thus, this step allows us to recover approx. 88% of tannins in only 10 min of treatment. The following extraction, on the other hand, enables us to recover a product with a higher concentration of monomeric polyphenols (39%). Concerning the general trend of the performed tests, it is not possible to easily identify a product with a predominant metabolite, prevailing on others, or alternatively, it is not cost-effective, being achieved by means of a three-step protocol.
Considering the different conditions, it is possible to analyse how different pre-treatments can affect the composition of the extract obtained at 120 °C and 150 °C. As shown in Figure 5, the extractions performed at 120 °C (shades of blue) in general led to a lower percentage of monomeric polyphenols, replaced by a high content of tannins. On the contrary, working at 150 °C (shades of orange) brings about a large recovery of monomeric polyphenols. Notably, a pre-treatment, before the extraction operated at 120 °C, slightly increased the HTs level, and a similar trend can be observed for the process at 150 °C.
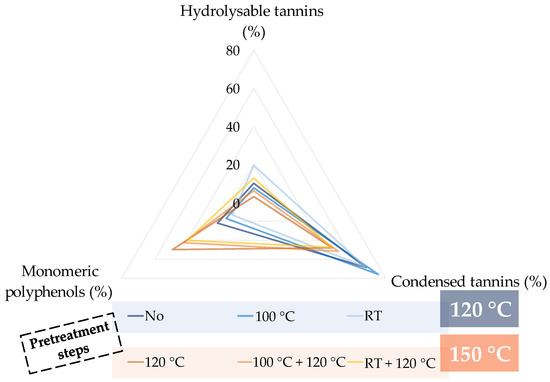
Figure 5.
Pre-treatment influence on extract population of tannins and polyphenols.
3.4. Lab-Scale Downstream—Membrane Filtration
The encouraging results obtained by the sequential extraction was further developed, focusing on the enhancement of the tannin-rich fraction. According to that goal, membrane filtrations (Section 2.5) were performed aiming at an additional fractionation of the extract. In detail, different filtration protocols were carried out on the liquor derived from the 100 °C extraction (global tannin content of 88%).
The first approach consisted of a 1000 Da UF, leading to the recovery of a concentrated permeate (PUF) and a diluted retentate (RUF).
This process led to a fractionation of the polyphenol’s population, mainly caused by the retention of tannins (characterized by a higher weight and larger dimensions) and the permeation of the smaller molecules (monomers such as gallic acid, ellagic acid, and others). The starting material was characterized by 88.07% of tannins, while the obtained RUF reached 92.00%, with a concentration increase of 14.60%. The RUF was successively processed investigating the application of diafiltration. The aim of this technique was to further concentrate the tannin fraction in the retentate, by adding fresh water and enhancing the separation driving force, replacing the removed volume of the permeate. Moreover, diafiltration reduces the matrix effect of the solution, improving the membrane rejection and metabolite discrimination. Two different tests were performed to investigate the impact of the water amount in diafiltration. Thus, RUF was divided into two streams: a single diafiltration (with a quarter of the removed volume) and a triple diafiltration (complete replacement of the water removed in the previous step), as described in Figure 6.
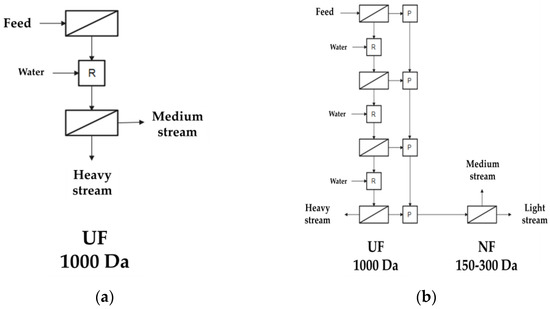
Figure 6.
(a) Single diafiltration with ¼ of removed water; (b) triple diafiltration with complete water replacement.
The first test was carried out with only a quarter of the water removed in the first UF step, with the aim of saving water. Unfortunately, the obtained result in tannin enrichment was negligible. The small amount of water probably does not allow us to overcome the matrix effect and recover the membrane performance.
On the other hand, the second experiment allowed us to achieve engaging results: the average tannin concentration reached nearly 100% at the end of the sequential process (Figure 7, brown line). Hence, it is possible to state that, as expected, monomeric polyphenols mostly crossed the 1000 Da membrane, concentrating the heavy metabolites in the retentate. Further investigations conducted showed that TPC selectivity is almost unaffected, across the successive retention fractions (Figure 7, ruby bars, RUF RD3) with small variations due to the variability of the method. It is worth noting that this last parameter refers to all active polyphenolic fractions, so its constant trend could indicate the additional removal of “non-active” compounds, such as salts and oligosaccharides, despite the decrease in monomeric polyphenols.
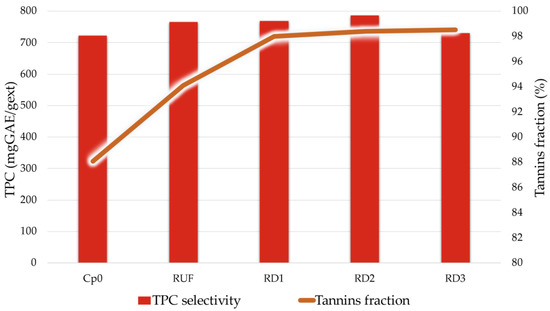
Figure 7.
Tannin enrichment with the triple diafiltration (UF).
As a further confirmation, the “tannin/monomeric polyphenol” ratio of the retentates across the process has been analysed and reported in Figure 8. It is possible to appreciate the increasing values of the tannin percentage as opposed to the polyphenol decrease, starting from the first retentate (RUF) and gradually proceeding together with the diafiltration steps (RD1, RD2, and RD3).
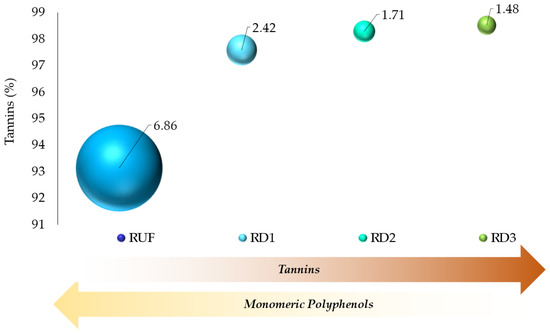
Figure 8.
Tannin percentage of diafiltration retentates; labels and sphere radius indicate the polyphenol percentage. Sum of tannins and monomeric polyphenols is normalized to 100.
After the UF protocol, the resulting permeates were combined and processed with an NF membrane, aiming to concentrate the metabolites and recover water at the same time. The latter can be ideally recycled within the process.
After NF, the recovered fractions were a retentate (RNF) and a permeate (PNF). The feed concentration was approx. 0.75 mg/mL and, through this process, the RNF reached 10.06 mg/mL (a 13.5-times increase), with 752.71 mgGAE/gext (meaning approx. 75.3% of the monomeric polyphenol content). This result was obtained simply by water displacement into the permeate, which was consequently extremely diluted (PNF, 0.07211 mg/mL, a 10-times reduction).
These further purifications are crucial for improving the applicability of the recovered compound fractions. As mentioned above, tannins are used in large markets mainly to exploit their special properties: their antioxidant activity and physicochemical properties. For example, they are used to enrich animal feeds, especially poultry and pigs, due to their beneficial effects on animal well-being [69]. In terms of technological features, tannins are mainly exploited as tanning agents in the leather industry [70], and in the market for wood glue systems [71]. Finally, it should be mentioned that monomeric polyphenols are widely employed in the food supplement and cosmetic industries [8,9]. For all these applications, a higher concentration of specific components is a key criterion.
3.5. Semi-Industrial-Scale Subcritical Water Extraction (SI-SWE)
The extraction of CW was also investigated for a suitable scale-up in a semi-industrial plant, able to work in subcritical water. In detail, 13.5 kg of CWC were loaded into the reactor baskets, using an S/L ratio of 1 to 10. The extraction in these conditions was carried out starting from a larger-sized matrix with respect to the one exploited at a small scale. This expedient was necessary to meet industrial requirements, as production wastes are usually about 3 cm-sized.
The extraction under these conditions was carried out starting from a larger-sized matrix than the one used in the small scale. This was necessary for meeting the requirements of the industry, since the production waste is usually about 3 cm in size. In the development phase of the process, they were used as such to avoid another grinding step, which would excessively burden the total energy consumption and treatment time. It should be noted that conventional laboratory-scale reactors could not handle matrices of this size without comminution. Nevertheless, the use of a 2–3 cm chip size was possible due to the efficient mass transfer provided by the extractor through the forced recirculation of subcritical water through the material confined in perforated baskets.
The screening of SI-SWE of CWC took the lead from the conditions applied in the first set of lab-scale extractions. Hence, a first treatment was carried out at 120 °C for 5 min and the resulting extract was sampled for subsequent analysis. The system was discharged and then re-filled with the same amount of water, bringing the temperature up to 150 °C for 15 min. The results expressed in yield and TPC are shown in Table 8.
Table 8.
Extraction yield and TPC analyses for double sequential extraction.
The yields obtained are significantly lower than the same conditions carried out on a laboratory scale (2.89% versus 12.15% and 3.47% versus 5.48%). This difference is most likely due to the different size of the wood chips affecting the mass transfer. This could be compensated by longer extraction times, which are, however, still below the times usually used in industry for conventional extraction.
Concerning the TPC selectivity, this parameter is comparable for the extracts achieved at 120 °C (646.36 mgGAE/gext lab scale versus 516.33 mgGAE/gext pilot scale) while for the second step, the pilot scale had a much higher result (242.77 mgGAE/gext versus 666.94 mgGAE/gext). This phenomenon can be explained by the slower extraction kinetics, which left more residual metabolites in the post-extraction matrix at 120 °C, then recovered by the treatment at 150 °C. The global process yield is 6.26%, with a corresponding polyphenol recovery of 37 gGAE for each kilogram of processed matrix.
A second set of extraction was lately performed in the semi-industrial plant, considering some protocol modifications such as a longer time and smaller particle size (approx. 1 cm), to increase the process yield and obtain a more exhaustive extraction of the matrix.
The experimental protocol involved three different steps: the first one carried out at 100 °C for 60 min, the second at 120 °C for 30 min, and the last one, 150 °C for 30 min (as shown in Table 9).
Table 9.
Extraction yield and TPC analyses for triple sequential extraction.
Looking at the results, it is possible to notice how the protocol modifications applied had a positive impact on the process’ outcomes. All the evaluated parameters underwent an increase: the global process yield doubles (6.26% versus 13.99%, Table 8 and Table 9), TPC selectivity slightly increased, whilst the final recovered polyphenols are nearly three times higher (37.36 mgGAE/gDM versus 95.96 mgGAE/gDM, Table 8 and Table 9), reaching a final productivity of 9.9%.
Finally, the samples deriving from this SI-SWE set were also characterized by the tannin content and distribution (Section 2.7.2 and 2.7.3).
As described in Table 10, the products are generally characterized by CTs, followed by a moderate quantity of monomeric polyphenols. It is possible to state that the composition of the extract achieved at 100 °C appears similar to the lab-scale one. Thus, this extraction temperature is confirmed as the most selective according to tannin content, verifying the possibility to perform a pre-fractionation with SI-SWE.
Table 10.
Distribution of HTs, CTs, and polyphenols in optimized SI-SWE of CW chips.
3.6. Semi-Industrial Downstream
Considering the semi-industrial nature of the extraction step, it is necessary to design a suitable downstream protocol, as the latter is a possible bottleneck of the production chain. For that reason, two sequential techniques have been tested with particular attention towards the scalability and applicability in a continuous process, even on an industrial scale.
3.6.1. Membrane Filtration
The membrane filtration was applied also on the product obtained from SI-SWE, with a different goal from the previous diafiltration process (Section 3.4). In the first approach, the aim was to achieve selective fractions, whilst in this latter case, the purpose was to concentrate the sample and recover water from the system. Thinking about the industrial concern, the water recycling is crucial and has a two-fold effect, from a sustainability and cost-effectiveness point of view. In addition, another industrial requirement is the application of a cheap drying system, due to the high amount of liquid to be removed. Thus, non-sustainable lyophilization has to be replaced by spray drying, which however requires a moderate concentration of the feed. Membrane NF systems can meet both of the above-mentioned aspects with high efficiency, allowing us to recover water with a simultaneous product concentration.
The liquor deriving from the second step of the double extraction on the semi-industrial plant (150 °C, 3.5 mg/mL) was subjected to NF (150–300 Da), increasing by approx. three times the solution concentration, reaching 12 mg/mL.
Both the retentate (RNF) and permeate (PNF) were collected and analysed using the Folin–Ciocalteau method. After the treatment, the TPC selectivity was nearly unmodified with respect to the liquor (RNF 684.84 mgGAE/gext versus 666.94 mgGAE/gext,), demonstrating that NF led to a concentration (due to water removal), with negligible losses of actives (see NF mass-balance in Figure 9).
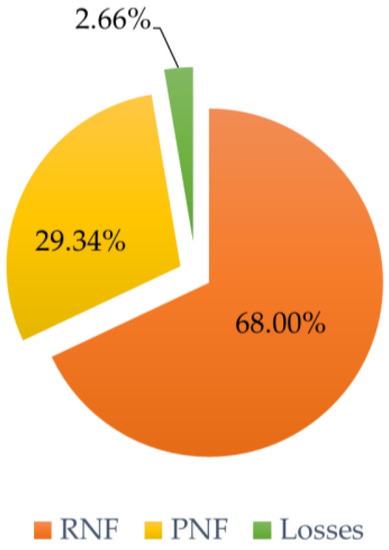
Figure 9.
Mass balance of NF process, expressed as percentage on dry yield (%).
3.6.2. Spray Drying
The retentate deriving from NF is suitably concentrated to be submitted to a spray-dryer system (Section 2.6). Due to the high content of tannins, the drying process was performed without any addition of excipients. Typically, spray drying require the addition of excipients such as maltodextrins or cyclodextrins to avoid stickiness and to facilitate the process, enhancing the recovery yield and reducing the time. Unfortunately, the drawback is the resulting reduction in active compounds in the final product, because of the presence of inert additives. The solid recovered was analysed for TPC to verify the product stability. The result is almost unchanged (684.57 mg GAE/gext versus 684.84 mgGAE/gext, for spray-dried and RNF, respectively), proving that the high-temperature treatment is fast enough to not cause polyphenol degradation. This result corroborates the use of this technology, representing a good downstream process to obtain a dry product on a large scale, with an easy and cheap protocol, able to work in a continuous flow mode.
3.7. LC-MS-DAD Characterization
The optimized extract (100 °C S/L 1/20) has been characterized by LC-MS analysis, with semi-qualitative purposes, to detect the main compounds recovered by means of extraction (see Figure 10). In particular, some hydrolysable tannins, namely castalagin and vescalagin (Rt: 6.28 min and 9.61 min), and their fragment castalin and vescalin (Rt: 3.25, 3.62 and 4.17 min), have been observed. It is worth noticing that the typical m/z signals belonging to castalin and vescalin (m/z: 632.4) are split, resulting also in peaks attributable to castalagin and vescalagin (Rt: 6.28 min and 9.61 min).
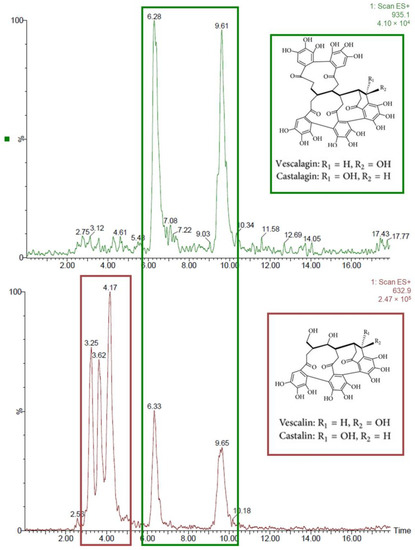
Figure 10.
LC-MS analysis, vescalagin/castalagin (m/z: 934.6) and vescalin/castalin (m/z: 632.4) spectra. Masses are selected +0.5 m/z due to detector calibration.
This could be explained by the formation of the lighter compounds because of fragmentation; nevertheless, the appearance of the peaks at low retention times (3.25–4.17 min) reveals the presence of the native castalin and vescalin in the extract. The fact that three peaks are displayed could be explained by the presence of another compound with a close molecular mass, a generic monomeric ellagitannin, galloyl-hexahydroxydiphenoyl-hexide (galloyl-HHDP-hexide), according to literature [18].
Other larger tannins, namely CTs, were not deeply examined because of the instrumental limitation of the mass detector. In order to qualitatively investigate the occurrence of those species, because of the impossibilities of searching precise masses, the presence of gallocatechin fragments in the extract was studied. Actually, the mass of gallocatechin is represented by a broad region of signals, suggesting a plethora of different molecules presenting this moiety (see Figure 11).
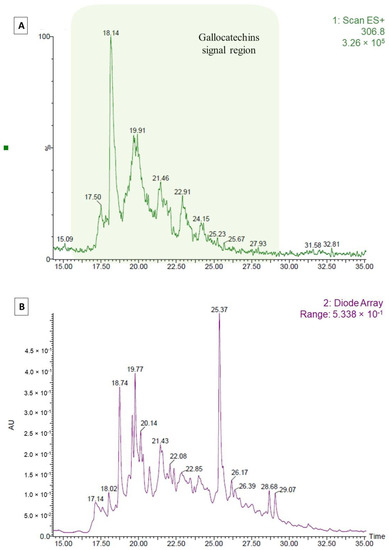
Figure 11.
LC-MS analysis, detail for gallocatechins signal region (m/z: 306). (A) Mass spectra; (B) DAD chromatogram. Masses are selected +0.5 m/z due to detector calibration.
As expected from literature, gallic and ellagic acids have been clearly detected in the polyphenol profile of the extract [9]. Gallic acid has a retention time of 8.37 min while ellagic acid has a retention time of 25.71 min (see Figure 12). In the extract deriving from the treatment at 150 °C, the amount of ellagic and gallic acid is significant, maybe due to a prior degradation of HTs, which are formed by those monomeric units.
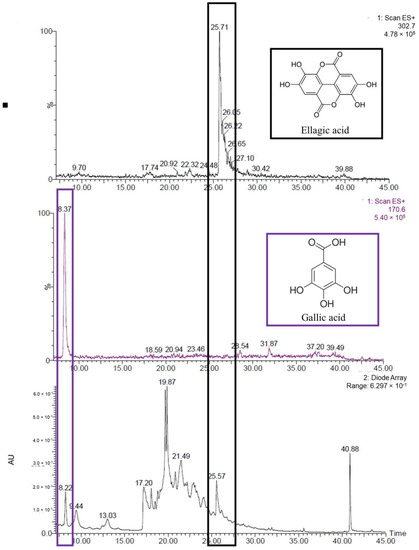
Figure 12.
LC-MS analysis, detail for ellagic (m/z: 302) and gallic acid signals (m/z: 170). Masses are selected +0.5 m/z due to detector calibration.
4. Conclusions
A new sequential extraction protocol was developed to achieve the pre-fractionation of CW residues. In particular, two flash extractions in subcritical water removed up to 88% of tannins and 40% of monomeric polyphenols in the first and second steps, respectively. To the best of our knowledge, this is the first time that this type of procedure has been applied to the valorisation of chestnut wood residues. Moreover, the optimized protocol was applied in a pilot plant (13.5 kg CW and 160 L water), with encouraging results. In terms of industrial application, several efforts are being made to develop a more powerful pre-industrial scale-up, with particular attention on the mass transfer process.
Finally, a UF membrane system was tested to improve fraction composition and concentration, achieving more than 98% of tannin content in the retentate and up to 752.71 mgGAE/gext of monomeric polyphenols (about 75.3%) for the resulting permeate (after NF concentration). LC-MS-DAD analysis detected vescalagin/castalagin and vescalin/castalin, together with gallic and ellagic acids, some of the peculiar markers of CW. Further studies could pave the way towards an accurate isolation of the monomeric polyphenol fraction. The work presented here demonstrates the possibility of achieving a convenient and sustainable fractionation of CW, obtained by sequential extraction and further enhanced by membrane filtrations.
Author Contributions
Conceptualization, G.G., S.G. and G.C.; methodology, L.B., C.A. and G.G.; validation, S.G. and L.B.; formal analysis, C.A. and L.B.; investigation, C.A. and L.B.; data curation, S.G., G.G. and C.A.; writing—original draft preparation, G.G. and C.A.; writing—review and editing, G.G. and G.C.; supervision, S.G. and G.C. All authors have read and agreed to the published version of the manuscript.
Funding
This research received no external funding.
Data Availability Statement
Not applicable.
Acknowledgments
Silvateam Spa and the University of Turin are warmly acknowledged for the financial support.
Conflicts of Interest
The authors declare no conflict of interest.
Appendix A
Appendix A.1. Tannins: Precipitation and Hydrolysable/Condensed Discrimination
A schematic representation of Cinchonine Hemisulfate and Formaldehyde/HCl assays is represented in Figure A1 for the sake of clarity.

Figure A1.
Experimental procedure for the tannin analyses.
Figure A1.
Experimental procedure for the tannin analyses.

Appendix A.2. LC-MS-DAD Analysis of Tannin Fraction: Difference between Pre- and Post-Precipitation Samples
An LC-MS comparative analysis has been performed between the raw extract and the supernatant after the tannin precipitation assay (with the cinchonine treatment; see Section 2.7.2) of the same sample. Indeed, the chromatogram of the raw sample was characterized by a broad region crowded with signals in the typical range of tannins, while, after the cinchonine addition, those oligomers were drastically reduced (see Figure A2). In particular, the peaks shown at 24.08 and 25.64 min are attributable to cinchonine, as confirmed by an external standard.

Figure A2.
LC-MS analysis, comparison for cinchonine precipitation of tannins.
Figure A2.
LC-MS analysis, comparison for cinchonine precipitation of tannins.

References
- Chemat, F.; Abert-Vian, M.; Fabiano-Tixier, A.S.; Strube, J.; Uhlenbrock, L.; Gunjevic, V.; Cravotto, G. Green extraction of natural products. Origins, current status, and future challenges. Trends Anal. Chem. 2019, 118, 248–263. [Google Scholar] [CrossRef]
- Santana-Méridas, O.; González-Coloma, A.; Sánchez-Vioque, R. Agricultural residues as a source of bioactive natural products. Phytochem. Rev. 2012, 11, 447–466. [Google Scholar] [CrossRef]
- Galanakis, C.M. Recovery of high added-value components from food wastes: Conventional, emerging technologies and commercialized applications. Trends Food Sci. Technol. 2012, 26, 68–87. [Google Scholar] [CrossRef]
- Conedera, M.; Krebs, P.; Tinner, W.; Pradella, M.; Torriani, D. The cultivation of Castanea sativa (Mill.) in Europe, from its origin to its diffusion on a continental scale. Veg. Hist. Archaeobot. 2004, 13, 161–179. [Google Scholar] [CrossRef]
- Li, R.; Sharma, A.K.; Zhu, J.; Zheng, B.; Xiao, G.; Chen, L. Nutritional biology of chestnuts: A perspective review. Food Chem. 2022, 395, 133575. [Google Scholar] [CrossRef]
- Ozcan, T.; Yilmaz-Ersan, L.; Akpinar-Bayizit, A.; Delikanli, B. Antioxidant properties of probiotic fermented milk supplemented with chestnut flour (Castanea sativa Mill). J. Food Process. Preserv. 2017, 41, e13156. [Google Scholar] [CrossRef]
- Hu, M.; Yang, X.; Chang, X. Bioactive phenolic components and potential health effects of chestnut shell: A review. J. Food Biochem. 2021, 45, e13696. [Google Scholar] [CrossRef]
- de Vasconcelos, M.d.C.B.M.; Bennett, R.N.; Quideau, S.; Jacquet, R.; Rosa, E.A.S.; Ferreira-Cardoso, J.V. Evaluating the potential of chestnut (Castanea sativa Mill.) fruit pericarp and integument as a source of tocopherols, pigments and polyphenols. Ind. Crops Prod. 2010, 31, 301–311. [Google Scholar] [CrossRef]
- Squillaci, G.; Apone, F.; Sena, L.M.; Carola, A.; Tito, A.; Bimonte, M.; De Lucia, A.; Colucci, G.; La Cara, F.; Morana, A. Chestnut (Castanea sativa Mill.) industrial wastes as a valued bioresource for the production of active ingredients. Process Biochem. 2018, 64, 228–236. [Google Scholar] [CrossRef]
- Truong, V.-L.; Jeong, W.-S. Antioxidant and anti-inflammatory roles of tea polyphenols in inflammatory bowel diseases. Food Sci. Hum. Wellness 2022, 11, 502–511. [Google Scholar] [CrossRef]
- Macías-Cortés, E.; Gallegos-Infante, J.A.; Rocha-Guzmán, N.E.; Moreno-Jiménez, M.R.; Cervantes-Cardoza, V.; Castillo-Herrera, G.A. Antioxidant and anti-inflammatory polyphenols in ultrasound-assisted extracts from salvilla (Buddleja scordioides Kunth). Ultrason. Sonochem. 2022, 83, 105917. [Google Scholar] [CrossRef] [PubMed]
- Al-Tamimi, A.; Alfarhan, A.; Rajagopal, R. Antimicrobial and anti-biofilm activities of polyphenols extracted from different Saudi Arabian date cultivars against human pathogens. J. Infect. Public Health 2021, 14, 1783–1787. [Google Scholar] [CrossRef] [PubMed]
- Sajadimajd, S.; Bahramsoltani, R.; Iranpanah, A.; Kumar Patra, J.; Das, G.; Gouda, S.; Rahimi, R.; Rezaeiamiri, E.; Cao, H.; Giampieri, F.; et al. Advances on Natural Polyphenols as Anticancer Agents for Skin Cancer. Pharmacol. Res. 2020, 151, 104584. [Google Scholar] [CrossRef]
- Pinto, D.; Almeida, A.; López-Yerena, A.; Pinto, S.; Sarmento, B.; Lamuela-Raventós, R.; Vallverdú-Queralt, A.; Delerue-Matos, C.; Rodrigues, F. Appraisal of a new potential antioxidants-rich nutraceutical ingredient from chestnut shells through in-vivo assays—A targeted metabolomic approach in phenolic compounds. Food Chem. 2023, 404, 134546. [Google Scholar] [CrossRef]
- Pereira, J.A.; Oliveira, I.; Sousa, A.; Valentão, P.; Andrade, P.B.; Ferreira, I.C.; Ferreres, F.; Bento, A.; Seabra, R.; Estevinho, L. Walnut (Juglans regia L.) leaves: Phenolic compounds, antibacterial activity and antioxidant potential of different cultivars. Food Chem. Toxicol. 2007, 45, 2287–2295. [Google Scholar] [CrossRef] [PubMed]
- Dai, J.; Mumper, R.J. Plant phenolics: Extraction, analysis and their antioxidant and anticancer properties. Molecules 2010, 15, 7313–7352. [Google Scholar] [CrossRef] [PubMed]
- Balasundram, N.; Sundram, K.; Samman, S. Phenolic compounds in plants and agri-industrial by-products: Antioxidant activity, occurrence, and potential uses. Food Chem. 2006, 99, 191–203. [Google Scholar] [CrossRef]
- Yoshida, T.; Amakura, Y.; Yoshimura, M. Structural Features and Biological Properties of Ellagitannins in Some Plant Families of the Order Myrtales. Int. J. Mol. Sci. 2010, 11, 79–106. [Google Scholar] [CrossRef]
- Das, A.K.; Islam, M.N.; Faruk, M.O.; Ashaduzzaman, M.; Dungani, R. Review on tannins: Extraction processes, applications and possibilities. S. Afr. J. Bot. 2020, 135, 58–70. [Google Scholar] [CrossRef]
- Fernández-Agulló, A.; Freire, M.S.; Antorrena, G.; Pereira, J.A.; González-Álvarez, J. Effect of the Extraction Technique and Operational Conditions on the Recovery of Bioactive Compounds from Chestnut (Castanea sativa Mill.) Bur and Shell. Sep. Sci. Technol. 2014, 49, 267–277. [Google Scholar] [CrossRef]
- Vella, F.M.; Laratta, B.; la Cara, F.; Morana, A. Recovery of bioactive molecules from chestnut (Castanea sativa Mill.) by-products through extraction by different solvents. Nat. Prod. Res. 2018, 32, 1022–1032. [Google Scholar] [CrossRef] [PubMed]
- Díaz-Reinoso, B.; Moure, A.; Domínguez, H. Ethanol-modified supercritical CO2 extraction of chestnut burs antioxidants. Chem. Eng. Process. Process Intensif. 2020, 156, 108092. [Google Scholar] [CrossRef]
- Zhu, T.; Shen, Q.; Xu, Y.; Li, C. Ionic liquid and ultrasound-assisted extraction of chestnut shell pigment with good hair dyeing capability. J. Clean. Prod. 2022, 335, 130195. [Google Scholar] [CrossRef]
- An, J.Y.; Wang, L.-T.; Lv, M.-J.; Wang, J.-D.; Cai, Z.-H.; Wang, Y.-Q.; Zhang, S.; Yang, Q.; Fu, Y.-J. An efficiency strategy for extraction and recovery of ellagic acid from waste chestnut shell and its biological activity evaluation. Microchem. J. 2021, 160, 105616. [Google Scholar] [CrossRef]
- Gironi, F.; Piemonte, V. Temperature and solvent effects on polyphenol extraction process from chestnut tree wood. Chem. Eng. Res. Des. 2011, 89, 857–862. [Google Scholar] [CrossRef]
- Ham, J.S.; Kim, H.Y.; Lim, S.T. Antioxidant and deodorizing activities of phenolic components in chestnut inner shell extracts. Ind. Crops Prod. 2015, 73, 99–105. [Google Scholar] [CrossRef]
- Shi, J.; Nawaz, H.; Pohorly, J.; Mittal, G.; Kakuda, Y.; Jiang, Y. Extraction of polyphenolics from plant material for functional foods—Engineering and technology. Food Rev. Int. 2005, 21, 139–166. [Google Scholar] [CrossRef]
- Grillo, G.; Tabasso, S.; Solarino, R.; Cravotto, G.; Toson, C.; Ghedini, E.; Menegazzo, F.; Signoretto, M. From Seaweeds to Cosmeceutics: A Multidisciplinar Approach. Sustainability 2021, 13, 13443. [Google Scholar] [CrossRef]
- Santagata, G.; Grillo, G.; Immirzi, B.; Tabasso, S.; Cravotto, G.; Malinconico, M. Non-conventional Ultrasound-Assisted Extraction of Alginates from Sargassum Seaweed: From Coastal Waste to a Novel Polysaccharide Source. In Springer Water, Proceedings of the International Conference on Microplastic Pollution in the Mediterranean Sea (Capri, Italy); Cocca, M., Di Pace, E., Errico, M., Gentile, G., Montarsolo, A., Mossotti, R., Eds.; Springer: Cham, Switzerland, 2018. [Google Scholar]
- Lamberti, L.; Grillo, G.; Gallina, L.; Carnaroglio, D.; Chemat, F.; Cravotto, G. Microwave-Assisted Hydrodistillation of Hop (Humulus lupulus L.) Terpenes: A Pilot-Scale Study. Foods 2021, 10, 2726. [Google Scholar] [CrossRef]
- Gunjevic, V.; Grillo, G.; Carnaroglio, D.; Binello, A.; Barge, A.; Cravotto, G. Selective recovery of terpenes, polyphenols and cannabinoids from Cannabis sativa L. inflorescences under microwaves. Ind. Crops Prod. 2021, 162, 113247–113258. [Google Scholar] [CrossRef]
- Calcio Gaudino, E.; Colletti, A.; Grillo, G.; Tabasso, S.; Cravotto, G. Emerging Processing Technologies for the Recovery of Valuable Bioactive Compounds from Potato Peels. Foods 2020, 9, 1598. [Google Scholar] [CrossRef] [PubMed]
- Grillo, G.; Gunjević, V.; Radošević, K.; Redovniković, I.R.; Cravotto, G. Deep Eutectic Solvents and Nonconventional Technologies for Blueberry-Peel Extraction: Kinetics, Anthocyanin Stability, and Antiproliferative Activity. Antioxidants 2020, 9, 1069. [Google Scholar] [CrossRef] [PubMed]
- Grillo, G.; Calcio Gaudino, E.; Rosa, R.; Leonelli, C.; Timonina, A.; Grygiškis, S.; Tabasso, S.; Cravotto, G. Green Deep Eutectic Solvents for Microwave-Assisted Biomass Delignification and Valorisation. Molecules 2021, 26, 798. [Google Scholar] [CrossRef]
- Calcio Gaudino, E.; Grillo, G.; Tabasso, S.; Stevanato, L.; Cravotto, G.; Marjamaa, K.; Pihlajaniemi, V.; Koivula, A.; Aro, N.; Uusitalo, J.; et al. Optimization of ultrasound pretreatment and enzymatic hydrolysis of wheat straw: From lab to semi-industrial scale. J. Clean. Prod. 2022, 380, 134897. [Google Scholar] [CrossRef]
- Moure, A.; Cruz, J.M.; Franco, D.; Dominguez, J.M.; Sineiro, J.; Dominguez, H.; Nunez, M.J.; Parajo, J.C. Natural antioxidants from residual sources. Food Chem. 2001, 72, 145–171. [Google Scholar] [CrossRef]
- Pinto, D.; Vieira, E.F.; Peixoto, A.F.; Freire, C.; Freitas, V.; Costa, P.; Delerue-Matos, C.; Rodrigues, F. Optimizing the extraction of phenolic antioxidants from chestnut shells by subcritical water extraction using response surface methodology. Food Chem. 2021, 334, 127521. [Google Scholar] [CrossRef]
- Gagić, T.; Knez, Ž.; Škerget, M. Subcritical water extraction of chestnut bark and optimization of process parameters. Molecules 2020, 25, 2774. [Google Scholar] [CrossRef]
- Alarcón, M.; Díaz-Maroto, M.C.; Pérez Coello, M.S.; Alañón, M.E. Isolation of natural flavoring compounds from cooperage woods by pressurized hot water extraction (PHWE). Holzforschung 2019, 73, 295–303. [Google Scholar] [CrossRef]
- Beaufils, N.; Boucher, J.; Peydecastaing, J.; Rigal, L.; Vilarem, G.; Villette, M.J.; Candy, L.; Pontaliera, P.Y. The effect of time and temperature on the extraction of xylose and total phenolic compounds with pressurized hot water from hardwood species used for pulp and paper production in the South of France. Bioresour. Technol. Rep. 2021, 16, 100832. [Google Scholar] [CrossRef]
- Basak, S.; Annapure, U.S. The potential of subcritical water as a “green” method for the extraction and modification of pectin: A critical review. Food Res. Int. 2022, 161, 111849. [Google Scholar] [CrossRef]
- Song, E.J.; Ko, M.J. Extraction of monoterpenes from coriander (Coriandrum sativum L.) seeds using subcritical water extraction (SWE) technique. J. Supercrit. Fluids 2022, 188, 105668. [Google Scholar] [CrossRef]
- Gan, A.; Baroutian, S. Subcritical water extraction for recovery of phenolics and fucoidan from New Zealand Wakame (Undaria pinnatifida) seaweed. J. Supercrit. Fluids 2022, 190, 105732. [Google Scholar] [CrossRef]
- Nazir, A.; Khan, K.; Maan, A.; Zia, R.; Giorno, L.; Schroën, K. Membrane separation technology for the recovery of nutraceuticals from food industrial streams. Trends Food Sci. Technol. 2019, 86, 426–438. [Google Scholar] [CrossRef]
- Kumar, A. Chapter 8, Membrane Separation Technology in Processing Bioactive Components. In Functional Food Ingredients and Nutraceuticals; Shi, J., Ed.; CRC Press: Boca Raton, FL, USA, 2006; p. 16. [Google Scholar]
- Conidi, C.; Drioli, E.; Cassano, A. Membrane-based agro-food production processes for polyphenol separation, purification and concentration. Curr. Opin. Food Sci. 2018, 23, 149–164. [Google Scholar] [CrossRef]
- Cravotto, C.; Grillo, G.; Binello, A.; Gallina, L.; Olivares-Vicente, M.; Herranz-López, M.; Micol, V.; Barrajón-Catalán, E.; Cravotto, G. Bioactive Antioxidant Compounds from Chestnut Peels through Semi-Industrial Subcritical Water Extraction. Antioxidants 2022, 11, 988. [Google Scholar] [CrossRef]
- Grillo, G.; Boffa, L.; Talarico, S.; Solarino, R.; Binello, A.; Cavaglià, G.; Bensaid, S.; Telysheva, G.; Cravotto, G. Batch and Flow Ultrasound-Assisted Extraction of Grape Stalks: Process Intensification Design up to a Multi-Kilo Scale. Antioxidants 2020, 9, 730. [Google Scholar] [CrossRef] [PubMed]
- Cassano, A.; De Luca, G.; Conidi, C.; Drioli, E. Effect of polyphenols-membrane interactions on the performance of membrane-based processes. A review. Coord. Chem. Rev. 2017, 351, 45–75. [Google Scholar] [CrossRef]
- Conidi, C.; Rodriguez-Lopez, A.D.; Garcia-Castello, E.M.; Cassano, A. Purification of artichoke polyphenols by using membrane filtration and polymeric resins. Sep. Purif. Technol. 2015, 144, 153–161. [Google Scholar] [CrossRef]
- Oriez, V.; Peydecastaing, J.; Pontalier, P.-Y. Separation of sugarcane bagasse mild alkaline extract components by ultrafiltration–Membrane screening and effect of filtration parameters. Process Biochem. 2019, 78, 91–99. [Google Scholar] [CrossRef]
- de Santana Magalhães, F.; de Souza Martins Sá, M.; Cardoso, V.L.; Miranda Reis, M.H. Recovery of phenolic compounds from pequi (Caryocar brasiliense Camb.) fruit extract by membrane filtrations: Comparison of direct and sequential processes. J. Food Eng. 2019, 257, 26–33. [Google Scholar] [CrossRef]
- Prodanov, M.; Garrido, I.; Vacas, V.; Lebron-Aguilar, R.; Dueñas, M.; Gómez-Cordovés, C.; Bartolomé, B. Ultrafiltration as alternative purification procedure for the characterization of low and high molecular-mass phenolics from almond skins. Anal. Chim. Acta 2008, 609, 241–251. [Google Scholar] [CrossRef] [PubMed]
- Pinto, P.C.R.; Mota, I.F.; Louriero, J.M.; Rodrigues, A.E. Membrane performance and application of ultrafiltration and nanofiltration to ethanol/water extract of Eucalyptus bark. Sep. Purif. Technol. 2014, 132, 234–243. [Google Scholar] [CrossRef]
- Conidi, C.; Donato, L.; Algieri, C.; Cassano, A. Valorization of chestnut processing by-products: A membrane-assisted green strategy for purifying valuable compounds from shells. J. Clean. Prod. 2022, 378, 134564. [Google Scholar] [CrossRef]
- Belwal, T.; Chemat, F.; Venskutonis, P.R.; Cravotto, G.; Jaiswal, D.K.; Bhatt, I.D.; Devkota, H.P.; Luo, Z. Recent advances in scaling-up of non-conventional extraction techniques: Learning from successes and failures. Trends Anal. Chem. 2020, 127, 115895. [Google Scholar] [CrossRef]
- Moure, A.; Franco, D.; Sineiro, J.; Domínguez, H.; Núñez, M.J. Simulation of multistage extraction of antioxidants from Chilean hazelnut (Gevuina avellana) hulls. J. Am. Oil Chem. Soc. 2003, 80, 389–396. [Google Scholar] [CrossRef]
- Zhang, Y.; Xiao, H.; Lv, X.; Zheng, C.; Wu, Z.; Wang, N.; Wang, J.; Chen, H.; Wei, F. Profiling and spatial distribution of phenolic compounds in rapeseed by two-step extraction strategy and targeted metabolomics combined with chemometrics. Food Chem. 2023, 401, 134151. [Google Scholar] [CrossRef]
- Hrnčič, M.K.; Cör, D.; Verboten, M.T.; Knez, Z. Application of supercritical and subcritical fluids in food processing. Food Qual. Saf. 2018, 2, 59–67. [Google Scholar] [CrossRef]
- Both, S.; Chemat, F.; Strube, J. Extraction of polyphenols from black tea—Conventional and ultrasound assisted extraction. Ultrason. Sonochem. 2014, 21, 1030–1034. [Google Scholar] [CrossRef]
- Binello, A.; Grillo, G.; Barge, A.; Allegrini, P.; Ciceri, D.; Cravotto, G. A Cross-Flow Ultrasound-Assisted Extraction of Curcuminoids from Curcuma longa L.: Process Design to Avoid Degradation. Foods 2020, 9, 743. [Google Scholar] [CrossRef]
- Cardoso Ugarte, G.A.; Sosa Morales, M.E.; Ballard, T.; Liceaga, A.; San Martín González, M.F. Microwave-assisted extraction of betalains from red beet (Beta vulgaris). Food Sci. Technol. 2014, 59, 276–282. [Google Scholar] [CrossRef]
- Singleton, V.L.; Orthofer, R.; Lamuela-Raventós, R.M. Analysis of total phenols and other oxidation substrates and antioxidants by means of Folin-Ciocalteu reagent. Methods Enzymol. 1999, 299, 152–178. [Google Scholar] [CrossRef]
- Peri, C.; Pompei, C. Estimation of Different Phenolic Groups in Vegetable Extracts. Phytochemistry 1971, 10, 2187–2189. [Google Scholar] [CrossRef]
- Scalbert, A.; Monties, B.; Janin, G. Tannins in wood: Comparison of different estimation methods. J. Agric. Food Chem. 1989, 37, 1324–1329. [Google Scholar] [CrossRef]
- Brand-Williams, W.; Cuvelier, M.E.; Berset, C. Use of a free radical method to evaluate antioxidant activity. Food Sci. Technol. 1995, 28, 25–30. [Google Scholar] [CrossRef]
- Locatelli, M.; Gindro, R.; Travaglia, F.; Coïsson, J.D.; Rinaldi, M.; Arlorio, M. Study of the DPPH-scavenging activity: Development of a free software for the correct interpretation of data. Food Chem. 2009, 114, 889–897. [Google Scholar] [CrossRef]
- Re, R.; Pellegrino, N.; Proteggente, A.; Pannala, A.; Yang, M.; Rice-Evans, C. Antioxidant activity applying an improved ABTS radical Cation decolorization assay. Free Radic. Biol. Med. 1999, 26, 1231–1237. [Google Scholar] [CrossRef]
- Caprarulo, V.; Giromini, C.; Rossi, L. Review: Chestnut and quebracho tannins in pig nutrition: The effects on performance and intestinal health. Animal 2021, 15, 100064. [Google Scholar] [CrossRef]
- Auad, P.; Spier, F.; Gutterres, M. Vegetable tannin composition and its association with leather tanning effect. Chem. Eng. Commun. 2020, 207, 722–732. [Google Scholar] [CrossRef]
- Spina, S.; Zhou, X.; Segovia, C.; Pizzi, A.; Romagnoli, M.; Giovando, S.; Pasch, H.; Rode, K.; Delmotte, L. Phenolic resin adhesives based on chestnut (Castanea sativa) hydrolysable tannins. J. Adhes. Sci. Technol. 2013, 27, 2103–2111. [Google Scholar] [CrossRef]


Disclaimer/Publisher’s Note: The statements, opinions and data contained in all publications are solely those of the individual author(s) and contributor(s) and not of MDPI and/or the editor(s). MDPI and/or the editor(s) disclaim responsibility for any injury to people or property resulting from any ideas, methods, instructions or products referred to in the content. |
© 2023 by the authors. Licensee MDPI, Basel, Switzerland. This article is an open access article distributed under the terms and conditions of the Creative Commons Attribution (CC BY) license (https://creativecommons.org/licenses/by/4.0/).