Abstract
Early detection of glaucoma is critically important for the prevention of irreversible blindness. We developed a predictive analytic framework through temporal data carpentry and applications of a suite of machine learning and logistic regression methods for the early prediction of glaucoma using electronic health records (EHR) from over 650 hospitals and clinics across the USA. Four different machine-learning classification methods were applied using the whole dataset for predictive analysis. The accuracy, sensitivity, specificity, and f1 score were calculated using five-fold cross-validation to train and refine the models. The XGBoost, multi-layer perceptron (MLP), and random forest (RF) performed comparably well based on the area under the receiver operating characteristics curve (AUC) score of 0.81 for predicting glaucoma one year before the onset of the disease compared to the logistic regression (LR) score of 0.73. This study suggests that the ML methods can capture potential pre-glaucoma patients in advance before the occurrence of clinical symptoms from their history of EHR encounters, thus possibly leading to earlier intervention and preventive treatment.
1. Introduction
Glaucoma is the second-leading cause of irreversible blindness worldwide [1]. About 70 million people worldwide have glaucoma, and about 4.4 million are blind from optic nerve damage due to undiagnosed glaucoma globally [1,2]. In the USA, the American Glaucoma Society has reported that 2.7 million Americans have glaucoma, but only half of these people know that they have it [3]. In many cases, the patient’s intraocular pressure and glaucoma development are undetectable due to the painless and diabolical progression of the disease [4]. Furthermore, glaucoma negatively impacts the quality of life and creates a substantial economic burden overall [1]. In the United States, glaucoma treatment and healthcare costs have been estimated at $2.5 billion per year [5].
Consequently, vision scientists have reported that early detection is key to reducing the burden of glaucoma on the healthcare system [6]. Early detection of glaucoma allows for earlier treatment, possibly avoiding expensive surgical procedures or irreversible blindness. Glaucoma is a heterogeneous condition; patients may have different symptoms and different progression rates. In addition, the current glaucoma growth rate and its economic burdens are unsustainable [7]. As a result, it warrants a systematic evaluation for glaucoma risk assessment and early prediction for better management of glaucoma.
Several risk factors have been reported for the development of glaucoma, including elevated intraocular pressure (IOP) [8], the use of certain medications, older age, a greater optic nerve cup-to-disc ratio, and family history [9,10]. Though it has been demonstrated that lowering IOP reduces the rate of glaucomatous damage and consequent vision loss, current glaucoma predictions are targeted at lowering IOP as a modifiable risk factor. However, in many cases, higher-than-average IOP does not cause neurodegenerative damage or vision loss [11]. IOP alone cannot predict glaucoma development, but comorbidity analysis can be an effective ancillary tool for glaucoma detection in the early stages of the disease [12]. Further, Joanne et al. have reported that systemic disease conditions such as diabetes are associated with a 2.8-fold increased incidence of glaucoma development compared to non-diabetic cohorts [13]. Furthermore, Deokule et al. have reported that vascular conditions, such as coronary artery diseases, indicate glaucoma development and can serve as a prognostic marker [14]. In addition, several population-based cross-sectional studies, such as the Egna-Neumarkt Glaucoma Study, the Rotterdam Eye Study, and the Blue Mountain Eye Studies, have demonstrated an association between elevated blood pressure and glaucoma [14,15,16].
Conversely, medical treatment of systemic diseases—diabetes and hypertension—may have a multifactorial effect on glaucoma onset that has not always been examined in prospective or cross-sectional studies. It is noteworthy to mention that most of these studies were knowledge-based or hypothesis-driven, which suggests that a modest number of pre-set variables were included in their predictive analysis. With the extensive adaptation of electronic health records (EHR) and their supporting secondary use in research [17], we now have the opportunity to apply data-driven retrospective approaches to develop predictive models through understanding comorbidities that impact the onset of glaucoma and their related medications. Moreover, EHR data contains valuable information that can be used for many purposes, including decision-making support [18], prognosis markers for medical concepts [19], and risk assessment [20].
In recent years, machine learning (ML) methods have been successfully applied in many data analytics areas, including clinical data analysis, image classification, diagnosis, and decision support [21]. Bertsimas et al. combined unsupervised and supervised ML methods and predicted near-future healthcare costs for patients [22]. Furthermore, using EHR records, ML methods have been applied to augment risk prediction for glaucoma risk factors, cataract surgery complications, and diabetic retinopathy [23,24,25,26]. Studies have examined the relationship between risk factors and postoperative visual acuity [27,28]. Almazroa et al. have reported automated glaucoma detection using fundus images [29].
Additionally, a systematic review article has reported various ML methods used for risk assessment, progression prediction, and the diagnosis of glaucoma using image techniques [26]. Image processing methods can report lesions that have already occurred at the molecular level. In a recent study, Braganca et al. applied deep learning methods and demonstrated about 90% accuracy in detecting glaucoma from fundus images captured using a smartphone and handheld ophthalmoscope [30]. In contrast, the use of EHR records predicts the onset of glaucoma based on the history of comorbidities. More recently, Baxter et al. reported machine learning-based predictive modeling of glaucoma surgical intervention using EHR records and demonstrated that the prediction of the need for surgical intervention for glaucoma management six months in advance has a certain degree of success [31].
Very few studies have been conducted to investigate the early predictive model for glaucoma onset using EHR data obtained from multiple clinical centers. In the future, a predictive model must focus on a large cohort of a study population representing heterogeneity and diversity, thus bringing clinical value to ophthalmologists.
2. Materials and Methods
2.1. Data Source and Sample
This data was extracted from an extensive EMR database (Cerner Health Facts®), which is comprised of deidentified EHR data from over 650 hospitals and clinics across the USA and represents more than 80 million unique patients. For this study, we retrieved deidentified patient clinical data from 2001–2015, as described earlier [32]. Though the EMR database contains many attributes, we used systemic diseases, medication, and demographic information. Furthermore, the timestamped record of each event provides a temporal relationship between clinical encounters and patterns. The institutional review board (IRB #2006793) approved this study protocol at the University of Missouri. The methods reported in this research can be applied to other registry data collected from other EHR vendors.
2.2. Data Extraction and Feature Representation
The next step in the process included checking the EMR database for the availability of glaucoma patient records using the International Classification of Disease (ICD), ICD9 365, from 2001 to 2015. The inclusion and exclusion criteria for the glaucoma cohort are that patients should have at least two eye-related visits before the diagnosis of glaucoma. We then collected non-glaucoma patient cohorts as a control dataset. Non-glaucoma patients were determined based on eye clinic visits, excluding those not diagnosed with glaucoma code 365. Finally, we used glaucoma and non-glaucoma patient cohorts and retrieved all EHR records associated with those patients’ records, including demographic information, systemic diseases, and laboratory results. All these ICD9 codes related to various diagnoses were aggregated into the superclass three-digit level as one attribute. Similarly, the medication codes were grouped into generic names.
2.3. Data Preprocessing and Temporal Data Modeling
Preprocessing the data involved various filtering, transformation, binarization, and joining techniques to create a data table for the study. We then applied further filtering to exclude patients with no attributes. The final dataset has a total of 830,125 unique patient records, with 135,045 glaucoma patients (labeled as a glaucoma dataset) and 695,080 non-glaucoma patients (marked as a non-glaucoma dataset). These data were organized into temporal order using timestamp information. Each patient record should have at least two variables in a 15-year-wide longitudinal dataset as an inclusion criterion. We subsampled a balanced dataset containing 33,611 unique patient records (16,805 glaucoma patients and 16,806 non-glaucoma patients) as input data for early prediction analysis. All 16,805 glaucoma patients were first diagnosed with the disease during a yearlong period from 2014 to 2015. For early predictive analysis, the input glaucoma dataset contains records up to one year before the diagnosis of glaucoma. There were 32 attributes in the final dataset from demographics, systemic diseases, and medications for analysis (Appendix A). Finally, one-hot encoding converted the categorical variables (race, gender) of n possible values into n binary variables, as shown in Figure 1.
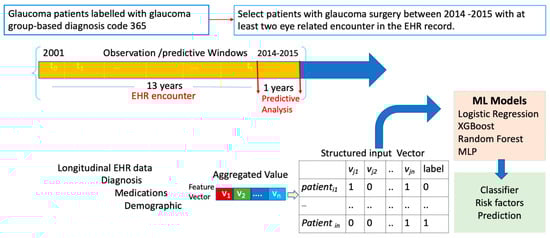
Figure 1.
Overview of data pre-processing and the input data vector for predictive machine learning analysis.
2.4. Machine Learning Models
The data was analyzed using a machine learning library in the Python programming language. First, we randomly split the data into 80% training and 20% testing data for analysis. ML analysis performance was assessed using 5-fold cross-validation, which provides a robust and reliable measurement of model performance [31]. We used the listed parameters for each ML model, as shown in Table 1, for the entire dataset. We trained a series of four algorithms, including logistic regression (LR), random forest (RF), XGBoost (XGB), and multi-layer perceptron (MLP). The functionality of logistic regression, a parametric-based model, and the other models, such as RF and XGB, is non-parametric. We used a loss function, parameter estimation, and complexity reduction for each ML parameter listed in Table 1. These ML methods have been used in several predictive analyses [33,34,35] with a large dataset.

Table 1.
Parameters used in different machine learning methods.
2.5. Model Performance and Hyperparameter Tuning
There are many hyperparameter tuning methods available. We used GridSearchCV from the Scikit-Learn library and selected the best-tuned parameter for model prediction (for MLP: “activation”: “relu”, “alpha”: 0.05), “hidden_layer_sizes”: (10, 30, 10), “learning_rate”: “adaptive”, “solver”: “Adam”) based on the accuracy score and maximizing the overall AUC using 5-fold cross-validation. We also used standard metrics such as the sensitivity, specificity, and F1 score of each model for performance interpretation. The confusion matrix plot was analyzed based on true positive (TP), false positive (FP), true negative (TN), and false-negative (FN) outcomes. For accuracy, the percentage of samples correctly classified as positive is divided by the number of positive examples. We measured the area under the receiver operating characteristic curve and model calibration using the training and testing datasets. We trained several models and tested them with the entire dataset. Each ML model was separately trained with the same set of input data.
3. Results
The overall prevalence of glaucoma estimated from the dataset was about 16%. Among the different race groups, the incidence of glaucoma was higher in African Americans (23.2%), Asians (16.8%), and East Indians (16.2%) compared to other races (i.e., Hispanics (11.0%). When comparing gender, a higher prevalence of glaucoma (16.6%) was observed among the female population than the male population (15.7%) in this dataset. The four machine learning models’ power of prediction is shown in Table 2. The sensitivity for different classifiers of the data showed the highest with MLP (81%), XGBoost (81%), and random forest (81%), followed by logistic regression (73%). We further computed the precision of different models. The MLP has the highest precision (82%), followed by the random forest (83%) and XGBoost (83%). The recall (glaucoma cases) was highest for logistic regression (82%), and XGBoost (83%). Similarly, the actual positive prediction rate is also higher with MLP, Random Forest, and XGBoost than with other models’ performances.
Table 2.
Accuracy metric for evaluating classification models. The highest accuracies (in bold) are from XGBoost and MLP.
The accuracy of model prediction was plotted on the AUC plot, which showed a similar trend. We also performed the ROC of all these models built by different ML algorithms (Figure 2), and the performance of these models was evaluated by examining the true value (the actual glaucoma label) versus the predicted value (the predicted glaucoma label). The plot of TPF (sensitivity) versus FPF (1-specificity) across varying cut-offs generates a curve in the unit square, which shows the tradeoff between the true positive fraction (TPF) and a false-positive fraction (FPF). The ROC curve lying on the diagonal line (black dots) reflects a diagnostic test performance that is no better than the chance level. The ROC curve slope is equal to the ratio of the two density functions describing the separator variable’s distribution at a given point in glaucoma versus the non-glaucoma likelihood ratio. The ROC curve also shows the models’ discriminatory ability and displays how useful the classification model is at distinguishing between glaucoma and non-glaucoma. Further, the error rate (unpredicting the actual label by these models) may be due to the EHR data’s inherent ambiguity or the fact that the heterogeneity of all variability is not saturated in the present dataset. Further, the type 1 error rate is high in LR, and the type II error rate is high in the RF model compared to all other models (Table 3).
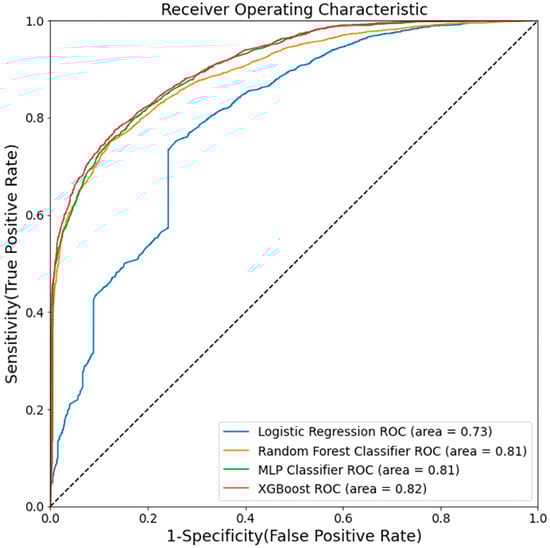
Figure 2.
Area under the curve (AUC) for five machine learning methods. AUC measures the entire two-dimensional area underneath the entire ROC curve.
Table 3.
Elements of the confusion metric for evaluating classification models’ performance assessments for four machine learning models.
We performed a crude and adjusted odds ratio analysis to understand which features could serve as keys for the prediction models. We compared it with the top 5 important variables used for model classification.
Odds ratio analysis has been widely used in clinical research and can directly make inferences from the results. For example, the crude odds ratio between glaucoma and cataract was 1.19, with a 95% confidence interval of 1.13–1.25. The adjusted odds ratio between glaucoma and cataract was 1.36, with a 95% confidence interval of 1.28–1.43. Further, the estimated adjusted odds ratio between glaucoma and obesity was 1.14, with a 95% confidence interval of 1.07–1.21. Similarly, the adjusted odds ratios between glaucoma and atherosclerosis were 1.2 (95% CI: 1.07, 1.34), suggesting that atherosclerosis is also associated with glaucoma compared to non-glaucoma groups (Table 4).
Table 4.
Adjusted odds ratio analysis—1-year data presented only with OR 1.14 and above.
Relevant attributes from RF and LR suggest that many variables are associated with the glaucoma dataset. Notably, the collection of all the results from different methods indicates that cataracts, obesity, and atherosclerosis are associated with an increased risk of developing glaucoma compared to non-glaucoma patient groups. As reported in the literature, hypertension, obesity, type 2 diabetes, and African American races are known risk factors for the onset of glaucoma. Studies have reported many risk factors for the onset of glaucoma [36,37,38]. We identified a new connection between atherosclerosis and glaucoma onset in the present study. The present study shows an association between atherosclerosis and glaucoma. Further study is needed to understand the underlining effect of atherosclerosis on the onset of glaucoma.
4. Discussion
We compared the performance of predictive models, such as RF, LR, XGB, and MLP, using a real-world, large-scale EHR dataset. We observed that the performance of the predicted variables varies from model to model, as it has been reported that no unique algorithm or model works best for every problem. Sramka et al. used a support-vector machine model for the clinical intraocular lens calculator [39], while Lin et al. used the random forest method to predict myopia onset [40]. Further, the logistic regression prediction model has been widely used for decision-making and feature selection [41,42]. Baxter et al. have focused on using deep learning methods to improve the selection of patients for the glaucoma surgical intervention [30]. The present study evaluated the performance of four ML models and found that the RF, XGB, and MLP models produced higher prediction accuracy.
We know that machine learning generally requires a large amount of data, which is a strength of our study. When an outcome depends on a few variables, it is possible to correlate/associate the variables with the disease’s phenotype. However, when the result depends on multiple factors with different temporal and spatial weights, it becomes difficult to pinpoint the variables and their dependencies on the prediction. In addition, some ML algorithms perform better than other algorithms with the same set of variables in a dataset41. Within the same input dataset, the current study also shows that XGBoost, random forest, and MLP prediction accuracy outperform the LR model.
The classification results are shown in Table 2, and the highest accuracy rate was reported in the RF and XGBoost models at 81% compared to the logistic regression classification. We believe that the reason for the higher accuracy in XGBoost and RF is that they use an ensemble learning approach to discover more predictable variables from the medical dataset. The advantage of using ensemble methods in these algorithms is that they allow for a training model with quantitative and qualitative inputs. Furthermore, without prior domain knowledge, the MLP network model predicts well for generalized data. Additionally, when making predictions, the Random Forest and XGBoost had the majority votes in the terminal vote. On the other hand, it has been reported that logistic regression models perform poorly with binary responses because they estimate whether there is an increase or decrease in the predicted log odds of the response variables while holding all other variables constant. That could be a reason for the lower prediction accuracy rate of 73% with LR in the present study. In the early prediction of glaucoma or any other medical or health-related monitoring, false positive diagnoses can be more beneficial for a patient than false negative predictions. For example, telling a patient that they have a higher chance of developing glaucoma and recommending biannual checkups or close monitoring would be more beneficial for the individual than a false negative report where the patient would miss an early warning of glaucoma onset that would develop into glaucoma in the near future.
Overall, the research suggests that the higher accuracy rates obtained from the RF, XGB, and MLP models using the balanced dataset can be considered for predicting glaucoma in a real-world setting. With the present dataset, the prediction accuracy for glaucoma onset was about 81%, which is reasonably significant for glaucoma detection using only EHR data and without observing/analyzing traditional fundus images or optical coherence tomography (OCT) results. Though early diagnosis of glaucoma using ocular coherence tomography (OCT) has been considered significant, it also comes with an inherent error rate of ~20%. Hampton et al. have reported that, in general, only up to 82% of glaucoma diagnoses can be determined using the information provided by medical history and OCT image data [43].
Studies have reported many risk factors for the development and progression of glaucoma. Though age has been reported as a well-known common risk factor for glaucoma [36], understanding exactly how other preventable risk factors increase the risk of glaucoma is necessary to tackle this growing problem. Because several risk factors are implicit with aging, it becomes challenging to draw a line between the aging process and disease progression [37]. Since the present study used age-matched glaucoma and non-glaucoma groups, we did not incur any inferences based on age. Consistent with the existing literature, the present study identified significant risk factors or comorbidities for the development of glaucoma, including cataracts. This analysis also revealed additional risk factors, such as lacrimal disorders, with an OR of about 1.14. While cataracts have long been associated with glaucoma formation, other factors such as primary and chronic angle closure, lacrimal disorders, and obesity are unknown risk factors associated with the development of glaucoma. These findings suggest that this information can be used to inform risk stratification to mitigate glaucoma onset as needed. Further, an independent study is needed to understand the role of lacrimal disorders and obesity in the development of glaucoma onset.
4.1. Interpretation and Clinical Relevance
Only a few common variables were observed between the top three models, suggesting that different algorithms predict different variables as predictors for the model. In the RF model, high BMI, cataracts, lipid metabolism, and abnormal glucose levels are significant predominant predictors of glaucoma, whereas in the LR model, gender, gentamicin, and obesity have higher coefficients with glaucoma (Appendix B). The OR analysis shows that cataracts, atherosclerosis, and Type 2 diabetes led to a higher risk of developing glaucoma. Many studies have reported that African-American race is a significant risk factor for glaucoma. Analysis of the risk factors in the underlying genetic makeup of African Americans, as Blachon et al. have reported, shows that genetic polymorphisms in the mitochondrial cytochrome c oxidase subunit 1, which plays a role in trabecular meshwork function, are higher among African Americans, which may have a role in the increased prevalence of primary open angle glaucoma [44]. Furthermore, obesity, hypertension, cataracts, atherosclerosis, and Type 2 diabetes could be good predictors for the development of glaucoma before its clinical onset. Zhao et al. previously conducted a meta-analysis to better understand the relationship between hypertension and POAG, using IOP as endpoints. They identified 60 studies, including seven longitudinal cohort analyses, from various parts of the world. Virtually all studies showed a positive association between hypertension and POAG. However, when the RF model was compared to the logistic regression model in the current study, hypertension was found to be the most significant risk factor for glaucoma. The RF model predicted hypertension as a top-five critical glaucoma risk factor with the highest accuracy (Appendix B).
Observing only a few common variables between the models suggests that each model uses a different set of variables for prediction. It is critical to understand the clinical relevance of the variables and their uses in the clinical application as an evolution measure of ML-predicted features. Integrating the clinically relevant predictive model into the EHR data would enable healthcare providers to target suitable patients for proper early intervention. The application of an evidence-driven ML predictive model in the clinical setting could be a significant step forward in preventing glaucoma-related vision loss by identifying patients’ susceptibility to the onset of glaucoma and allowing for early intervention.
4.2. Limitations of Predictive Analysis
There are many advantages to using EHR data, as it can contain a longitudinal medical history of patients, including symptoms, laboratory findings, procedures, prescriptions, and test results that can be easily used on a computerized platform [45,46]. The secondary use of EHR data is faster and can collect more measurements from a larger population. However, the longitudinal dataset has significant advantages over the aggregated dataset for the early predictive model. Adapting any ML model in the health care system without further clinical trial examination, on the other hand, can be difficult. We must understand the combined effect of different variables, such as the confounding effect of risk variables, and how long it may take to develop glaucoma after exposure to such variables.
Further, many challenges are associated with leveraging EHR data for predictive analysis because of its complex nature. Extracting information from these heterogeneous datasets requires correct data collection techniques, proper data preprocessing, reasonable dimension reduction, and suitable machine learning algorithms. In addition, building a longitudinal dataset to capture a patient’s history’s temporal events is challenging.
Further, implementing data-driven analysis into the day-to-day workflow is challenging because of the different regulatory systems in various institutions, including insurance, hospital managers, security, and IT teams. In addition, longitudinal data collection requires many patients’ records to capture all possible heterogeneity in the population. Though the ethics and regulations may improve over time, the EHR data also has inherent limitations, including missing, incomplete, and incorrect data. With the sparse and natural missing data of electronic health records, a longitudinal dataset analysis approach works well and yields significantly better predictions than traditional methods. However, more work needs to be done for further validation, and improvements to these methods must be made before implementation in a clinical setting.
5. Conclusions
We have adopted longitudinal data for early prediction of glaucoma using an extensive EHR database. Patients can be screened based on the comorbidities encountered in their electronic health records by ML methods to prevent irreversible blindness from glaucoma. This EHR dataset used in the present study contains real-world heterogeneous data collected from patients’ medical records and demonstrates the prediction of early detection of glaucoma. Furthermore, the ML performance, including random forest, XGB, and MLP, can predict glaucoma versus non-glaucoma conditions with nearly 81% accuracy. The use of real-world data and ML methods can benefit glaucoma specialists and ophthalmologists in identifying glaucoma-susceptible patients far in advance compared to current modalities. With further investigation, we hope that this temporal data mining approach could be employed to provide a powerful tool for delivering early predictive value for glaucoma onset.
Author Contributions
M.R. collected EHR data, developed a temporal model, analyzed data, and wrote the manuscript. K.P.S., a glaucoma fellowship-trained ophthalmologist, surgeon, and clinical researcher, edited the manuscript and provided clinical relevance to the findings. C.-R.S. supervised the project and manuscript writing. All authors have read and agreed to the published version of the manuscript.
Funding
This work’s funding sources include the National Institutes of Health (5T32LM012410 (MR)), the Shumaker Endowment for Biomedical Informatics (CRS), and the National Science Foundation (CNS-1429294) for high-performance computing. The content is solely the authors’ responsibility and does not necessarily represent the funding agencies’ official views.
Institutional Review Board Statement
The study was conducted in accordance with the Declaration of Helsinki and approved by the Institutional Review Board (IRB #2006793) of the University of Missouri, Columbia, MO, USA.
Informed Consent Statement
Informed consent was not required because it was a de-identified, secondary use of the dataset, and all the data were available before the initiation of the study.
Data Availability Statement
This present study used the dataset from Cerner Health Facts®, a deidentified electronic health records database. Researchers can request to access EHR data from Cerner for research purposes.
Conflicts of Interest
The authors declare no conflict of interest.
Appendix A
Table A1.
List of variables used in this study.
Table A1.
List of variables used in this study.
| Variables Name | Description |
|---|---|
| Gender | Male: 0, Female: 1 |
| Cataract | Yes: 1, No: 0 |
| Type_one | Yes: 1, No: 0 |
| Type_two | Yes: 1, No: 0 |
| Hypertension | Yes: 1, No: 0 |
| Hypotension | Yes: 1, No: 0 |
| Atherosclerosis | Yes: 1, No: 0 |
| Lipoid_metabolism_disorder | Yes: 1, No: 0 |
| Ischemic_heart_disease | Yes: 1, No: 0 |
| Obesity | Yes: 1, No: 0 |
| Lacrimal_disorder | Yes: 1, No: 0 |
| Multivitamins | Yes: 1, No: 0 |
| Steroids | Yes: 1, No: 0 |
| Aspirin | Yes: 1, No: 0 |
| Allopurinol | Yes: 1, No: 0 |
| Atropine | Yes: 1, No: 0 |
| Bacitracin | Yes: 1, No: 0 |
| Chloramphenicol | Yes: 1, No: 0 |
| Gentamicin | Yes: 1, No: 0 |
| Gramicidin | Yes: 1, No: 0 |
| Phenylephrine | Yes: 1, No: 0 |
| Polymyxin | Yes: 1, No: 0 |
| Sulfacetamide | Yes: 1, No: 0 |
| Abnormal_glucose > 150 | Yes: 1, No: 0 |
| Bmi_high > 25 | Yes: 1, No: 0 |
| Glaucoma | Yes: 1, No: 0 |
| African_american | Yes: 1, No: 0 |
| Asian | Yes: 1, No: 0 |
| Caucasian | Yes: 1, No: 0 |
| Hispanic | Yes: 1, No: 0 |
| Native_american | Yes: 1, No: 0 |
| Others | Yes: 1, No: 0 |
Appendix B
Table A2.
Different futures were identified as an important variable by two different methods random forecast vs Logistic regression.
Table A2.
Different futures were identified as an important variable by two different methods random forecast vs Logistic regression.
| Random Forest | Logistic Regression | ||||
|---|---|---|---|---|---|
| Variable | Importance | Variable | Coef | ||
| 0 | bmi_high | 0.133672 | 0 | gender | 0.540924 |
| 1 | abnormal_glucose | 0.093242 | 1 | gentamicin | 0.489303 |
| 2 | cataract | 0.068141 | 2 | obesity | 0.329181 |
| 3 | caucasian | 0.057031 | 3 | atherosclerosis | 0.295286 |
| 4 | hypertension | 0.056665 | 4 | multivitamins | 0.234677 |
| 5 | lipoid_metabolism_disorder | 0.047942 | 5 | cataract | 0.20598 |
| 6 | steroids | 0.047653 | 6 | hypotension | 0.091375 |
| 7 | phenylephrine | 0.04337 | 7 | lacrimal_disorder | 0.014897 |
| 8 | gender | 0.041951 | 8 | lipoid_metabolism_disorder | −0.034049 |
| 9 | type_two | 0.041583 | 9 | steroids | −0.048018 |
| 10 | obesity | 0.035984 | 10 | allopurinol | −0.071397 |
| 11 | aspirin | 0.035866 | 11 | ischemic_heart_disease | −0.11569 |
| 12 | ischemic_heart_disease | 0.030035 | 12 | aspirin | −0.119863 |
| 13 | gentamicin | 0.028629 | 13 | bacitracin | −0.122621 |
| 14 | lacrimal_disorder | 0.027897 | 14 | type_two | −0.149788 |
| 15 | asian | 0.027581 | 15 | type_one | −0.197948 |
| 16 | atropine | 0.026235 | 16 | polymyxin | −0.425122 |
| 17 | multivitamins | 0.023966 | 17 | hypertension | −0.539789 |
| 18 | african_american | 0.022628 | 18 | abnormal_glucose | −0.865936 |
| 19 | bacitracin | 0.022618 | 19 | atropine | −0.971731 |
| 20 | hypotension | 0.018316 | 20 | phenylephrine | −1.107889 |
| 21 | polymyxin | 0.018084 | 21 | asian | −1.163533 |
| 22 | atherosclerosis | 0.014749 | 22 | bmi_high | −1.692346 |
| 23 | type_one | 0.012155 | 23 | hispanic | −2.216769 |
| 24 | hispanic | 0.010955 | 24 | african_american | −2.672737 |
| 25 | allopurinol | 0.008204 | 25 | others | −2.794777 |
| 26 | others | 0.00485 | 26 | caucasian | −3.364577 |
References
- Tham, Y.C.; Li, X.; Wong, T.Y.; Quigley, H.A.; Aung, T.; Cheng, C.Y. Global prevalence of glaucoma and projections of glaucoma burden through 2040: A systematic review and meta-analysis. Ophthalmology 2014, 121, 2081–2090. [Google Scholar] [CrossRef] [PubMed]
- Stevens, G.A.; White, R.A.; Flaxman, S.R.; Price, H.; Jonas, J.B.; Keeffe, J.; Leasher, J.; Naidoo, K.; Pesudovs, K.; Resnikoff, S.; et al. Global prevalence of vision impairment and blindness: Magnitude and temporal trends, 1990–2010. Ophthalmology 2013, 120, 2377–2384. [Google Scholar] [CrossRef] [PubMed]
- Malihi, M.; Moura Filho, E.R.; Hodge, D.O.; Sit, A.J. Long-term trends in glaucoma-related blindness in Olmsted County, Minnesota. Ophthalmology 2014, 121, 134–141. [Google Scholar] [CrossRef] [PubMed]
- Bourne, R.R.; Stevens, G.A.; White, R.A.; Smith, J.L.; Flaxman, S.R.; Price, H.; Jonas, J.B.; Keeffe, J.; Leasher, J.; Naidoo, K.; et al. Causes of vision loss worldwide, 1990–2010: A systematic analysis. Lancet Glob. Health 2013, 1, e339–e349. [Google Scholar] [CrossRef]
- Rylander, N.R.; Vold, S.D. Cost analysis of glaucoma medications. Am. J. Ophthalmol. 2008, 145, 106–113. [Google Scholar] [CrossRef]
- Rouland, J.-F.; Berdeaux, G.; Lafuma, A. The economic burden of glaucoma and ocular hypertension. Drugs Aging 2005, 22, 315–321. [Google Scholar] [CrossRef]
- Howdon, D.; Rice, N. Health care expenditures, age, proximity to death and morbidity: Implications for an aging population. J. Health Econ. 2018, 57, 60–74. [Google Scholar] [CrossRef]
- Medeiros, F.A.; Lisboa, R.; Weinreb, R.N.; Liebmann, J.M.; Girkin, C.; Zangwill, L.M. Retinal ganglion cell count estimates associated with the early development of visual field defects in glaucoma. Ophthalmology 2013, 120, 736–744. [Google Scholar] [CrossRef]
- Na, J.H.; Lee, K.; Lee, J.R.; Baek, S.; Yoo, S.J.; Kook, M.S. Detection of macular ganglion cell loss in preperimetric glaucoma patients with localized retinal nerve fiber defects by spectral-domain optical coherence tomography. Clin. Exp. Ophthalmol. 2013, 41, 870–880. [Google Scholar] [CrossRef]
- Lisboa, R.; Leite, M.T.; Zangwill, L.M.; Tafreshi, A.; Weinreb, R.N.; Medeiros, F.A. Diagnosing preperimetric glaucoma with spectral domain optical coherence tomography. Ophthalmology 2012, 119, 2261–2269. [Google Scholar] [CrossRef]
- Mantravadi, A.V.; Vadhar, N. Glaucoma. Prim. Care 2015, 42, 437–449. [Google Scholar] [CrossRef]
- Harasymowycz, P.; Birt, C.; Gooi, P.; Heckler, L.; Hutnik, C.; Jinapriya, D.; Shuba, L.; Yan, D.; Day, R. Medical Management of Glaucoma in the 21st Century from a Canadian Perspective. J. Ophthalmol. 2016, 2016, 6509809. [Google Scholar] [CrossRef]
- Katz, J.; Sommer, A. Risk factors for primary open angle glaucoma. Am. J. Prev. Med. 1988, 4, 110–114. [Google Scholar] [CrossRef]
- Deokule, S.; Weinreb, R.N. Relationships among systemic blood pressure, intraocular pressure, and open-angle glaucoma. Can. J. Ophthalmol. 2008, 43, 302–307. [Google Scholar] [CrossRef]
- Dielemans, I.; Vingerling, J.R.; Algra, D.; Hofman, A.; Grobbee, D.E.; de Jong, P.T. Primary open-angle glaucoma, intraocular pressure, and systemic blood pressure in the general elderly population. The Rotterdam Study. Ophthalmology 1995, 102, 54–60. [Google Scholar] [CrossRef]
- Bonomi, L.; Marchini, G.; Marraffa, M.; Bernardi, P.; Morbio, R.; Varotto, A. Vascular risk factors for primary open angle glaucoma: The Egna-Neumarkt Study. Ophthalmology 2000, 107, 1287–1293. [Google Scholar] [CrossRef]
- Safran, C.; Bloomrosen, M.; Hammond, W.E.; Labkoff, S.; Markel-Fox, S.; Tang, P.C.; Detmer, D.E.; Expert, P. Toward a national framework for the secondary use of health data: An American Medical Informatics Association White Paper. J. Am. Med. Inf. Assoc. 2007, 14, 1–9. [Google Scholar] [CrossRef]
- Kuperman, G.J.; Bobb, A.; Payne, T.H.; Avery, A.J.; Gandhi, T.K.; Burns, G.; Classen, D.C.; Bates, D.W. Medication-related clinical decision support in computerized provider order entry systems: A review. J. Am. Med. Inf. Assoc. 2007, 14, 29–40. [Google Scholar] [CrossRef]
- Jiang, M.; Chen, Y.; Liu, M.; Rosenbloom, S.T.; Mani, S.; Denny, J.C.; Xu, H. A study of machine-learning-based approaches to extract clinical entities and their assertions from discharge summaries. J. Am. Med. Inf. Assoc. 2011, 18, 601–606. [Google Scholar] [CrossRef]
- Persell, S.D.; Dunne, A.P.; Lloyd-Jones, D.M.; Baker, D.W. Electronic health record-based cardiac risk assessment and identification of unmet preventive needs. Med. Care 2009, 47, 418–424. [Google Scholar] [CrossRef]
- Kononenko, I. Machine learning for medical diagnosis: History, state of the art and perspective. Artif. Intell. Med. 2001, 23, 89–109. [Google Scholar] [CrossRef] [PubMed]
- Bertsimas, D.; Bjarnadóttir, M.V.; Kane, M.A.; Kryder, J.C.; Pandey, R.; Vempala, S.; Wang, G. Algorithmic prediction of healthcare costs. Oper. Res. 2008, 56, 1382–1392. [Google Scholar] [CrossRef]
- Akter, N.; Fletcher, J.; Perry, S.; Simunovic, M.P.; Briggs, N.; Roy, M. Glaucoma diagnosis using multi-feature analysis and a deep learning technique. Sci. Rep. 2022, 12, 8064. [Google Scholar] [CrossRef]
- Saleh, E.; Blaszczynski, J.; Moreno, A.; Valls, A.; Romero-Aroca, P.; de la Riva-Fernandez, S.; Slowinski, R. Learning ensemble classifiers for diabetic retinopathy assessment. Artif. Intell. Med. 2018, 85, 50–63. [Google Scholar] [CrossRef]
- Fraccaro, P.; Nicolo, M.; Bonetto, M.; Giacomini, M.; Weller, P.; Traverso, C.E.; Prosperi, M.; OSullivan, D. Combining macula clinical signs and patient characteristics for age-related macular degeneration diagnosis: A machine learning approach. BMC Ophthalmol. 2015, 15, 10. [Google Scholar] [CrossRef] [PubMed]
- Omkar, G.K.; Elaine, W.G.; David, F.; Landon, G. Evaluating machine learning classifers for glaucoma referral decision support in primary care settings. Sci. Rep. 2022, 12, 8518. [Google Scholar]
- Lundström, M.; Goh, P.-P.; Henry, Y.; Salowi, M.A.; Barry, P.; Manning, S.; Rosen, P.; Stenevi, U. The changing pattern of cataract surgery indications: A 5-year study of 2 cataract surgery databases. Ophthalmology 2015, 122, 31–38. [Google Scholar] [CrossRef]
- Lundström, M.; Barry, P.; Henry, Y.; Rosen, P.; Stenevi, U. Visual outcome of cataract surgery; study from the European Registry of Quality Outcomes for Cataract and Refractive Surgery. J. Cataract. Refract. Surg. 2013, 39, 673–679. [Google Scholar] [CrossRef]
- Almazroa, A.; Alodhayb, S.; Raahemifar, K.; Lakshminarayanan, V. An automatic image processing system for glaucoma screening. Int. J. Biomed. Imaging 2017, 2017, 4826385. [Google Scholar] [CrossRef]
- Bragança, C.P.; Torres, J.M.; Soares, C.P.; Macedo, L.O. Detection of Glaucoma on Fundus Images Using Deep Learning on a New Image Set Obtained with a Smartphone and Handheld Ophthalmoscope. Healthcare 2022, 10, 2345. [Google Scholar] [CrossRef]
- Baxter, S.L.; Marks, C.; Kuo, T.T.; Ohno-Machado, L.; Weinreb, R.N. Machine Learning-Based Predictive Modeling of Surgical Intervention in Glaucoma Using Systemic Data From Electronic Health Records. Am. J. Ophthalmol. 2019, 208, 30–40. [Google Scholar] [CrossRef] [PubMed]
- Raju, M.; Chisholm, M.; Mosa, A.S.; Shyu, C.R.; Faunfelder, F.W. Investigating Risk Factors for Cataract Using the Cerner Health Facts Database. J. Eye Cataract. Surg. 2017, 3, 1–6. [Google Scholar] [CrossRef]
- Kuhn, M.; Johnson, K. Applied Predictive Modeling; Springer: Berlin/Heidelberg, Germany, 2013; Volume 26. [Google Scholar]
- Chatterjee, A.; Gerdes, M.W.; Martinez, S.G. Identification of Risk Factors Associated with Obesity and Overweight-A Machine Learning Overview. Sensors 2020, 20, 2734. [Google Scholar] [CrossRef] [PubMed]
- Parker, C.A.; Liu, N.; Wu, S.X.; Shen, Y.; Lam, S.S.W.; Ong, M.E.H. Predicting hospital admission at the emergency department triage: A novel prediction model. Am. J. Emerg. Med. 2019, 37, 1498–1504. [Google Scholar] [CrossRef]
- Mowbray, F.; Zargoush, M.; Jones, A.; de Wit, K.; Costa, A. Predicting hospital admission for older emergency department patients: Insights from machine learning. Int. J. Med. Inf. 2020, 140, 104163. [Google Scholar] [CrossRef]
- McMonnies, C.W. Glaucoma history and risk factors. J. Optom. 2017, 10, 71–78. [Google Scholar] [CrossRef]
- Buys, Y.M.; Gaspo, R.; Kwok, K. Canadian Glaucoma Risk Factor Study G: Referral source, symptoms, and severity at diagnosis of ocular hypertension or open-angle glaucoma in various practices. Can. J. Ophthalmol. 2012, 47, 217–222. [Google Scholar] [CrossRef]
- Sramka, M.; Slovak, M.; Tuckova, J.; Stodulka, P. Improving clinical refractive results of cataract surgery by machine learning. PeerJ 2019, 7, e7202. [Google Scholar] [CrossRef]
- Lin, H.; Long, E.; Ding, X.; Diao, H.; Chen, Z.; Liu, R.; Huang, J.; Cai, J.; Xu, S.; Zhang, X.; et al. Prediction of myopia development among Chinese school-aged children using refraction data from electronic medical records: A retrospective, multicentre machine learning study. PLoS Med. 2018, 15, e1002674. [Google Scholar] [CrossRef]
- Gajare, S.; Sonawani, S. Improved logistic regression approach in feature selection for EHR. In Advances in Intelligent Systems and Computing; Springer: Berlin/Heidelberg, Germany, 2020; Volume 940, pp. 325–334. [Google Scholar]
- Ting, D.S.W.; Peng, L.; Varadarajan, A.V.; Keane, P.A.; Burlina, P.M.; Chiang, M.F.; Schmetterer, L.; Pasquale, L.R.; Bressler, N.M.; Webster, D.R.; et al. Deep learning in ophthalmology: The technical and clinical considerations. Prog. Retin. Eye Res. 2019, 72, 100759. [Google Scholar] [CrossRef]
- Hampton, J.R.; Harrison, M.J.; Mitchell, J.R.; Prichard, J.S.; Seymour, C. Relative contributions of history-taking, physical examination, and laboratory investigation to diagnosis and management of medical outpatients. Br. Med. J. 1975, 2, 486–489. [Google Scholar] [CrossRef]
- Collins, D.W.; Gudiseva, H.V.; Chavali, V.R.; Trachtman, B.; Ramakrishnan, M.; Merritt, I.I.I.W.T.; Pistilli, M.; Rossi, R.A.; Blachon, S.; Sankar, P.S.; et al. The MT-CO1 V83I Polymorphism is a Risk Factor for Primary Open-Angle Glaucoma in African American Men. Invest. Ophthalmol. Vis. Sci. 2018, 59, 1751–1759. [Google Scholar] [CrossRef]
- Mei, J.; Xia, E. Knowledge learning symbiosis for developing risk prediction models from regional EHR repositories. Stud. Health Technol. Inform. 2019, 264, 258–262. [Google Scholar]
- Leite, D.; Campelos, M.; Fernandes, A.; Batista, P.; Beirao, J.; Menere, P.; Cunha, A. Machine Learning automatic assessment for glaucoma and myopia based on Corvis ST data. Procedia Comput. Sci. 2022, 196, 454–460. [Google Scholar] [CrossRef]


Disclaimer/Publisher’s Note: The statements, opinions and data contained in all publications are solely those of the individual author(s) and contributor(s) and not of MDPI and/or the editor(s). MDPI and/or the editor(s) disclaim responsibility for any injury to people or property resulting from any ideas, methods, instructions or products referred to in the content. |
© 2023 by the authors. Licensee MDPI, Basel, Switzerland. This article is an open access article distributed under the terms and conditions of the Creative Commons Attribution (CC BY) license (https://creativecommons.org/licenses/by/4.0/).