Abstract
The use of concrete with aggregates with reduced environmental impact, as is the case of concrete with siderurgical aggregates (recovered slags), will inevitably increase in the future, as a result of policies promoting development of more sustainable construction materials. These concretes offer an excellent response to static loads, but their behaviour under dynamic loads has not yet been studied. The aim of this study is to characterize the fatigue behaviour, in terms of fatigue limit, of a concrete with siderurgical aggregates by comparing it with an analogous conventional limestone concrete. This characterization was carried out using the Locati method, which stands out for its convenience, speed and low cost, with the feature of being carried out at a high frequency corresponding to the resonance frequency. Performing high-frequency tests has drastically reduced test times and thus costs. Likewise, the results obtained show that, using various criteria found in the literature, concrete with siderurgical aggregates has a higher fatigue limit in absolute terms (MPa), but a lower one in relative terms (% fc).
1. Introduction
We are gradually becoming aware of the need to take care of the environment and impose more sustainable types of construction in which, fundamentally, materials with reduced environmental impact are proposed. One of the options contemplated to achieve more sustainable construction is the use of concrete manufactured with value-added electric arc furnace slags (EAFS) as aggregate. These siderurgical aggregates (value-added EAFS) are usually deposited in inert landfills, while their use in concrete can save 35% in CO2 emissions without taking into account transport or the manufacturing of materials [1].
The use of siderurgical aggregates in concrete provides general improvement in the mechanical properties of concrete, mainly due to the high quality of the interfacial transition zone (ITZ) between aggregates and paste [2] and to their irregular shape and high tenacity [3]. Compared with concretes that use conventional aggregates, siderurgical aggregate concrete exhibits considerably higher compressive strengths [4,5,6,7,8] that enable high strength concrete [9] to be obtained easily. However, the property that increases the most is the modulus of elasticity, largely due to the high modulus of elasticity of siderurgical aggregates [6,10], which increases proportionally to replacement ratio [11].
Although it has been demonstrated that siderurgical aggregate concrete can have high quality mechanical and durability [12,13] properties, at present, there are no previous studies that evaluate the fatigue behaviour of this type of concrete. Even though concrete elements are not usually exposed to cyclic loads, there are some typical concrete components which are subjected to this type of stress such as railway superstructure elements, bridges, wind turbine foundations or offshore structures [14,15,16,17]. It is worth noting that in some of these applications a higher density is beneficial, as it increases the stability of the components, for example, in the case of railway superstructure elements or foundations. The presence of EAFS increases the density [2], so the use of siderurgical aggregate concrete can be of particular interest in such applications. However, before being able to use this type of concrete for these applications, it should be verified that these concretes have a good response to cyclic loading.
Fatigue is a process of progressive and permanent material damage under repeated loading, in such a way that in the end, the component breaks under loads lower than those it was able to resist initially. This reduction in the mechanical properties is due to the growth of defects inside the component [14,15,16]. In general, fatigue has three parts, a first one of crack initiation, a second one of crack propagation and finally, a third one when the specimen is about to break [17,18]. In the case of concrete, where micro-cracks already exist intrinsically, the initial state of these micro-cracks or some phenomenon that accelerates the growth of these cracks can be critical in the fatigue life of concrete, more so given that concrete is a highly heterogeneous material. For these reasons, damage micromechanisms must be studied explicitly. Several authors have concluded that in the case of fatigue in concrete, the dominant cracks generally arise either from the paste-aggregate interface or from pores, indicating that flaky geometry of the aggregates is of particular importance in the fatigue behaviour of concrete [19,20,21].
There are two main types of fatigue tests for concrete: bending fatigue and compressive fatigue tests. In the case of bending fatigue tests, they are mainly used to study reinforced or fibre-reinforced concrete [22,23,24]. In the case of compressive fatigue, they are normally used to study the behaviour of plane concrete [14,16]. In this research, when seeking to analyse the influence of the presence of EAFS, it was decided to use plane concrete and consequently, compressive fatigue tests were performed. There are also a large number of methods to characterise concrete fatigue. The reference method for fatigue characterisation is S-N curves, but this method requires a large number of tests (minimum 10) of long duration. The Staircase method is another widely used method, although it also requires a large number of tests and only enables the fatigue limit to be determined. Another method used to determine the fatigue limit is the Locati method, which aims to define the fatigue limit by means of a single fatigue test, thus reducing both the time and cost of fatigue characterisation tests.
Besides using different test methods, there are other ways to reduce the characterisation time, such as, for example, characterisation by resonant fatigue. Resonant fatigue is a type of fatigue test in which the fatigue test is performed at the resonant frequency of the machine + specimen assembly. Sainz-Aja et al. [25] recommend frequency range for concrete fatigue testing between 1 and 15 Hz. Low frequency (<1 Hz) reduces the fatigue limit because it increases the test time, creep damage. Comparing moderate frequency (10 Hz) and tests at very high frequency (90 Hz) it has been shown that temperature increases above 65 °C can significantly magnify creep damage. Resonant fatigue is a relatively widespread type of fatigue test for metals, whereas only a few studies have been carried out for concrete. In the case of conventional concretes, only one work was found in which fatigue at very high frequency was characterised. Thomas et al. [17] tested and compared a high-performance self-compacting concrete at moderate and very high frequency by means of S-N curves. In the case of recycled concrete, three works were found [18,26,27]. Cantero et al. [18] analysed the effect of different percentages of recycled aggregate and cement. Sainz-Aja et al. [26] compared the Locati method and the Staircase method in resonant fatigue. Sainz-aja et al. [27] compared the fatigue limits obtained by the Locati method of 3 recycled concretes tested at moderate friction and resonant frequency.
The most common scenarios in which today it can be detected fatigue failures are slender structures. It is increasingly common to reduce thicknesses, due to the increase in the resistance of materials, as is the case of skyscrapers, railway sleepers and bridges. In these cases, it is considered convenient to take into account possible fatigue damage.
In this research, resonance Locati fatigue tests have been performed on two different concrete mixes; a reference limestone concrete and a concrete mix with fine and coarse siderurgical aggregates. During these tests strain, resonance frequency and temperature were recorded. Based on these parameters, the fatigue limit of both types of concrete could be determined and, subsequently, the effect of the presence of EAFS on the fatigue behaviour of the concretes was analysed.
2. Methodology
2.1. Materials and Mix Proportions
The development of the research is based on the comparison of a concrete with siderurgical aggregates (SA) with a conventional concrete with natural aggregates (NA), which are limestone aggregates, to verify the goodness of siderurgical aggregates. The properties of SA depend on the properties of the scrap and the production process with which the EAFS are obtained, so it is necessary to carry out a complete physical-mechanical characterization of this aggregate. Table 1 shows the composition in oxides by XRF, which was complemented with an analysis by XRD, finding that magnetite, wuestite, magnesioferrite and calcium silicate were the main crystalline phases. Table 2 shows the physical properties of the aggregates used, among which SA’s ostensibly higher density (44%) and similar water absorption should be remarked.

Table 1.
Oxide composition of the different fraction of siderurgical aggregates (% wt.).
Table 2.
Physical properties of the aggregates used.
The two mixes (Table 3) were designed by the Fuller method using the same amount of water, cement (CEM I 52.5R [28]), superplasticizer additive and the same volume of aggregates, to facilitate their comparison. Figure 1 shows the distribution of the granulometric skeleton of the 2 mixes, which are described below:
Table 3.
Concrete mix proportions (kg/m3).
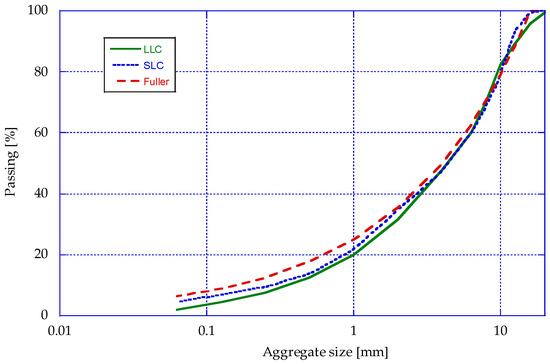
Figure 1.
Grading distribution of the designed mixes.
- A reference limestone concrete mix with fines and coarse limestone fractions (LLC).
- A concrete mix with fine and coarse siderurgical aggregate fractions, which also incorporates limestone sand (SLC) to compensate for the lack of fines of SA (a typical issue for this aggregate [29]).
The mixing of the concrete was carried out in three phases. A first phase of mixing for 3 min with the aggregates, cement, and water, a second phase of 3 min rest and a third phase of 2 min with the incorporation of the superplasticizer additive. A needle vibration was performed. The specimens were removed from the mould 24 h after their manufacture, then introduced to cure in a chamber at 95 ± 5% humidity and a temperature of 20 ± 2 °C for 28 days, as established by EN-12390-2 [30].
2.2. Physical and Mechanical Characterization of Concrete
The physical properties at 28 days were determined on 6 cylindrical specimens of 150 × 100 mm cut from standard cylindrical specimens (150 × 300 mm). The bulk (Db), apparent (Da), and saturated surface dry (Dssd) densities were determined, following the indications of EN 12390-7. Additionally, the accessible porosity (% vol.) and the water absorption coefficient (% wt.) were determined in accordance with the formulations described in UNE 83980.
Regarding the conventional mechanical properties at 28 days, the compressive strength (fc) was obtained on 5 cubic specimens of 100 mm in accordance with EN 12390-3, using a universal servo-hydraulic press of 2500 kN capacity and a speed of application of the load of 5 kN/s. The secant elastic modulus under compression (E) was determined in accordance with EN 12390-13, using 3 standard cylindrical test specimens capped with sulphur on their upper faces and fitted with 120 mm long, 120 Ω strain gauges, using method B. The tensile splitting strength (fct) was determined on 3 standard cylindrical specimens in accordance with EN 12390-6, using a universal servo-hydraulic press of 2500 kN capacity and a load application speed of 3.5 kN/s.
2.3. Fatigue Test
This methodology allows the determination of the fatigue limit using very few specimens in record time, taking measurements of the resonance frequency and strain of the specimens, in addition to the surface temperature of the specimens. The limitation is that the maximum capacity of the press is almost reached, having to use smaller specimens when the characteristic resistances of the concrete are higher than those of the SLC mix.
Fatigue characterisation was done by means of Locati fatigue tests at resonance frequency, in this case ~90 hz. The Locati test consists of applying increasing load steps in a concatenated manner until specimen failure. Each of these load steps has a duration of 2 × 10⁵ cycles. At the end of these cycles, the next step is taken, increasing the maximum load value, while keeping the minimum value constant. In Figure 2, a sketch of the loads applied to the specimen during each test can be seen.
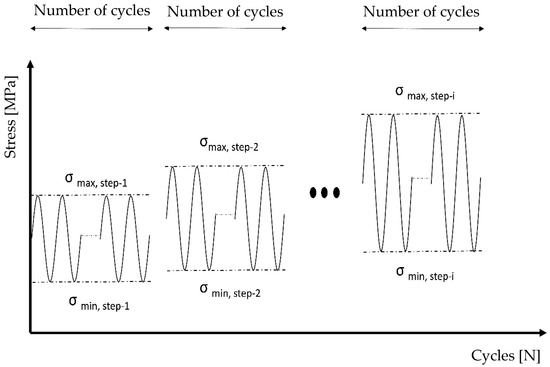
Figure 2.
Locati test scheme.
The load to be applied in each step depends on the test concrete characteristics, specifically the compressive strength; therefore, each step applies a percentage of the fc, setting the minimum load applying a stress ratio of 10% of the maximum load. The loads to be applied in each step for each concrete mix (LLC and SLC) appear in Table 4.
Table 4.
Applied loads in each step of the Locati fatigue test.
The tests were carried out on two cylindrical specimens of 100 × 200 mm per mix (LLC and SLC) at the age of approximately 8 months. A Zick servohydraulic press with a capacity of 400 kN that allows dynamic loading was used. This press provides dynamic loads at the resonance frequency of the specimen–machine set. The upper face of the specimens was cut and polished, while the specimens were fitted with two strain gauges placed diametrically opposite each other. Two-millimeter long gauges were used (Tokyo Sokki Kenkyujo Co. Ltd. model PL-60-11-1LJC-F (120 ± 5 Ω)). The gauges were affixed to the specimens by means of a two-component epoxy resin.
An IRISYS model IRI 1011 thermographic camera was used to record the evolution of the temperature on the surface of the specimens; as a result of internal friction, the camera was positioned outside the resonance chamber to avoid vibrations. Likewise, a stress-strain record was kept by means of digital data collection, and the resonance frequency was recorded during each load cycle using the software of the test equipment. Figure 3 shows the experimental setup used for these tests. It is worth mentioning that in order to carry out the test, the traditional setup of the servo-hydraulic press had to be modified. This machine usually works in tension (e.g., tests on steel cords and bars) so two rigid mechanized steel bases have been bolted to the upper and lower jaws and a ball joint has been placed between the upper plate and the specimen.
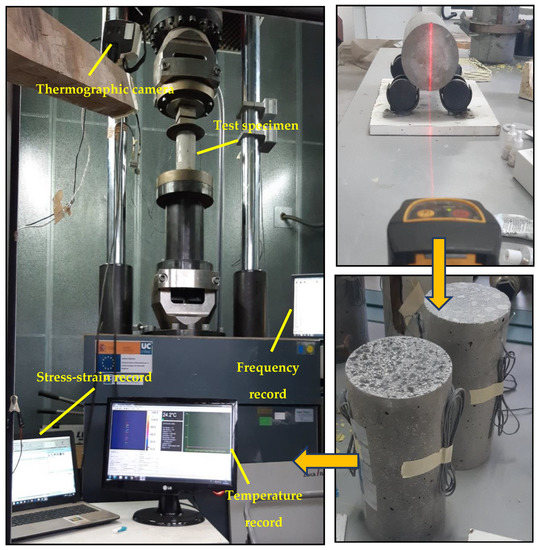
Figure 3.
Preparation of the specimens and experimental setup used.
The data to be analysed were the evolution of the resonance frequency with the number of steps, the evolution of the strain (maximum, mean, and range of the strain) with the number of steps, and the evolution of the temperature with the number of steps. The fatigue limit was defined using two criteria: 80% of the tension range of the step when the crack occurs [31] and the previous step in which there was a drop in the resonance frequency [32]. A comparison was made between the two mixes used (LLC and SLC) since there was no similar study in the literature with concrete mixes with siderurgical aggregates (a priori stiffer). This comparison of their behaviour with conventional concretes could open the doors to its use in new applications in civil engineering.
3. Results
This section may be divided by subheadings. It should provide a concise and precise description of the experimental results, their interpretation, as well as the experimental conclusions that can be drawn.
3.1. Physical and Mechanical Properties of Concrete
Figure 4 shows the physical properties of the two mixes manufactured with their standard deviations. It can be observed that the bulk density (Db) of the SLC mix is 20% higher than that of the LLC mix, due to the high density of the siderurgical aggregates.
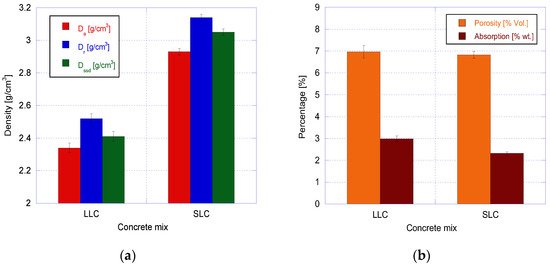
Figure 4.
Physical properties of the mixes produced; (a) densities and (b) porosity and absorption.
Likewise, the water absorption of LLC mix is higher, but as this parameter depends on the bulk density of the material, it is not the most suitable parameter to compare mixes with different specific weights. Porosity, however, determines the relationship between the volume of accessible pores and the apparent volume and is similar for both mixes, being around 7%, with below 10% being considered a good value [12]. These results show that concrete vibration was extremely effective with the SLC mix, highlighting the importance of this action for any mix with siderurgical aggregates.
Table 5 shows the compressive strengths developed by the mixes together with their standard deviations. Natural aggregates have a smooth and spherical surface that does not favour an excessively strong bond between paste and aggregate. The SA concretes show an improved ITZ, favoured by the shape of the siderurgical aggregates, which makes the aggregate interlock with the paste and increases the friction between the two [33]. This is reflected in the compressive strength, which is 42% higher in the SLC mix than in the reference mix (LLC), which is due to the replacement of all the coarse aggregate and part of the fine aggregates by siderurgical aggregates.
Table 5.
Mechanical properties of the mixes produced.
The same explanation, although with a lesser effect, can be used to justify the difference in elastic modulus (20% higher in the SLC mix) which is also caused by the high elastic modulus of the siderurgical aggregates themselves. The increase in compressive strength leads to a less-than-proportional increase in tensile strength (16%), which is one of the reasons that increasing strength also increases the brittleness of the cement paste.
3.2. Fatigue Test
Figure 5 shows the evolution of the resonance frequency over time, where each load step can be seen, which in turn corresponds to 2 × 10⁵ load–unload cycles. For the LLC mix (Figure 5a), it can be observed that in step 8 for specimen 1 the resonance frequency begins to decrease, indicating that the stiffness of the specimen begins to decrease, which means that the specimen is highly cracked and close to fracture. For specimen 2, it can be seen that when starting step 8, the specimen has broken just as the test load increases, establishing that step 8 defines the fatigue limit for both specimens.
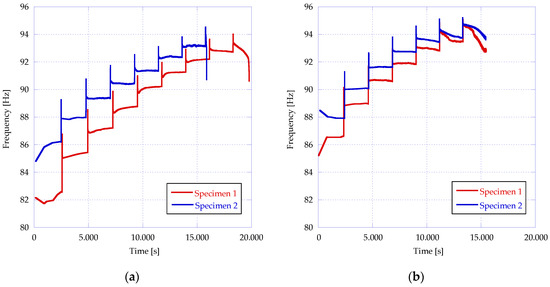
Figure 5.
Evolution of the resonance frequency in each step for the LLC (a) and SLC (b) mix.
For the SLC mix (Figure 5b), very similar behavior is seen for the two specimens tested. In both cases, the resonant frequency begins to decrease slightly in step 5, and very markedly in step 6. The SLC results show that siderurgical concrete specimens can withstand a greater loss of stiffness before breaking.
On the other hand, the mix with siderurgical aggregates managed to resist fewer steps. This is because fatigue is a subcritical mechanism, causing cracks to grow slowly until the specimen weakens enough to break. Siderurgical aggregates have irregular surfaces that are in contact with the mortar paste, and these paste surfaces form elements that are more susceptible to breakage, or in other words, the irregular shapes of the siderurgical aggregates behave as stress concentrators (there are sudden changes in section), causing premature failure of the ITZ between paste and aggregate.
Another issue is that an aggregate much stiffer than the paste causes the bond at the interfaces to deteriorate much earlier, since aggregate and paste do not deform in the same way at the same stress. Finally, it is necessary to analyse the effect of the apparent shape of the aggregates, which being sharper (flaky) will be able to penetrate the paste more easily. Together, all the causes described favour the appearance of defects in the microstructure of the specimens with passing cycles, which will reduce the fatigue life of the concrete with respect to conventional limestone concrete.
Another criterion to establish the step of the fatigue limit consists of measuring the evolution of strain over the cycles, or in other words, over time. For this, a reading of the maximum strain (corresponding to the maximum load within each cycle) and the minimum strain (corresponding to the minimum load within each cycle) for each of the 2 × 10⁵ cycles of each step was made. Figure 6 and Figure 7 show the maximum and minimum strain for the LLC and SLC mixes, respectively.
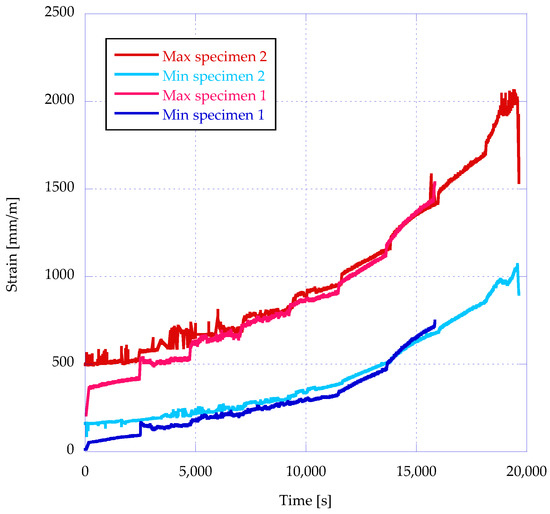
Figure 6.
Evolution of the maximum and minimum strain for the LLC mix.
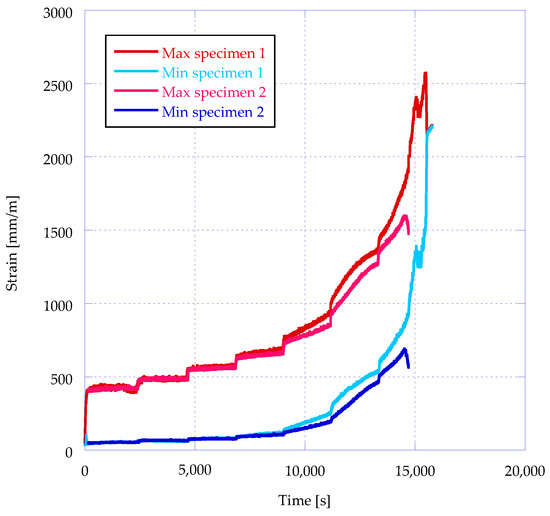
Figure 7.
Evolution of the maximum and minimum strain for the SLC mix.
For the LLC mix (Figure 6), the two specimens show a very similar strain in each step, although specimen 2 shows some noise during the first three steps, possibly due to the vibration of the strain gauge cables. It can be observed that the slope of the deformation increases slightly with each step, until the specimens finally break at the beginning of step 8 and 9. This slope increases because the growth rate of the cracks is increasing. The behaviour of the SLC mix (Figure 7) is similar to that of the LLC mix with some differences. The strain is less until the fifth step, and in the sixth step (step of the fatigue limit) it shoots up until the specimen finally breaks.
Figure 8 shows the evolution of the mean strain with the passage of the cycles. As expected, the mean strain increases as the load in each step increases. On the other hand, there is a high correspondence between the two specimens of each mix. In the case of the LLC mix, the mean strain grows more during the first four steps, after which the SLC mix deforms more and more quickly.
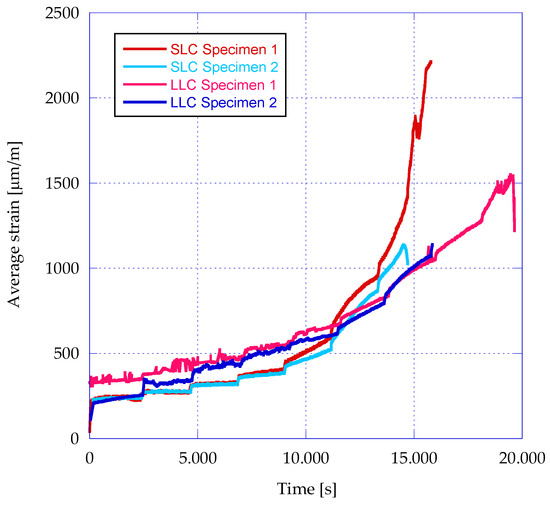
Figure 8.
Evolution of mean strain for LLC and SLC mixes.
Figure 9 shows the evolution of the strain range with the passing cycles for the two mixes. The strain range was defined as the difference between the maximum and minimum strain registered by the strain gauges. Good coupling can be observed between the specimens of the same mix and the increase in range with the level of the applied load. The specimens of the LLC mix show a lower range, which becomes more distant between the two mixes as the steps progress. Irregular peaks generated by the strain of Specimen 1 of the LLC mix can be observed. This effect is due to noise in one of the strain gauges attached to the specimen during the first three load steps, after which it has disappeared. The range is notably higher in the case of the SLC mix, which may be due to the fact that the corresponding loads with the same step are 30% higher, due to the superior compressive strength of the SLC mix.
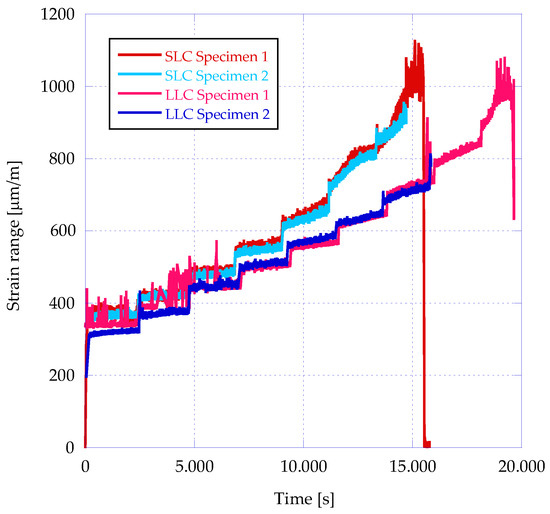
Figure 9.
Range evolution for mixes LLC and SLC.
After checking in which step the resonant frequency decreases and observing in which step it triggers, the fatigue limit step can be defined (criterion of the Frequency Droop). Table 6 shows the properties of the step prior to the frequency drop for the LLC and SLC mixes, defining the fatigue limit as the range of that step. The LLC mix managed to resist two more steps for the reasons explained above. Although the fc (%) of the LLC mix step is 10% higher, in absolute terms the range of the fatigue limit step is higher for the SLC mix.
Table 6.
Fatigue failure step for LLC and SLC mixes: frequency reduction criterion.
A second criterion was described in the methodology that defines the fatigue limit as 80% of the stress range of the step in which the specimen breaks. Table 7 shows the characteristics of the failure step as well as the fatigue limit associated with the stress range of the step.
Table 7.
Fatigue failure for mixes LLC and SLC: criterion of 80% of the stress range.
Making a comparison with the high-frequency fatigue limit values obtained by Sainz-Aja et al. [27], it is observed that the behavior of the SLC mix is similar to that of the RC-M mix (ballast aggregates with a small replacement of recycled sleeper aggregate) for either of the two criteria used.
As explained in the methodology, during the tests, the temperature of the outer surface of the test pieces was recorded. Figure 10a shows the evolution of the temperature for the LLC and SLC mixes. The increase in temperature is considerable and is associated with the high friction between the particles once the first micro-cracks appear and due to the high frequency at which the loads are applied. The high test frequency does not enable timely heat dissipation, as happens in low-frequency tests [34]. Figure 10b shows the range of strain in the specimens’ gauges where the temperature was measured. A priori, it could be thought that the specimens of the LLC mix will suffer lower increases in temperature because the resonant frequency of the system is lower; however, there is an evident relationship between strain and temperature, in which the effect of friction is due to the amplitude of displacement rather than the speed of the displacement (frequency). The higher temperature in the SLC mix could also be favored because the siderurgical aggregates have a higher coefficient of thermal conductivity, due to the presence of iron, so the temperature increase occurs more quickly.
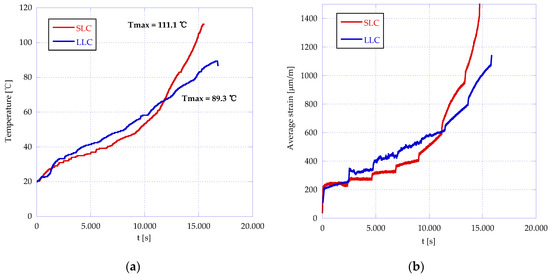
Figure 10.
Evolution of maximum temperature (a) and average strain (b).
In Figure 11, the cracks in the test specimens are shown, as well as the appearance of the upper contact faces, which show brown spots due to the rust of the plate where they are supported.
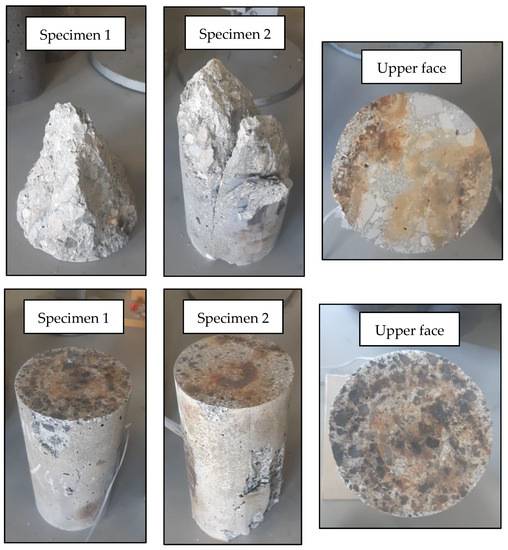
Figure 11.
Post-test appearance of LLC (top) and SLC (bottom) mix specimens after cracking.
Finally, Figure 12 and Figure 13 show the evolution of the surface temperatures of the specimens for the LLC and SLC mixes, respectively. First, it should be noted that the lower area of the specimens is heated first for both mixes. This temperature difference is more visible in the early stages of the test. After 200 min of testing, the difference reaches 15 °C between the upper-middle and the lower-middle of the specimens and a plausible explanation for these differences has not been found.
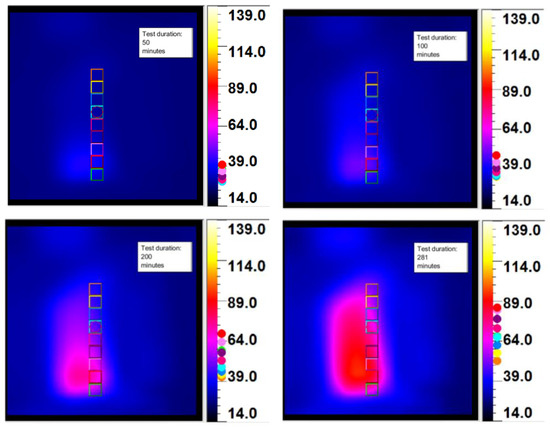
Figure 12.
Temperature evolution for the LLC mix.
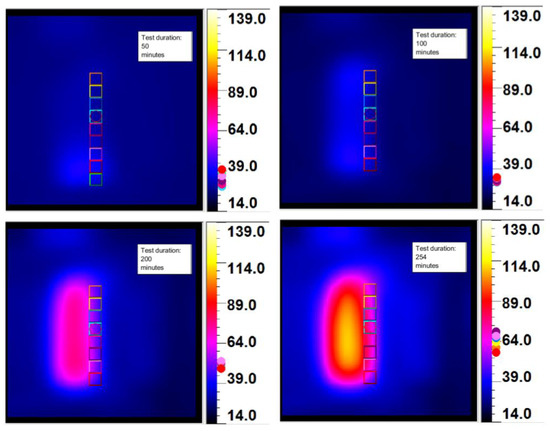
Figure 13.
Temperature evolution for the SLC mix.
What can be observed is that the areas near the central axis of the test specimens heat up earlier; this phenomenon is clearly visible in the last image of Figure 13, where a 40 °C difference between the central axis and the extremities of the specimen can be observed.
The fact that the specimens overheat will undoubtedly affect their fatigue behaviour, and the degree to which this happens has to be established in subsequent investigations; however, the generation of these high temperatures has made it possible to determine the fatigue limit of the mixes developed while remaining on the safe side since temperature is a factor that minimizes the aforementioned limit.
4. Conclusions
In this research, the high-frequency fatigue behaviour of concrete with siderurgical aggregates has been compared with concrete with limestone aggregates, verifying the effect of varying the aggregates on the main parameters to determine the fatigue limit. After analysing the results, the following conclusions can be drawn:
The fatigue limit of the SLC mix is higher than that of the LLC mix both for the criterion of reduction of the resonance frequency (11% higher) and for the criterion of 80% of the stress range (13%). However, the LLC fatigue limit is higher in relation to its compressive strength, due to the high stiffness of the siderurgical aggregates and their irregular shape, which could cause stress concentrations.
There is an increase in temperature in the test specimens with the number of cycles. This increase is similar to the increase in strain of the strain gauges and higher for the SLC mix. The SLC mix reaches temperatures close to 110 °C and the LLC mix close to 90 °C, being higher in the lower part of the test specimens for reasons that are still unknown.
The results obtained open the door to the use of concrete with siderurgical aggregates in new applications where structural concrete is subjected to cyclical loads, representing a further advance in research on new, more sustainable construction materials.
Author Contributions
Conceptualization, A.I.C., P.T. and C.T.; methodology, P.T., J.A.S.-A., J.A.P. and C.T.; software, P.T., A.I.C. and J.A.S.-A.; validation, P.T., J.A.P. and J.S.; formal analysis, A.I.C., P.T. and J.A.S.-A.; in-vestigation, P.T., G.G.D.Á. and J.A.S.-A.; resources, P.T., J.A.P. and C.T.; data curation, P.T., A.I.C. and J.A.S.-A.; writing—original draft preparation, P.T. and G.G.D.Á.; writing—review and editing, P.T., C.T., J.S., A.I.C., J.A.P. and J.A.S.-A.; visualization, A.I.C. and P.T.; supervision, C.T., J.S., J.A.P. and J.A.S.-A.; project administration, C.T. and J.A.P.; funding acquisition, C.T. and J.A.P. All authors have read and agreed to the published version of the manuscript.
Funding
This research was co-financed by the European Regional Development Fund (ERDF) and the Ministry of Economy, Industry, and Competitiveness (MINECO) within the framework of the project RTC-2016-5637-3.
Institutional Review Board Statement
Not applicable.
Informed Consent Statement
Not applicable.
Data Availability Statement
Not applicable.
Acknowledgments
The research was made possible thanks to the collaboration of the company INGECID, the department LADICIM (University of Cantabria), and the companies ROCACERO and SIDENOR, as well as the Department for Universities and Research, the Environment and Social Policy of the Government of Cantabria (Spain).
Conflicts of Interest
The authors declare no conflict of interest.
References
- Faleschini, F.; De Marzi, P.; Pellegrino, C. Recycled Concrete Containing EAF Slag: Environmental Assessment through LCA. Eur. J. Environ. Civ. Eng. 2014, 18, 1009–1024. [Google Scholar] [CrossRef]
- Tamayo, P.; Pacheco, J.; Thomas, C.; de Brito, J.; Rico, J. Mechanical and Durability Properties of Concrete with Coarse Recycled Aggregate Produced with Electric Arc Furnace Slag Concrete. Appl. Sci. 2020, 10, 216. [Google Scholar] [CrossRef]
- Tamayo, P.; Thomas, C.; Rico, J.; Setién, J.; Polanco, J.A.; Pérez, S.; Mañanes, S. Radiological Shielding Concrete Using Steel Slags. In Waste and Byproducts in Cement-Based Materials; Elsevier: Amsterdam, The Netherlands, 2021; pp. 413–438. [Google Scholar]
- Roslan, N.H.; Ismail, M.; Abdul-Majid, Z.; Ghoreishiamiri, S.; Muhammad, B. Performance of Steel Slag and Steel Sludge in Concrete. Constr. Build. Mater. 2016, 104, 16–24. [Google Scholar] [CrossRef]
- Awoyera, P.O.; Adekeye, A.W.; Babalola, O.E. Influence of Electric Arc Furnace (EAF) Slag Aggregate Sizes on the Workability and Durability of Concrete. Int. J. Eng. Technol. 2015, 7, 1049–1056. [Google Scholar]
- Maslehuddin, M.; Sharif, A.M.; Shameem, M.; Ibrahim, M.; Barry, M.S. Comparison of Properties of Steel Slag and Crushed Limestone Aggregate Concretes. Constr. Build. Mater. 2003, 17, 105–112. [Google Scholar] [CrossRef]
- Brand, A.S.; Roesler, J.R. Steel Furnace Slag Aggregate Expansion and Hardened Concrete Properties. Cem. Concr. Compos. 2015, 60, 1–9. [Google Scholar] [CrossRef]
- Pellegrino, C.; Cavagnis, P.; Faleschini, F.; Brunelli, K. Properties of Concretes with Black/Oxidizing Electric Arc Furnace Slag Aggregate. Cem. Concr. Compos. 2013, 37, 232–240. [Google Scholar] [CrossRef]
- Papayianni, I.; Anastasiou, E. Production of High-Strength Concrete Using High Volume of Industrial by-Products. Constr. Build. Mater. 2010, 24, 1412–1417. [Google Scholar] [CrossRef]
- Monosi, S.; Ruello, M.L.; Sani, D. Electric Arc Furnace Slag as Natural Aggregate Replacement in Concrete Production. Cem. Concr. Compos. 2016, 66, 66–72. [Google Scholar] [CrossRef]
- Coppola, L.; Buoso, A.; Coffetti, D.; Kara, P.; Lorenzi, S. Electric Arc Furnace Granulated Slag for Sustainable Concrete. Constr. Build. Mater. 2016, 123, 115–119. [Google Scholar] [CrossRef]
- Sosa, I.; Tamayo, P.; Sainz-Aja, J.A.; Thomas, C.; Setién, J.; Polanco, J.A.; Sosa, I.; Tamayo, P.; Sainz-Aja, J.A.; Thomas, C.; et al. Durability Aspects in Self-Compacting Siderurgical Aggregate Concrete. J. Build. Eng. 2021, 39, 102268. [Google Scholar] [CrossRef]
- Sosa, I.; Thomas, C.; Polanco, J.A.; Setién, J.; Sainz-Aja, J.A.; Tamayo, P. Durability of High-Performance Self-Compacted Concrete Using Electric Arc Furnace Slag Aggregate and Cupola Slag Powder. Cem. Concr. Compos. 2022, 104399. [Google Scholar] [CrossRef]
- Thomas, C.; Setién, J.; Polanco, J.A.; Lombillo, I.; Cimentada, A. Fatigue Limit of Recycled Aggregate Concrete. Constr. Build. Mater. 2014, 52, 146–154. [Google Scholar] [CrossRef]
- Thomas, C.; Carrascal, I.; Setién, J.; Polanco, J.A. Determinación Del Límite a Fatiga En Hormigones Reciclados de Aplicación Estructural—Determining the Fatigue Limit Recycled Concrete Structural Application. An. Mecánica Fract. 2009, 1, 283–289. (In Spanish) [Google Scholar]
- Thomas, C.; Sosa, I.; Setién, J.; Polanco, J.A.; Cimentada, A.I. Evaluation of the Fatigue Behavior of Recycled Aggregate Concrete. J. Clean. Prod. 2014, 65, 397–405. [Google Scholar] [CrossRef]
- Thomas, C.; Sainz-Aja, J.; Setien, J.; Cimentada, A.; Polanco, J.A. Resonance Fatigue Testing on High-Strength Self-Compacting Concrete. J. Build. Eng. 2021, 35, 102057. [Google Scholar] [CrossRef]
- Cantero, B.; Sainz-Aja, J.; Yoris, A.; Medina, C.; Thomas, C. Resonance Fatigue Behaviour of Concretes with Recycled Cement and Aggregate. Appl. Sci. 2021, 11, 5045. [Google Scholar] [CrossRef]
- Skarżyński, Ł.; Marzec, I.; Tejchman, J. Fracture Evolution in Concrete Compressive Fatigue Experiments Based on X-Ray Micro-CT Images. Int. J. Fatigue 2019, 122, 256–272. [Google Scholar] [CrossRef]
- Vicente, M.A.; Ruiz, G.; González, D.C.; Mínguez, J.; Tarifa, M.; Zhang, X. CT-Scan Study of Crack Patterns of Fiber-Reinforced Concrete Loaded Monotonically and under Low-Cycle Fatigue. Int. J. Fatigue 2018, 114, 138–147. [Google Scholar] [CrossRef]
- Sainz-Aja, J.; Carrascal, I.; Polanco, J.A.; Thomas, C. Fatigue Failure Micromechanisms in Recycled Aggregate Mortar by ΜCT Analysis. J. Build. Eng. 2020, 28, 101027. [Google Scholar] [CrossRef]
- Xiao, J.; Li, H.; Yang, Z. Fatigue Behavior of Recycled Aggregate Concrete under Compression and Bending Cyclic Loadings. Constr. Build. Mater. 2013, 38, 681–688. [Google Scholar] [CrossRef]
- Arora, S.; Singh, S.P. Analysis of Flexural Fatigue Failure of Concrete Made with 100% Coarse Recycled Concrete Aggregates. Constr. Build. Mater. 2016, 102, 782–791. [Google Scholar] [CrossRef]
- Sainz-Aja, J.A.; Gonzalez, L.; Thomas, C.; Rico, J.; Polanco, J.A.; Carrascal, I.; Setién, J. Effect of Steel Fibre Reinforcement on Flexural Fatigue Behaviour of Notched Structural Concrete. Materials 2021, 14, 5854. [Google Scholar] [CrossRef]
- Kolluru, S.V.; Popovics, J.S.; Shah, S.P. Determining Elastic Properties of Concrete Using Vibrational Resonance Frequencies of Standard Test Cylinders. Cem. Concr. Aggreg. 2000, 22, 81–89. [Google Scholar]
- Sainz-Aja, J.; Thomas, C.; Carrascal, I.; Polanco, J.A.; de Brito, J. Fast Fatigue Method for Self-Compacting Recycled Aggregate Concrete Characterization. J. Clean. Prod. 2020, 277, 123263. [Google Scholar] [CrossRef]
- Sainz-Aja, J.; Thomas, C.; Polanco, J.A.; Carrascal, I. High-Frequency Fatigue Testing of Recycled Aggregate Concrete. Appl. Sci. 2020, 10, 10. [Google Scholar] [CrossRef]
- EN 197-1:2011; Cement—Part 1: Composition, Specifications and Conformity Criteria for Common Cements. BSI Standards Publication: London, UK, 2011.
- Tamayo, P.; Thomas, C.; Rico, J.; Pérez, S.; Mañanes, A. Radiation Shielding Properties of Siderurgical Aggregate Concrete. Constr. Build. Mater. 2022, 319, 126098. [Google Scholar] [CrossRef]
- EN 12390-2; Testing Hardened Concrete—Part 2: Making and Curing Specimens for Strength Tests. British Standards Institution: London, UK, 2009.
- García, C.T. Hormigón Reciclado de Aplicación Estructural. Ph.D. Thesis, Universidad de Cantabria, Santander, Spain, 2012. [Google Scholar]
- Sainz-Aja, J.A. Slab Track Manufacture Using out of Service Railways Wastes. Ph.D. Thesis, University Of Cantabria, Santander, Spain, 2020. [Google Scholar]
- Sosa, I.; Thomas, C.; Polanco, J.A.; Setién, J.; Tamayo, P. High Performance Self-Compacting Concrete with Electric Arc Furnace Slag Aggregate and Cupola Slag Powder. Appl. Sci. 2020, 10, 773. [Google Scholar] [CrossRef]
- Sainz-Aja, J.A.; Carrascal, I.A.; Polanco, J.A.; Thomas, C. Effect of Temperature on Fatigue Behaviour of Self-Compacting Recycled Aggregate Concrete. Cem. Concr. Compos. 2022, 125, 104309. [Google Scholar] [CrossRef]
Disclaimer/Publisher’s Note: The statements, opinions and data contained in all publications are solely those of the individual author(s) and contributor(s) and not of MDPI and/or the editor(s). MDPI and/or the editor(s) disclaim responsibility for any injury to people or property resulting from any ideas, methods, instructions or products referred to in the content. |
© 2023 by the authors. Licensee MDPI, Basel, Switzerland. This article is an open access article distributed under the terms and conditions of the Creative Commons Attribution (CC BY) license (https://creativecommons.org/licenses/by/4.0/).