Abstract
The development of high-throughput field phenotyping, which uses modern detection technologies and advanced data processing algorithms, could increase productivity and make in-field phenotypic evaluation more efficient by collecting large amounts of data with no or minimal human assistance. Moreover, high-throughput plant phenotyping systems are also very effective in selecting crops and characterizing germplasm for drought tolerance and disease resistance by using spectral sensor data in combination with machine learning. In this study, an affordable high-throughput phenotyping platform (phenomobile) aims to obtain solutions at reasonable prices for all the components that make up it and the many data collected. The goal of the practical innovation in field phenotyping is to implement high-performance precision phenotyping under real-world conditions at accessible costs, making real-time data analysis techniques more user-friendly. This work aims to test the ability of a phenotyping prototype system constituted by an electric phenomobile integrated with a MAIA multispectral camera for real in-field plant characterization. This was done by acquiring spectral signatures of F1 hybrid Elisir (Olter Sementi) tomato plants and calculating their vegetation indexes. This work allowed to collect, in real time, a great number of field data about, for example, the morphological traits of crops, plant physiological activities, plant diseases, fruit maturity, and plant water stress.
1. Introduction
During the past 20 years, molecular technologies have brought significant advances in plant genomics that provide valuable tools for plant breeding [1]. As reported by Li et al. [2], advances in these techniques, for example, DNA sequencing, could provide potential increases in the rate of genetic improvement for molecular breeders. Phenotyping is the basis of any breeding selection process [3]. However, the lack of access to phenotyping resources limits the possibility of analyzing the genetics of the quantitative traits correlated with growth, yield, and adaptation to stress [4].
Generally, plant breeders selected phenotypes long before the discovery of DNA and molecular markers. In this context, to identify the best genetic variation, the more crosses and environments used for the selection, the greater the probability of identifying a superior variation [2]. In addition, the plant phenotype includes complex traits and parameters to evaluate, for example, the morphology, biomass, fruit characteristics, photosynthetic activity, and response to biotic and abiotic stress [5,6,7]. For all these reasons, as reported by Fiorani and Schurr [1], phenotyping limits the progress in both knowledge and the application of research.
To overcome this bottleneck, modern technologies (for example, remote sensing, robotics, computer vision, and artificial intelligence) could provide advantages with respect to the levels of production, applicability under adverse field conditions, and usefulness in breeding processes. As reported by Costa et al. [3], modern plant phenotyping often employs noninvasive technologies and digital technologies, to direct the selection toward productive plants suitable for their environment. In particular, field phenotyping is crucial in a context where crop breeding under different climatic conditions is essential to allow the production of plants to increase [8].
The development of high-throughput field phenotyping, which uses modern detection technologies and advanced data processing algorithms, could increase productivity and make phenotypic evaluation in the field more efficient by collecting large amounts of data with no or minimal human assistance. To date, there are many high-throughput field phenotyping systems, both aerial and ground based. Field-based ground phenotyping systems can be used, for example, to measure many morphological traits of crops with low-cost digital cameras [9] or to measure phenotypic traits related to plant physiological activities, detecting plant diseases, fruit maturity, and plant water stress, using multispectral and hyperspectral cameras and thermal imaging cameras [10]. Instead, remote sensing can be used to dynamically phenotype large numbers of field plots with great efficiency and greater coverage, quickly and economically, effectively supporting crop breeding against biotic and abiotic stresses [11]. Generally, ground systems, being able to carry heavier sensors and equipment than aerial systems, provide data with a higher resolution and quality, being able to perform phenotyping at more precise levels, with more uniform scanning, while also controlling for environment and climatic conditions.
In addition to improving the efficiency and precision of selection in breeding programs and expanding the genetic variation in germplasm by evaluating plant phenotypic traits, high-throughput field phenotyping is successfully used to monitor crops with the early detection of pathogens, pests, and weeds, using advanced sensors integrated into field equipment [12]. This allows more samples to be screened with a greater accuracy and low cost, improving yields and reducing the environmental impact.
High-throughput plant phenotyping systems are also very effective in selecting crops and characterizing germplasm for drought tolerance [13] and disease resistance [14] by using spectral sensor data in combination with machine learning.
Generally, phenotyping is limited not only by the absence of suitable approaches but also by the fact that it is an expensive activity. The cost depends not only on the choice of appropriate tools (e.g., sensors) but also on their carrying platforms (e.g., speed and volume of data extraction and analysis, handling, and data processing). As reported by Khan et al. [15], low-cost devices based on phenotyping applications based on vegetation indexes assessments are highly desirable.
In detail, the goal, and innovation, of field-practical phenotyping is to implement high-performance and cost-effective precision phenotyping systems under real-world conditions while making analysis techniques more user-friendly [16].
This work aims to test the ability of a phenotyping prototype system constituted by an electric phenomobile integrated with a MAIA multispectral camera for real in-field plant characterization. This was done by acquiring the spectral signatures of F1 hybrid Elisir (Olter Sementi) tomato plants and calculating their vegetation indexes.
2. Materials and Methods
The self-propelled platform with electric advancement for digital agriculture and phenotyping applications (phenomobile) was designed and built in collaboration with OPV Solutions S.r.l. (Rome, Italy). The system consists of several mechanical and electronic components.
2.1. Mechanical Components
2.1.1. Chassis
The mechanical components are represented by a chassis made of standard grooved profiles and detachable joints in aluminum alloy. This has an easily variable setup and can be assembled/disassembled when the device is stationary, with a minimum crossbar height of 1.5 m from the ground.
The chassis consists of three macro-sections, which can be disassembled and folded back on themselves for transporting the vehicle and, if necessary, for storing it. The first part consists of a central body of prismatic shape onto which two articulated quadrilateral structures are anchored, allowing both track variation and a macroscopic “bellows” closure (Figure 1a).
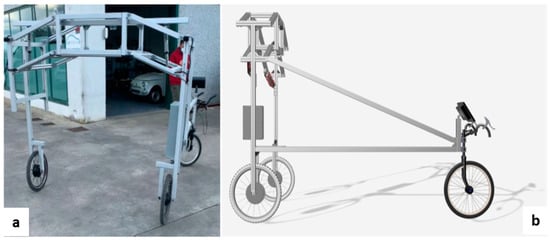
Figure 1.
Chassis with double-articulated quadrilateral (a) and longitudinal balancer (b).
Connected to the “double articulated quadrilateral” are the two side structures that contain the wheel motors and the front-view guide cameras (one on the left and one on the right pillar).
While the right-hand side pillar houses only the wheel motor, the left-hand structure also consists of the “longitudinal rocker”, which ends with the steering wheel and performs the function of directing the device’s gait according to user needs (Figure 1b).
The “longitudinal rocker arm” holds the following electronic components: battery pack—BMS; control electronics for wheel motors; electronic driver with microcontroller; guide monitor for frontal vision; display with relative power buttons; brakes.
2.1.2. Central Body: Place for Measuring Instruments and Crossbar for Track Adjustment
The prism-shaped central body contains a double-guided vertical profile (Figure 2a), which is the location of the instrumentation used for phenotyping applications. This element is adjustable in height and laterally through four angular joint supports sliding in both directions. Adjustment is carried out by loosening the hexagonal socket screws.

Figure 2.
(a) Vertical seat for instrumentation; (b) crossbar with knobs for track adjustment; (c) ring nut for shock absorber preload.
The central body also contains a transverse profile, to the ends of which the upper eyelet of the dampers is connected. The lower eyelet of the dampers is connected to the lower arm of the articulated quadrilaterals. The width of the track can be adjusted by changing the vertical position of the crossbar. To do this, it is necessary to unscrew the knobs shown in Figure 2b, adjust the traverse to the desired height, and tighten the knobs. It is also possible to replace the knobs with screws. If the suspension is too stiff, the preload can be changed by adjusting the spring using the black ring nut shown in Figure 2c.
2.1.3. Battery Pack Box—BMS
Integrated into the longitudinal structure is the “battery box” (Figure 3), as a container element made of sheet metal and consisting of two parts (“container” and “cover”) suitably shaped to hold and secure the battery pack, the BMS and its current sensor to the rest of the frame, protected from external agents. The cover closes by hugging the edges of the lower section and is secured in place by means of four lever hooks that can also be locked (after integrating a special locking system) with a tamper-resistant function. Synthetic foam applications dampen vibrations and improve the tightness of the lock. The various connection cables to the battery, as well as the cable for the battery charger, are also sheltered inside.
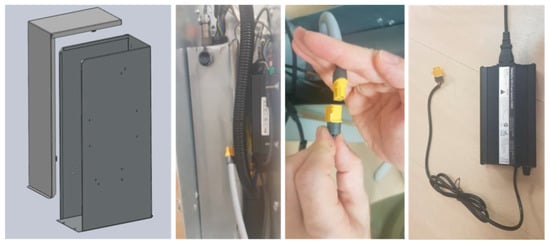
Figure 3.
Battery box and its internal components (BMS, current sensor, battery, and charging cable).
2.1.4. Brake System
Pulling even slightly on the brake levers (Figure 4) inhibits the motor drive on the corresponding side, to facilitate maneuvers in tight spaces. In addition, the left brake is mechanically connected to the rear wheel and thus acts as the actual brake; for the parking brake function, there are two hooks on the handgrips that, rotated into the engaged position, hold the brake levers in the locked position.
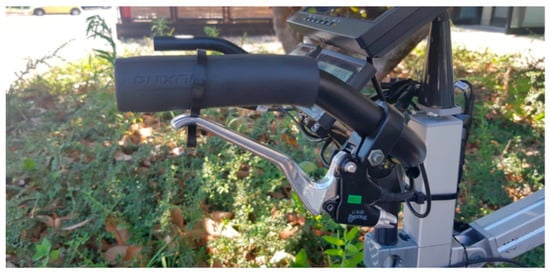
Figure 4.
Brake system with brake lock hook.
2.2. Electronic Components
The electronic components consist of the traction and propulsion components, together with the control. The following sections provide details of these, followed by a description of the electronic schemes.
2.2.1. Electric Motorization
Electric motorization consists of two motorized cycle-type wheels suitable for off-road use with brushless motors integrated in the hub (Figure 5).
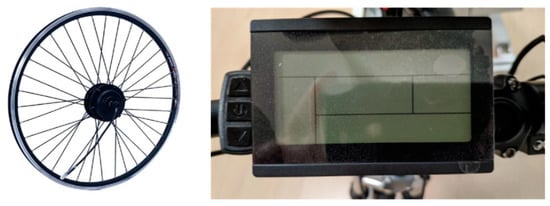
Figure 5.
Motorized wheel (on the left); display and motor start button integrated in the wheel (on the right).
The characteristics of the motor integrated in the wheel are power 500 watts; voltage 48 V; torque moment 50 Nm; mounting width 100 mm; water protection IP 65; brushless motor; total weight of motor and wheel 4.4 kg.
2.2.2. Battery Box
The battery box contains the battery pack and the BMS.
The battery pack consists of a 48 V module, which is made up of 112 cells (Samsung ICR18650-29E) with the following characteristics: nominal voltage 3.6 V; maximum current 4A (8A peak); 2500 mAh capacity (2900 mAh nominal); external section 18, 25 × 65 mm. The module is structured to have 14 groups of 8 cells in series in parallel and guarantee a nominal voltage of approximately 50 V; overall, the battery pack has a capacity of 1 kWh. The cells comprising the battery pack are housed in a case (Figure 6a) made of PLA filament with adequate thermal and mechanical resistance for the application in question. For connection to the battery pack, functional connectors are used for the specific requirements: connector for the PL082X-61-10 power supply (Figure 6b); connector for the BMS (Figure 6c); connector for the BMS temperature sensor (Figure 6d).
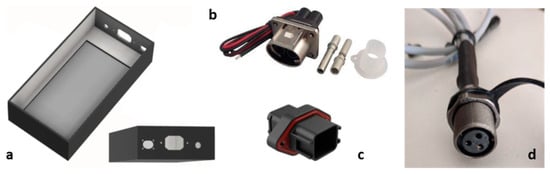
Figure 6.
(a) Battery pack case; (b) rectangular connector for panel mount power supply, 2 contacts; (c) connector for BMS: automobilistic, 18 way, female, 13A, IP67 panel mount; (d) connector for temperature sensors with panel mount.
Figure 7a shows the entire battery pack mounted in the case with the various connectors to connect the power supply, the connection to the BMS, and the temperature sensors.

Figure 7.
(a) Complete battery pack; (b) BMS REC model Q.
The REC model Q BMS (Figure 7b) is used to control the battery pack. Its function is to manage the discharge and charge of the cells by monitoring the voltage, current, and temperature of the battery pack. Communicates essential information via Can Bus to the electronic control system.
2.2.3. Electronic Driver with Microcontroller
The electronic control system is based on an Arduino Nano microcontroller board and MCP2551 Can Bus module (Figure 8).

Figure 8.
Arduino Nano (on the left) and MCP2551 Can Bus Module (on the right).
2.2.4. Guide Screen for Frontal Vision in FPV
The closed-circuit video system is composed of a video acquisition system consisting of two video cameras (Figure 9a), positioned frontally to ensure appropriate frontal visibility of the maneuvering and passage area of the device, and a screen for video playback (Figure 9b) placed near the operator station. The system’s characteristics are 10.1″ IPS 1024*600 resolution screen; 2-channel HD display support; 720P HD video recorder support; 400 cd brightness; SD memory card slot (max. 128 GB); 16:9 image mode; 12–24 V power supply; approx. 7 W power consumption; operating temperature −20°–45 °C; weight 920 g.
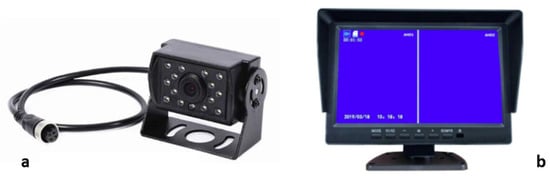
Figure 9.
(a) Video camera; (b) 10.1″ IPS 1024*600 resolution screen.
2.3. Electronic Schemes
The electronic schemes of the power connections and of the microcontroller control system are described below, and then the general scheme that contains all the connections underlying the electronic realization of the device.
Figure 10 shows the entire system power connection scheme, showing, in addition to the main components connected, the power cable sections and the distribution of the battery voltage system (50 V).

Figure 10.
Electronic scheme of power connections.
The scheme in Figure 11 shows the connections to the microcontroller, in particular the “multi-switch input” which is the speed selector input and the two left and right PWM outputs that control the throttle given to the two motors. At the bottom are the connections to the CAN bus board for communications from the BMS. On the right side are the error indication LEDs (visible on the front panel). On the top left are some accessory connections (serial and relay).
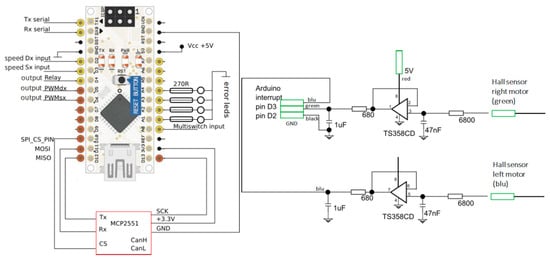
Figure 11.
Electronic scheme of Arduino Nano CAN bus module connections (on the left) and speed input filtering circuit (on the right).
The pinout scheme of the controller connectors (Figure 12) shows the controller connectors in the left-hand box and the corresponding connected devices in the right-hand box.
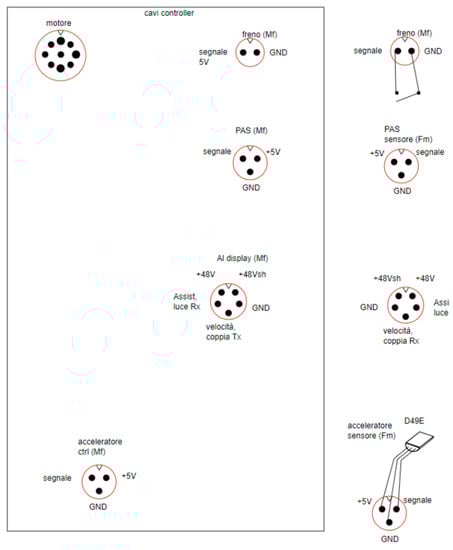
Figure 12.
Pinout scheme of the controller connectors.
The system block diagram (Figure 13) shows the distribution of cables along the chassis structure (as seen above), the video system in yellow, the power system in red, and the throttle controls in green. In the middle and lower sections of the lettering diagram, the colors represent the color of the wires used in green, the value of the components or voltages in use in red, and other device-related information in blue. In the middle section to the left are the detailed connections of the on/off switches with their LEDs and the main relay. Continuing to the right is the dc/dc converter to power the 12 V devices (LEDs, monitor, and microcontroller) and the connection to the BMS, which in the event of serious errors disconnects the monitor to minimize consumption and give a notice to the operator. At the bottom are again the interface connections between the microcontroller and the outside world (with LED gear indication).

Figure 13.
General scheme of the system.
2.4. Phenomobile Multispectral Camera and Operation
To perform prototypical in-field operations, phenomobile was equipped with the MAIA (Eoptics S.r.l., Trento, Italy) multispectral camera. MAIA is a multispectral camera providing simultaneous acquisition of high-resolution images (f 1208 × 960 pixel) at different wavelengths in the visible (VIS) and near-infrared (NIR) regions (390–950 nm). The MAIA multispectral camera is based on an array of nine sensors (see Figure 1), each with its relevant band-pass filter that precisely defines the radiation range to be detected. The filter set chosen matches the bands of the Sentinel-2™ (SN-2) satellite. Given Q, the quantum efficiency of the sensors i-th sensor (i = 1,...,9) and T, the transmittance of the corresponding filter (both quantities normalized to 1), the sensitivity S of the i-th sensor is given by
S = Q∙T.
Figure 14 shows the sensitivity of the 9 sensors as a function of the wavelength in nanometers.
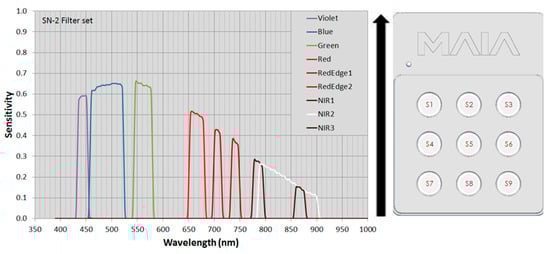
Figure 14.
Sensitivity of the MAIA multispectral camera sensors (on the left) and their position (on the right) with respect to the acquisition direction (black arrow).
Table 1 reports the main characteristics of the 9 sensors of the MAIA multispectral camera in terms of central wavelength (CWL), bandwidth (BW), and color.

Table 1.
Summary of optical bands detected by the MAIA multispectral camera sensors.
The MAIA multispectral camera was connected to the phenomobile by means of a dedicated Gimbal 3D operating with 3 degrees of freedom (“yaw”, “roll”, and “pitch”) at a ground sampling distance (GSD) of 2 m. Furthermore, the system is also implemented with a dedicated RTK (Real-Time Kinematics) base station for precise positioning of around 2 cm. The images obtained from the 9 sensors were co-registered by means of “MultiCam Stitcher Pro” proprietary software v. 1.4 (SAL Engineering, Ravenna, Italy; 3D Optical Metrology—Bruno Kessler Foundation (FBK), Trento, Italy) and from the obtained multi-tif images, the Normalized Difference Vegetation Index (NDVI) and Generalized Difference Vegetation Index (GDVI) were calculated averaging the signals from the S7 and S8 NIR sensors as
NDVI = ((S8 + S7)/2 − S5)/((S8 + S7)/2 + S5),
GDVI = ((S8 + S7)/2 − S3)/((S8 + S7)/2 + S3).
3. Field Acquisition and Results
To test the prototype ability of the phenomobile system with respect to real field conditions, a measure of the spectral properties of plants was performed on i. tomato plants of the F1 hybrid Elisir (Olter Sementi) and ii. durum wheat sown by parcels.
The tomato experiment was conducted on eighteen plants at the 4–5th true leaf stage of the F1 hybrid Elisir (Olter Sementi) that were transplanted in three rows (six plants per row), considered replicates. To favor a visual inspection of the plants, 200 cm was left between the rows and 50 cm between the plants along the row. The initial indeterminate growth of the plants required the use of supports. Lateral shoots were removed at weekly intervals during the plant growth. The transplantation occurred between the 11th and 20th days of May 2021 in the experimental field of the CREA Research Center for Engineering and Agro-Food Processing, Monterotondo, Italy (42°N 05′56.86″, 12°E 37′26.23″). For at least three years, the soil was fertilized with cow manure and no chemicals were used to control pathogens or pests. The plants were drip irrigated with lines placed near the plants. The water supply was scheduled according to the Integrated Production Regulations for tomato processing [17]. The durum wheat experiment was carried out on the CREA experimental farm in Montelibretti (42°07′47.71″ N, 12°38′31.01″ E, Rome, Italy) on 8 June 2022, at the pre-harvesting phase. The field flown over includes the tests of the national durum wheat and soft wheat network [18]. The plants were arranged in a randomized block design of 10 × 2 m2 plots with a sowing density of 350 seeds/m2 for durum wheat. The block design for both the durum and soft wheats was framed by edges of barley plots. A total of 10 durum wheat parcels were analyzed. The test was carried out onto a part of a varieties collection planted to perform fertilization and plant protection screening and characterization.
The phenomobile prototype system was used to acquire the multispectral signal of the plants. Figure 15 shows the output of the nine sensors. Using these data, the NDVI and GDVI indexes were calculated from Equations (2) and (3). These are shown in Figure 16, together with the RGB images obtained by combining the signal of sensors S1, S2, and S3.
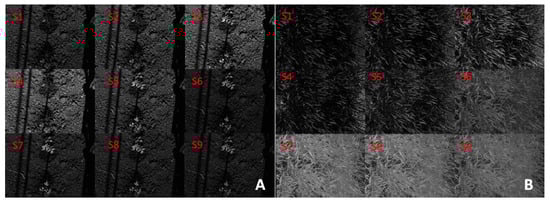
Figure 15.
Output of the 9 sensors of the MAIA spectral camera on tomato plants (A), durum wheat (B).

Figure 16.
Illustrations of NDVI (a, tomato; d, durum wheat), GDVI (b, tomato), and RGB images (c, tomato; e, durum wheat) obtained from the sensors of MAIA spectral camera.
Generally, these reflectance indices derived from spectral vegetation measurements are widely exploited in experimental field research and breeding programs, as they enable the noninvasive estimation of the biomass, nitrogen content, and photosynthetic status of plants to provide interventions as needed. In addition, specific bands in the NIR region are of particular interest for large-scale plant phenotyping, as they allow estimating tissue water content and thus programming the differentiated responses of genotypes to drought.
The phenomobile can be used for research and development purposes and is especially suitable for crop plots given its lateral measures ranges as reported above.
4. Discussion
Plant phenotyping is a promising science that connects genomics with plant ecophysiology and agronomy [19]. This work presents an affordable high-throughput phenotyping platform prototype (phenomobile) which allows one to collect a great number of field data with high potential applications, for example, regarding the morphological traits of crops, plant physiological activities, plant diseases, fruit maturity, and plant characterization with regard to, i.e., water stress. This could be a reasonably priced solution to phenotype large numbers of field data with great efficiency and coverage. This phenomobile is a ground-based system and for this reason is allowed to carry heavier sensors and equipment with respect to aerial ones, providing data with a higher resolution and quality, regulating it for different environment and climatic conditions. In detail, the mounted multispectral camera (MAIA), by detecting absorbed and emitted radiation in the visible and near-infrared regions of the electromagnetic spectrum, was able to provide accurate information on the plant vigor and health status in a heterogeneous environment with high sensitivity. In fact, the GDVI measurement performs very well in land characterization, even in an arid environment [20]. The cost of the system is around 25.000 EUR, which is compatible with several applications if compared to professional phenotyping throughput screening systems. The data, being precisely georeferenced, can be elaborated into maps and/or be attributed to micro and macro plots for an extensive experimental acquisition campaign.
5. Conclusions
The phenomobile was able to acquire and store the desired field data as planned. Its peculiarity is to be easy to handle, being handheld, but, meanwhile, capable of acquiring complex and informative data. If compared to industrial systems, the proposed one gives the opportunity to expand phenotyping applications in open-field and/or greenhouses conditions at a low price tag. Being its movements are separated from the acquisition set, and thus not triggered together, sensors, after proper installation and calibration, can be swapped, further reducing the total price, or if the application type requires acquisition within a different wavelengths range. This system represents an opportunity to integrate modern non or minimally invasive technologies into commonly used protocols for characterizing plant responses to growing environmental challenges and for field and controlled experimental trials. In addition, the separation between the movements and the acquisition triggering gives the possibility to swap and add self-triggered sensors. In conclusion, the study positively tested the prototype built for in-field phenotyping purposes, showing great potential as an aid to geneticists to speed up the selection process regarding new cultivars, with the aims to create plants with an increased productivity and or resistance to pathogens or environmental parameters shifted due to climatic changes. Future studies will expand the present preliminary test to an extended experimental design in comparison to professional systems operating within similar spectral bands, with the aim to assess in detail differences in terms of the output, acquisition time, and costs.
Author Contributions
Conceptualization, C.C., S.F. and F.P.; methodology, C.C., S.F., L.O., E.S. and F.P.; software, S.F. and L.O.; validation, F.A., C.C., S.F. and F.P; formal analysis, C.C., S.F., E.S. and L.O.; investigation, F.A, C.C., S.F. and F.P; resources, C.C.; data curation, C.C., F.P., R.M. and F.A.; writing—original draft preparation, R.M. and F.A.; writing—review and editing, R.M., Ł.G. and F.A.; visualization, C.C, F.A. and F.P.; supervision, C.C. and F.P.; project administration, C.C. funding acquisition, C.C and F.P. All authors have read and agreed to the published version of the manuscript.
Funding
This technical note was funded by the Italian Ministry of Agriculture, Ministry of Agriculture, Food Sovereignty and Forestry (MASAF), national program sub-project “Tecnologie digitali integrate per il rafforzamento sostenibile di produzioni e trasformazioni agroalimentari (AgroFiliere)” (AgriDigit program) (DM 36503.7305.2018 of 20/12/2018).
Institutional Review Board Statement
Not applicable.
Informed Consent Statement
Not applicable.
Data Availability Statement
Not applicable.
Conflicts of Interest
The authors declare no conflict of interest.
References
- Fiorani, F.; Schurr, U. Future scenarios for plant phenotyping. Annu. Rev. Plant Biol 2013, 64, 267–291. [Google Scholar] [CrossRef] [PubMed]
- Li, L.; Zhang, Q.; Huang, D. A review of imaging techniques for plant phenotyping. Sensors 2014, 14, 20078–20111. [Google Scholar] [CrossRef] [PubMed]
- Costa, C.; Schurr, U.; Loreto, F.; Menesatti, P.; Carpentier, S. Plant phenotyping research trends, a science mapping approach. Front. Plant Sci. 2019, 9, 1933. [Google Scholar] [CrossRef] [PubMed]
- Pieruschka, R.; Schurr, U. Plant phenotyping: Past, present, and future. Plant Phenomics 2019, 2019, 1–6. [Google Scholar] [CrossRef]
- Menzel, M.I.; Tittmann, S.; Buehler, J.; Preis, S.; Wolters, N.; Jahnke, S.; Walter, A.; Chlubek, A.; Leon, A.; Hermes, N. Non-invasive determination of plant biomass with microwave resonators. Plant Cell Environ. 2009, 32, 368–379. [Google Scholar] [CrossRef]
- Bauriegel, E.; Giebel, A.; Herppich, W.B. Hyperspectral and chlorophyll fluorescence imaging to analyse the impact of fusarium culmorum on the photosynthetic integrity of infected wheat ears. Sensors 2011, 11, 3765–3779. [Google Scholar] [CrossRef]
- Rao, N.K.S.; Laxman, R.H. Phenotyping Horticultural Crops for Abiotic Stress Tolerance. In Climate-Resilient Horticulture: Adaptation and Mitigation Strategies; Singh, H.C.P., Rao, N.K.S., Shivashankara, K.S., Eds.; Springer: Berlin/Heidelberg, Germany, 2013; pp. 147–157. [Google Scholar]
- Prashar, A.; Jones, H.G. Infra-red thermography as a high-throughput tool for field phenotyping. Agronomy 2014, 4, 397–417. [Google Scholar] [CrossRef]
- Shafiekhani, A.; Kadam, S.; Fritschi, F.B.; DeSouza, G.N. Vinobot and vinoculer: Two robotic platforms for high-throughput field phenotyping. Sensors 2017, 17, 214. [Google Scholar] [CrossRef] [PubMed]
- Fernández-Novales, J.; Saiz-Rubio, V.; Barrio, I.; Rovira-Más, F.; Cuenca-Cuenca, A.; Santos Alves, F.; Valente, J.; Tardaguila, J.; Diago, M.P. Monitoring and Mapping Vineyard Water Status Using Non-Invasive Technologies by a Ground Robot. Remote Sensing 2021, 13, 2830. [Google Scholar] [CrossRef]
- Zaman-Allah, M.; Vergara, O.; Araus, J.L.; Tarekegne, A.; Magorokosho, C.; Zarco-Tejada, P.J.; Hornero, A.; Albà, A.H.; Das, B.; Craufurd, P.; et al. Unmanned aerial platform-based multi-spectral imaging for field phenotyping of maize. Plant Methods 2015, 11, 35. [Google Scholar] [CrossRef] [PubMed]
- Chawade, A.; van Ham, J.; Blomquist, H.; Bagge, O.; Alexandersson, E.; Ortiz, R. High-Throughput Field-Phenotyping Tools for Plant Breeding and Precision Agriculture. Agronomy 2019, 9, 258. [Google Scholar] [CrossRef]
- Kumar, D.; Kushwaha, S.; Delvento, C.; Liatukas, Ž.; Vivekanand, V.; Svensson, J.T.; Henriksson, T.; Brazauskas, G.; Chawade, A. Affordable Phenotyping of Winter Wheat under Field and Controlled Conditions for Drought Tolerance. Agronomy 2020, 10, 882. [Google Scholar] [CrossRef]
- Koc, A.; Odilbekov, F.; Alamrani, M.; Henriksson, T.; Chawade, A. Predicting yellow rust in wheat breeding trials by proximal phenotyping and machine learning. Plant Methods 2022, 18, 30. [Google Scholar] [CrossRef] [PubMed]
- Khan, Z.; Rahimi-Eichi, V.; Haefele, S.; Garnett, T.; Miklavcic, S.J. Estimation of vegetation indices for high-throughput phenotyping of wheat using aerial imaging. Plant Methods 2018, 14, 20. [Google Scholar] [CrossRef]
- Araus, J.L.; Buchaillot, M.L.; Kefauver, S.C. High Throughput Field Phenotyping. In Wheat Improvement; Reynolds, M.P., Braun, H.J., Eds.; Springer: Cham, Switzerland, 2022; pp. 495–512. [Google Scholar]
- Available online: http://agricoltura.regione.emilia-romagna.it/produzioni-agroalimentari/temi/bio-agro-climambiente/agricoltura-integrata/disciplinari-produzione-integrata-vegetale/Collezione-dpi/2019/orticole-2019 (accessed on 9 December 2021).
- Pallottino, F.; Figorilli, S.; Cecchini, C.; Costa, C. Light drones for basic in-field phenotyping and precision farming applications: RGB tools based on image analysis. Crop Breed. Genet. Improv. Methods 2021, 2264, 269–278. [Google Scholar]
- Xu, R.; Li, C. A review of high-throughput field phenotyping systems: Focusing on ground robots. Plant Phenomics 2022, 2022, 1–20. [Google Scholar] [CrossRef] [PubMed]
- Wu, W. The Generalized Difference Vegetation Index (GDVI) for Dryland Characterization. Remote Sensing 2014, 6, 1211–1233. [Google Scholar] [CrossRef]
Disclaimer/Publisher’s Note: The statements, opinions and data contained in all publications are solely those of the individual author(s) and contributor(s) and not of MDPI and/or the editor(s). MDPI and/or the editor(s) disclaim responsibility for any injury to people or property resulting from any ideas, methods, instructions or products referred to in the content. |
© 2023 by the authors. Licensee MDPI, Basel, Switzerland. This article is an open access article distributed under the terms and conditions of the Creative Commons Attribution (CC BY) license (https://creativecommons.org/licenses/by/4.0/).