Article

Study on Cyber Common Operational Picture Framework for Cyber Situational Awareness

1
Department of Computer Engineering, Sejong University, Seoul 05006, Republic of Korea
2
Department of Convergence Engineering for Intelligent Drones, Sejong University, Seoul 05006, Republic of Korea
3
Cyber Warfare Research Institute, Sejong University, Seoul 05006, Republic of Korea
4
Advanced Defense Science & Technology Research Institute, Agency for Defense Development, Daejeon 34060, Republic of Korea
*
Author to whom correspondence should be addressed.
Appl. Sci. 2023, 13(4), 2331; https://doi.org/10.3390/app13042331
Submission received: 17 January 2023 / Revised: 6 February 2023 / Accepted: 9 February 2023 / Published: 11 February 2023
(This article belongs to the Special Issue Advanced Technologies in Data and Information Security II)

Abstract

:
The remarkable development of the Internet has made our lives very convenient, such as through the ability to instantaneously transmit individual pictures. As a result, cyber-attacks are also being developed and increasing, and the computer/mobile devices we use can become infected with viruses in an instant. Rapid cyber situational awareness is essential to prepare for such cyber-attacks. Accelerating cyber situational awareness requires Cyber Common Operational Pictures, which integrate and contextualize numerous data streams and data points. Therefore, we propose a Cyber Common Operational Pictures framework and criteria for rapid cyber situation awareness. First, the system reaction speed based on the user’s request and the standard for easily recognizing the object shown on the screen are presented. Second, standards and frameworks for five types of visualization screens that can directly recognize and respond to cyber-attacks are presented. Third, we show how a system was constructed based on the proposed framework, as well as the results of an experiment on the response time of each visualization screen. As a result of the experiment, the response speed of the 5 visualization screens was about 0.11 s on average for inquiry (simple) and 1.07 s on average for inquiry (complex). This is consistent with the typical response times of the studies investigated in this paper. If CyCOP is developed in compliance with the framework items (UI, object symbol, object size, response speed) presented in this paper, rapid situational awareness is possible. This research can be used in cyber-attack and defense training in the military field. In the private sector, it can be used in cyber and network control.

1. Introduction

With the rapid growth of the Internet, the number of cyber-attacks within cyberspace increases day by day, which increases the importance of cybersecurity [1,2]. Recognizing this importance in the field of defense, the United States Department of Defense designated cyberspace as the fifth battlefield after land, sea, air, and space [3]. It also distributed doctrines for planning, executing, and evaluating operations in cyberspace [4].
Cyber-attacks are being actively conducted not only in peacetime but also in wartime situations. For example, in the ongoing war between Ukraine and Russia, hybrid warfare, a complex tactic that mobilizes cyber-attacks as well as conventional attacks, has been consistently implemented since the beginning of the war [5,6]. Cyber-attacks against Ukraine surged 196% in the first three days of combat, while those against Russia increased by 4% [7].
In order to prepare for such a cyber-attack, it is necessary to quickly recognize the cyber situation. To do this, a Cyber Common Operational Picture (CyCOP) is usually required, which commanders and security officers can use for cyber situational awareness. In order to develop an effective CyCOP, screens that can analyze data in cyberspace or real data from multiple perspectives are first required. Second, it must have a fast response time and high awareness because it is necessary to quickly grasp the situation in cyberspace, and where data is coming and going. Visualization for this situational awareness is essential not only in national defense but also in the field of information protection. In particular, visualization for situational awareness is very helpful when conducting cyber battle training. Cyber warfare training requires a detailed understanding of the cyber situation of the Red and Blue Teams. Accordingly, this research studied a design for a CyCOP framework for cyber situational awareness. The goal of this paper is to consider all aspects of visualization for rapid cyber situational awareness. Most of the research on cyber situational awareness has been conducted in the military. Accordingly, it is necessary to collect and organize data on cyber situational awareness and visualization defined by many military forces. In order to find out how fast visualization is necessary, studies on response time should be investigated. Rapid cyber situational awareness should be easy to recognize at a glance. To do so, it is necessary to investigate the shape and size of icons with good visibility. Accordingly, this paper consists of five sections. Section 2 shows the need for CyCOPs based on the operational planning and cyber situational awareness specified in published military manuals. Then, we show how screens to compose CyCOPs were identified and studies such as those on the response time and object icons were investigated to compose the interface. Section 3 draws implications from the published military manuals and various research data investigated in Section 2. Then, based on the derived implications, we show how the CyCOP framework was designed and implemented. Section 4 discusses an experiment on the response time of the implemented CyCOP screens. Finally, Section 5 draws conclusions about this paper.

2. Related Works

2.1. Definition of Cyberspace Operations and Cyber Awareness

2.1.1. Definition of Cyberspace Operations

Cyberspace is a global domain within the information environment in which information system infrastructures, including the Internet and networks, are interdependent [8]. Cyber operations are the actions needed to achieve goals within cyberspace [4]. The space where cyber operations are conducted is divided into three network layers, with the elements of each layer described as follows [4,9,10].
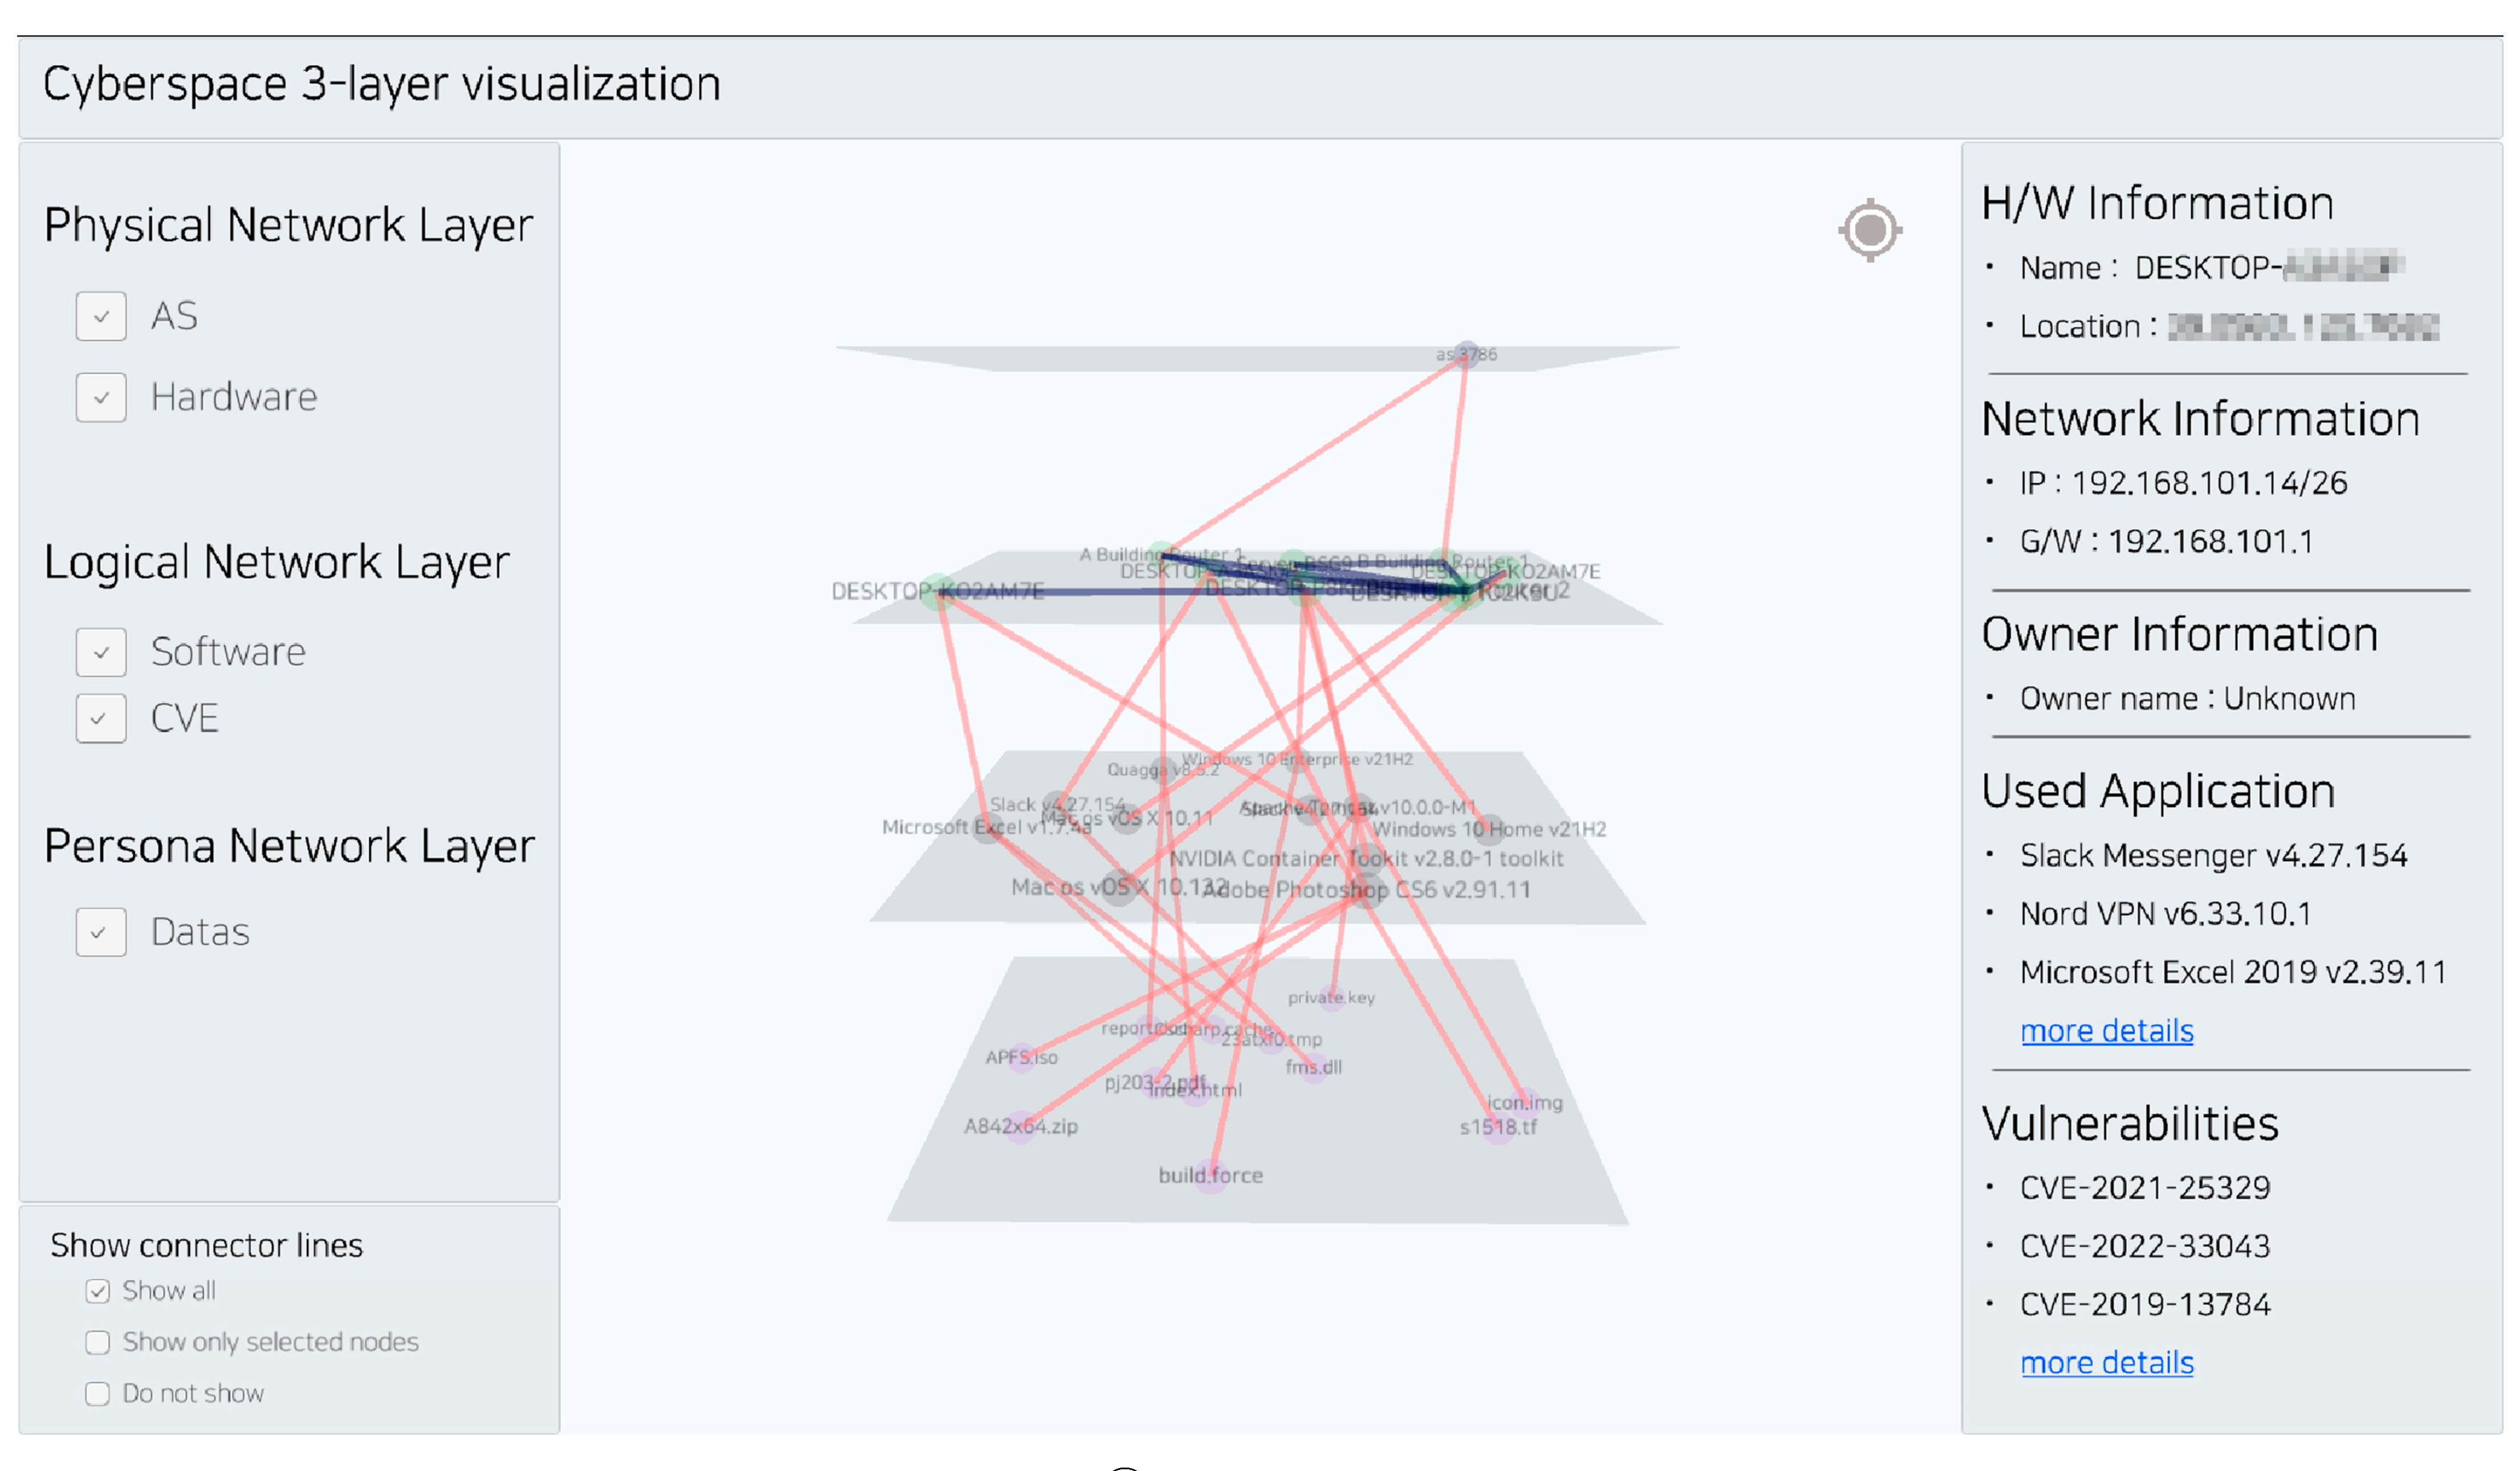
  • Physical Layers: Layers containing geographic components and physical network components (routers, servers, computers, etc.).
  • Logical Layer: A layer that includes logical network components (Application (APP), Operational System (OS), etc.) consisting of logical connections that exist between network nodes.
  • Persona Layer: A layer containing information (name, age, e-mail, social media account, etc.) about actors or users who plan and execute tasks within cyberspace.
The Joint Operational Planning Process (JOPP) is a technology that supports missions at all levels of planning and across the full spectrum of military operations [11]. It is also a process from planning to command that synchronizes the actions of a unit to accomplish its mission according to time, space, and purpose. However, this is a procedure that does not take cyberspace into account. Accordingly, Joint Publication (JP) 3–12 [4] suggests a way to apply cyberspace operational planning considerations in JOPP, which is summarized as the Joint Cyberspace Operational Planning Process (JCOPP), as shown in Figure 1.
Targeting is used to sequentially analyze targets and apply actions to achieve operational objectives [12]. The Joint Targeting Cycle (JTC) proceeds in the order shown in Figure 1 and refers to the process of identifying and evaluating potential targets contributing to the achievement of operational objectives.

2.1.2. Definition of Cyber Awareness

Situational awareness is the most active area of research in the military field. It refers to the perception of an entity in its environment, an understanding of its meaning, and a prediction of its near-future state [13,14,15]. Several studies have been conducted to implement situational awareness in cyberspace. Barford et al. [16] explained the following seven aspects of cyber situational awareness.
  • You should be aware of the current situation: you must be able to identify and recognize attacks, which goes beyond intrusion detection.
  • Pay attention to the impact of an attack: impact assessments should be performed now and in the future.
  • Be aware of how things are going: situation tracking is a key component of this aspect.
  • Pay attention to the behavior of the threat actor: focus on the actions of the attacker or threat actor in the situation rather than the situation itself.
  • Recognize why and how the current situation occurred: causal analysis and forensics are included.
  • Recognize the quality of the collected context-aware information items and derived knowledge decisions: this can be seen as part of a concrete perception.
  • Evaluate the plausible future of the present situation: predict the paths and actions a threat may take in the future.
Franke et al. [17] defined cyber situational awareness to include an awareness of all kinds of suspicious activities occurring in cyberspace and providing additional insight into the overall situation.
Jacq et al. [18] defined cyber situational awareness as assisting decision makers by recognizing events, along with their origins, outcomes, and future predictions, through the collection, fusion, and visualization of data.
Summarizing the above studies [13,14,15,16,17,18], cyber situational awareness is defined as recognizing the current situation in detail and predicting the future situation, focusing on the behavior of the threat actor.

2.2. Cyber Common Operational Pictures

In the military field, the Common Operational Picture (COP) recognizes the general situation, updates data on changing situations, exchanges data with internal and external systems, and collects information. Such a COP can be said to be an effective command and control system if the user can easily recognize the situation by looking at the data visualization screen [19,20,21,22,23].
A CyCOP is a visualization tool for the commander’s cyber situational awareness and considers strategic, operational, and tactical/technical levels when presenting information [24]. It should embrace the existing COP and have a level of relevance that can be easily adapted to the way it is used, such as menus, symbols, and input methods. In addition, it must be able to sufficiently support the existing weapon system or Command and Control (C2) system that uses cyberspace internally [25,26,27,28,29,30,31,32,33,34].

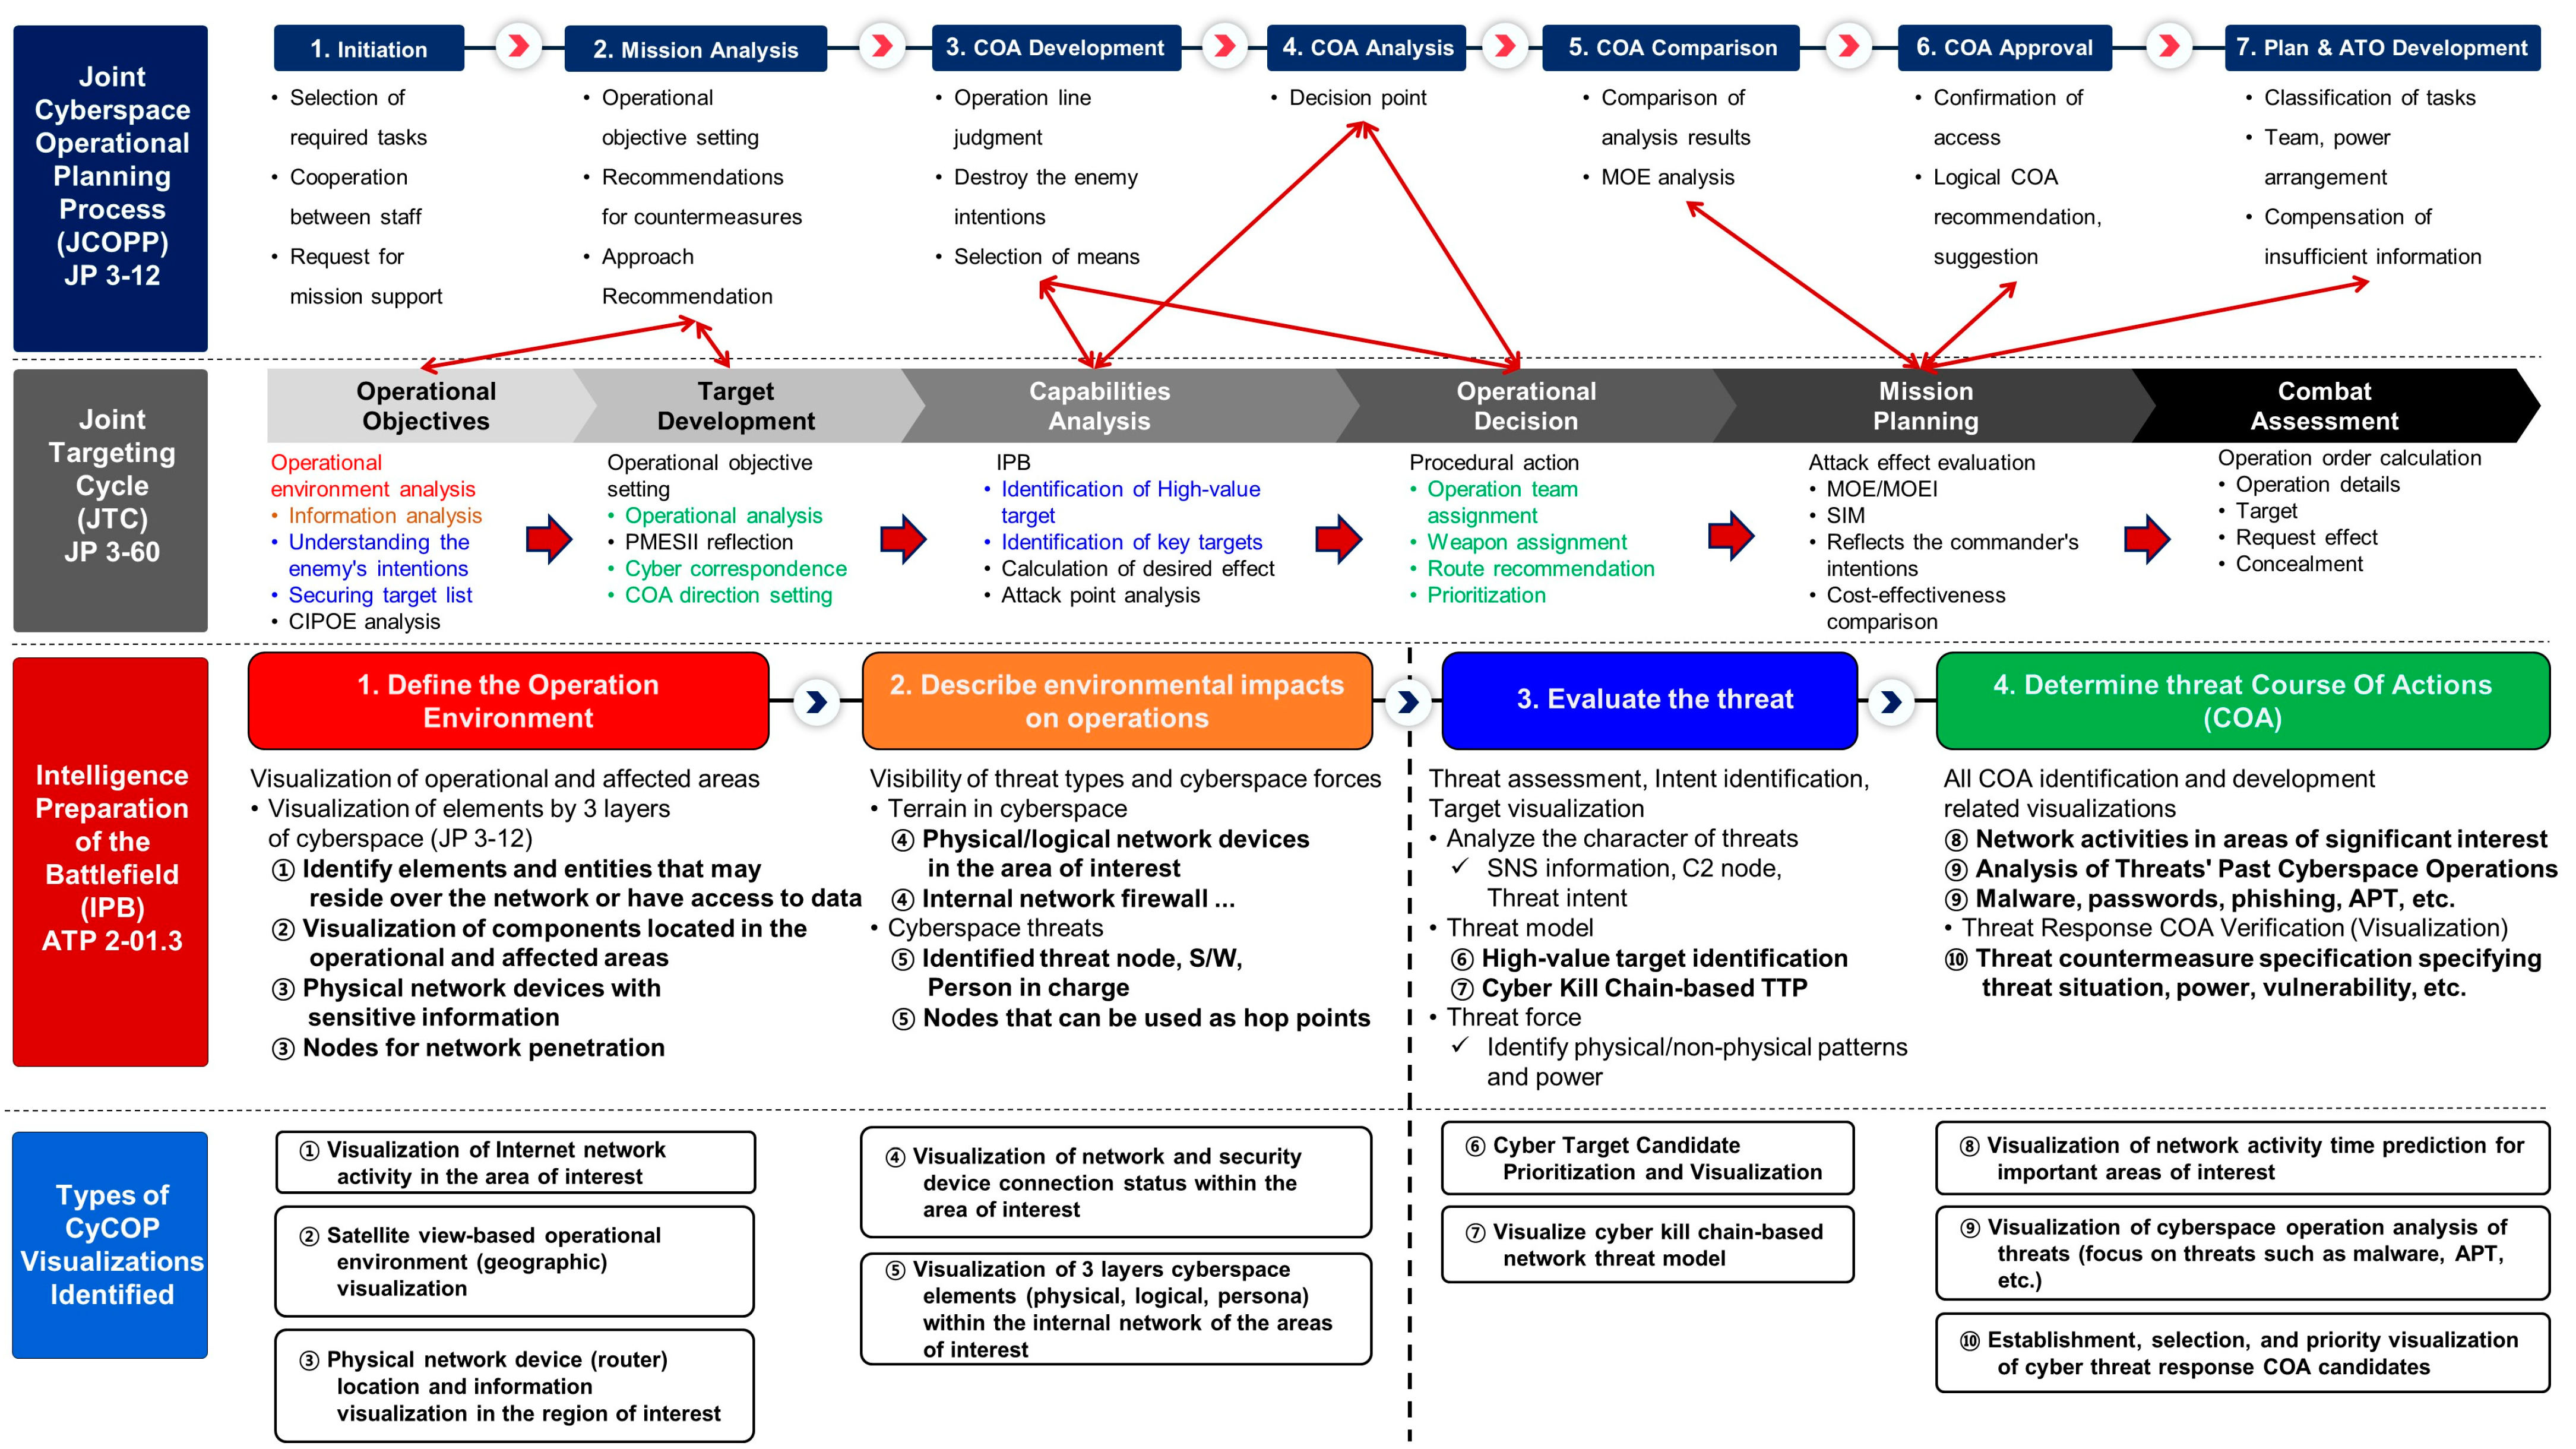
2.2.1. Intelligence Preparation of the Battlefield

U.S. Army Techniques Publication (ATP) 2-01.3 Intelligence Preparation of the Battlefield (IPB) [35] describes a systematic procedure for analyzing mission variables, including the enemy, terrain, weather, and civic considerations in the region of interest, to determine their impact on operations.
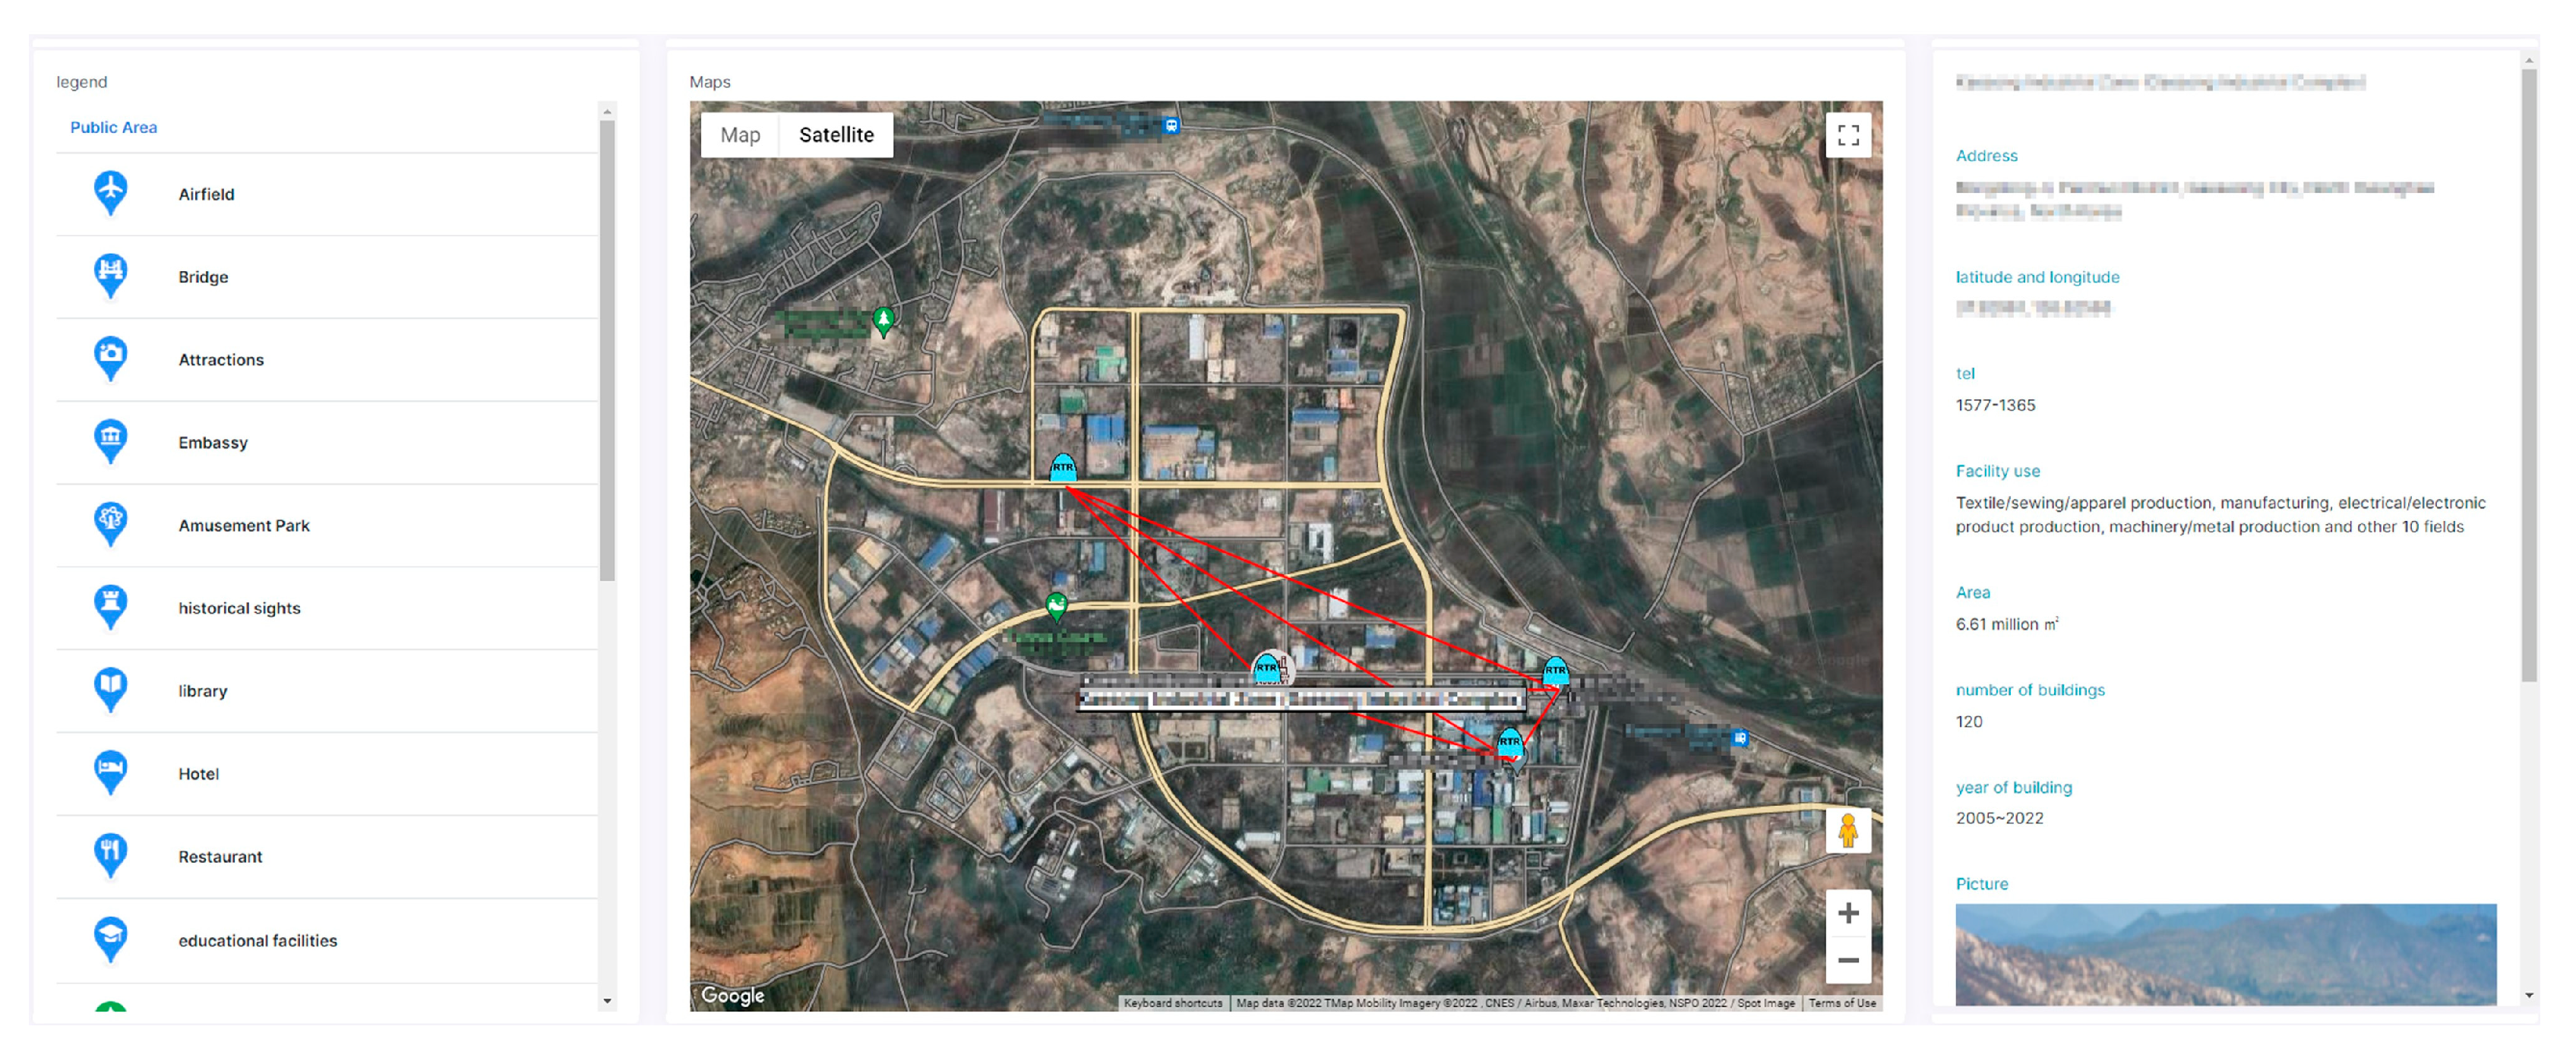
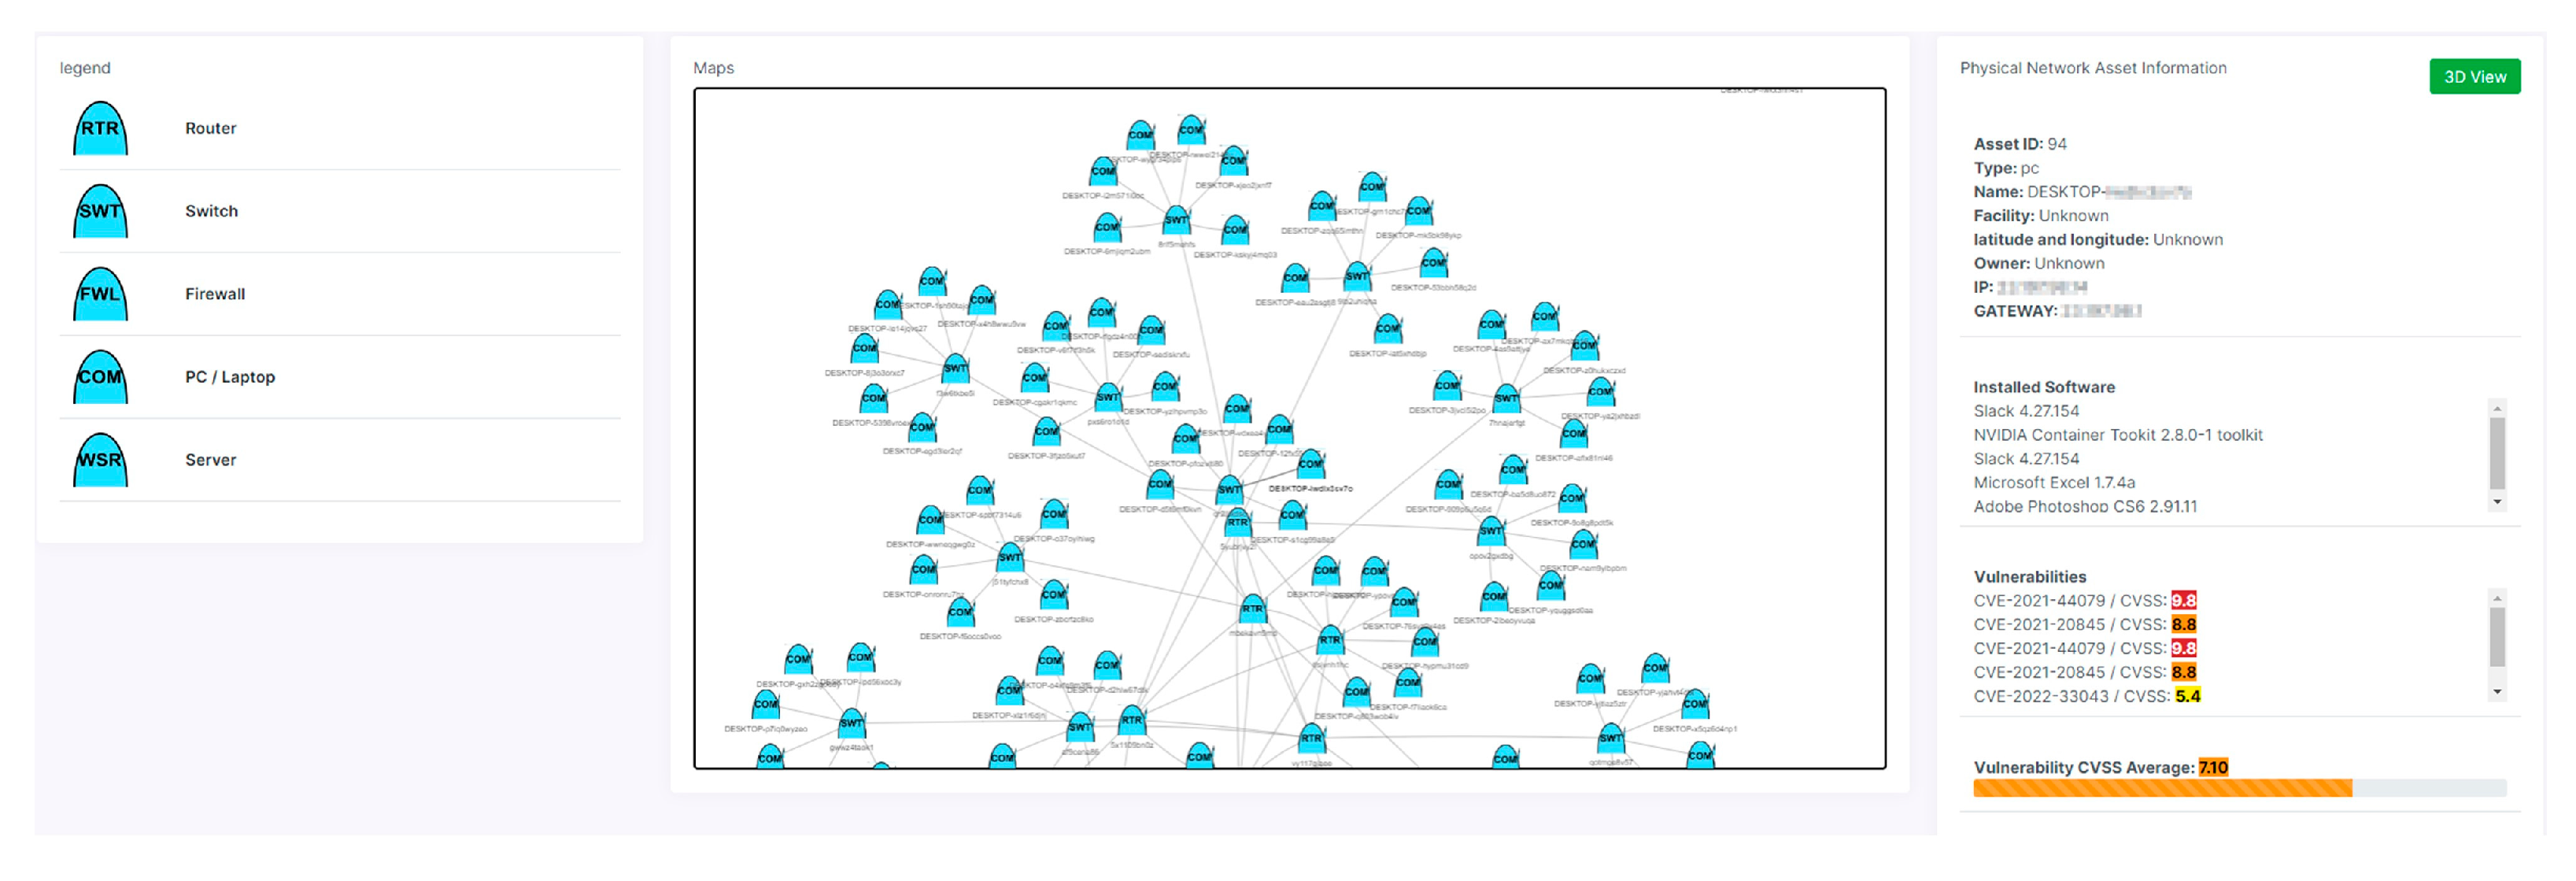
  • Define the Operation Environment: it graphically visualizes the current physical locations of items and threats for each layer of cyberspace within the operational area. Table 1 lists the identification items for each layer in cyberspace.
  • Describe environmental impacts on operations: the Modified Combined Obstacle Overlay reflects and visualizes the three layers of cyberspace. It is divided into an external network that can use the Internet and an internal network that does not use the Internet (internal network). It is visualized considering the contact point (firewall) connecting the external and internal networks.
  • Evaluate the threat: it should update the threat characteristics, create a threat model, develop a comprehensive threat response plan, and identify high-value targets. In addition, when analyzing the cyber-attack structure and the attacker’s past patterns, it should clarify the threat situation. It should be able to see the threat’s preferred internal movement attack technique and all the malware used by the threat, and then identify assets (high-value targets) that are critical to the threat’s ability to conduct an operation or point.
  • Determine threat Course of Actions: when selecting a threat response plan, the expected action (path) should be graphically displayed. In addition, the Modified Combined Obstacle Overlay should be nested to represent a threat that incorporates environmental impacts and implements specific countermeasures.

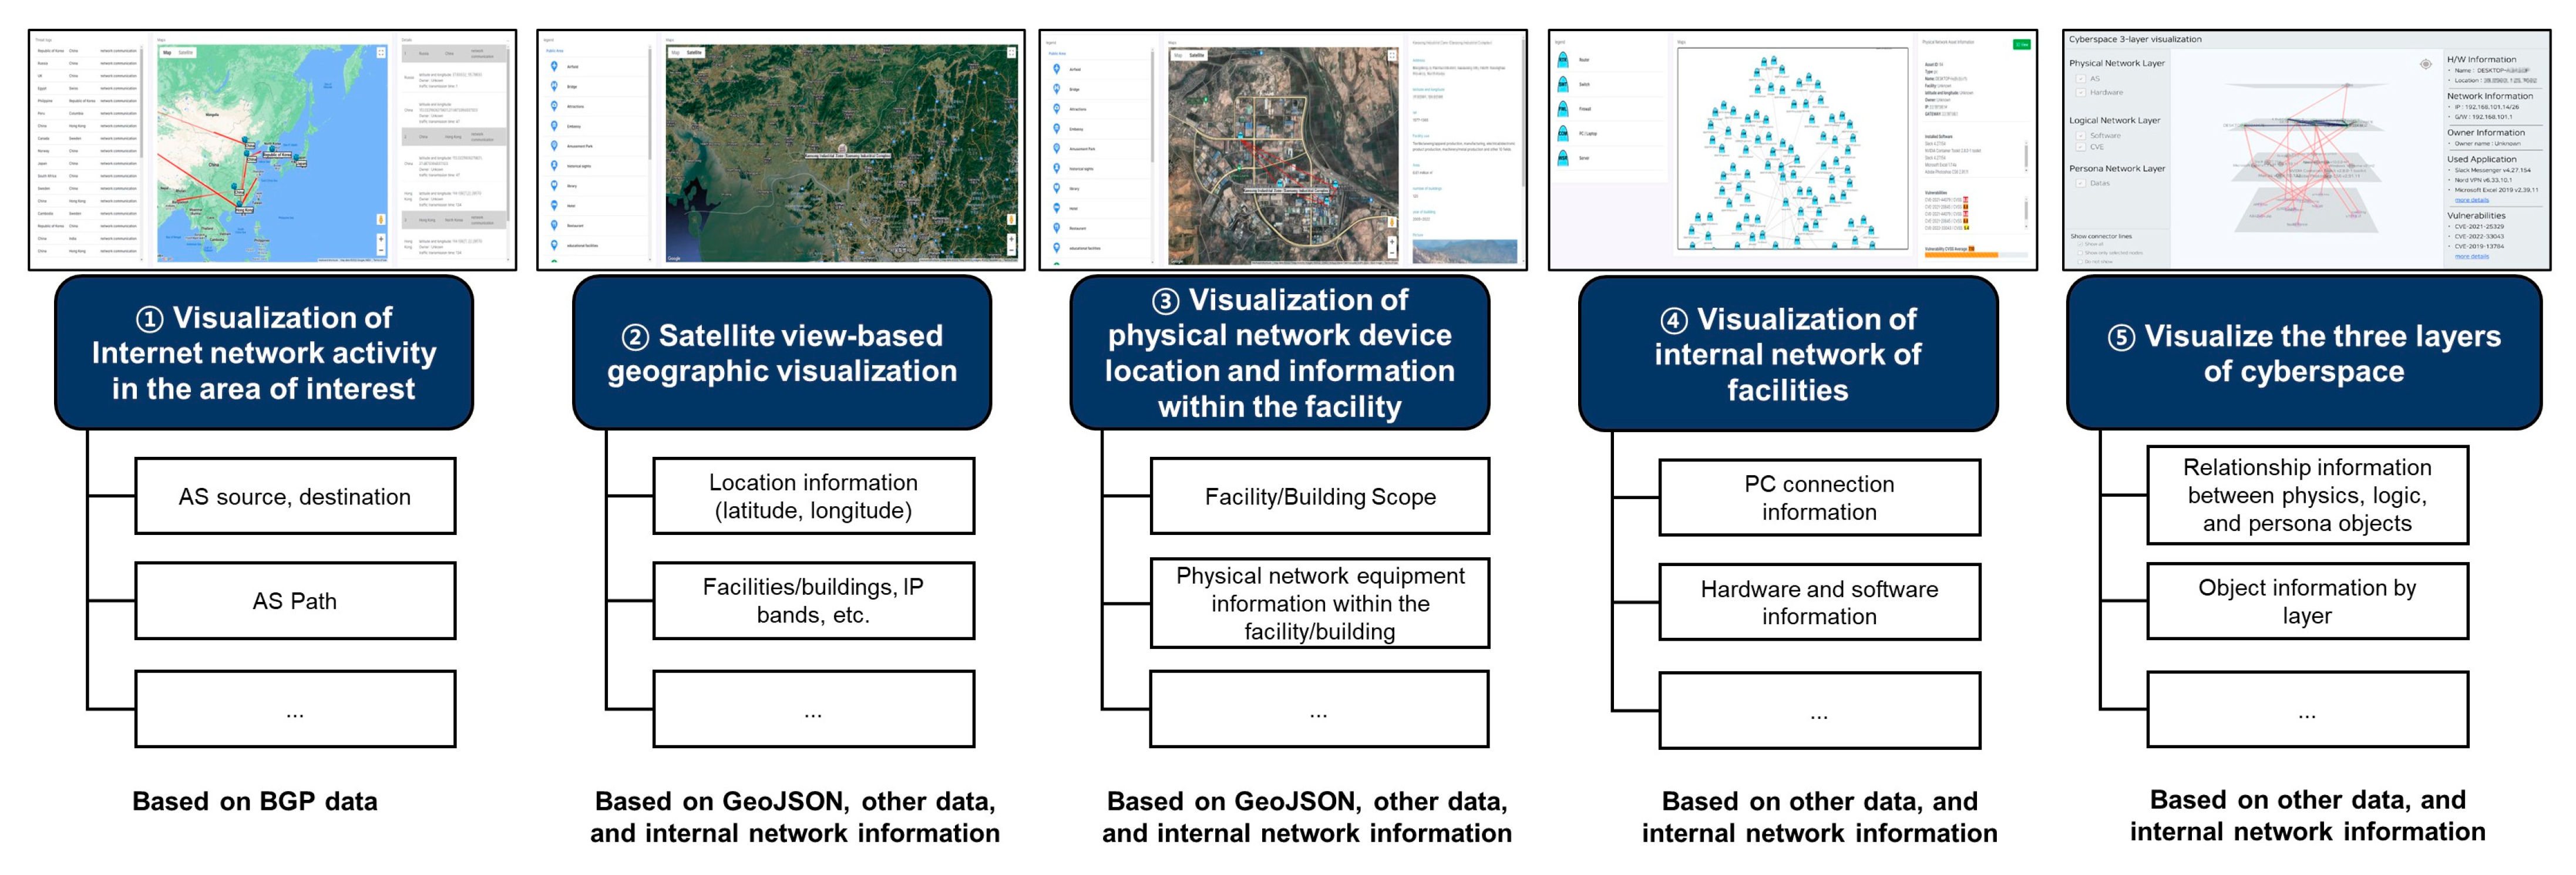
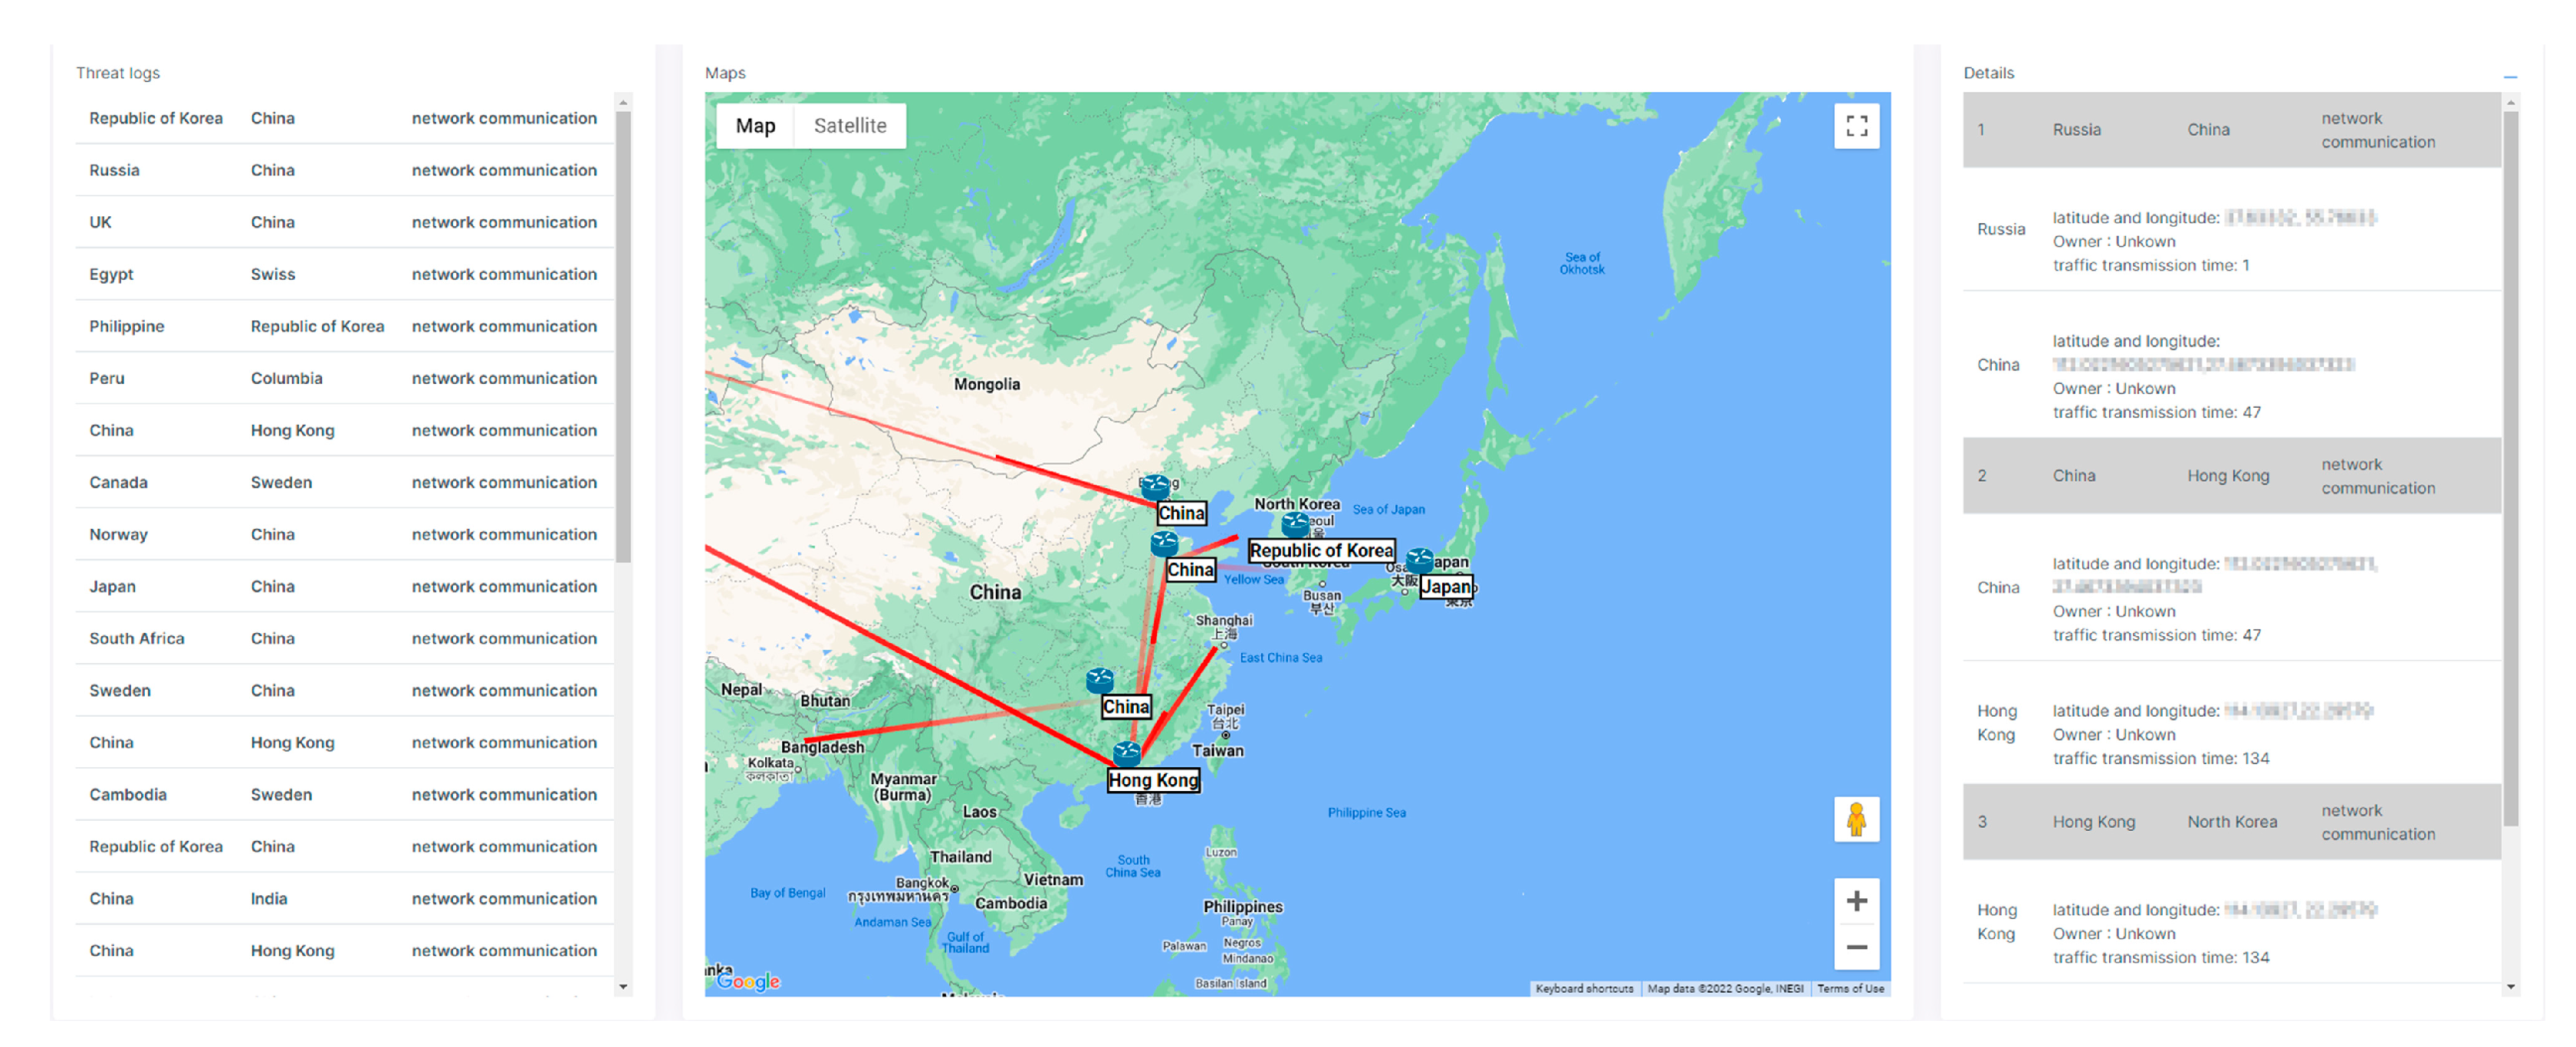
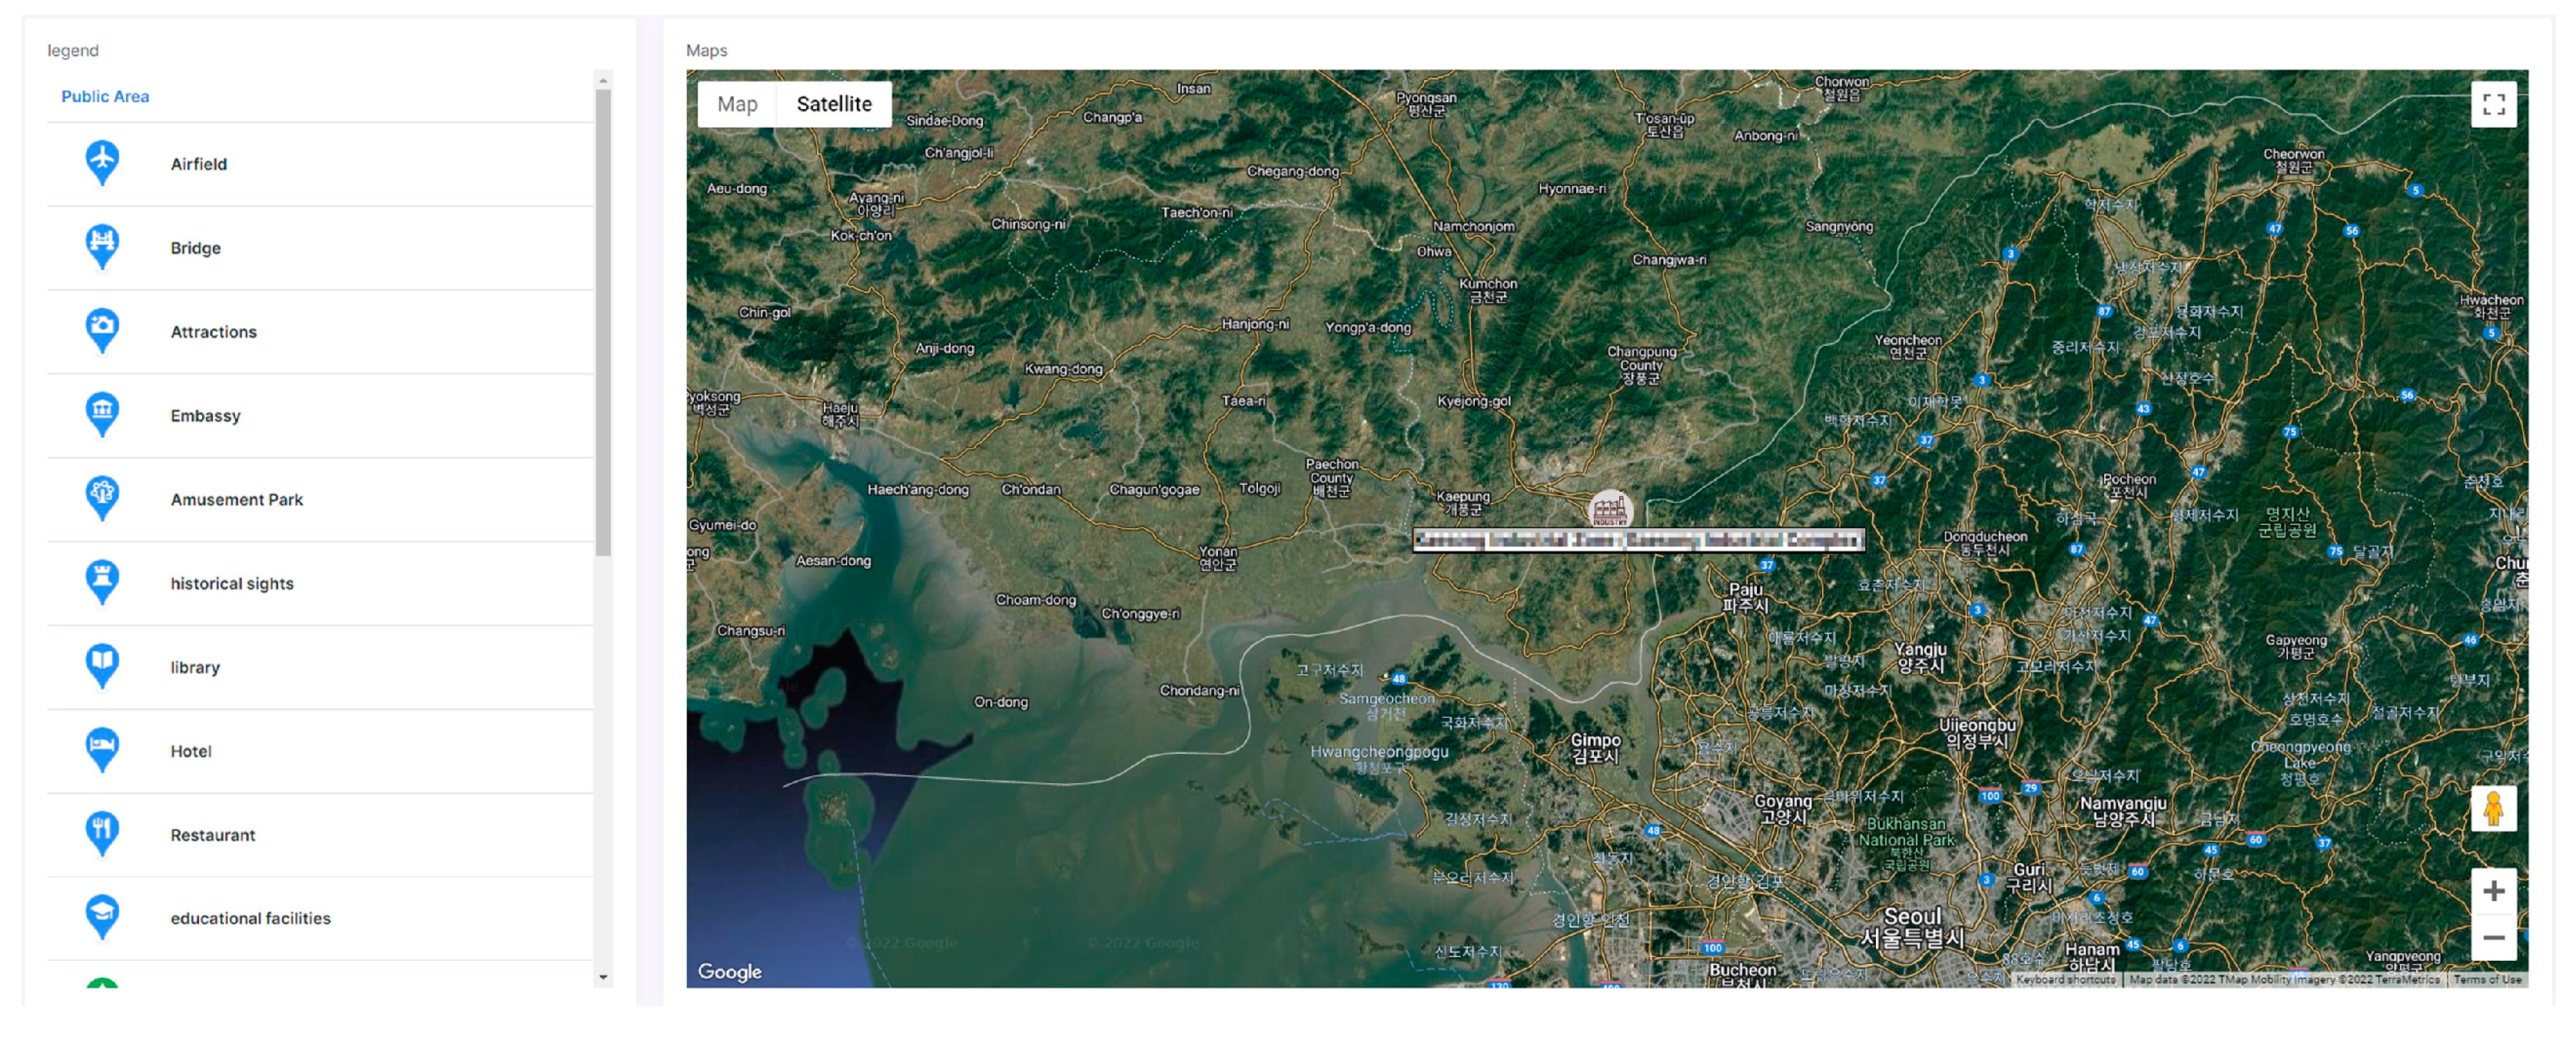
2.2.2. Identify Types of CyCOP Visualization

Based on the JCOPP and JTC investigated in Section 2.1.1 and the U.S.ATP 2-01.3 IPB investigated in Section 2.2.1, the types of visualization required when composing CyCOPs are identified, as shown in Figure 1. The second stage of JCOPP mainly sets operational objectives. For this, it is essential to analyze the operational environment, which is the main task of the first stage of JTC. In addition, the main tasks of the second stage of JTC, setting operational goals, and the main tasks of the second stage of JCOPP coincide with each other. The relationship between JCOPP and JTC is identified with a red arrow in Figure 1. JTC steps 1 to 4 are included in ATP 2-01.3. The red text of JTC corresponds to IPB stage 1, and the orange text corresponds to IPB stage 2. In this way, IPB steps 1 to 4 are identified. CyCOP visualization types are identified according to each element and definition at each stage of the IPB. In the figure, items marked with ① in the detailed description of the IPB stage correspond to ① in the identified CyCOP visualization type. In this way, visualization types from ① to ⑩ are identified.
Table 2 summarizes which of the 10 types of visualizations identified in Figure 1 were implemented in the investigated CyCOP studies [24,25,26,27,28,29,30,31,32,33,34]. Looking at Table 2, it can be seen that most studies only used geographic visualization (②) and the internal network connection status (④). However, in this case, there was insufficient information to identify high-value targets in the third stage of the IPB, “threat assessment.” Therefore, in this research, the visualization screens (①–⑤) of the first and second stages of IPB were implemented, and information was expressed in detail to allow high-value targets to be identified in the third stage of IPB.

2.3. Cyber Common Operational Pictures Interface

In order to quickly prepare and respond to a rapidly occurring cyber-attack, it is necessary to quickly recognize the cyber situation. To do this, the CyCOP needs a fast system response time and should be easily and quickly recognized by anyone. This section shows how four items were investigated. First, research and manuals on system response times that were perceived by users as fast were investigated. Second, the CyCOP visualization screen User Interface (UI) was investigated. Third, object symbols that could be clearly understood by a user on the CyCOP visualization screen were investigated. Fourth, the size of the object displayed in the CyCOP visualization screen was investigated.

2.3.1. Research on Response Time

MIL-STD-1472H [36] presents the definition and time for each item, leading to the response times listed in Table 3. In addition, it is suggested that the maximum system response time of a real-time system should not exceed the time in Table 3.
Kim et al. [37] investigated the response time experienced by users after general operations in a study on the response time in smartphone-related fields. There are a total of 28 users, 14 in their 10 s and 20 s (7 males and 7 females) and 14 in their 40 s and 50 s (7 males and 7 females), and they had been using their smartphones for at least 6 months. This survey showed that users considered the responses to be instantaneous when the system responded within 0.1–0.2 s or 0.5–1 s. If the system responded within 2–5 s, it seemed like it was in progress, but if the system responded within 7–10 s, it felt like it was disconnected. Table 4 summarizes the guidelines for the minimum response time of an appropriate system after user manipulation as suggested in the research, along with guidelines on human response time. What should be noted in this research is that users generally think that the system is operating normally until the response time is 5 s, and they are interested in the progress. However, if the response time is more than 7 s, it is considered that the system is not working properly. Therefore, it is suggested that the response time should be less than 5 s to give users confidence that the system is operating normally. Shneiderman [38] suggested that most users prefer a short response time, and if the response time is longer than 15 s, their concentration is dispersed. The appropriate response times according to the time definitions are presented in Table 5. The above three studies [36,37,38] suggested response speeds according to the execution. If this is again classified and synthesized according to the difficulty of calculation and data processing, it can be defined as a simple response time (less than 2 s) and complex response time (more than 2 s).
1.
Definition of Simple Response Time
  • The input response displayed according to the operation of the input device reacts within approximately 0.5 s.
    -
    Character display after keyboard input, cursor movement, mouse selection, switch/button press display, scroll wheel, optical wheel, mouse click, page scan, XY entry, pointing, sketching, local update, error feedback, etc.
  • Reaction within 1 s when executing a file with some capacity after operating the input device.
    -
    Turning pages, simple and frequently used actions, etc.
  • Simple and repetitive function execution has a response time of 2 s.
    -
    Simple inquiry from local host, simple function execution, host update, etc.
2.
Definition of Complex Response Time
  • Execution that is simple but requires computation and data call outside the unit area.
    -
    General execution, the initial response to system access, input verification, input error notification, etc.
    -
    Calling various data such as threat information or map components.
  • Complex execution such as complex operations and data processing.
    -
    When it involves complex sequence/function execution or program loading such as system startup or shutdown.
    -
    Remote server data call file update, complex inquiry, etc.
Table 6 shows the response times of 10 items that can be classified as simple execution among the 12 action items suggested by the above studies [36,37,38], defined to be within 2 s. In addition, for execution items that require computation or data processing such as complex inquiry, the response time is presented at the level of 10 s. All the times in the table are indicated in seconds.

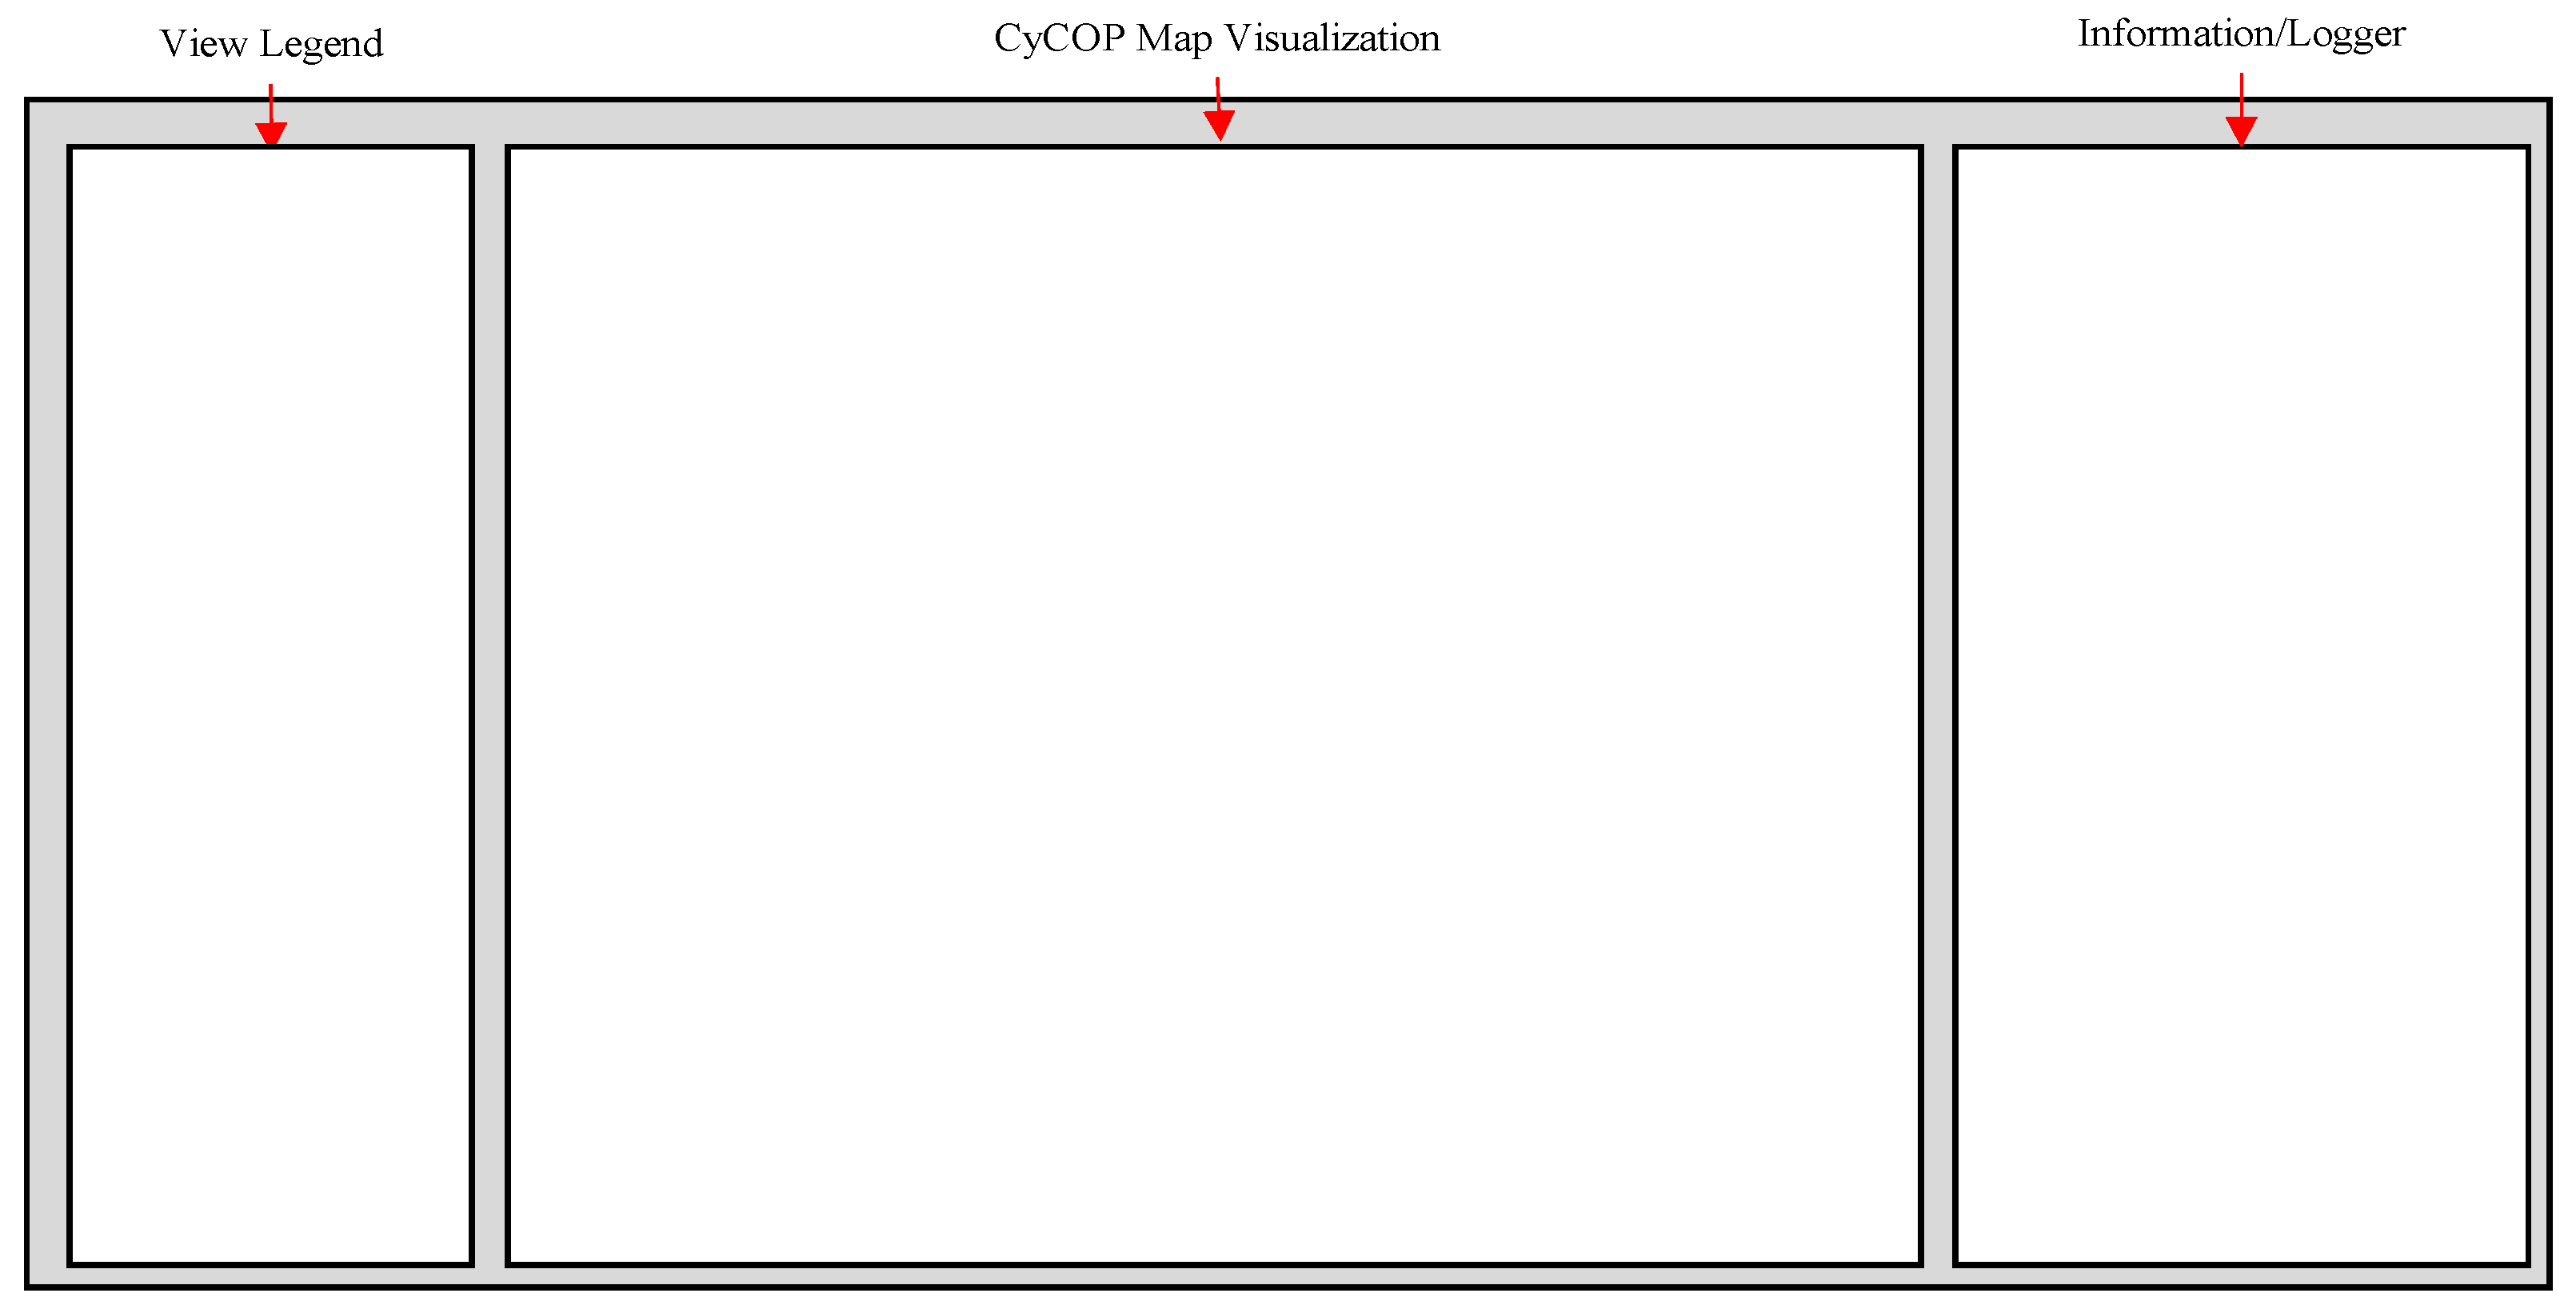
2.3.2. Research on CyCOP Visualization Screen UI

UI refers to a physical and virtual medium that allows users, systems, and S/W to communicate. Such UI is also very important for CyCOPs, where users need to be aware of the cyber situation.
Esteve et al. [24] presented a UI that placed small screens (Ri) on the left and bottom, expressed the Map/Main display in the center, and displayed a scorecard/Logger on the right. The Map/Main display could display the terrain or cyberspace domain. The scorecard/Logger provided additional controls and logs for users to interact with the system, and Ri visualized graphs, charts, and more.
Dillabaugh et al. [33] implemented a CyCOP based on scenario simulation. Accordingly, the following screen functions were placed on the upper and left sides of the UI.
  • Scenario Controls: a widget that allowed the user to start/pause/speed up a scenario.
  • Active Persona Widget: this made it possible to set the currently active persona, which was a fictitious individual using the CyCOP scenario within the current scenario.
  • Layers Widget: the user could control the layers displayed on the screen.
  • Ticket Widget: display a sticker for the active persona: a “Ticket” was an action or information assigned to the current user. The Ticket Widget allowed the active persona to see all the Tickets currently assigned to it.
The UI-related studies investigated [24,33] were designed differently depending on the characteristics to be expressed in each CyCOP. Esteve et al. [25] highlighted checking detailed analysis information using graphs, charts, etc. of the selected object on the Map/Main display by arranging several areas called Ri on the UI. In the research of Dillabaugh et al. [33], the intention was to analyze scenarios like a time series by arranging scenario-related windows on the top and left side of the UI. As in the above studies, in this research, the UI was configured differently depending on the intention to express on the CyCOP visualization screen or the main data.

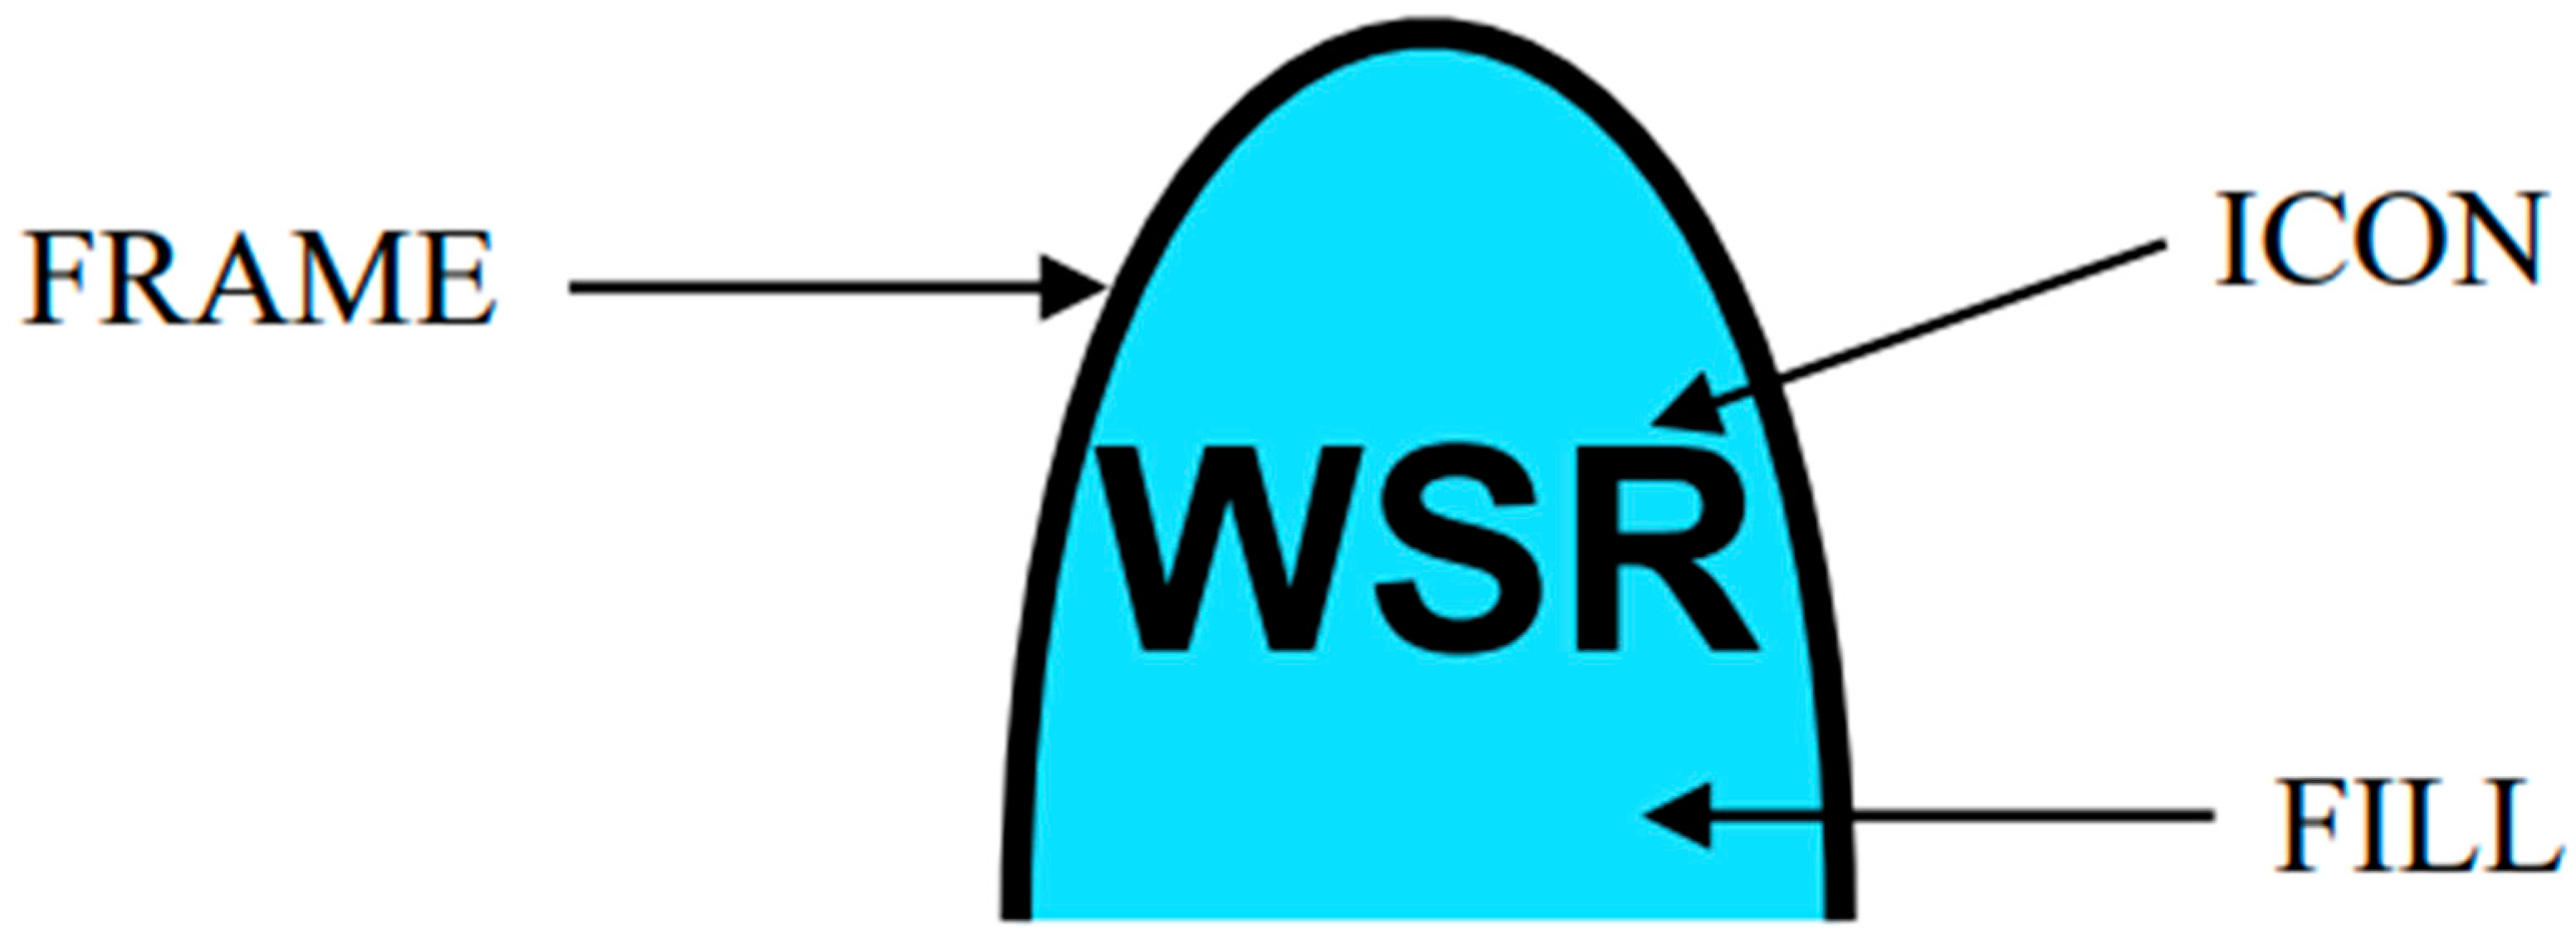
2.3.3. Research on Object Symbols Expressed on the Screen

It is important to clearly understand the objects shown on the CyCOP visualization screen by applying a common standard to all practitioners. McCroskey et al. [39] logically expressed the cyberspace and expressed objects as hexagons. Several symbols or characters were placed inside to distinguish objects. In addition, the actions of each object were expressed using lines such as attack, extraction, and repair. This is an appropriate expression method when limiting cyberspace to only the space where operations are performed and expressing cyber-attacks and defense measures according to the graphic.
MIL-STD-2525D [40] proposes to display objects in the cyberspace domain as shown in Figure 2. The Frame is a geometric border that represents the state of an object, and Icon is the innermost part of a symbol that provides a graphic representation of an object. For the icons of cyberspace objects, the format shown in Table 7 is used. Finally, Fill is the area inside the Frame, where the color provides an indicator related to standard recognition. The color is set to a hostile red, friendly blue, neutral green, or unknown yellow. This is a highly versatile expression method that can be used not only in cyberspace but also on real maps. In this research, in order to construct the CyCOP visualizations derived from Figure 3, we complied with the symbol expression standards of MIL-STD-2525D [41].

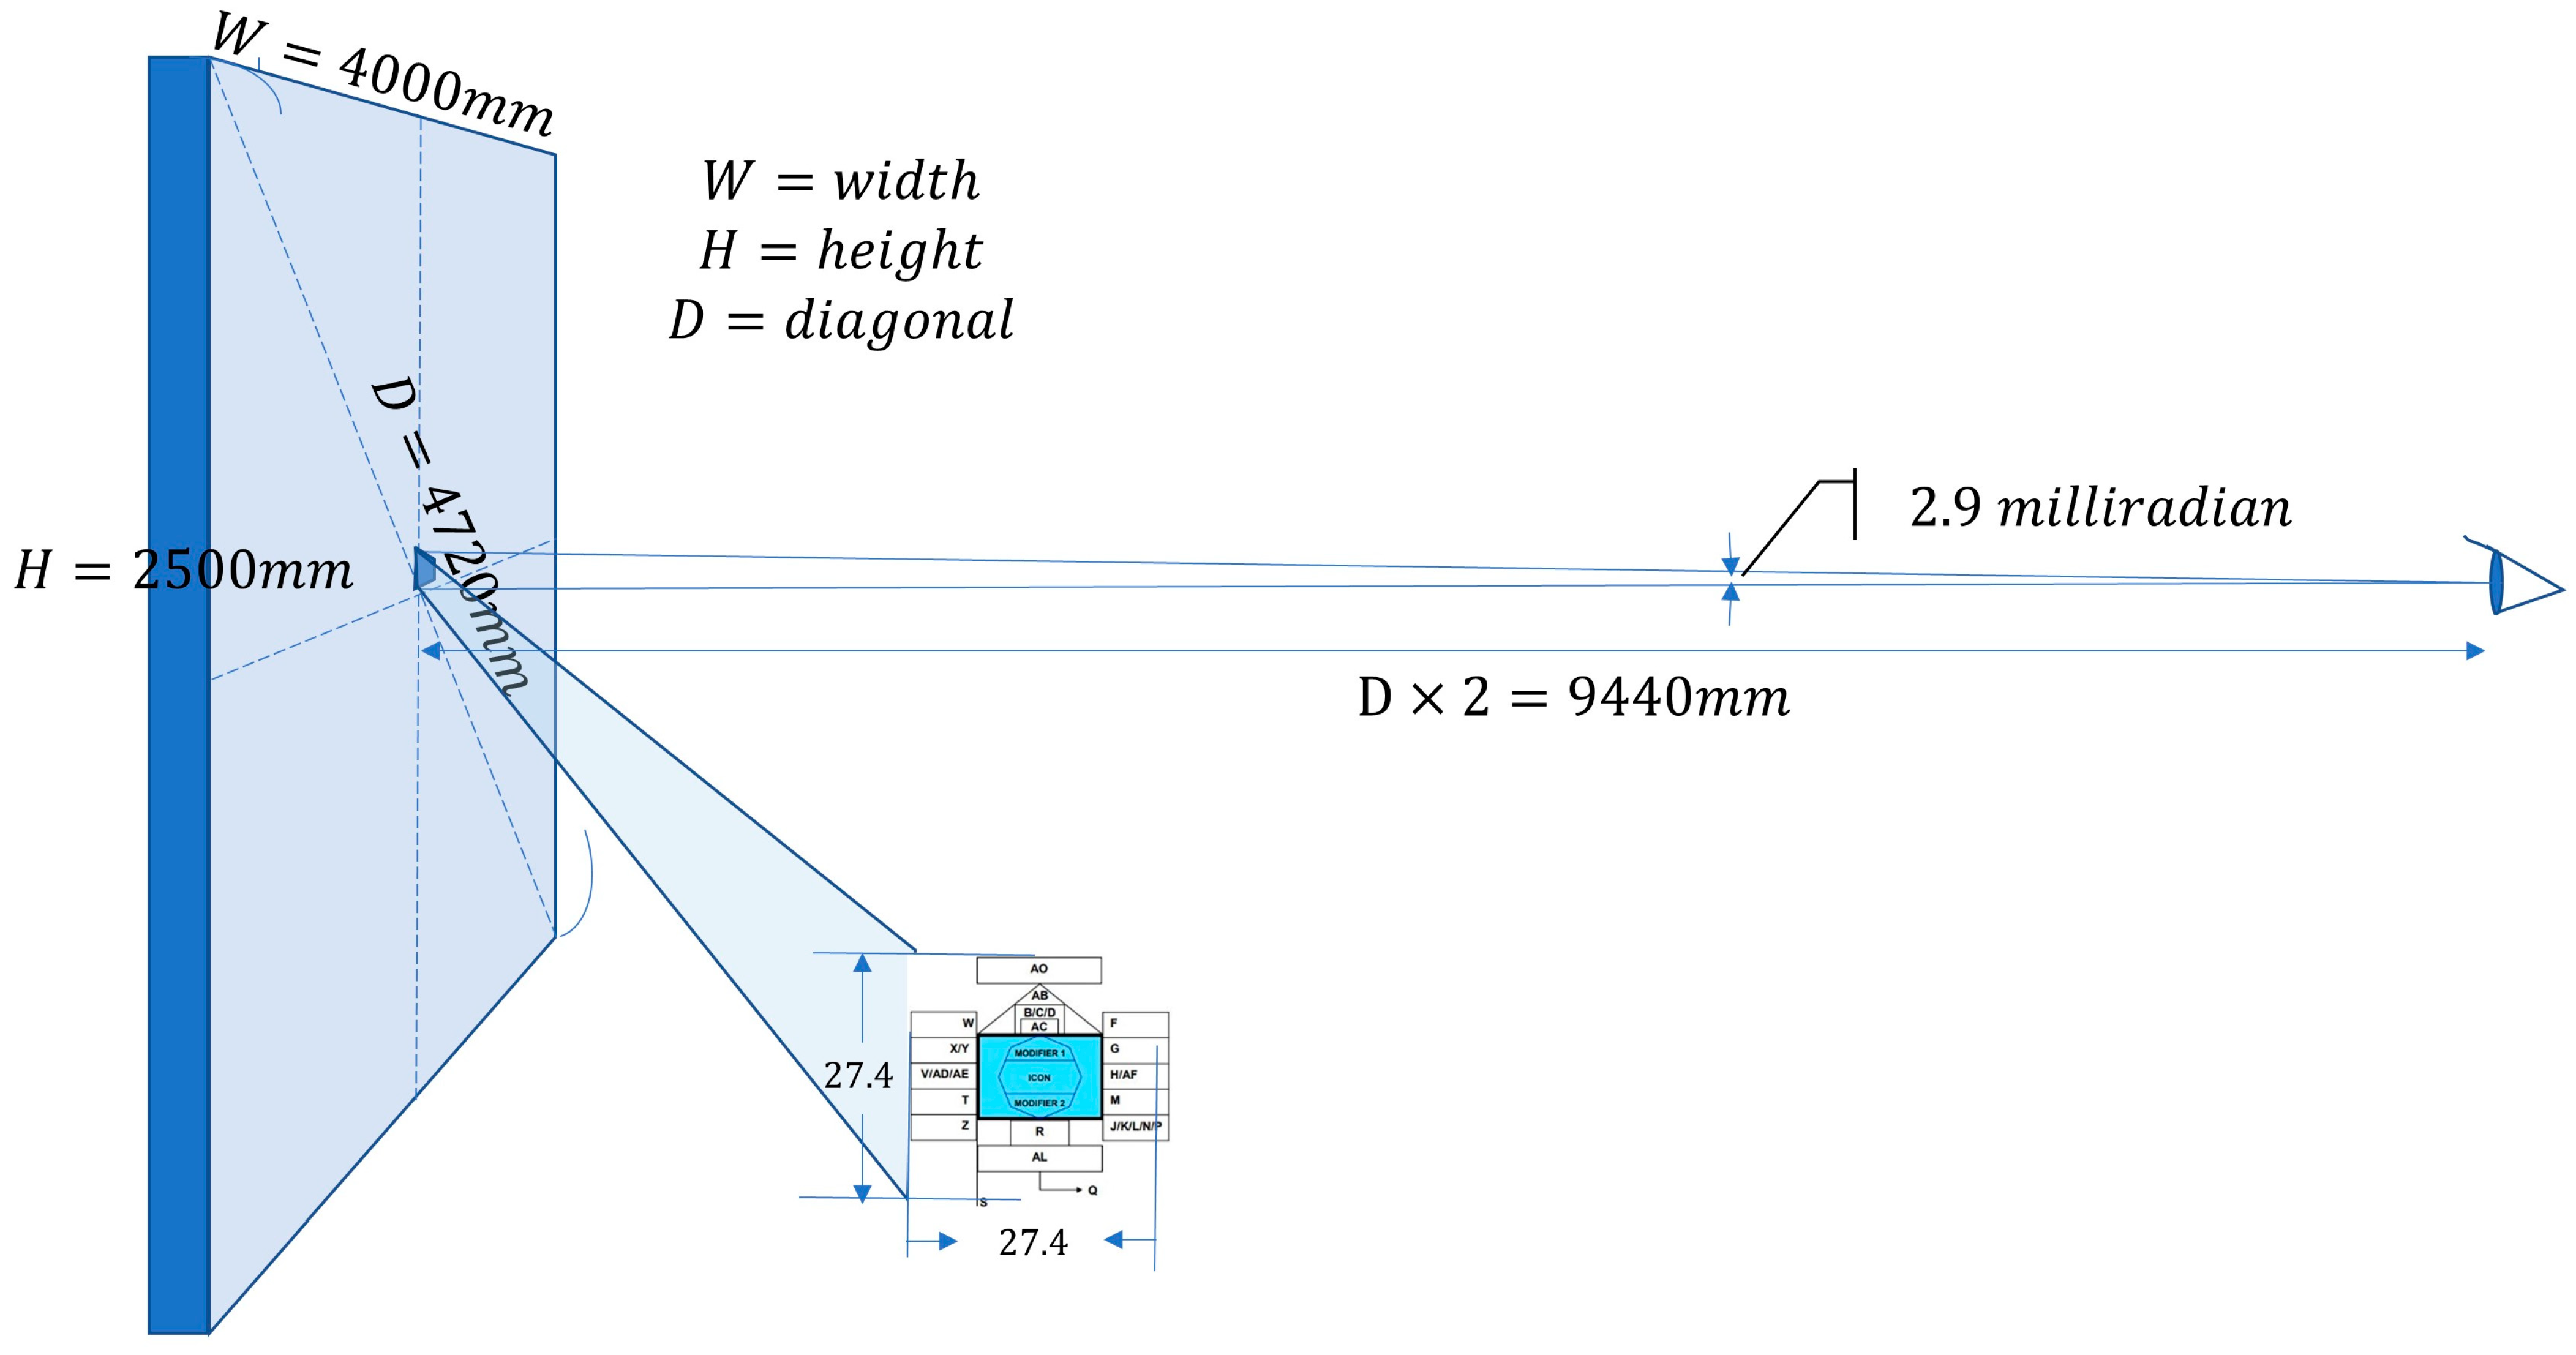
2.3.4. Research on the Size of Expression Objects on the Screen

In MIL-STD-1472H [36], the screen size and object size ratio are calculated based on the visualization of a CyCOP map screen on the wall screen. As shown in Table 8, the size of the object is defined by the screen size, viewing angle, and distance for one object.
First, by calculating the maximum expected visible distance from the user’s eyes to the screen according to the screen size, the size of the object can be determined according to the viewing angle. In this case, the object has a size that includes all of the additional text and title. For example, if you configure a CyCOP with a 2.5 m × 4 m screen (corresponding to a 1680 × 1050 or 1900 × 1200 resolution), the diagonal length is about 4.72 m. Thus, the optimal distance is determined to be 4.72 × 4.0 (Optimum) = 18.88 m, and the allowable distance is at least 4.72 × 2 (Acceptable Limits) = 9.44 m. If it is designed with the minimum distance of 9.44 m, the size of the object that the user can recognize is calculated to be 2.9 milliradian ((9.44m × 2.9 milliradian)/1000 = 27.4 mm)). The number of objects that can fit vertically on a 2.5 m × 4 m screen is 2500 mm/27.4 mm = 91 (maximum), as shown in Figure 4.

3. Design and Implementation of the CyCOP Framework

The CyCOP is a graphical visualization tool for situational awareness in cyberspace. Cyberspace should be divided into external network information and internal network information to collect data, process it, and visualize it. Accordingly, the CyCOP framework was designed as shown in Figure 3.
From a military point of view, IPB stages 1 and 2 are preparation stages for cyber-attacks. In the case of the 3rd and 4th stages of IPB, “information” and “operation” are the areas of response to cyber-attacks. Because the goal of this research was to prepare for cyber-attacks, we designed and implemented visualizations from ① to ⑤ that corresponded to IPB stages 1 and 2 among the types of CyCOP visualizations shown in Figure 1. Visualization screens ① to ⑤ of the CyCOP visualizations are shown in Figure 5, and the data used for these visualizations are shown in Figure 6.

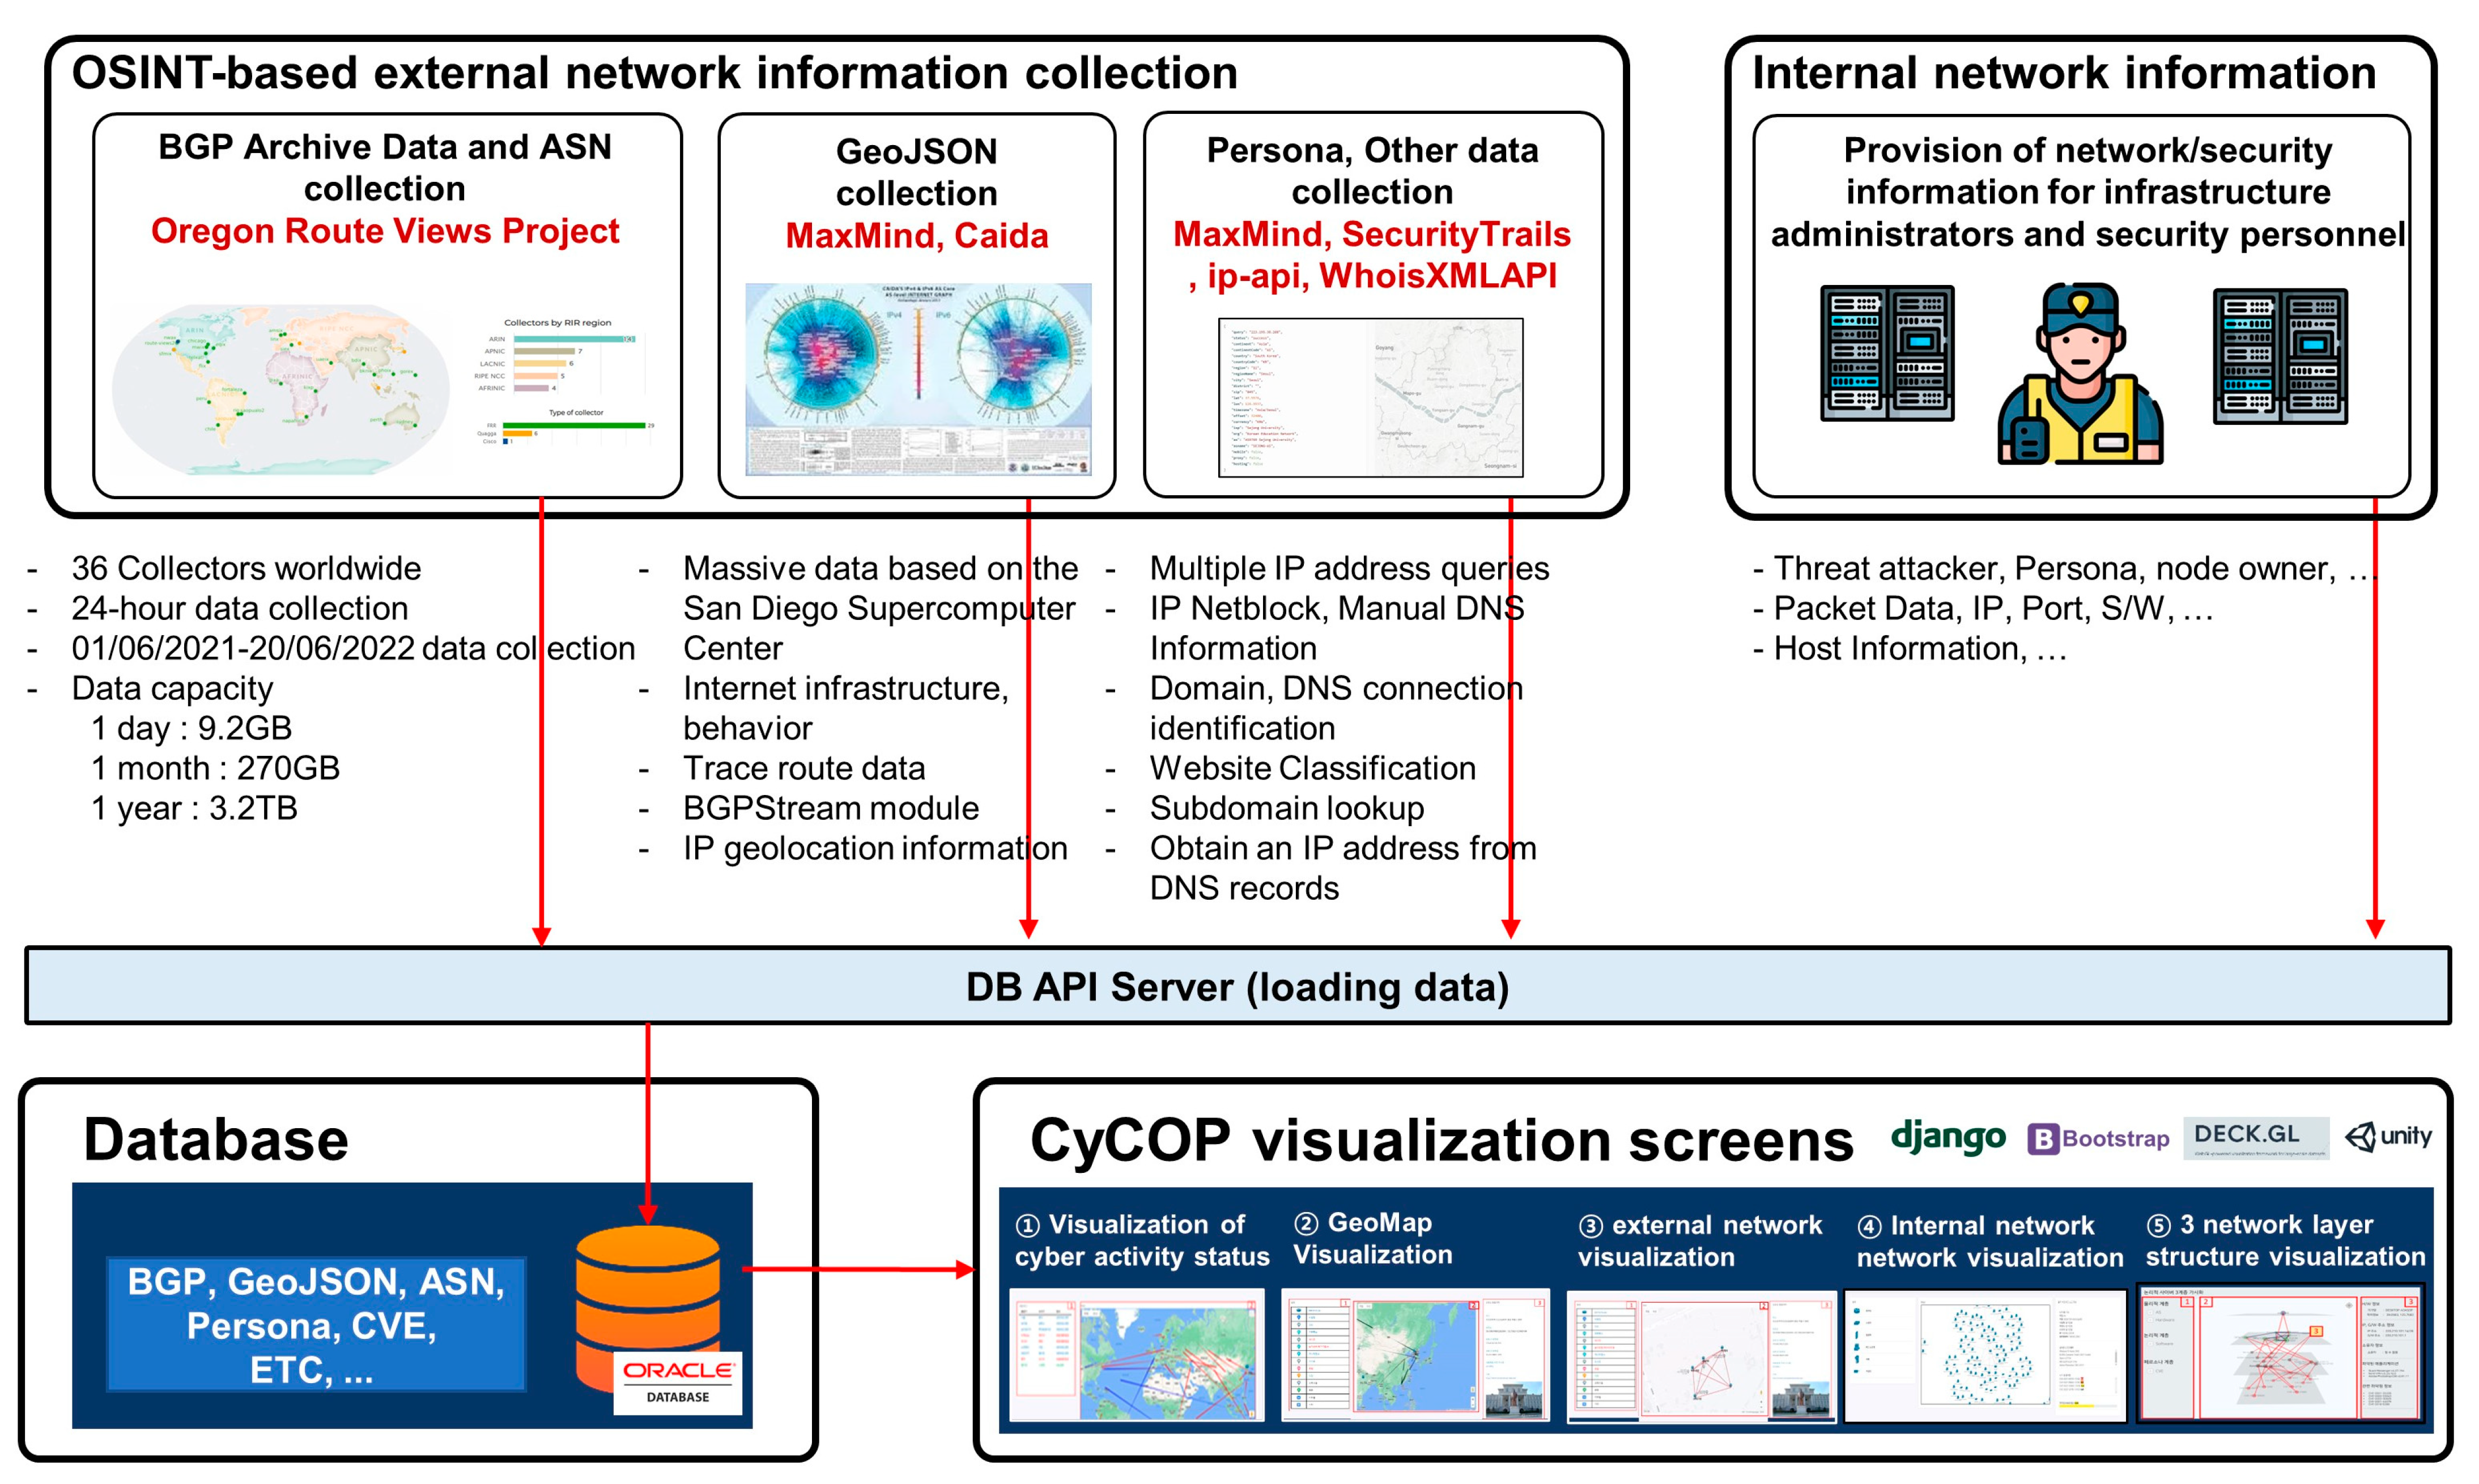
3.1. Collecting External/Internal Network Information

Open-Source Intelligence (OSINT) refers to information obtained from open sources. The upper portion of Figure 4 shows that external network information is collected based on information from public sources. External network information includes Border Gateway Protocol (BGP) information, Geographic (Geo) JSON, Persona, and other data.
BGP is an external gateway protocol used to exchange routing information between routers in different Autonomous Systems (AS). Oregon University uploads such BGP information to the University of Oregon Route Views Archive Project [41] every 2 h. In this research, these data were collected from 1 June 2021–20 June 2022 in a 24-h cycle. The data capacity was approximately 9.2 GB per day, approximately 260 GB per month, and approximately 3.2 TB per year.
GeoJSON is an open standard format designed to systematically represent terrain based on points with geographic information [42]. There is no detailed geographic information in BGP information, but by using information provided by MaxMind [43] and Caida [44], geographic information is obtained and converted into GeoJSON.
MaxMind, SecurityTrails [45], ip-api [46], and WhoisXMLAPI [47] were used for collecting Persona and other data. Using the IP and geographic information collected earlier, they found the information included in the 3rd layer of cyberspace and collected all non-overlapping items.
Information such as the network equipment, S/W, firewall, IP, and port was collected by requesting the internal network information from the infrastructure manager and security officer.

3.2. CyCOP Visualization

The CyCOP interface was designed in compliance with the reaction speed, UI, object symbol, and object size derived from Section 2. In order to comply with the reaction speed, the minimum number of resource files (js, css, etc.) was called during the visualization output. The UI was designed as shown in Figure 5. However, as suggested in Section 2.3.2, the UI shape slightly changed depending on the intent of the CyCOP visualization screens or type of data mainly used. The object symbols conformed to the standards of MIL-STD-2525D [40]. The object size was designed and implemented with a size of 13 pixels, as suggested in Section 2.3.4. Table 9 lists information for the hardware and software used to implement the CyCOP.
From a military point of view, IPB stages 1 and 2 are preparation stages for cyber-attacks. In the case of the 3rd and 4th stages of IPB, “information” and “operation” are the areas of response to cyber-attacks. Because the goal of this study was to prepare for cyber-attacks, we designed and implemented visualizations ① to ⑤, which corresponded to IPB 1 and 2, among the types of CyCOP visualizations shown in Figure 4. The visualization screens from ① to ⑤ of the CyCOP visualizations in Figure 4 and the data used for visualization are shown in Figure 6.
Visualization ① uses information such as the AS source, destination, and route from the BGP data. As shown in Figure 7, by linking the corresponding information with the visualization, the status of Internet network activity in the area of interest can be viewed dynamically. On the left interface, you can see the origin and destination of packets. On the right interface, it is possible to check whether a packet goes from a specific area to a specific destination via a specific area. This allows the network security officer to check which AS path the network packets accessing the enterprise access through. Such a visualization screen can be utilized by adding various functions. For example, adding functions such as network anomaly detection to Back-End can visualize packets suspected of being attacked.
Visualization ② uses the same map service API as Google Maps to visualize the satellite view-based map, as shown in Figure 8. On top of that, geographic information such as GeoJSON, other data, internal network information, and information such as the location/facility/building are mixed and visualized. The left interface shows the legend of the icons, and the central interface shows the satellite view-based map.
Visualization ③ shows the physical network status of a specific facility in visualization ② in detail, as shown in Figure 9. Among the physical network assets, it mainly visualizes the router, and checks the information of the router and how the routers are connected. The data used include GeoJSON, other data, and internal network information. The left interface shows the legend of the icons, and the right interface shows detailed information about the facility selected in the central interface. In general companies, it is possible to check the connection status of router devices of buildings managed in-house. The military can check how network devices are distributed within the threatening or threatened area. Through this, you can use operations such as disabling certain buildings and blocking certain networks.
Visualization ④ is used to understand the internal network of the facility selected in visualization③. Physical network assets such as PCs, servers, switches, and firewalls, which cannot be properly located, are visualized in a logical graph, and their connection relationships are identified as shown in Figure 10. The left interface represents the legends of icons, and the central interface represents the connection status of each object. In the right interface, information such as the S/W, vulnerability, IP, and MAC address installed in the physical network asset is expressed. Vulnerability cases are represented using the Common Vulnerability Scoring System (CVSS) [48]. The data used include Persona, other data, and internal network information.
Visualization ⑤ shows the internal network as three layers of cyberspace, as shown in Figure 11, to understand the relationships between network assets in detail. It is possible to understand how the assets of each layer have interconnections, as well as their relationships with other layers. The relationships between layers are displayed as shown in Figure 12. The left interface can select whether to visualize the elements for each layer. The right interface shows the hardware (H/W) information, IP, G/W, owner, application, S/W used, vulnerabilities, etc. of the object selected in the central interface. This is the most important screen among the visualization screens of the framework proposed in this paper. Security personnel can immediately know which software is used and what vulnerabilities are in the H/W of the physical network layer in a specific building. Security personnel can also check who is using the H/W. This helps to figure out which H/W or S/W is the core.

4. CyCOP System Response Speed Test

The framework designed in Section 3 was implemented as shown in Figure 7, Figure 8, Figure 9, Figure 10 and Figure 11 in compliance with the UI, object symbol, and object size investigated in Section 2. However, because the response speed could not be confirmed with pictures, it was proven by experiments. The experiment tests the response speed of the implemented visualizations ① to ⑤. To measure the response speed, the developer tools provided in the Google Chrome browser were used.
Experimental items were extracted from the items in Table 6. Items with simple response times were excluded because these were difficult to measure in a web environment. However, the items corresponding to the complex response times were selected for an experiment on the detailed information inquiry and screen output of objects for which people are most sensitive to the response speed. Among these, File Update was excluded because it is a function that is not in the visualization implemented in this research. Accordingly, the finally selected test items are inquiry (simple) and inquiry (complex).
When any object in a visualization screen was clicked, a detailed description of the object was displayed in the interface on the right side of the screen. Inquiry (simple) measured the time from when an object was clicked on the visualization screen until the detailed description of the object appeared on the right interface. The object information was requested from the server, as shown in square 1 in Figure 13. As shown in square 2, the time (response time) until the object information was received on the CyCOP visualization screen (Client) was measured in the Network tab of the browser developer tool. Inquiry (complex) called a visualization screen using multiple external/internal data. To measure this, the time of the red box in Figure 14 was measured. This meant the time it took for all assets needed to output the visualization screen to be called. For objective evaluation, when measuring inquiry (simple) and inquiry (complex), after clearing the entire browser cache and calling 10 times, the average was derived as listed in Table 10. As a result of the experiment, inquiry (simple) showed a fast response speed of about 0.1 s for all visualizations. In the case of inquiry (complex), visualization ④ showed the fastest response time (0.63 s) and visualization ① showed the slowest response time (1.50 s). This was because visualization ④ had the fastest speed because the resource was not called for a large image. In the case of visualization ①, it showed the slowest speed because it was the first screen to call information about multiple packets and Google Map API.
What can be learned through this experiment is that only information that needs visualization should be retrieved and displayed. This is because if you call for a large amount of DB query information and APIs, the speed slows down. Slowing down means that rapid cyber situational awareness is impossible after all. The slower the cyber situational awareness, the more vulnerable it is to cyberattacks.

5. Conclusions

The purpose of this research was to design and implement a CyCOP framework for situational awareness in cyberspace. By analyzing the JCOPP and U.S.ATP 2-01.3 IPB documents prepared based on JP 3–12, the screens to be visualized in CyCOPs were identified. In addition, studies related to the interface (response time, UI, object symbol, object size) for designing and implementing CyCOPs were investigated. Based on the investigations, the CyCOP framework was designed and described for each visualization screen implemented. Finally, an experiment was conducted to measure the response time of 5 visualization screens to prove that the implemented CyCOP satisfies the inquiry (simple) and inquiry (complex) criteria. As a result, the response speed of the 5 visualization screens was about 0.11 s on average for inquiry (simple) and 1.07 s on average for inquiry (complex). This conforms to the common response times of inquiry (simple) and inquiry (complex) in Table 6.
This study presented the criteria (UI, object symbol, object size, response time) for rapid cyber situation awareness in a framework. If CyCOP is developed by applying these standards, the military will be able to have strong cyber command and control capabilities. In the private sector, it will be possible to identify and respond to various cyber-crimes that can occur in the currently operating service in real time. In future research, we will implement visualizations ⑥ to ⑩, which correspond to the 3rd and 4th stages of the U.S.ATP 2-01.3 IPB stage. Visualization ⑥ uses cyber asset information and ATT & CK’s APT Groups data. Visualization ⑦ utilizes cyber kill chain, ATT&CK’s Tactics, and CVE information to visualize network threats within the company. Visualization ⑧ predicts and visualizes the network activity time in areas where many attacks occur. Visualization ⑨ identifies which malware was used, which APT group it belongs to, and profiles cyberattacks. Visualization ⑩ establishes, selects, and prioritizes cyber threat countermeasures. Therefore, the final form of CyCOP will have the ability to actively respond to and prepare for cyber-attacks.

Author Contributions

Conceptualization, K.K. (Kookjin Kim), J.Y. and S.Y.; Funding acquisition, D.S.; Methodology, K.K. (Kookjin Kim), S.Y. and J.K.; Design of Cyber Common Operational Picture Framework, K.K. (Kookjin Kim) and K.K. (KyungShin Kim); Supervision, D.S.; Validation, J.K.; Writing—original draft, K.K. (Kookjin Kim) and K.K. (KyungShin Kim), Writing—review and editing, D.S. All authors have read and agreed to the published version of the manuscript.

Funding

This research was supported by the Future Challenge Defense Technology Research and Development Project (9129156) hosted by the Agency for Defense Development Institute in 2020.

Institutional Review Board Statement

Not applicable.

Informed Consent Statement

Not applicable.

Data Availability Statement

Not applicable.

Conflicts of Interest

The authors declare no conflict of interest.

Abbreviations

The following abbreviations are used in this manuscript:
CyCOPCyber Common Operational Picture
APPApplication
OSOperational System
JOPPJoint Operational Planning Process
JPJoint Publication
JCOPPCyberspace Operational Planning Process
JTCJoint Targeting Cycle
COPCommon Operational Picture
C2Command and Control
ATPArmy Techniques Publication
UIUser Interface
OSINTOpen-Source Intelligence
BGPBorder Gateway Protocol
GeoGeographic
ASAutonomous Systems
S/WSoftware
H/WHardware
CVSSCommon Vulnerability Scoring System

References

  1. Adlakha, R.; Sharma, S.; Rawat, A.; Sharma, K. Cyber Security Goal’s, Issue’s, Categorization & Data Breaches. In Proceedings of the 2019 international conference on machine learning, big data, cloud and parallel computing (COMITCon), Faridabad, India, 14–16 February 2019; pp. 397–402. [Google Scholar]
  2. Cabaj, K.; Kotulski, Z.; Księżopolski, B.; Mazurczyk, W. Cybersecurity: Trends, issues, and challenges. EURASIP J. Inf. Secur. 2018, 2018, 10. [Google Scholar] [CrossRef]
  3. Stephen, D. Quadrennial Defense Review Report; Department of Defense: Virginia, USA, 2010. [Google Scholar]
  4. Scott, K.D. Joint Publication (JP) 3-12 Cyberspace Operation; The Joint Staff: Washington, DC, USA, 2018. [Google Scholar]
  5. Zaporozhets, O.; Syvak, O. In the Line of Russian Aggression: Ukraine, hybrid warfare, and cybersecurity defense. In Routledge Companion to Global Cyber-Security Strategy; Routledge: Oxfordshire, Oxfordshire, UK, 2021; pp. 185–190. [Google Scholar]
  6. Husák, M.; Laštovička, M.; Plesník, T. Handling Internet Activism during the Russian Invasion of Ukraine: A Campus Network Perspective. Digit. Threat. Res. Pract. 2022, 3, 1–5. [Google Scholar] [CrossRef]
  7. Cyber Attack Trends in the Midst of Warfare—The Numbers behind the First Days of the Conflict. Available online: https://blog.checkpoint.com/2022/02/27/196-increase-in-cyber-attacks-on-ukraines-government-and-military-sector/ (accessed on 16 January 2023).
  8. Patrick, D.G. NIST Special Publication 800-30 Guide for Conducting Risk Assessments; National Institute of Standards and Technology U.S. Department of Commerce: Washington, DC, USA, 2012. [Google Scholar]
  9. Hersey, N.S. FM 3-12 Cyberspace and Electromagnetic Warfare; Department of the Army: Washington, DC, USA, 2021. [Google Scholar]
  10. Ducheine, P.; Van Haaster, J. Fighting power, targeting and cyber operations. In Proceedings of the 2014 6th International Conference on Cyber Conflict (CyCon 2014), Tallinn, Estonia, 3–6 June 2014; pp. 303–327. [Google Scholar]
  11. Poteete, P.W. Implementing the DoD Joint Operation Planning Process for Private Industry Enterprise Security; Naval Postgraduate School Monterey Ca Dept of Information Sciences: Monterey, CA, USA, 2011. [Google Scholar]
  12. Scaparrotti, C.M. Joint Publication 3-60 Joint Targeting; Joint Chiefs of Staff: Washington, DC, USA, 2013. [Google Scholar]
  13. Munir, A.; Aved, A.; Blasch, E. Situational Awareness: Techniques, Challenges, and Prospects. AI 2022, 3, 55–77. [Google Scholar] [CrossRef]
  14. Endsley, M.R. Toward a theory of situation awareness in dynamic systems. In Situational Awareness; Routledge: Oxfordshire, Oxfordshire, UK, 2017; pp. 9–42. [Google Scholar]
  15. Endsley, M.R. Design and evaluation for situation awareness enhancement. In Proceedings of the Human Factors Society Annual Meeting, Washington, DC, USA, 1 October 1988; pp. 97–101. [Google Scholar]
  16. Barford, P.; Dacier, M.; Dietterich, T.G.; Fredrikson, M.; Giffin, J.; Jajodia, S.; Jha, S.; Li, J.; Liu, P.; Ning, P. Cyber SA: Situational awareness for cyber defense. In Cyber Situational Awareness; Springer: Berlin/Heidelberg, Germany, 2010; pp. 3–13. [Google Scholar]
  17. Franke, U.; Brynielsson, J. Cyber situational awareness—A systematic review of the literature. Comput. Secur. 2014, 46, 18–31. [Google Scholar] [CrossRef]
  18. Jacq, O.; Brosset, D.; Kermarrec, Y.; Simonin, J. Cyber attacks real time detection: Towards a cyber situational awareness for naval systems. In Proceedings of the 2019 International Conference on Cyber Situational Awareness, Data Analytics and Assessment (Cyber SA), Oxford, UK, 3–4 June 2019; pp. 1–2. [Google Scholar]
  19. Mittu, R.; Segaria, F. Common Operational Picture (cop) and Common Tactical Picture (ctp) Management via a Consistent Networked Information Stream (cnis); Naval Research Lab.: Washington, DC, USA, 2000. [Google Scholar]
  20. Keuhlen, D.T.; Bryant, O.L.; Young, K.K. The Common Operational Picture in Joint Vision 2020: A Less Layered Cake; National Defense Univ Norfolk va Joint and Combined Warfighting School: Norfolk, Virginia, 2002. [Google Scholar]
  21. Baar, D.D.; Shoemaker, G. Pliable Display Technology for the Common Operational Picture; IDELIX Software Inc.: Vancouver, BC, Canada, 2004. [Google Scholar]
  22. Copeland, J. Emergency Response: Unity of Effort through a Common Operational Picture; Army War College: Carlisle, PA, USA, 2008. [Google Scholar]
  23. Wreski, E.E.; Lavoie, E.A. A Concept of Operations for an Unclassified Common Operational Picture in Support of Maritime Domain Awareness; Naval Postgraduate School: Monterey, CA, USA, 2017. [Google Scholar]
  24. Esteve, M.; Pérez, I.; Palau, C.; Carvajal, F.; Hingant, J.; Fresneda, M.A.; Sierra, J.P. Cyber Common Operational Picture: A Tool for Cyber Hybrid Situational Awareness Improvement; Technical Report STO-MP-IST-148; North Atlantic Treaty Organization (NATO) Science and Technology Organization (STO): Brussels, Belgium, 2016. [Google Scholar]
  25. Pahi, T.; Leitner, M.; Skopik, F. Preparation, modelling, and visualisation of cyber common operating pictures for national cyber security centres. J. Inf. Warf. 2017, 16, 26–40. [Google Scholar]
  26. Noel, S.; Purdy, S.; O’Rourke, A.; Overly, E.; Chen, B.; DiFonzo, C.; Chen, J.; Sakellis, G.; Hegde, M.; Sapra, M. Graph analytics and visualization for cyber situational understanding. J. Def. Model. Simul. 2021, 20. [Google Scholar] [CrossRef]
  27. Gutzwiller, R.S.; Hunt, S.M.; Lange, D.S. A task analysis toward characterizing cyber-cognitive situation awareness (CCSA) in cyber defense analysts. In Proceedings of the 2016 IEEE International Multi-Disciplinary Conference on Cognitive Methods in Situation Awareness and Decision Support (CogSIMA), San Diego, CA, USA, 21–25 March 2016; pp. 14–20. [Google Scholar]
  28. Jajodia, S.; Noel, S.; Kalapa, P.; Albanese, M.; Williams, J. Cauldron mission-centric cyber situational awareness with defense in depth. In Proceedings of the 2011-MILCOM 2011 Military Communications Conference, Baltimore, MD, USA, 7–10 November 2011; pp. 1339–1344. [Google Scholar]
  29. Jenkins, M.; Catto, M.G.; Bird, M. Increased Space Situational Awareness through Augmented Reality Enhanced Common Operating Pictures. In Proceedings of the Advanced Maui Optical and Space Surveillance Technologies Conference, Maui, HI, USA, 1–14 September 2018; pp. 11–14. [Google Scholar]
  30. Llopis, S.; Hingant, J.; Pérez, I.; Esteve, M.; Carvajal, F.; Mees, W.; Debatty, T. A comparative analysis of visualisation techniques to achieve cyber situational awareness in the military. In Proceedings of the 2018 International Conference on Military Communications and Information Systems (ICMCIS), Warsaw, Poland, 22–23 May 2018; pp. 1–7. [Google Scholar]
  31. Jiang, L.; Jayatilaka, A.; Nasim, M.; Grobler, M.; Zahedi, M.; Babar, M.A. Systematic Literature Review on Cyber Situational Awareness Visualizations. IEEE Access 2022, 10, 57525–57554. [Google Scholar] [CrossRef]
  32. Doucette, H. Identifying Requirements for a Cyber Common Operating Picture (CyCOP): Information Collection; Defence Research and Development Canada: Ottawa, Canada, 2020. [Google Scholar]
  33. Dillabaugh, C.; Bennett, D. CyberCOP: Cyber Situational Awareness Demonstration Tool; Defence Research and Development Canada: Ottawa, Canada, 2020. [Google Scholar]
  34. Beaudoin, L.; Grégoire, M.; Lagadec, P.; Lefebvre, J.; Luiijf, E.; Tolle, J. Coalition Network Defence Common Operational Picture; Fraunhofer Society Wachtberg (Germany) Fraunhofer Inst for Communication Information Processing and Ergonomics: Bonn, Germany, 2010. [Google Scholar]
  35. Headquarters, Army Techniques Publication (ATP) 2-01.3, Intelligence Preparation of the Battlefield; Department of the Army: Washington, DC, USA, 2021.
  36. Department of Defense, United States of America, Military-Standard (MIL-STD)-1472H, DESIGN CRITERIA STANDARD, HUMAN ENGINEERING; Department of Defense: Washington, DC, USA, 2019.
  37. Kim, H.; Song, H.; Park, S. Proper response times and design factors influencing user satisfaction with diverse touch tap operations for the smartphone. Arch. Des. Res. 2014, 27, 95–105. [Google Scholar] [CrossRef]
  38. Shneiderman, B. Response time and display rate in human performance with computers. ACM Comput. Surv. (CSUR) 1984, 16, 265–285. [Google Scholar] [CrossRef]
  39. McCroskey, E.D.; Mock, C.A. Operational graphics for cyberspace. Jt. Force Q. (JFQ) 2017, 85, 42–49. [Google Scholar]
  40. Department of Defense, United States of America, Military-Standard (MIL-STD)-2525D, Interface Standard, Joint Military Symbology; Department of Defense: Washington, DC, USA, 2008.
  41. University of Oregon Route Views Archive Project. Available online: http://archive.routeviews.org/ (accessed on 16 January 2023).
  42. Butler, H.; Daly, M.; Doyle, A.; Gillies, S.; Hagen, S.; Schaub, T. The Geojson Format. Available online: http://www.hjp.at/doc/rfc/rfc7946.html (accessed on 10 February 2023).
  43. Maxmind. Available online: https://www.maxmind.com/en/home (accessed on 16 January 2023).
  44. Caida. Available online: https://www.caida.org/ (accessed on 16 January 2023).
  45. SecurityTrails. Available online: https://securitytrails.com/ (accessed on 16 January 2023).
  46. ip-api. Available online: https://ip-api.com/ (accessed on 16 January 2023).
  47. WhoisXMLAPI. Available online: https://www.whoisxmlapi.com/ (accessed on 16 January 2023).
  48. Scarfone, K.; Mell, P. An analysis of CVSS version 2 vulnerability scoring. In Proceedings of the 2009 3rd International Symposium on Empirical Software Engineering and Measurement, Lake Buena Vista, FL, USA, 15–16 October 2009; pp. 516–525. [Google Scholar]
Figure 1. Joint Cyberspace Operational Planning Process based on Joint Publication 3–12.
Applsci 13 02331 g001
Figure 2. Cyberspace Symbol Components.
Applsci 13 02331 g002
Figure 3. CyCOP UI Structure.
Applsci 13 02331 g003
Figure 4. Minimum Viewing Angle according to Line of Sight.
Applsci 13 02331 g004
Figure 5. CyCOP Framework Structure.
Applsci 13 02331 g005
Figure 6. CyCOP Visualization Screens and Part of the Data used in each Visualization.
Applsci 13 02331 g006
Figure 7. Visualization ①: Visualization of Internet Network Activity in the Area of Interest.
Applsci 13 02331 g007
Figure 8. Visualization ②: Satellite View-based Geographic Visualization.
Applsci 13 02331 g008
Figure 9. Visualization ③: Visualization of Physical Network Device Location and Information within the Facility.
Applsci 13 02331 g009
Figure 10. Visualization ④: Visualization of Internal Network of Facilities.
Applsci 13 02331 g010
Figure 11. Visualization ⑤: Visualize the Three Layers of Cyberspace.
Applsci 13 02331 g011
Figure 12. Diagram of Object Relationships between Network Layers.
Applsci 13 02331 g012
Figure 13. Measuring Inquiry (simple) Response Time in Browser Developer Tools Network Tab.
Applsci 13 02331 g013
Figure 14. Measuring Inquiry (complex) Response Time in Browser Developer Tools Network Tab.
Applsci 13 02331 g014
Table 1. Identification Items for each Layer in Cyberspace.
Cyberspace LayerIdentification Item
Physical Network LayerCyber C2 system, cyber network bridgehead node, network device (PC, server, router, etc.), Internal/External network contact node, IDS/IPS, etc.
Logical Network LayerWebsite, vulnerability, resource URL path, messenger, repository address, S/W (Software), OS, One Time Password APP, etc.
Persona Network LayerAdvanced Persistent Threats (APT) groups, documents, photos, videos, private keys, public keys, passwords, etc.
Table 2. Visualization Implementation Status in CyCOP Studies.
StudyImplemented Visualization Number
Esteve et al. [24]
Pahi et al. [25]Only visualization concept/methodology is presented
Noel et al. [26]②, ④
Gutzwiller et al. [27]Only visualization concept/methodology is presented
Jajodia et al. [28]
Jenkins et al. [29]②, ④
Llopis et al. [30]②, ③, ④
Jiang et al. [31]There are only reviews of several visualization studies
Doucette [32]Only visualization concept/methodology is presented
Dillabaugh et al. [33]②, ④
Beaudoin et al. [34]Only visualization concept/methodology is presented
Table 3. Acceptable System Response Times.
System InterpretationResponse Time DefinitionTime (s)
Key response, including scroll wheels, optical wheels, mouse clicksKey pressed until positive response (e.g., “click”)0.1
Key printKey pressed until the appearance of the character0.2
Page turnEnd of the request until the first few lines are visible1.0
Page scanEnd of the request until text begins to scroll0.5
XY entryFrom the selection of field until visual verification0.2
PointingFrom the input of point to display point0.2
SketchingFrom the input of point to display of line0.2
Local updateChange to image using the local database (e.g., new menu list from display buffer)0.5
Host updateChange where data is at the host in a readily accessible form (e.g., a scale change of existing image)2.0
File updateImage update requires access to a host file10
Inquiry (simple)From command until the display of a commonly used message2.0
Inquiry (complex)Response message requires seldom used calculations in graphic form10
Error feedbackFrom the entry of input until an error message appears0.2
Table 4. Acceptable System Response Times on Smartphone.
Type of TaskAppropriate Response Time (s)
Switch/button pressed indication0.1
Display text after typing on the keyboard0.1–0.2
Display touched text0.2
Initial response to system access1–3
Function execution
Simple function2
Complex function5
When loading occurs during function execution15–60
Input confirmation, input error notification2–4
Table 5. User Preferred System Response Times.
Type of TaskAppropriate Response Time (s)
Typing, moving the cursor, clicking the mouse0.05–0.15
Simple and frequently used function1
Common function2–4
Complex function8–12
Input confirmation, input error notification2–4
Table 6. User-Acceptable System Response Times Suggested by Relevant Studies.
Simple/Complex Response TimeBehaviorMIL-STD-1472H [37]Kim et al. [38]Shneiderman [39]Common
Simple Response TimeKey response, including scroll wheels, optical wheels, mouse clicks0.10.10.05–0.150.1
Key print0.20.1–0.20.05–0.150.2
XY entry, Pointing0.2
Sketching0.22–4
Error feedback0.2 2
Page scan0.5
Local update0.5
Page move1.0
Host update2.0
Inquiry (simple)2.02.02–42.0
Complex Response TimeInquiry (complex)105.08–1210
File update10
Table 7. Parts of Cyberspace Icons.
DescriptionIcon
    ROUTER
    Type: Entity Type
    Entity: DEVICE TYPE
    Symbol Set Code: 60
    Code: 140200
Applsci 13 02331 i001
    FIREWALL
    Type: Entity Type
    Entity: DEVICE TYPE
    Symbol Set Code: 60
    Code: 140900
Applsci 13 02331 i002
    …
Table 8. Distance based on Wall Screen Size.
FactorOptimumPreferred LimitsAcceptable Limits
Ratio of viewing distance to screen diagonal4.03.0 to 6.02.0 to 10
Angle off centerline0 to 20°0 to 30°
Image luminance (no film in the operating projector)35 cd/m2
1/
27 to 48 cd/m2
1/
17 to 70 cd/m2
1/
Luminance variation across the screen (ratio of maximum to minimum luminance)1.01.53.0
Luminance variation as a function of viewing location (ratio of maximum to minimum luminance)1.02.04.0
The ratio of ambient light to the brightest part of the image00.002 to 0.010.1 maximum 2/
5.17.18.6 Symbol size and image quality for complex shapes. The size of a symbol or graphic shall be such that all text or graphics embedded within the symbol (e.g., label within symbol) shall subtend not less than 2.9 milliradians (10 min) of visual angle from the greatest anticipated viewing distance.
Table 9. CyCOP Implementation Environment Hardware and Software.
ItemsDescriptions
OSWindows 10 Pro
ProcessorAMD Ryzen 7 3700X 8-Core Processor 3.59 GHz
Memory64 GB
Development languages, software and toolsPython 3.9, django 4.1, deck.gl 8.4, Unity 2022.1.13., bootstrap 5.2.0, oracle 21c, Google Maps Platform
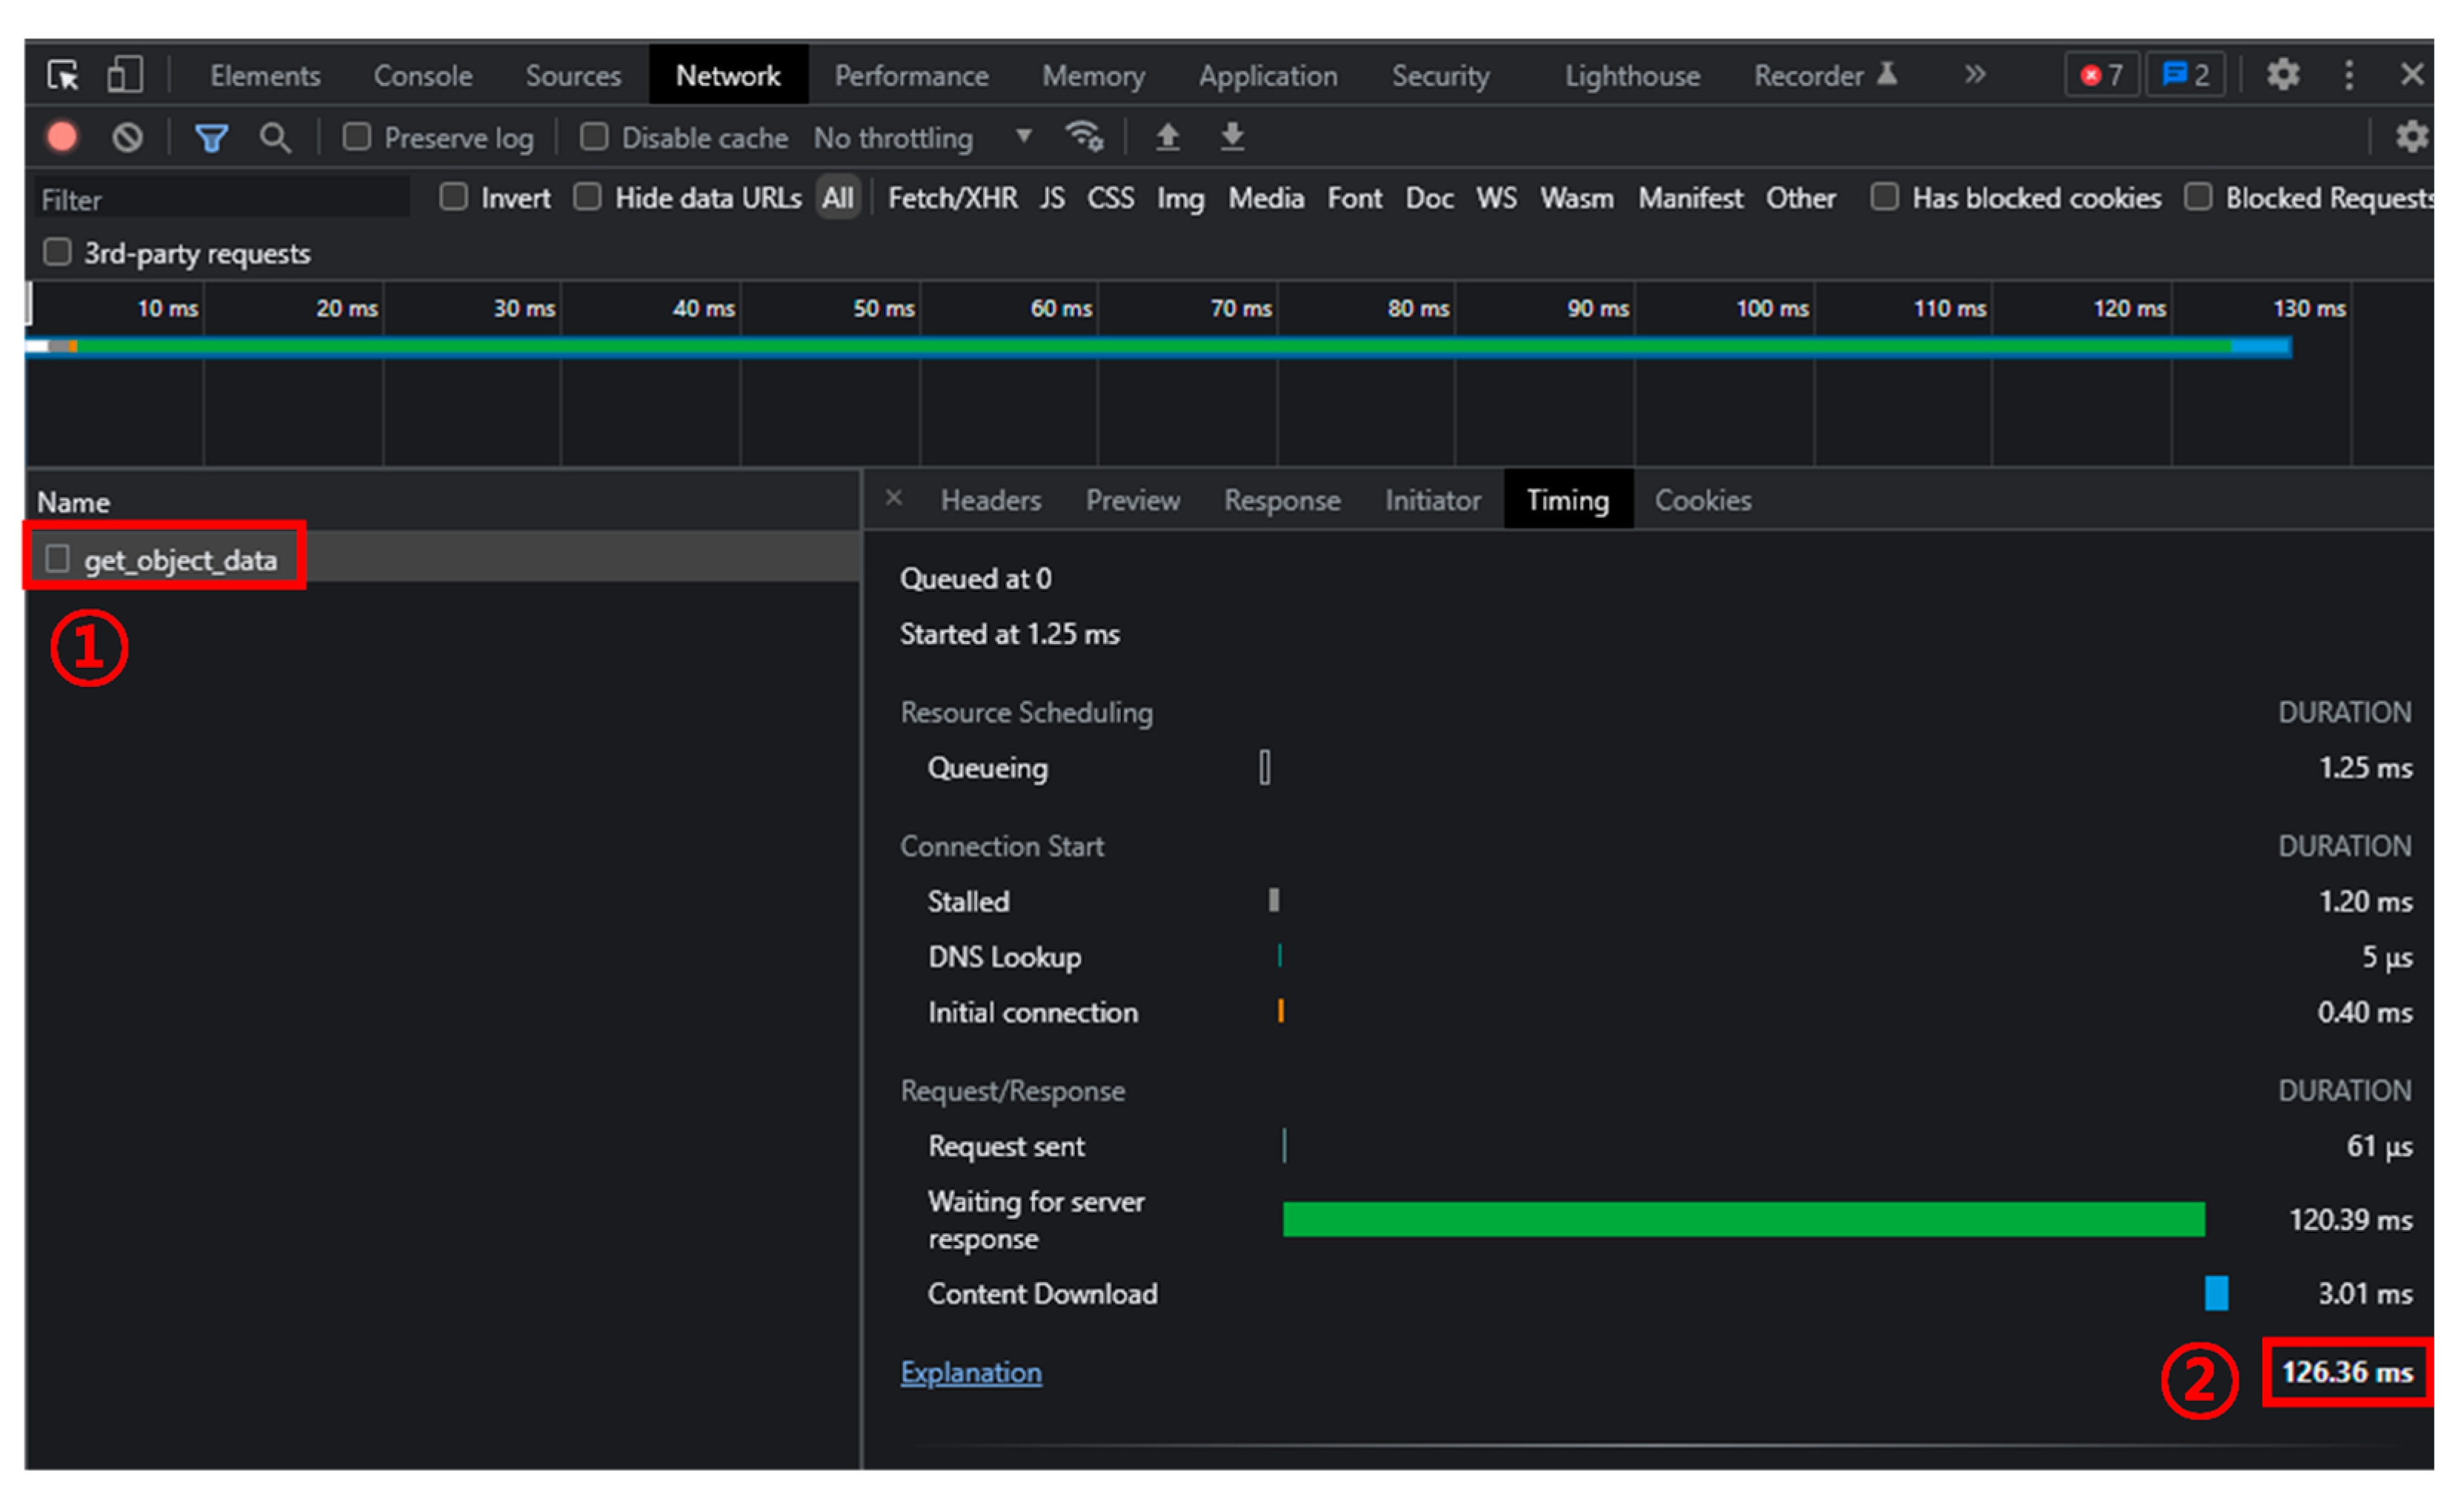
Table 10. Response Time for each CyCOP Visualization.
Behavior
Inquiry (simple)0.120.110.110.100.14
Inquiry (complex)1.500.940.920.631.38
Disclaimer/Publisher’s Note: The statements, opinions and data contained in all publications are solely those of the individual author(s) and contributor(s) and not of MDPI and/or the editor(s). MDPI and/or the editor(s) disclaim responsibility for any injury to people or property resulting from any ideas, methods, instructions or products referred to in the content.

