1. Introduction
Unlike plants, animals can move in a short time, which is a distinctive and defining characteristic of animals. Animal movements are controlled by the brain or nerve cells; however, genes, chemicals, the environment, and aging also affect movement. For example, short- and long-lived
Caenorhabditis elegans mutant strains carrying mutant
daf-2,
daf-16,
age-1,
tax-4, or
lite-1 genes displayed different locomotor activities during aging [
1]. Chemical pollutants affect individuals’ anxiety, risk perception, hyperactivity, lower activity, and cognition, resulting in changes in movement and social behavior, such as social networks, response times to group action, group cohesion, polarization, and social competence [
2]. Chemicals, such as picrotoxin and nicotine, in response to light, changed the movement of zebrafish (
Danio rerio) and also altered their shoaling behavior [
3]. In a study on the effect of 20 different nanoparticles on the phenotype of
C. elegans, the average movement speed of animals varied according to the type of nanoparticle [
4].
Small animals, such as zebrafish,
C. elegans, and
Daphnia can be tested in a small space, making them suitable for high-throughput studies [
5,
6,
7]. Multiwell plates make it easy to track changes in the movement of individual animals per well. Because it is difficult for humans to manually quantify the movements of individual animals over time, it is necessary to use image analysis software to analyze the images captured during the experiment. For example, more than 6500 fish have been recorded using multiwell plates to detect hearing defects in zebrafish [
8]. The image analysis software automatically detected animals that did not respond to tone bursts by generating differential binary images from images before and after tone bursts. In another study, videos were taken after exposure of zebrafish in multiwell plates to each of 5648 compounds of psychoactive drugs. The videos were then analyzed to extract behavioral parameters, such as rest latency, rest bouts, and waking activity from locomotor activity over time. Hierarchical clustering of compounds using multiple parameter values revealed previously unknown psychoactive drugs and their action mechanisms [
9].
To perform such studies, it is essential to develop an easy and reliable automatic image analysis software. Various software have been proven to be useful in animal tracking [
10,
11,
12,
13,
14,
15,
16,
17,
18,
19]. For example, EthoVision [
13] (Noldus Information Technology, Wageningen, The Netherlands) can analyze the movement of various animals using a dedicated imaging system. To detect an animal, the raw image is gray-scaled and then binarized, or the area with change is tracked from a subtracted image obtained from two images. Additionally, an animal with a specific color can be tracked from a hue saturation-intensity (HSI) color channel image. idTracker, which was developed using MATLAB (The MathWorks Inc., Natick, MA, USA), was able to obtain the correct trajectories of each animal with a high accuracy of 99.7%, even when animals crossed each other, using fingerprints of individual animals extracted from images [
14]. The Lifespan Machine analyzes timelapse images taken regularly on a flatbed scanner [
15]. The software calculates a motion score based on the change in posture of an animal, determines the animal’s point of death, and then measures its lifespan. Janelia Automatic Animal Behavior Annotator (JAABA) can annotate various behaviors of animals using a classifier trained through machine learning using video and trajectory information of the animal [
16]. wrMTrck [
17] and AnimalTracker [
18] are ImageJ-based animal tracking software that can analyze the travel length, average speed, trajectory, and other parameters. Tracktor is another locomotion analysis software that uses the OpenCV library [
19]. Although it does not provide a graphical user interface (GUI), it is possible to identify individual animals using k-means clustering and the Hungarian algorithm when animals cross each other.
AniWellTracker, a software developed in this study, is an image analysis software optimized for analyzing individual animal movements using multiwell plates. It sequentially analyzes time-lapse images (extracted from a video) taken at regular time intervals. It binarizes the original image using a local adaptive thresholding algorithm [
20] and identifies the potential animal objects through region extraction. After excluding invalid objects based on their size, only the valid animal objects are identified, and their centroid coordinates are computed. Then, it calculates the locomotion parameters, such as the average speed related to movement. In addition, AniWellTracker has a chart function for visualizing the analysis results; therefore, users can easily check various analysis results without using other software. AniWellTracker provides a GUI, which beginners can use easily, and it offers a tool to test image processing settings to obtain optimal image analysis results. All outputs are saved in a comma-separated text file (CSV) format; thus, it is easy to further analyze the data using other software. This software is a free research software that can be run stand-alone without using dependent software or libraries, such as MATLAB (Mathworks Inc.), ImageJ [
21], LabVIEW (National Instruments), and OpenCV (
https://opencv.org/, accessed on 23 December 2022). Therefore, it is expected to be of significant help to researchers.
2. Software Description
AniWellTracker was developed using Microsoft Visual Basic .NET (VB.NET). It can be run on a PC with a Windows operating system with .NET Framework 4.5.1 or higher versions installed.
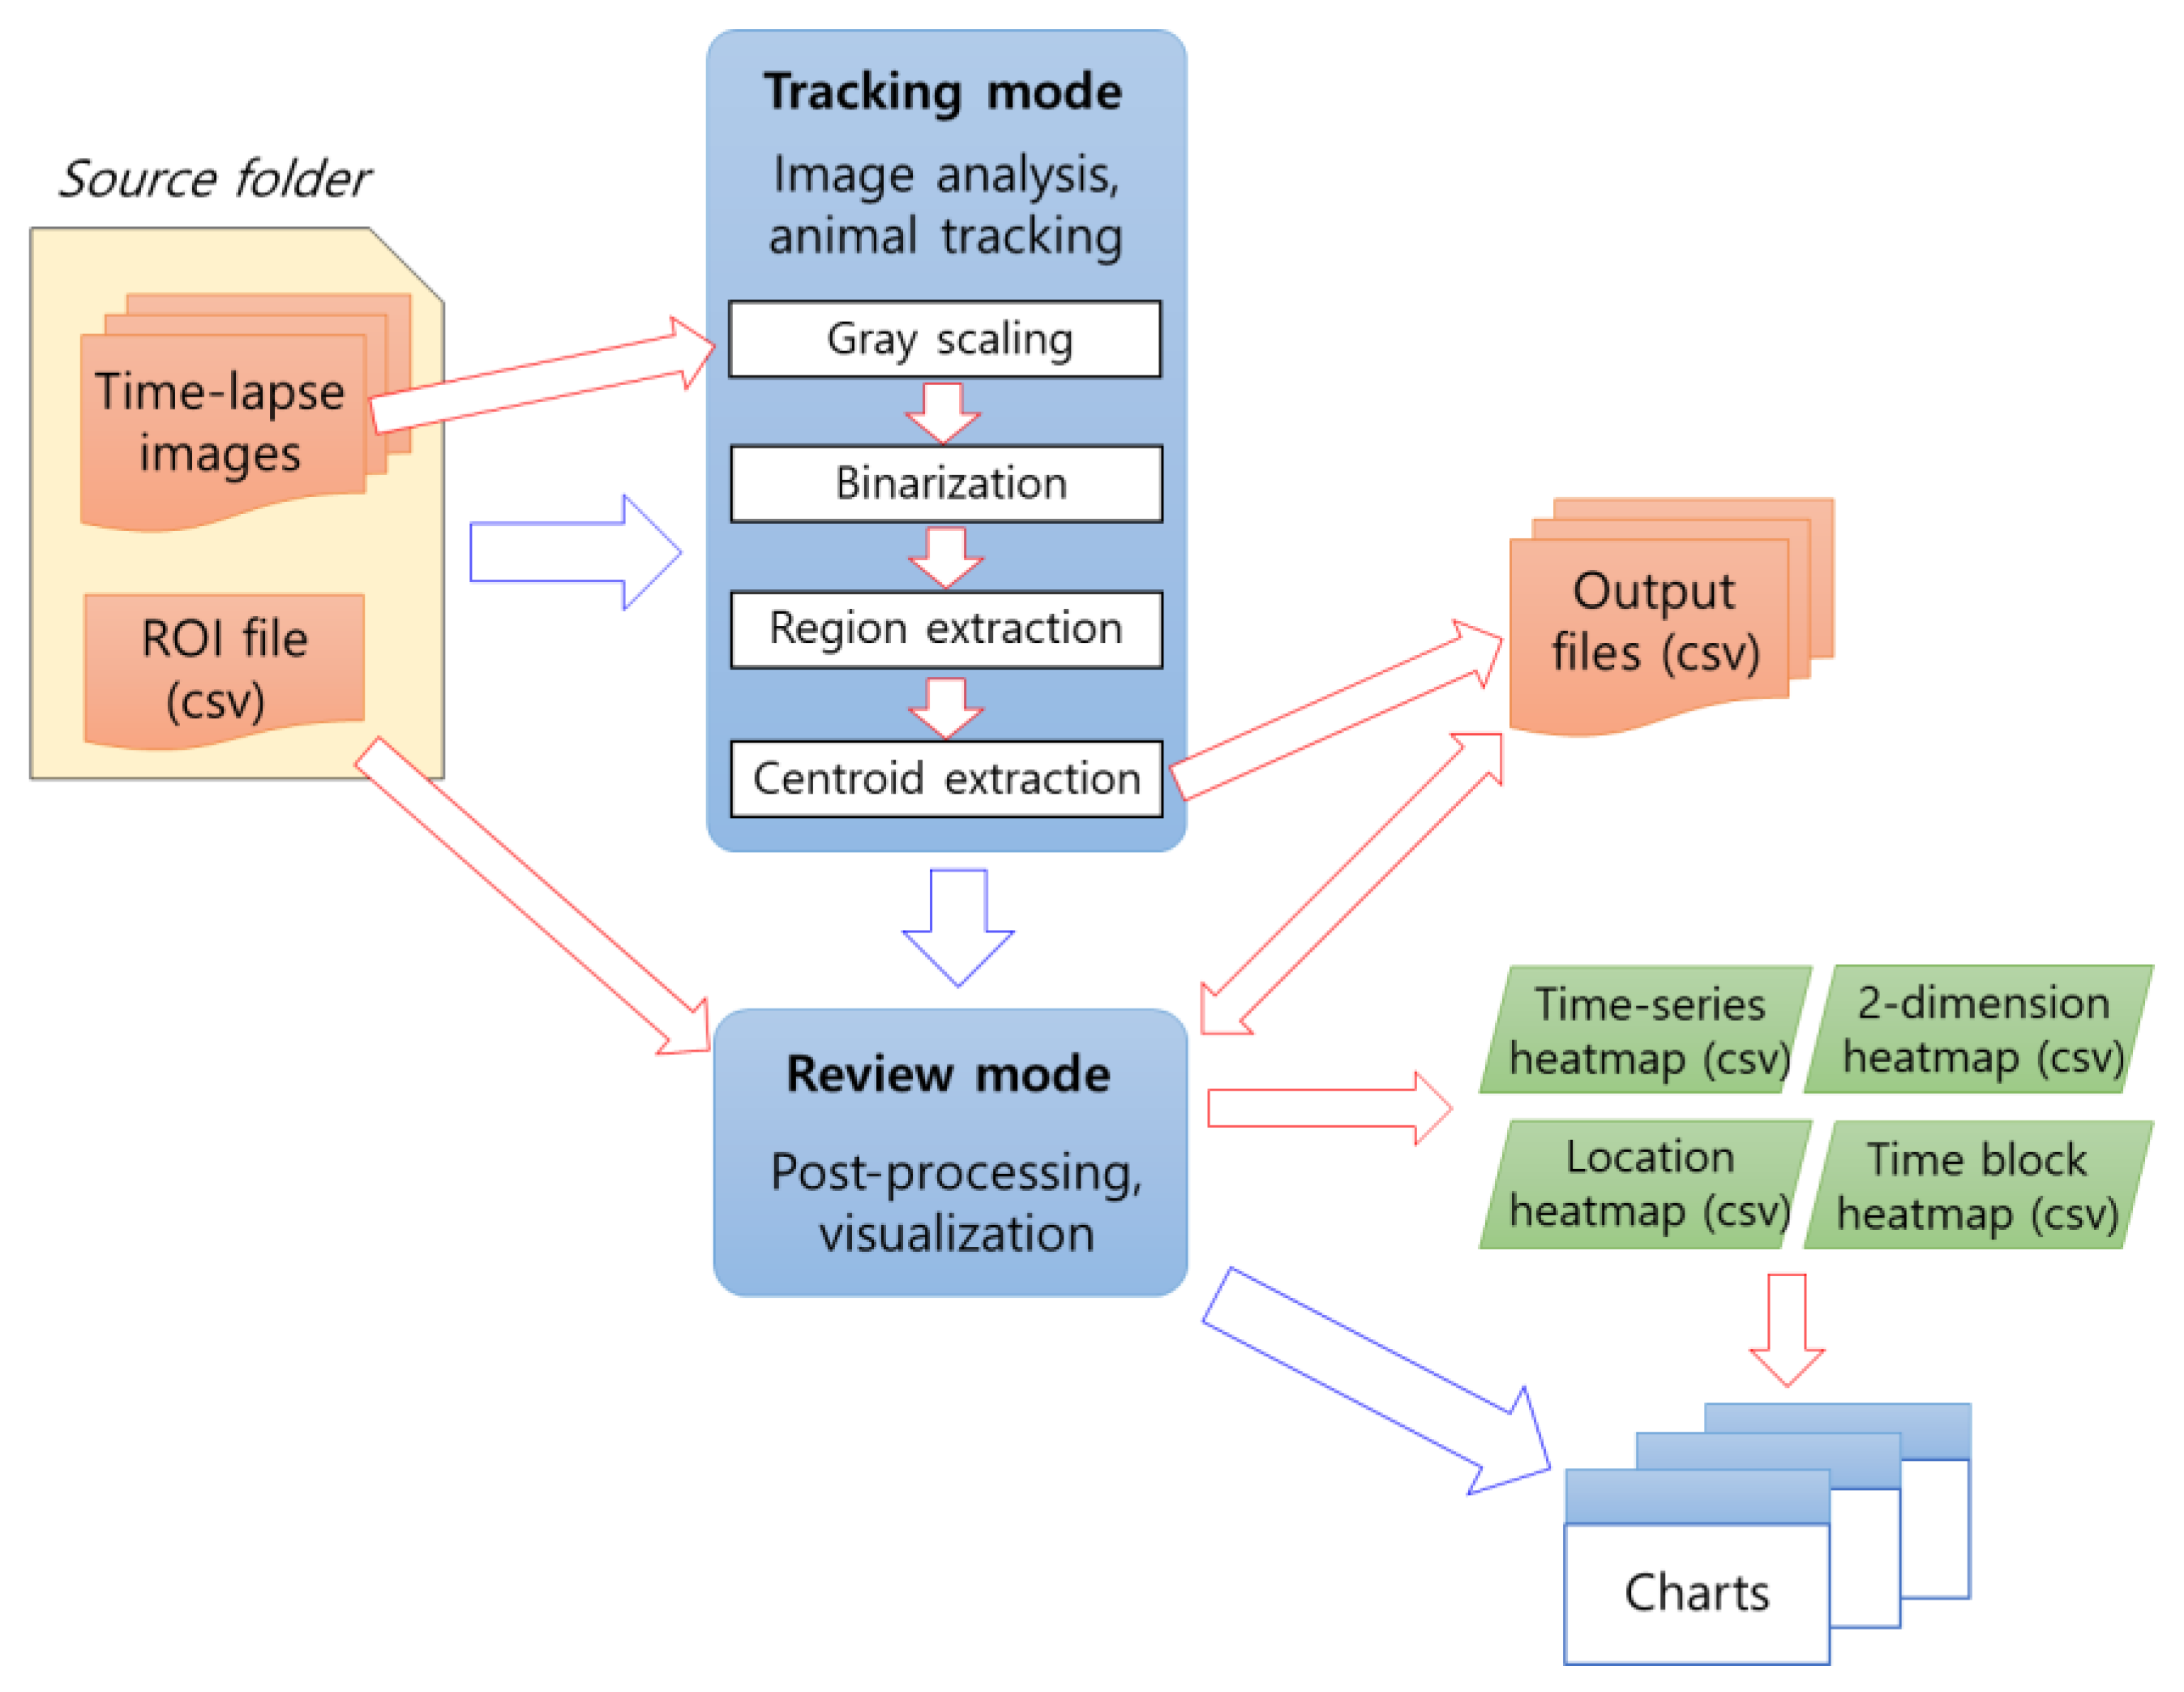
To use AniWellTracker, it is necessary to first create time-lapse images and a region-of-interest (ROI) file containing information on the wells to be analyzed (
Figure 1). Users can easily generate ROI files and record images/videos using the free PhenoCapture program (
www.phenocapture.com, accessed on 23 December 2022) developed by the author. If a video is used for analysis, time-lapse images can be automatically generated from the video file using MATLAB (visit the website mentioned above). For detailed instructions, please refer to the manual file. This software has two operating modes for users: tracking and reviewing. The first is a tracking mode that processes images to track animals and generates result files, and the second is a post-processing mode that reanalyzes the data and visualizes various results as a chart (
Figure 1).
2.1. Software Interface
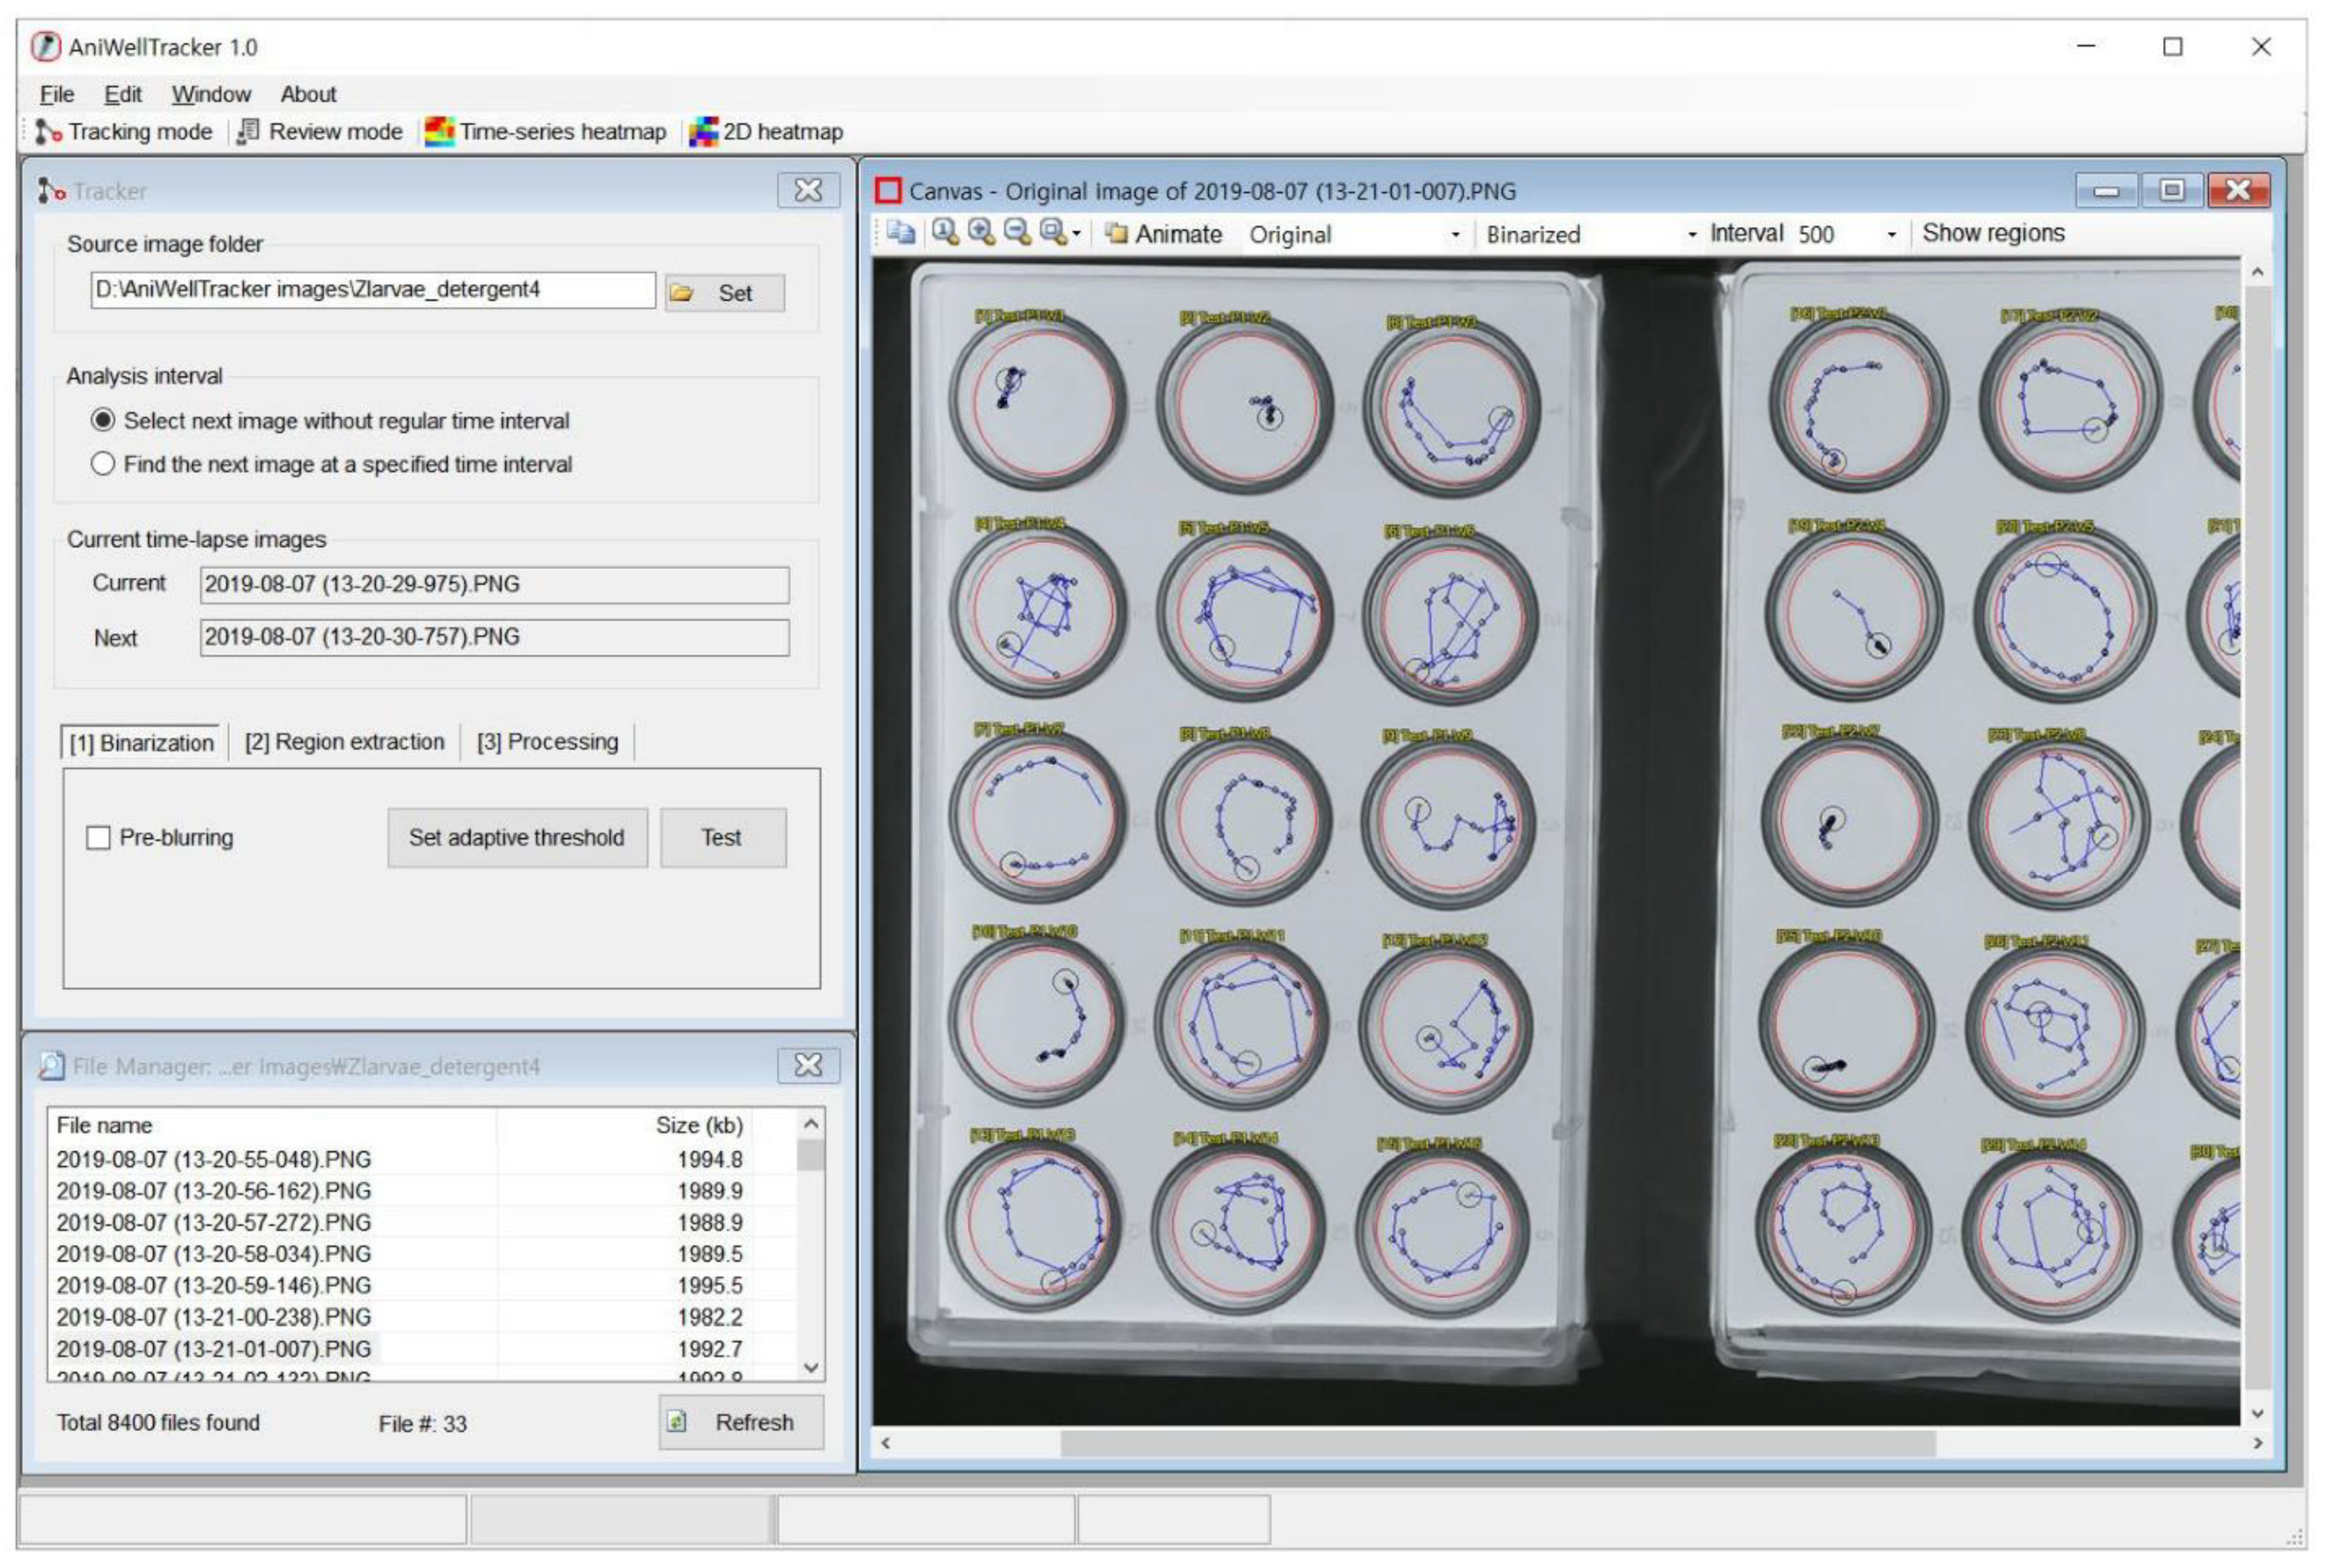
A screenshot of AniWellTracker interface is shown in
Figure 2. The software provides toolbar buttons that can be selected by clicking on the tracking or review mode, as well as buttons to turn on the built-in chart visualization window.
The canvas window shows the source image or the analyzed result, and the ROI area is marked with a red circle or rectangle. Users can enlarge or reduce the image by pressing the magnifying glass icons, and by pressing the Animate button, the source image and the image processing result can be displayed alternately. The file manager window shows a list of the image files in the folder to be analyzed. When users select an image file, the image is immediately displayed on the canvas window.
In the tracking mode, the tracker window that can analyze images continuously is shown (
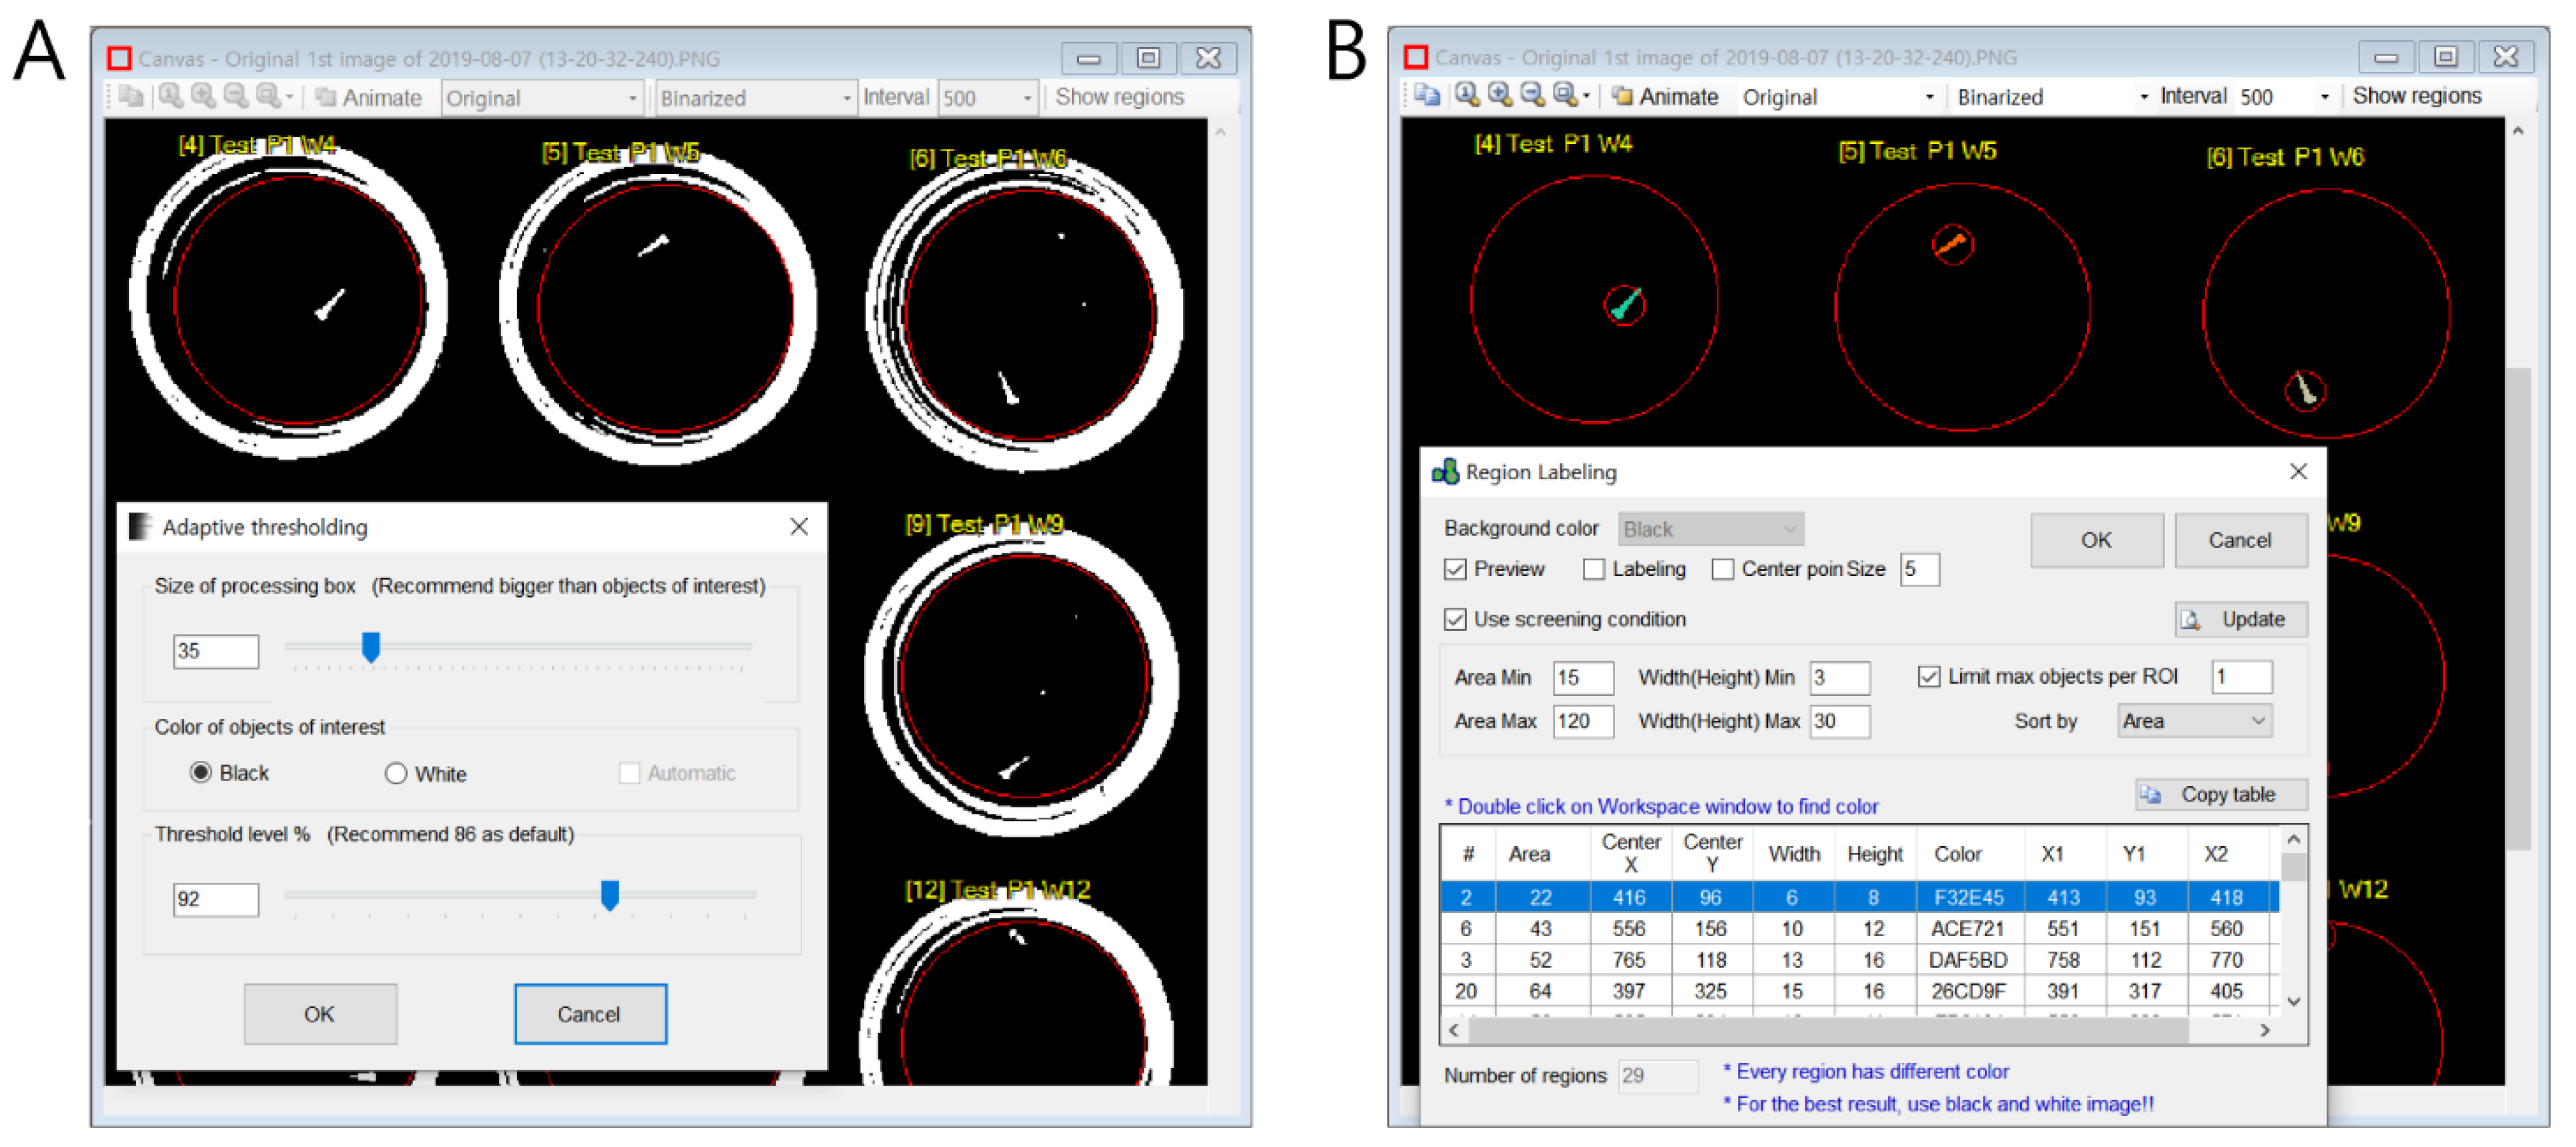
Figure 2). Image analysis is performed sequentially in three steps: “(1) Binarization”, “(2) Region extraction”, and “(3) Processing”. In “(1) Binarization”, a color image is converted into a black and white image (binary image), and in “(2) Region extraction”, white blobs (i.e., potentially animals) are detected from the binary image, and centroid coordinates and animal area is calculated. Users can easily test multiple parameters to obtain the best results (
Figure 3). In “(3) Processing”, analysis is performed on all image files in the source folder.
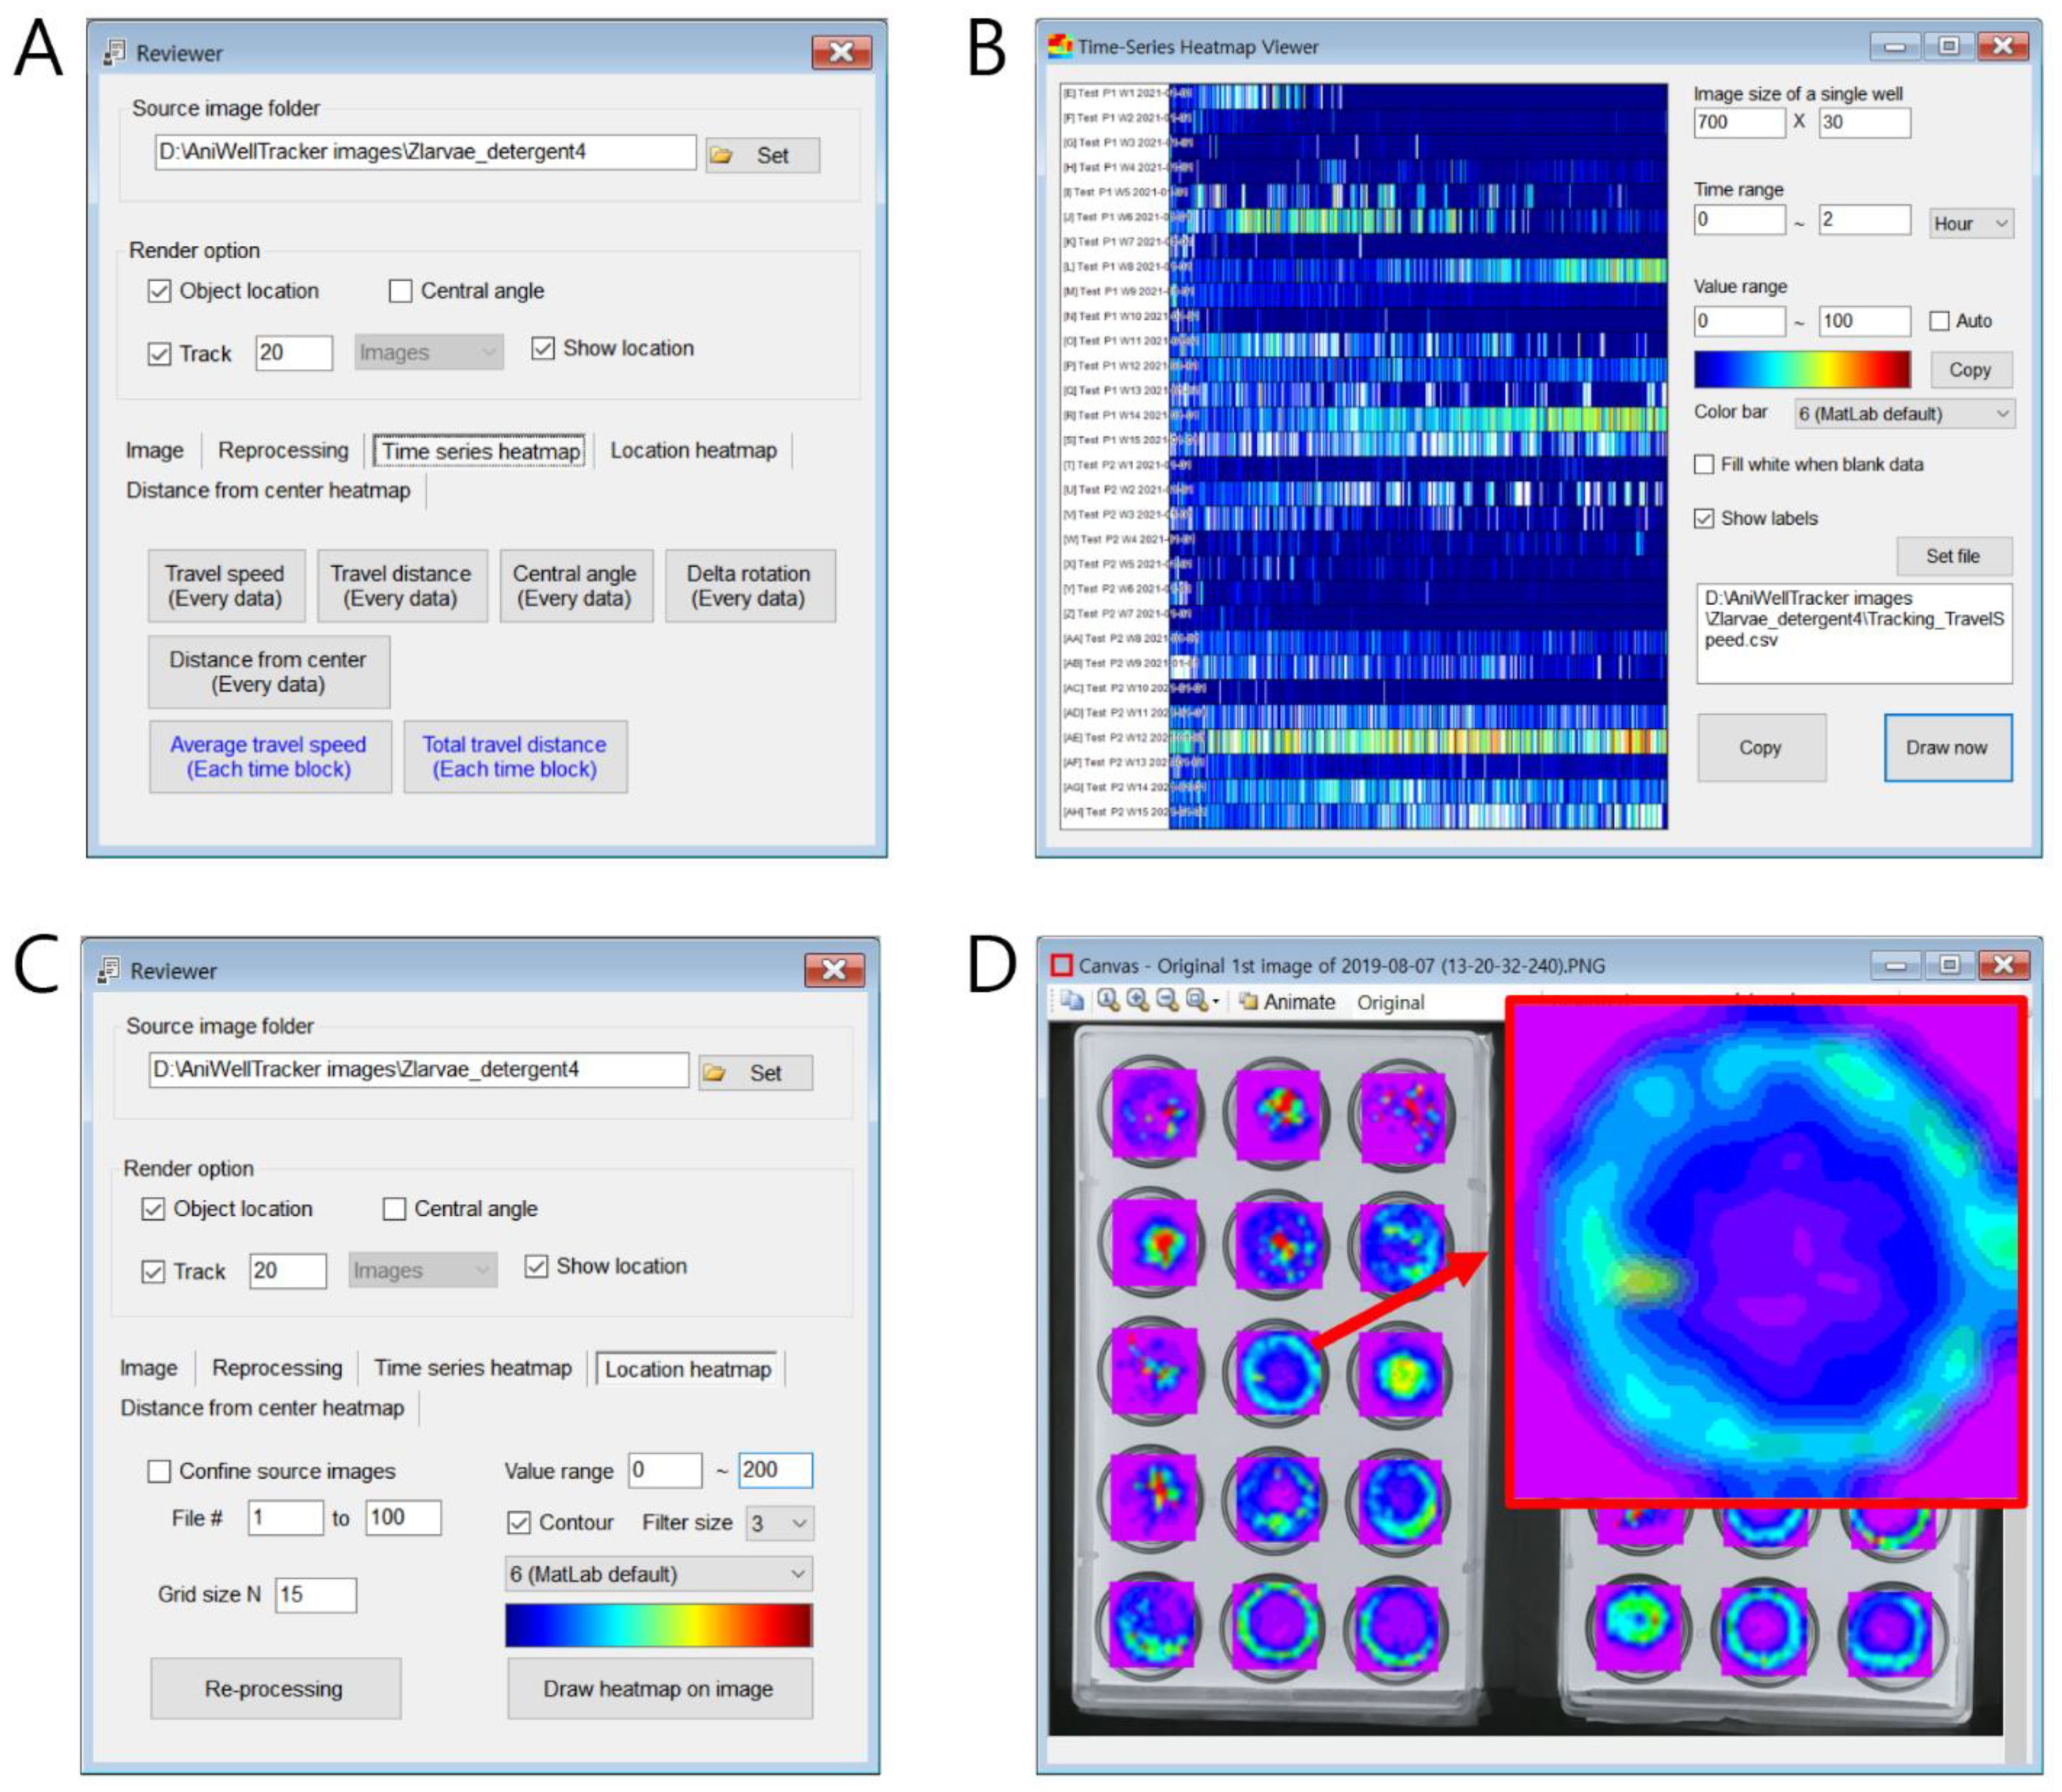
When image analysis is complete, the user can review and visualize the results in the “Review” window (
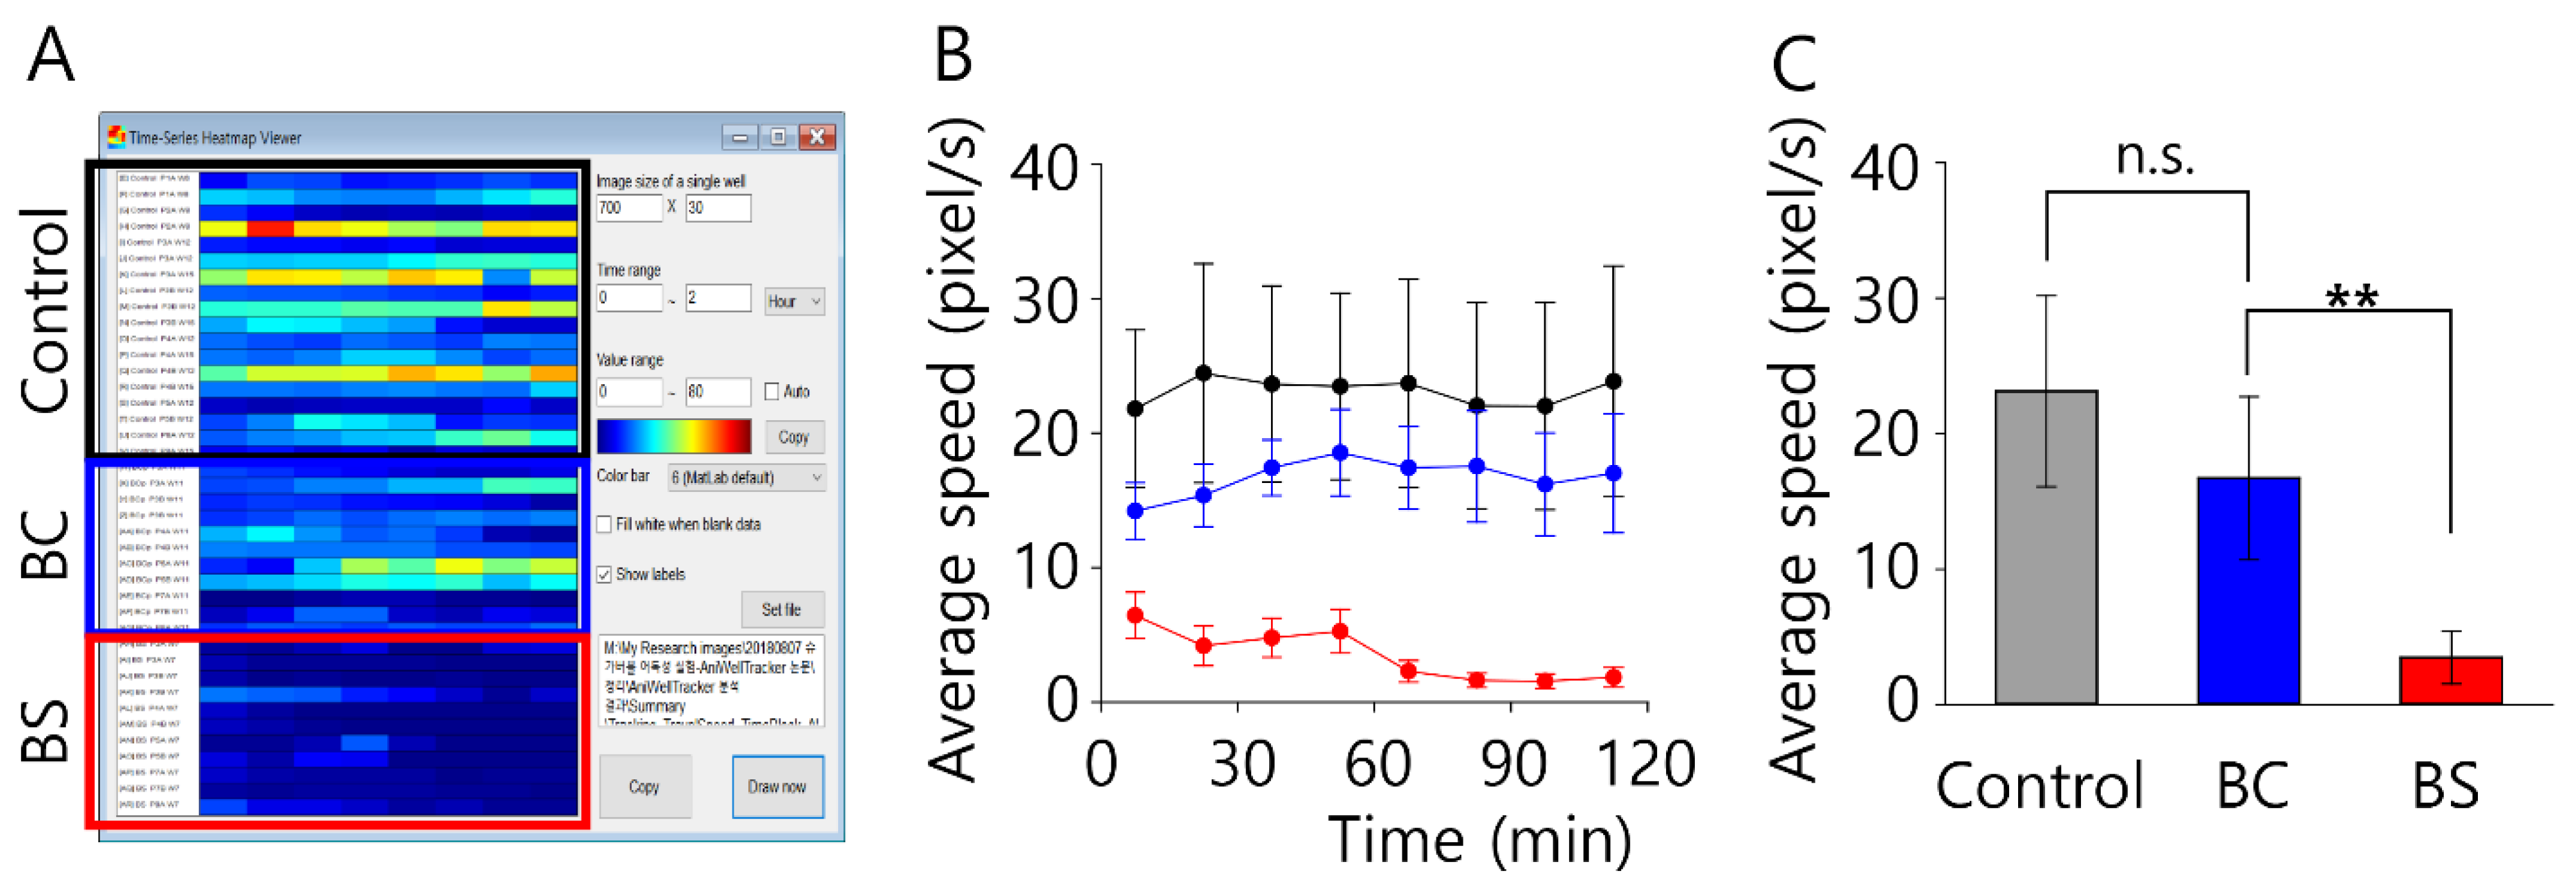
Figure 4). First, the first “Image” tab has a function to automatically save as a file by displaying the tracking path in the original image such that the tracking result can be reviewed. Not only for one well but also the entire image, the path of the specified length (number of files) is displayed on one original image, allowing for a quick review to check if there are any tracking issues. These functions are useful for the quality control of data. In the second “Reprocessing” tab, the user reprocesses the original files, and if the user sets the duration (min), the average speed and distance are recalculated for each time interval and saved in the output file. From the centroid coordinates recorded in the output file, the speed and moving distance at the time that each image was captured were recorded. Because the amount of raw data of speed and distance is almost equal to the number of images, it is useful to easily observe the overall trend of change in speed and distance traveled by calculating the average speed and distance traveled for a specific period (e.g., 10 min). The third “Time Series Heatmap” tab features a heatmap display of the raw data for speed, distance traveled, and average speed versus time (
Figure 4A). When a user presses buttons, such as “Travel speed (every data)” or “Travel distance (every data)”, the analysis result can be immediately displayed in a heatmap chart. The time interval to be displayed on the heatmap can be input in minutes or hours, and the color corresponding to the numerical value can be set by inputting a range of numerical values (
Figure 4B). In addition, in the “Location heatmap” tab, the probability of the location where the animal stays can be displayed as a heatmap (
Figure 4C,D), and in the “Distance from center heatmap” tab, the location of the radius where the animal remains from the center of the well can be displayed as a chart.
2.2. Image Processing
In the tracking mode, AniWellTracker computes the coordinates of the animal’s centroid by performing a series of image processing from time-lapse images. In the review mode, users can review the tracking path obtained from the tracking mode and reprocess the data to obtain various analysis results or output them as charts.
To analyze the location of the animal in the tracking mode, the original image was first converted into a black and white image, and then converted into a binary image consisting only of white (gray value = 255) and black pixels (gray value = 0) (
Figure 1 and
Figure 3). Region extraction is then performed to detect a white pixel object, and the size, area, and centroid coordinates (x, y) of the object are calculated. The movement path of the animal can be obtained by connecting the centroid coordinates of the animal obtained from time-lapse images. The detailed image-processing method is described below.
To track the small animals in the image, binarization was first performed to detect objects with different brightness from the background. There are several binarization algorithms. When imaging an animal, the lighting conditions, including brightness and contrast, are different, and brightness may not be uniform throughout the entire image. AniWellTracker uses an adaptive thresholding algorithm [
20] to create binary images. In AniWellTracker, the adaptive thresholding characteristics can be adjusted by setting the processing box size and threshold value. The processing box size refers to the size of the area where the average brightness is calculated, and is set slightly larger than the size of the object to be detected. The threshold value represents the sensitivity of binarization. The higher the value, the better the detection of objects, with a small difference in brightness from the background. However, the larger the value, the more severe the noise.
Next, region extraction was performed to detect white objects in the binary image. A method called connected-component labeling [
22,
23] was used to detect a white object on a black background. While sequentially scanning the pixels of an image, all adjacent white pixels are assigned the same number (label) and other unconnected white objects are assigned a different number. When the region extraction is completed, a lump of all white pixels in the image is detected. Because an image may contain various noises, two or more white objects may be detected in an individual well. AniWellTracker can only detect valid animals using the appropriate area of the white object and bounding box size range (minimum–maximum value) set by the user to determine which white object is an animal. If two or more white objects satisfy this condition, the white object with the largest area is finally determined to be an animal. When only one animal object is detected, the centroid coordinates can be calculated by calculating the average of the x-coordinate and y-coordinate values of the white pixels. After obtaining the centroid coordinates of the individual wells in the time-lapse images, the tracking path was obtained by sequentially connecting the coordinates. The movement distance L (in pixels), which is the distance between the centroid coordinates of two time-lapse images, was then calculated (L = sqrt((x
2−x
1)
2 + (y
2−y
1)
2), and the total distance traveled was calculated by adding all movement distances. The speed of the animal (in pixels/time) was determined by dividing the movement distance or total distance traveled by the time interval between specific times.
In addition to centroid coordinates, distance traveled, and speed, AniWellTracker measures the position of the animal (relative position within the ROI, centroid angle between the center of the ROI and the animal position, and distance between the center of the ROI and centroid). The animal’s movement direction (animal rotation angle between time-lapse images), average distance, and average speed for each time block were also calculated and saved in CSV files (
Table 1). Therefore, users can process the output files for further analysis.
2.3. Visualization
AniWellTracker offers various chart functions so that users can easily determine the results. First, raw data, such as speed, distance traveled, central angle, and rotation angle of the animals obtained, can be displayed as a time-series heatmap. However, data handling and analysis are difficult with a large amount of raw data. Therefore, AniWellTracker divides the raw data into certain time blocks, calculates average values for each block, and then draws a time heatmap.
AniWellTracker also has a function that draws the frequency of locations where individual animals have stayed as a location contour heat map (
Figure 4C,D). The process of generating the location contour heatmap image is as follows: (1) create a grid divided into n × n cells in the rectangular area designated as the ROI; (2) after determining the cell to which the animal’s centroid coordinates belong, count the total number of times the animal stayed in each cell; (3) create a gray bitmap image of n × n pixels from the count number of grids comprising n × n cells; (4) apply a neighborhood-averaging filter (also known as blur filter) to the bitmap image; (5) the pixel values (0–255) of the image are converted into n-specific gray values by applying a look-up table (LUT) in the form of a staircase function. For example, if n is 6, the LUT converts the original pixel gray values 0–42 to 0, 43–85 to 51, 86–127 to 102, 128–170 to 154, 171–213 to 205, and 214–255 to 255. When this conversion process was completed, a contour heatmap image was created.
AniWellTracker can output the “Tracking_DistanceFromCenterHeatmap.csv” file obtained through image processing as a heatmap. Similar to the location contour heatmap, the software calculated the frequency of the distance from the center of the ROI (the center of the well) to the animal location and displayed it as a heatmap. After dividing into n areas from the center of the well to the maximum distance (approximately the radius of the well), the software calculated and visualized the frequency at which the animals stayed. Thus, it can be determined whether the animal stayed in the center or middle of the well or at the edge of the well farther from the center during the test.
3. Case Study: Effect of Household Cleaning Agents on Zebrafish Swimming Speed
In order to demonstrate the usefulness of AniWellTracker, zebrafish were exposed to two types of household cleaning agents, and imaging was performed, followed by analysis with AniWellTracker. The household cleaning agents, a baking soda cleaner (Cleaner BS) and a bathroom cleaner (Cleaner BC), were purchased from a local market in S. Korea. Wild-type zebrafish were obtained from the Korea National Research Resource Center and mated to obtain eggs, after which they were grown at 28 °C. In the experiment, 18 days post-fertilization (dpf) fries were used. A total of 990 μL of the breeding water was placed in a 15-well spot plate (FLINN Scientific, item #: AP6404), and one zebrafish larva was placed in each well. Then, 10 μL of diluted cleaner was added, after which imaging was performed. Animal experiments using zebrafish were approved by the Peachchem Animal Care and Use Committee (IACUC) under a protocol (Peachchem P-20190507-1). The zebrafish images were captured at 1 s intervals using the time-lapse capture function of PhenoCapture from a custom imaging device equipped [
24] with a Logitech C920 camera and a computer (Intel Core i3 2.27 GHz processor; 4 GB ram; Microsoft Windows 10). The equipment was covered with blackout curtains to exclude the influence of external lighting.
After imaging for a total of about 2 h, the animal’s position was analyzed using the tracking function of AniWellTracker. Regarding the AniWellTracker’s animal tracking performance, it took an average of 1.38 ± 0.02 s to process one 1920 × 1080 JPEG image on an office PC (Intel Core i7-8700 3.20 GHz processor; 16 GB ram; Samsung SSD 512 GB; Windows 10). The speed as a function of time for the two household cleaners is shown in
Figure 5A. In Cleaner BS (baking soda cleaner), the animals showed movement for approximately 60 min, and barely any movement thereafter; thus, they were estimated to have died after approximately 60 min. Indeed, after 2 h of image capture, the animals were confirmed to have died. In comparison, in Cleaner BC (bathroom cleaner), the animals showed active movement during the 2 h experiment, indicating that Cleaner BS was likely more toxic than Cleaner BC. In
Figure 5B, the unit of speed is pixel/sec; to compare with other experiments, the unit must be changed to cm/s. To convert the distance from units of pixels to centimeters, a conversion factor is calculated. This can be used to obtain the conversion factor and measure the actual distance (cm) between specific points of the image easily.
The overall average speed (cm/s) under test conditions is shown in
Figure 5C. The zebrafish treated with Cleaner BS showed markedly lower average swimming speeds than the control zebrafish. In contrast, the zebrafish treated with Cleaner BC showed nearly the same swimming speeds as the control. The result might indicate that Cleaner BS had a more detrimental effect on zebrafish movement than Cleaner BC.
4. Comparison with Other Similar Solutions
Similar software have been used to analyze the movements of small animals, such as ZebraLab (ViewPoint Behavior Technology), EthoVision [
13], idTracker [
14], JAABA [
16], CTRAX [
11], wrMTrck (
www.phage.dk/plugins/wrmtrck.html, accessed on 23 December 2022) [
17], and AnimalTracker [
18]. ZebraLab or EthoVision (Noldus Information Technology) can quantitatively analyze the movements of various animals, but they are commercial solutions and thus have limitations in terms of cost. In the case of idTracker and JAABA developed with the commercial software MATLAB, there are limitations not only in terms of cost but also in terms of the installation and use period of the software. The AnimalTracker and wrMTrck were developed as ImageJ plugins depending on ImageJ, and BonZeb [
12] utilizes the OpenCV library. Conversely, AniWellTracker is a free software in which all image processing algorithms are written natively using VB.NET and do not use external libraries, such as ImageJ or OpenCV. AniWellTracker specializes in image analysis using multiwell plates compared to other software. In addition to the ability to track animals, it is also an advantage that the results can be displayed immediately after analysis without using other software. In addition, regarding the difficulty of using the software, AniWellTracker has a user-friendly interface that allows users to intuitively press a button to proceed with the analysis. Unlike other software, such as MATLAB, LABVIEW, ImageJ, and OpenCV, even beginners without programming experience can easily use the software. The software installation process is also simple, and because AniWellTracker does not require any other software or plugins, an executable file can be executed immediately without a complicated setting process. Because it is not a commercial software, there is no limit on the usage period, and it can be freely installed on multiple PCs.
5. Impact
It is important to measure animal movements easily and accurately when studying the effects of genes, chemicals, or the environment on animals. Multiwell plates are useful for high-throughput studies of a large number of small animals. For example, to test dozens of natural extracts or chemical products at various concentrations, a large number of animals must be analyzed; however, using a multiwell plate is not sufficient. To save manpower and analysis time, automated image analysis software that can quickly and accurately analyze images captured during experiments is required. In addition, most researchers performing these biological experiments do not have programming skills; therefore, they need software with an easy-to-use interface. AniWellTracker is a specialized software for analyzing animal movements in multiwell plates. It is easy to install and has a user-friendly interface that allows researchers to easily learn and use. Overall, AniWellTracker is intended to have a GUI interface optimized for animal motion analysis in multiwell plates instead of developing new algorithms. The various image processing algorithms written for AniWellTracker may not be entirely new, but their codes are written natively in VB.NET and have been developed to work reliably for a long time to avoid problems such as memory leaks or code crashes. Therefore, advanced users can use these image processing algorithms to add new features to AniWellTracker or create .NET-based image processing software for other purposes. If high-throughput image analysis is introduced in a laboratory that has not been used for research, and the multiwell plate and AniWellTracker are properly used, the productivity of the research can be significantly increased.


