


Distribution Quality of Agrochemicals for the Revamping of a Sprayer System Based on Lidar Technology and Grapevine Disease Management

 ,
, 
 ,
,  ,
,  and
and
Abstract
:1. Introduction
2. Materials and Methods
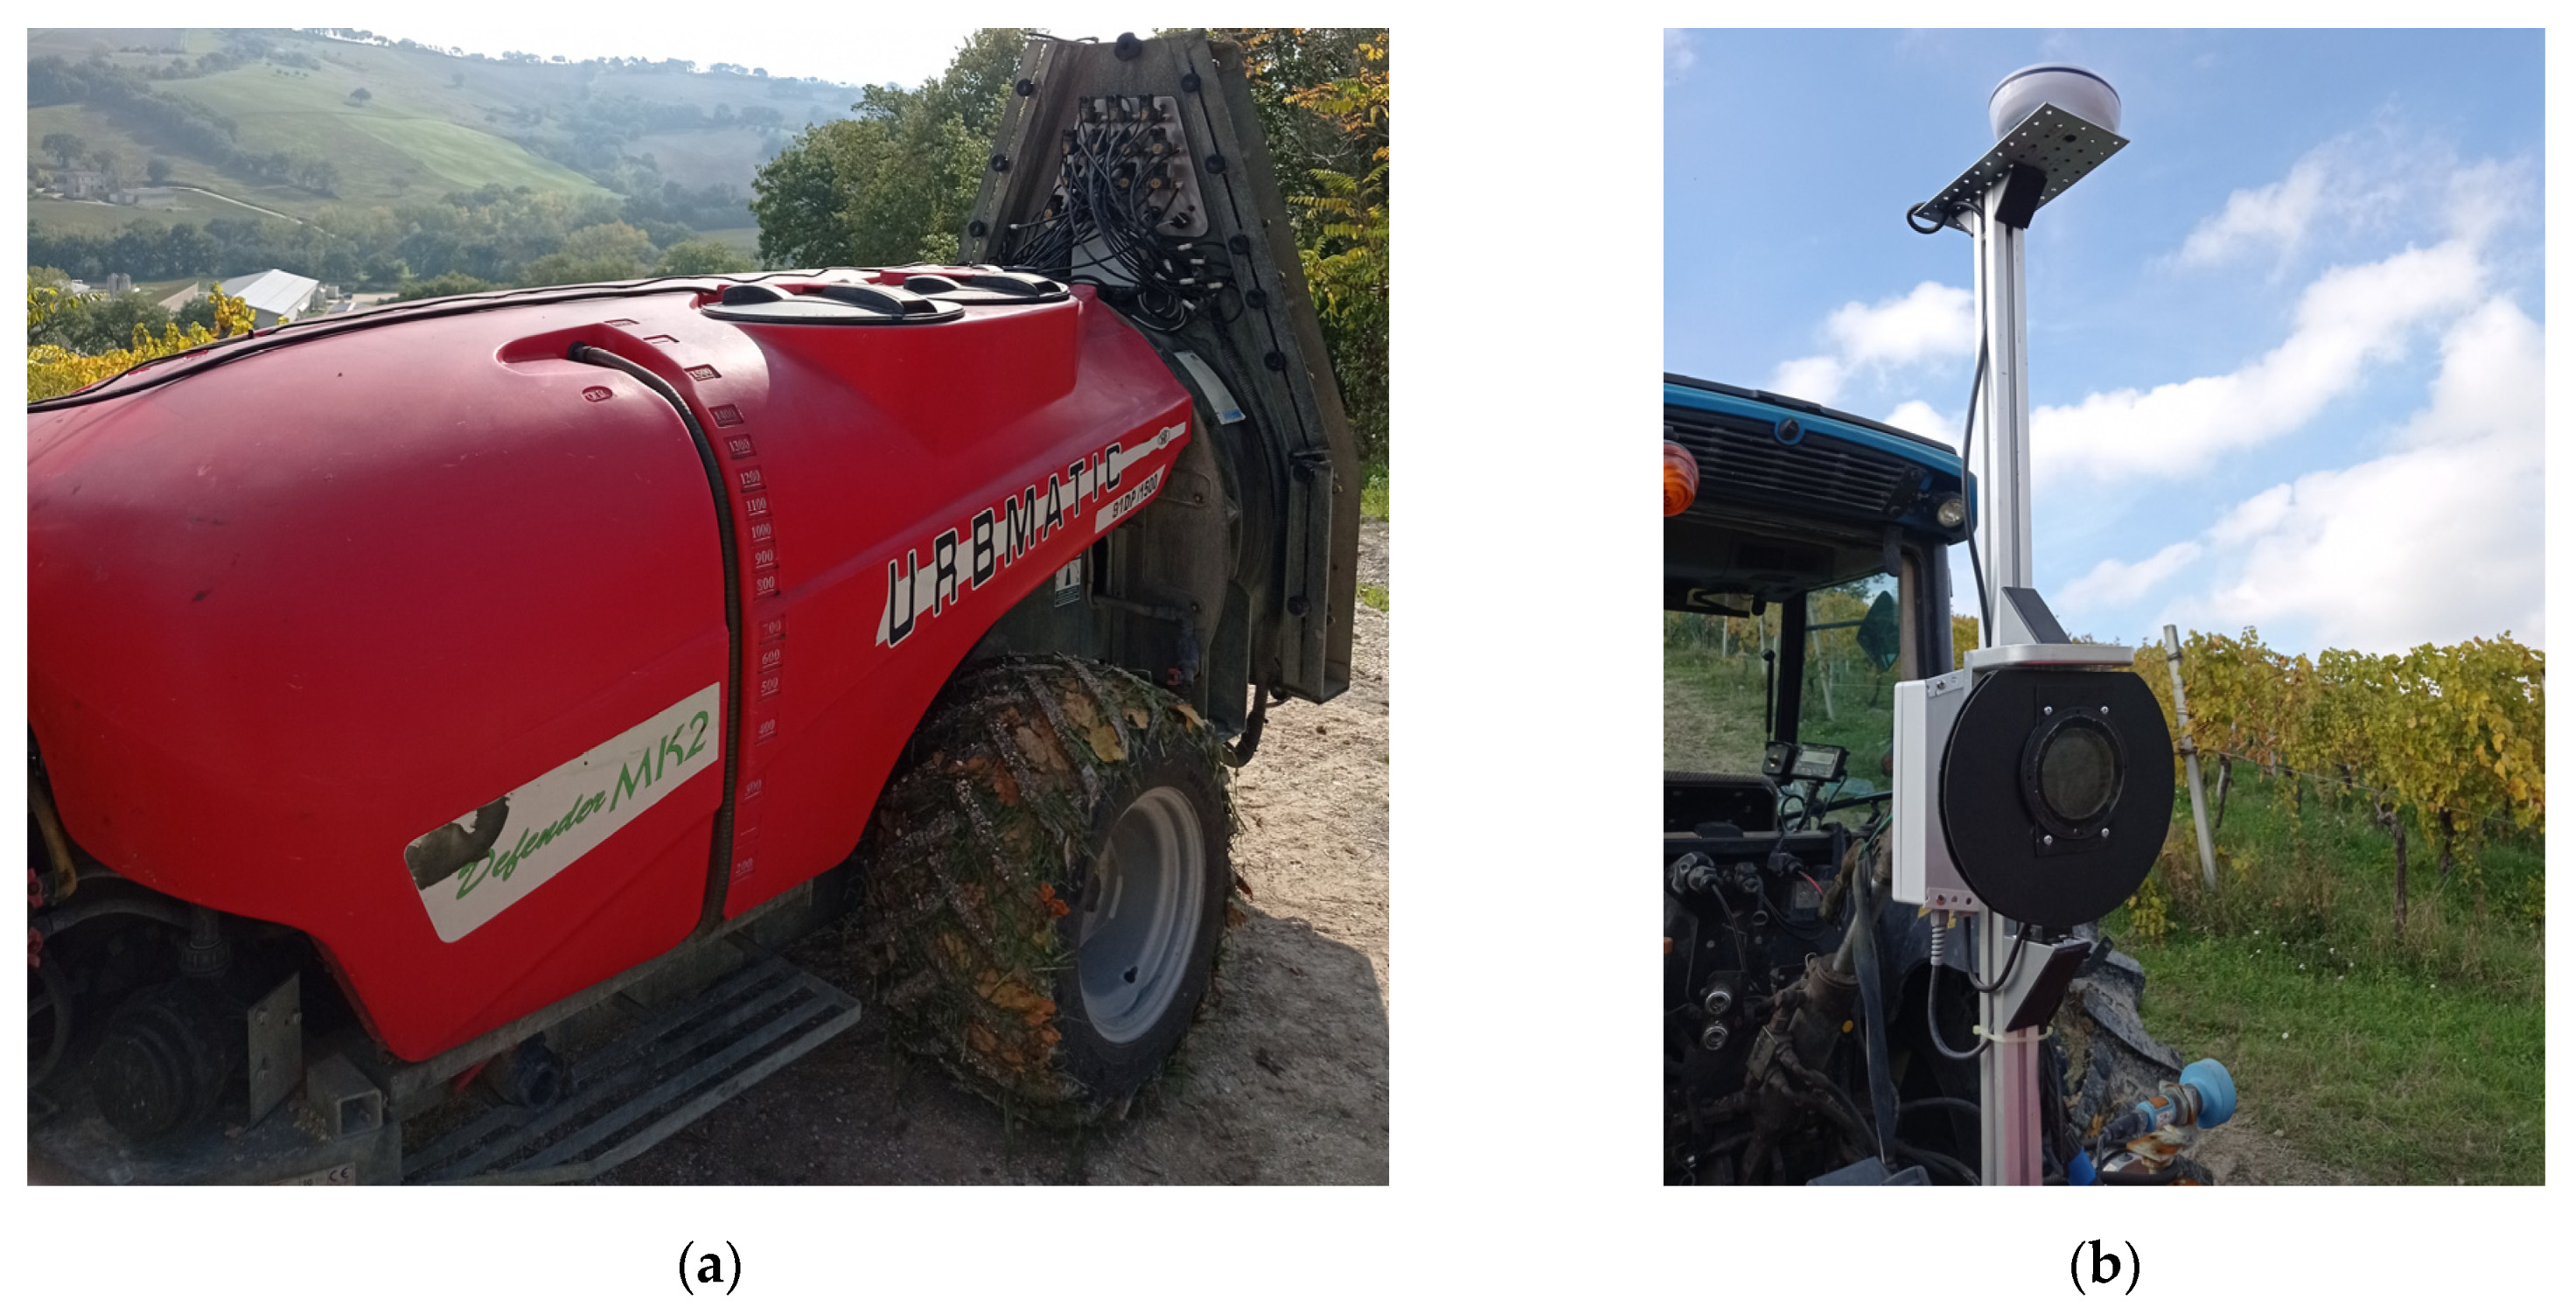
2.1. Experimental Equipment and Devices
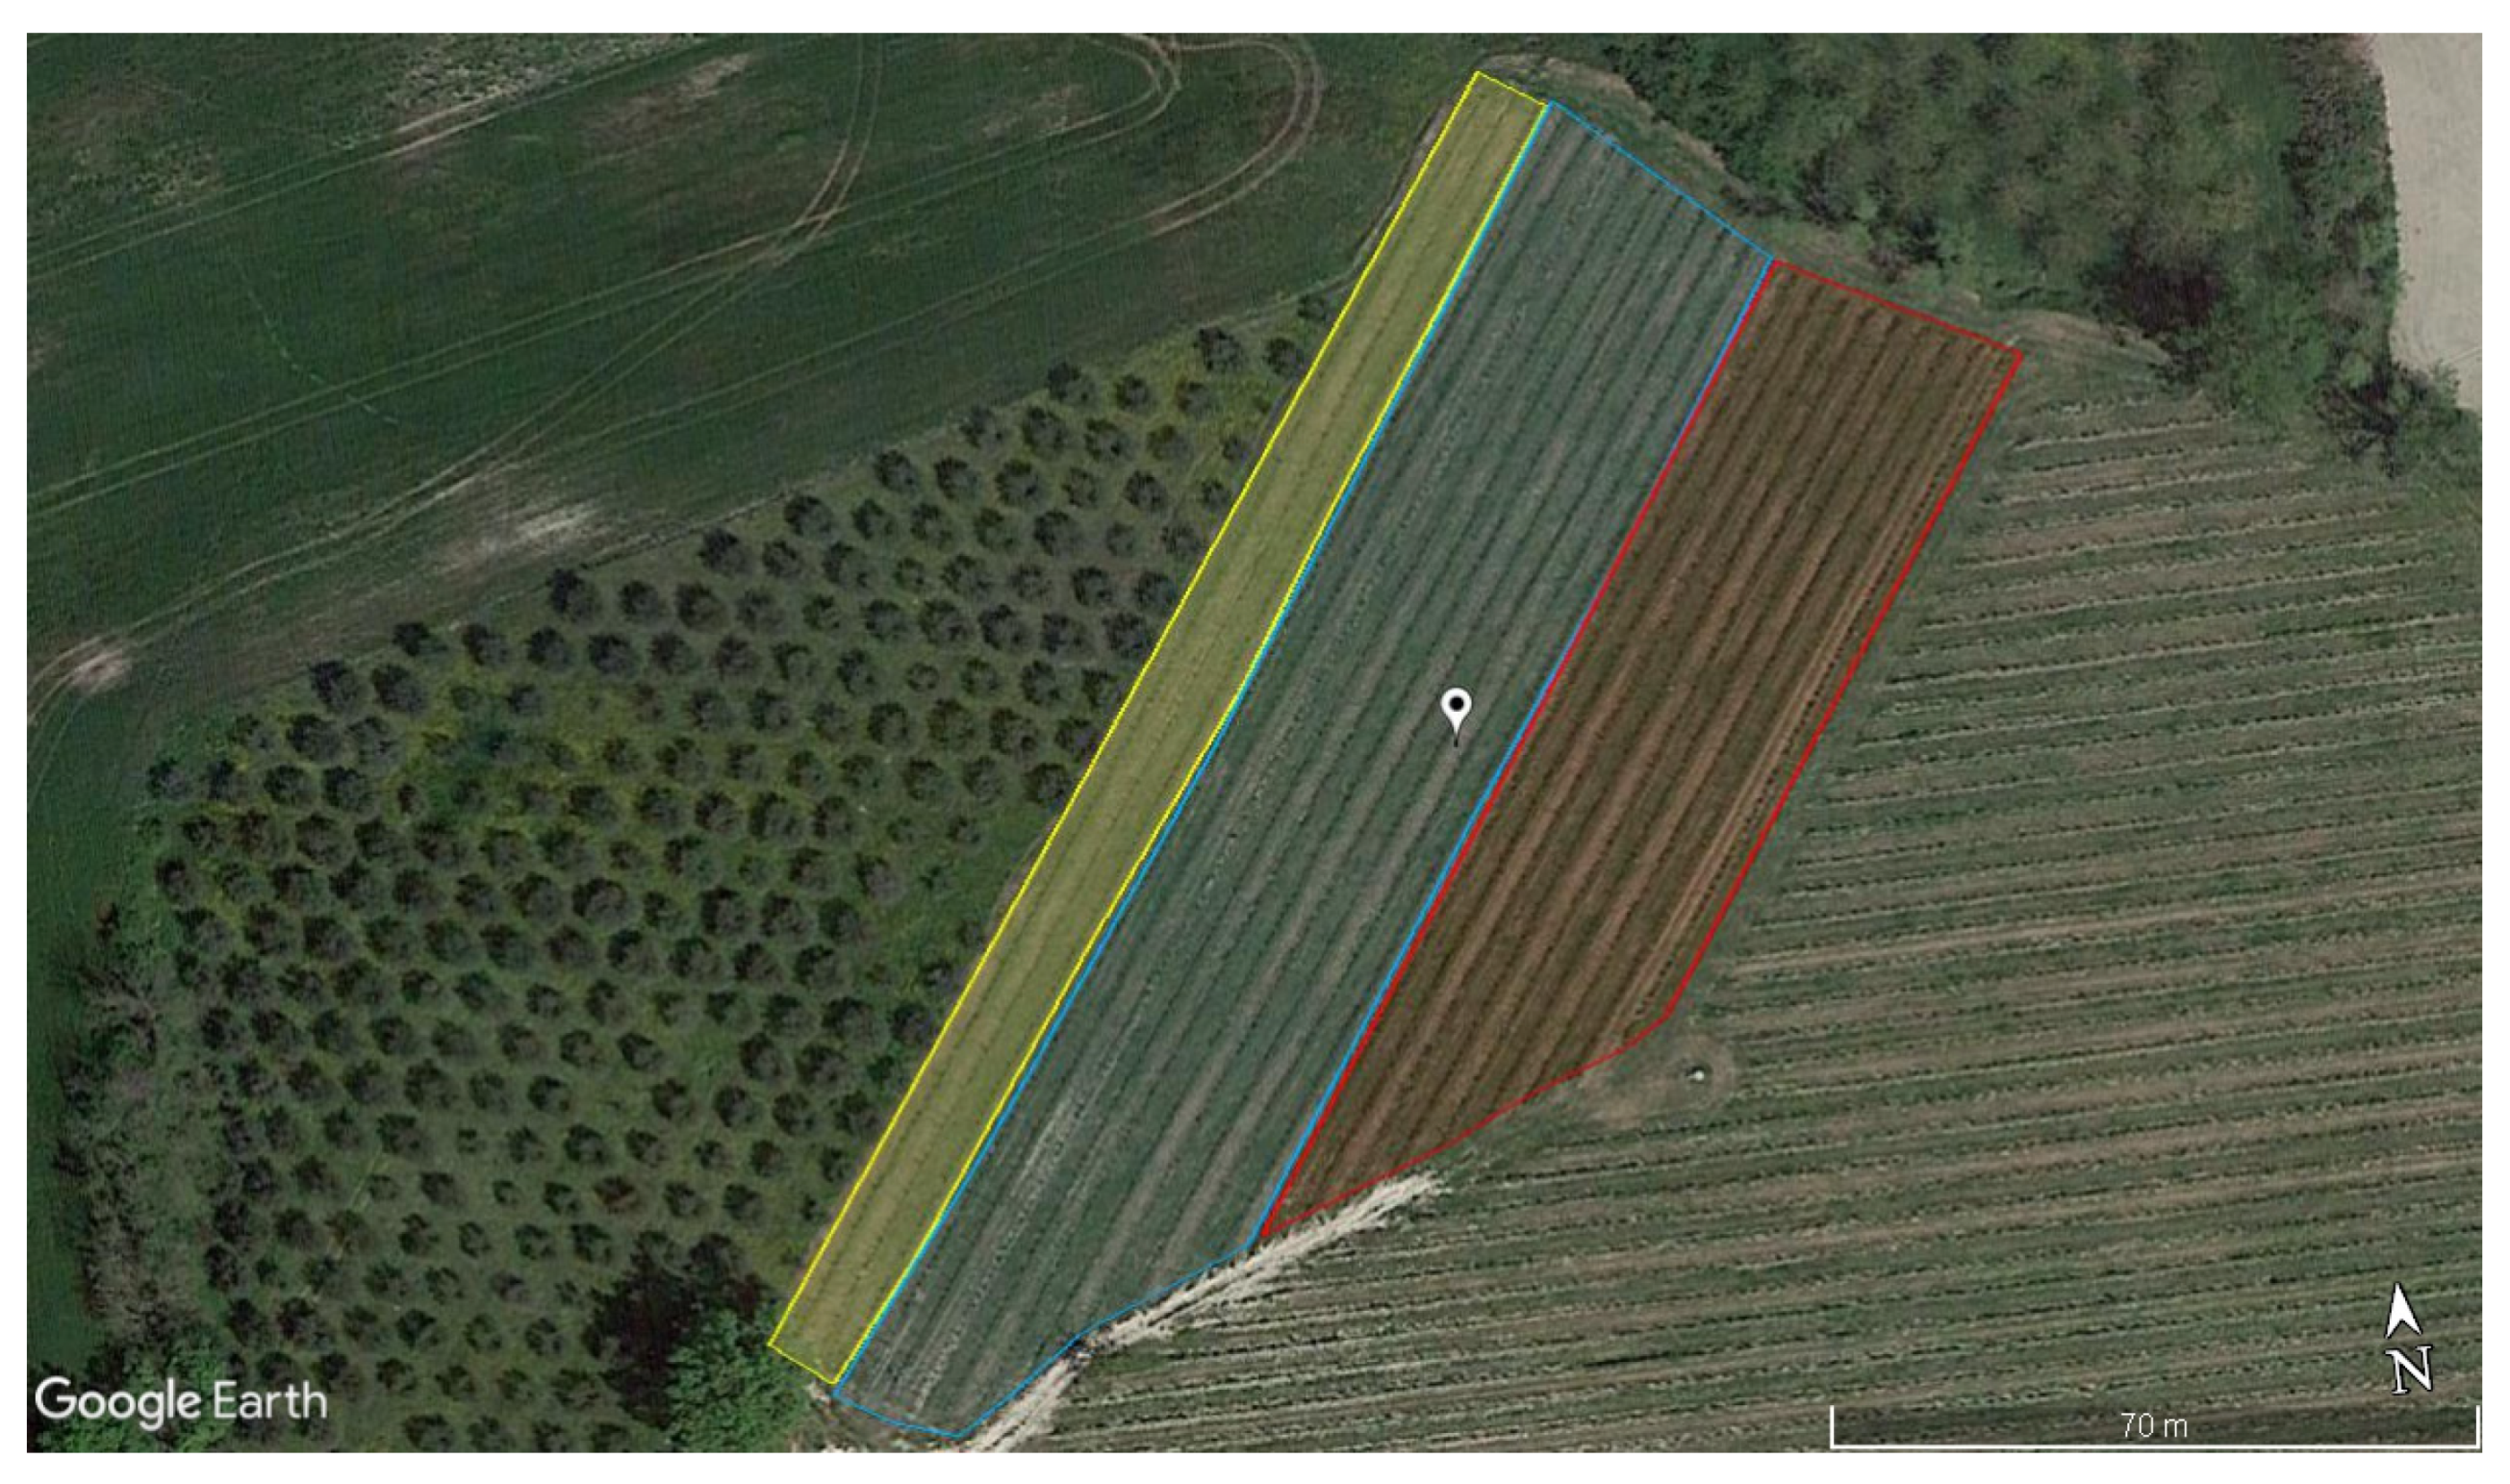
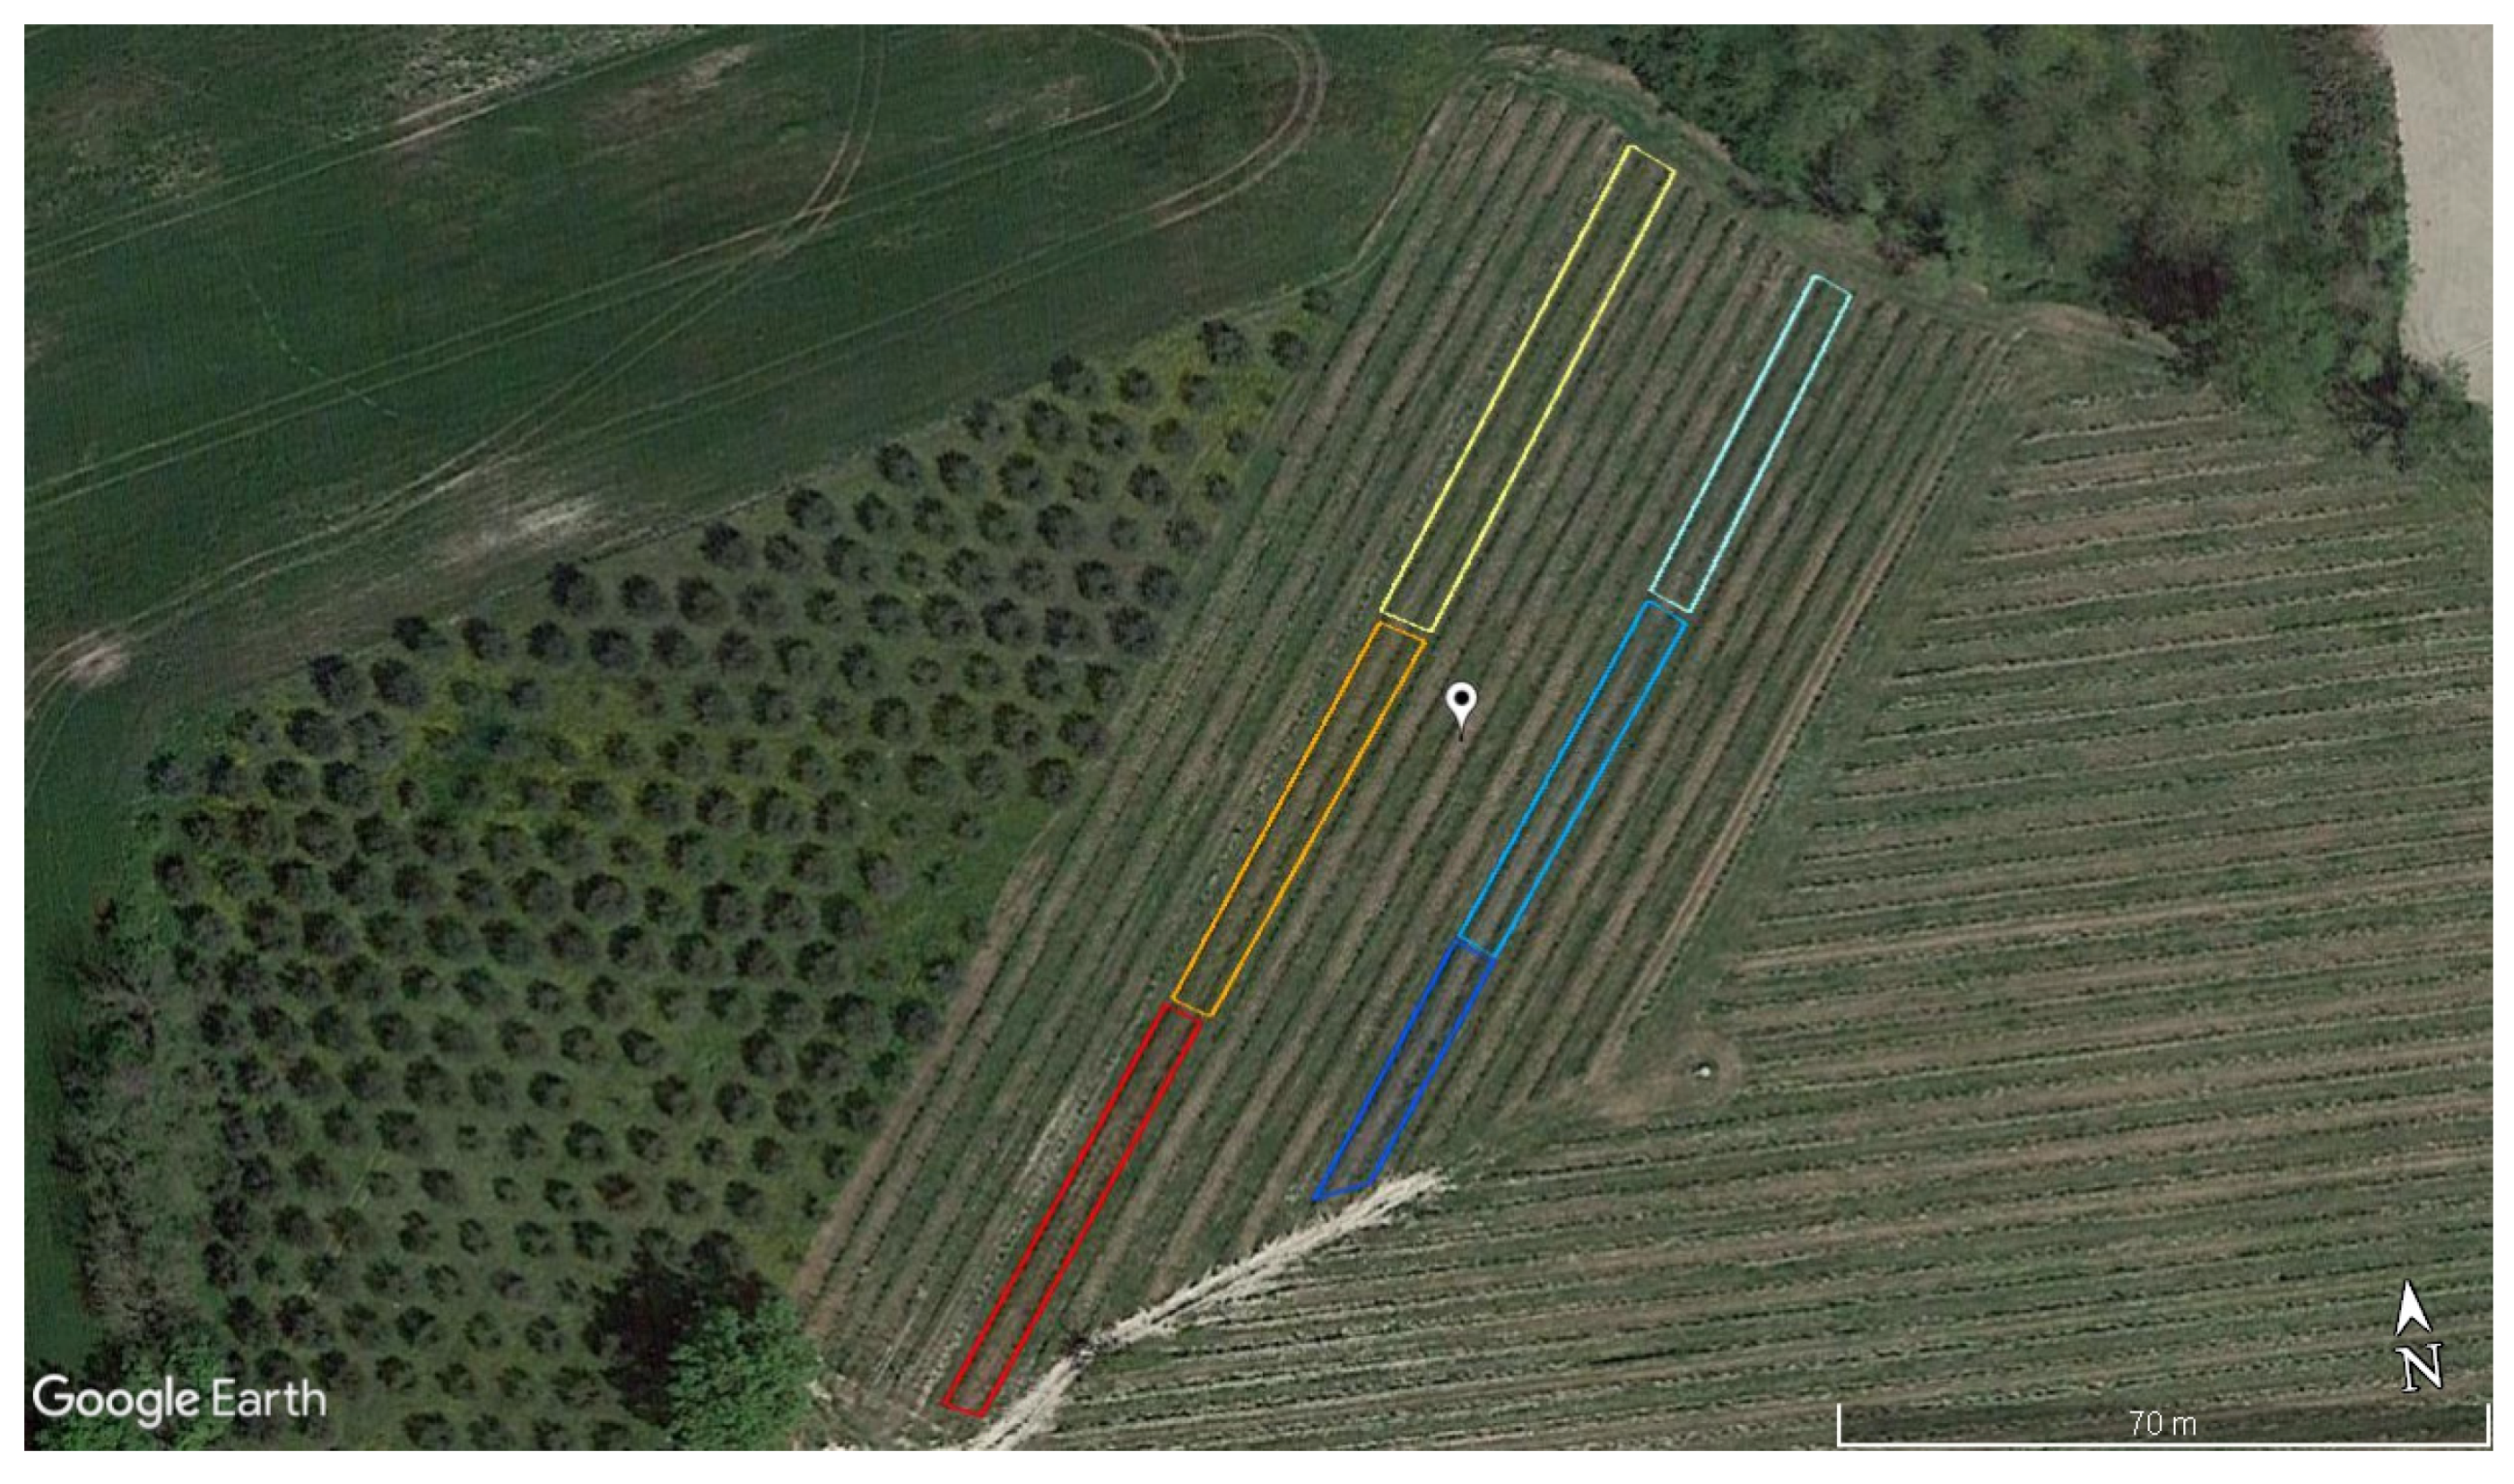
2.2. Experimental Design
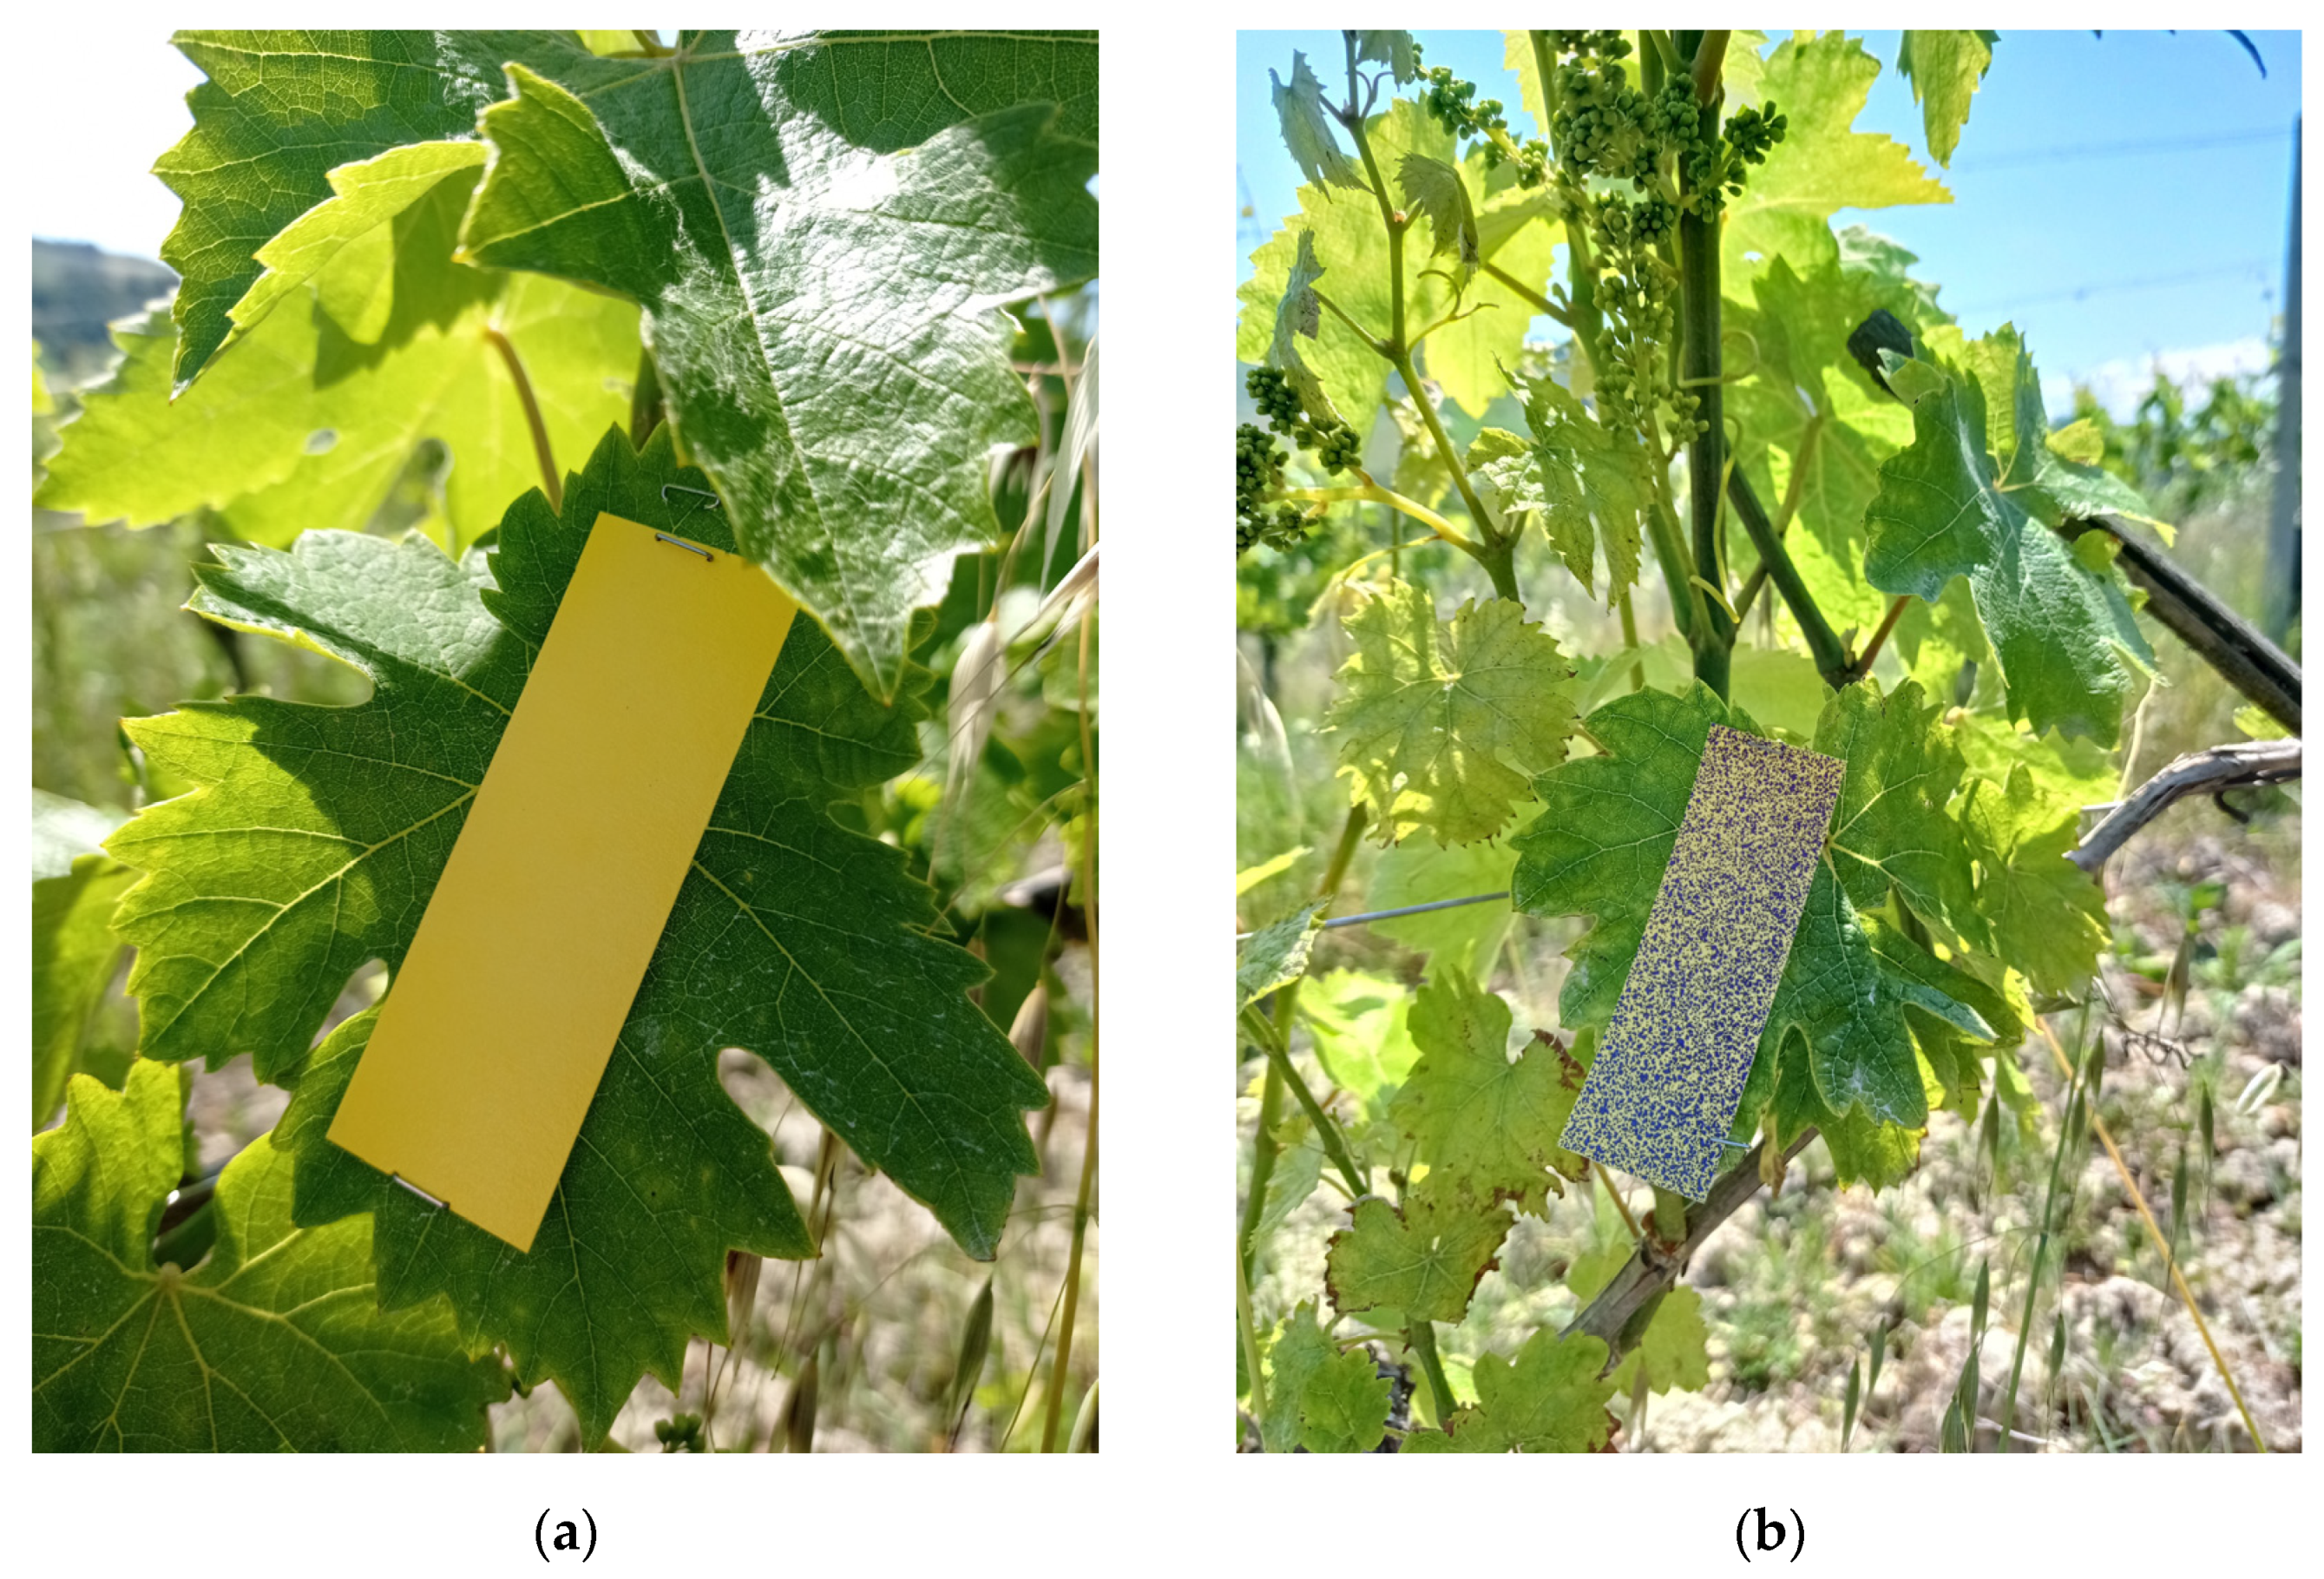
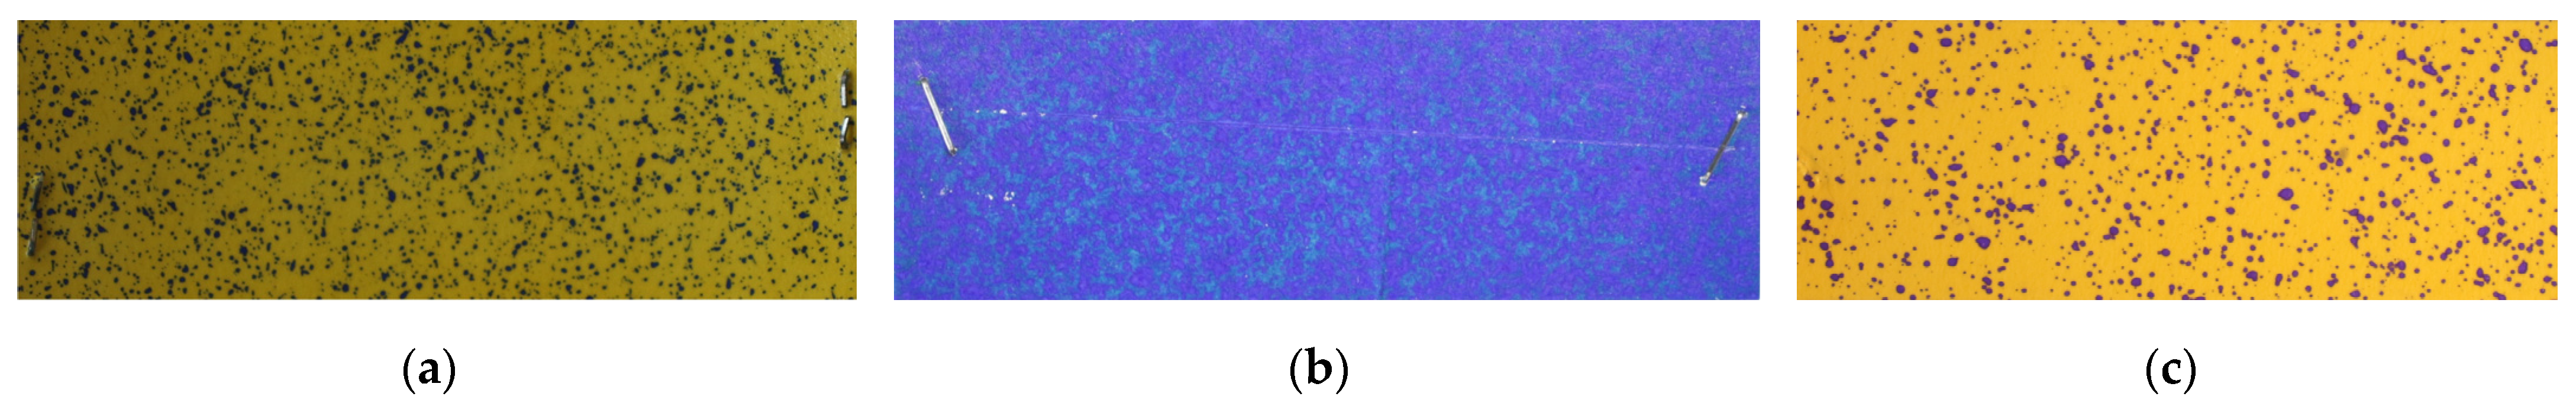
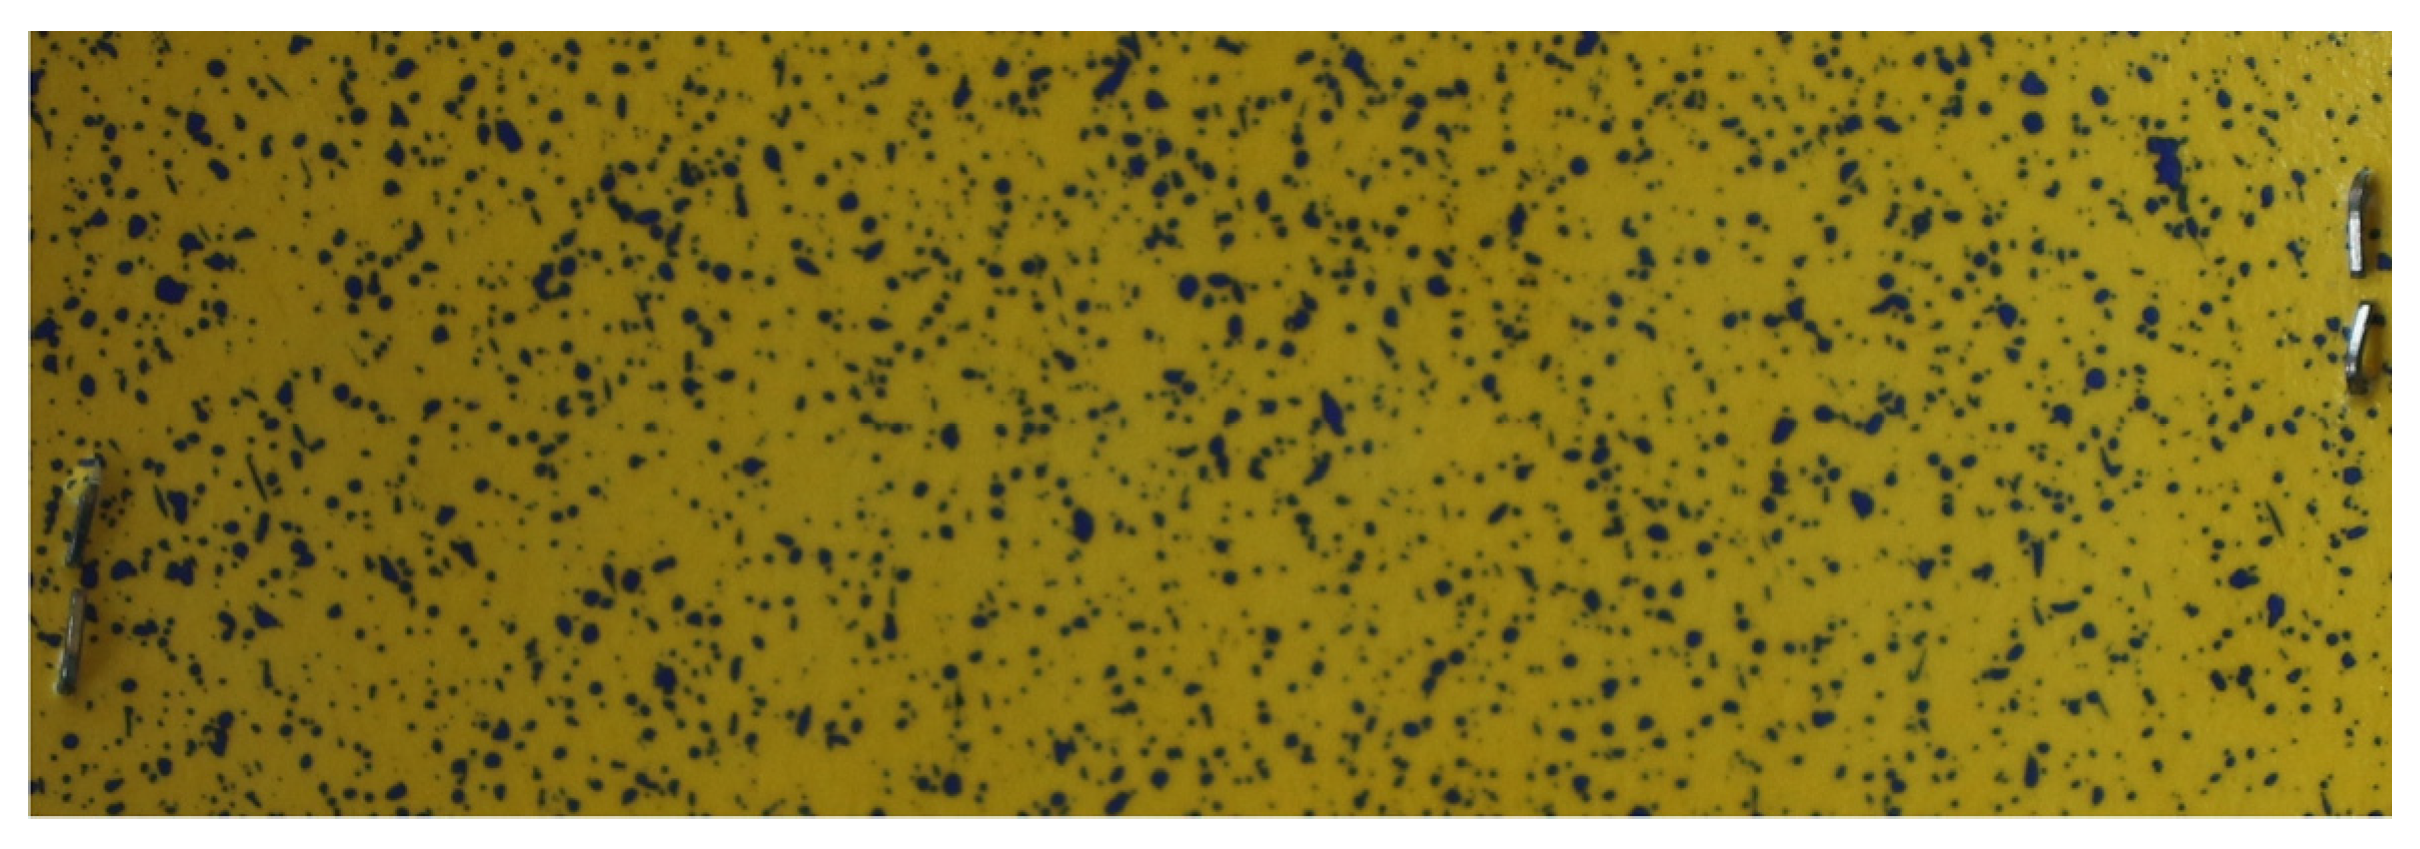
2.3. Processing of Water-Sensitive Papers
2.4. Survey of Grapevine Pathogens
3. Results
3.1. Evaluation of LiDAR System
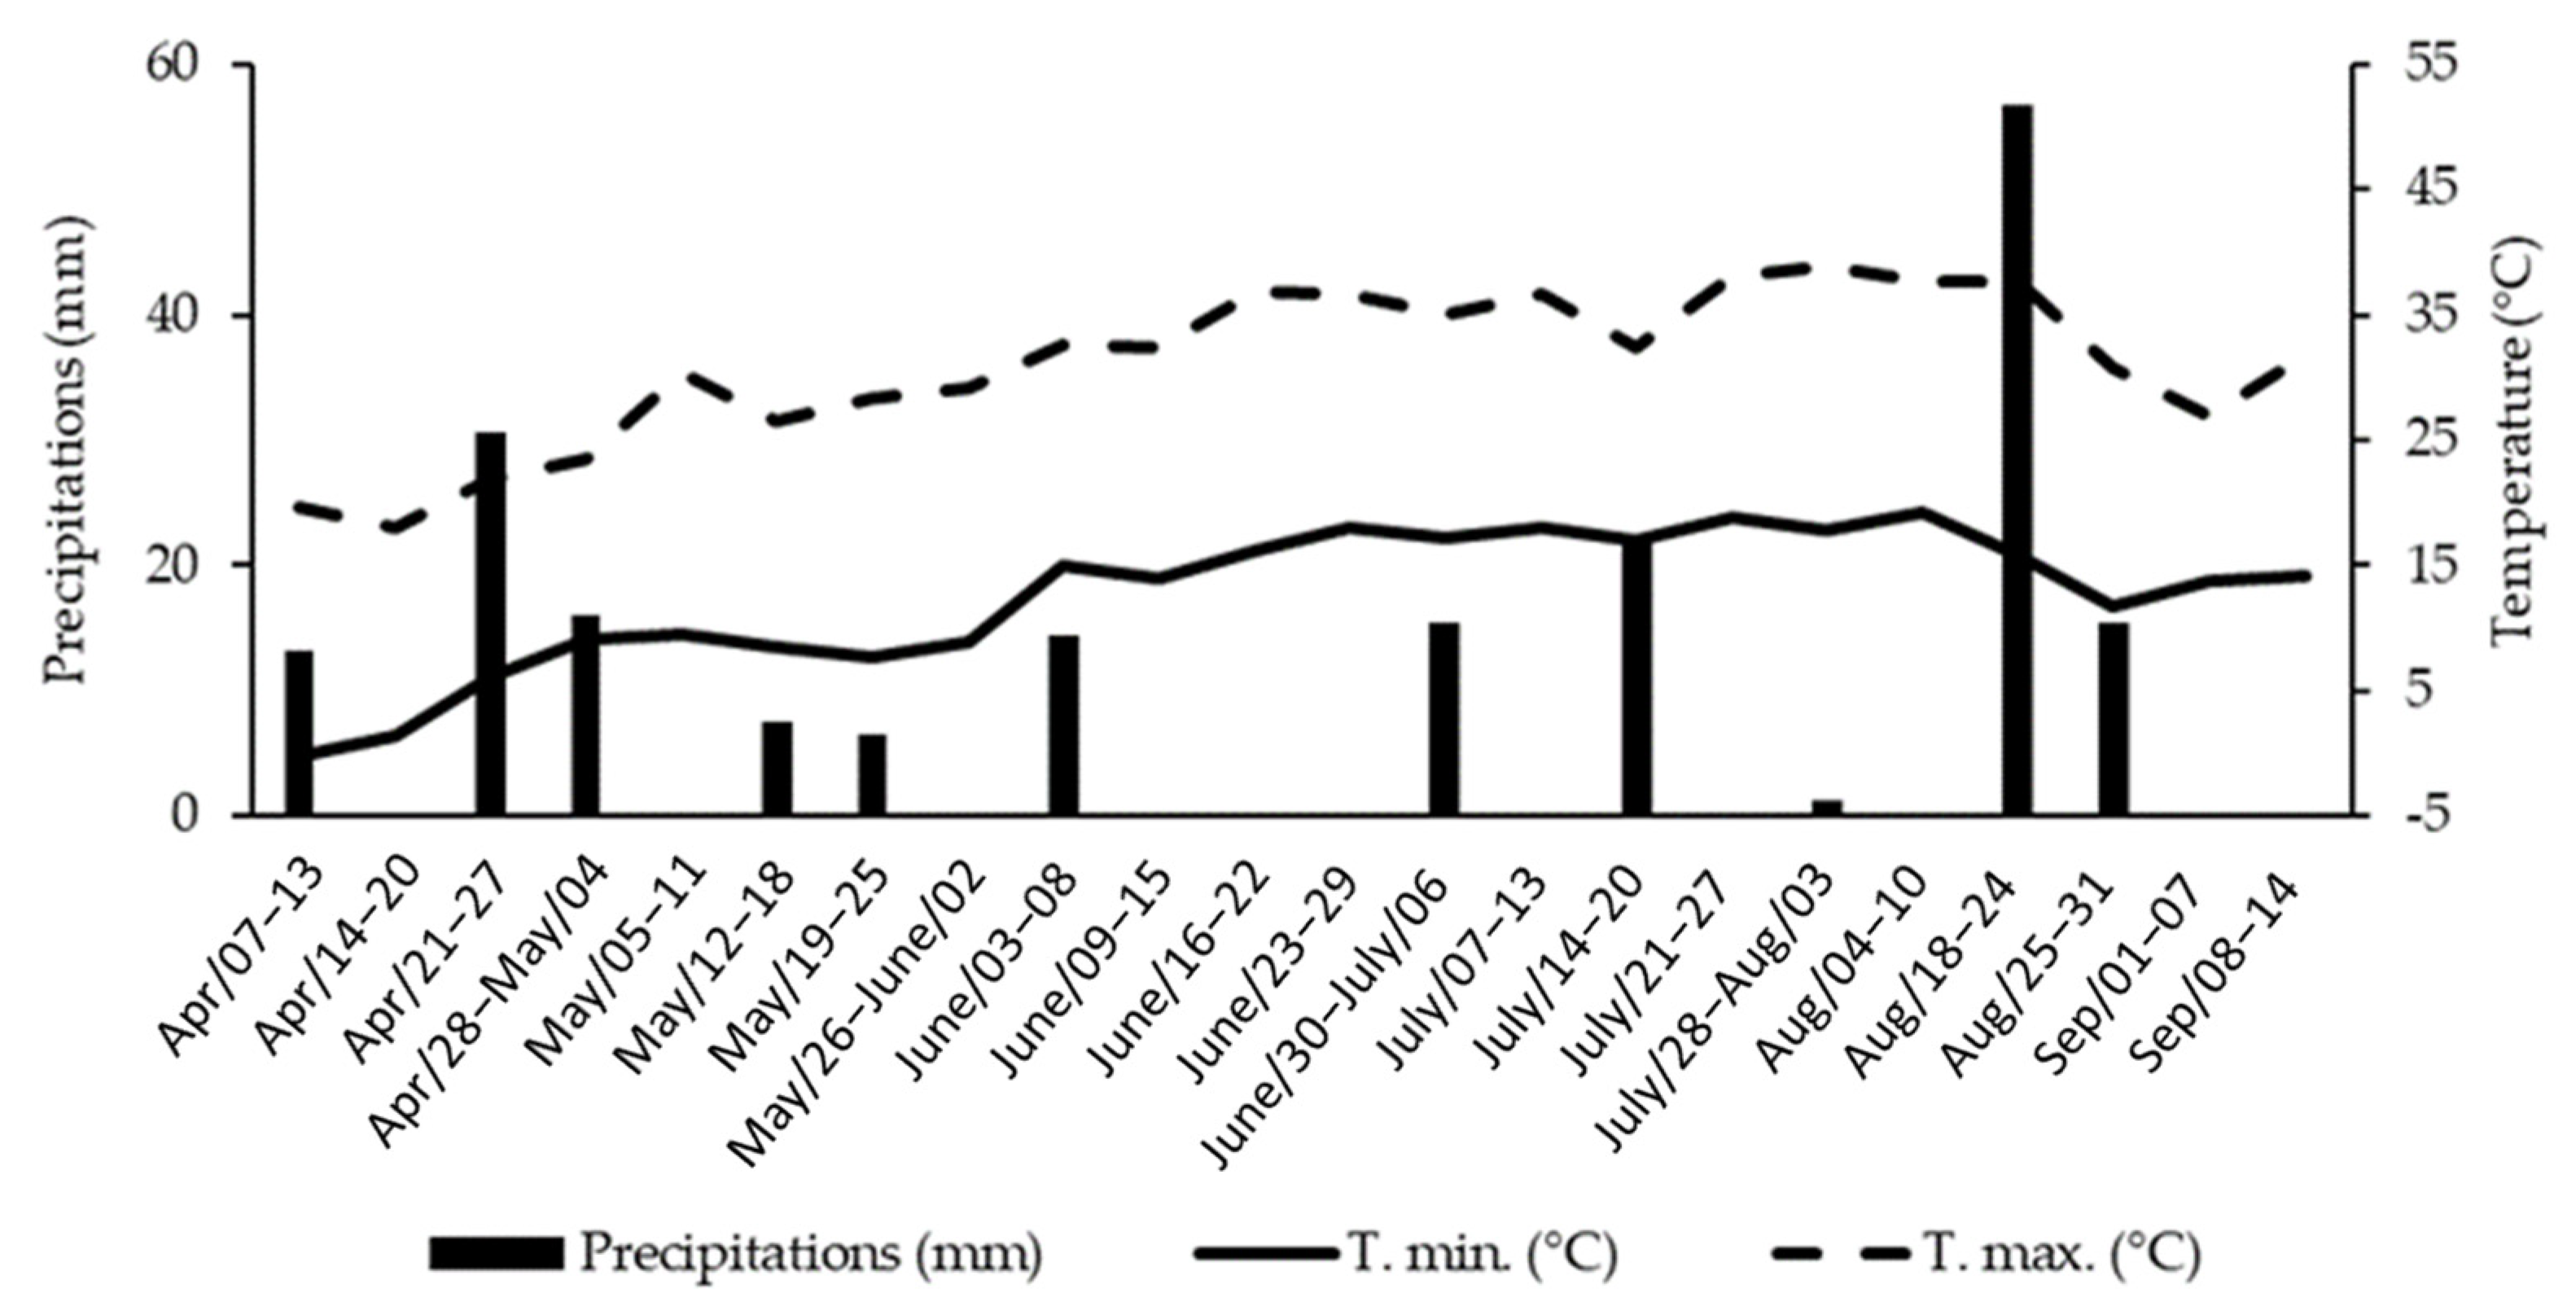
3.2. Environmental Conditions
3.3. Evaluation of Grapevine Downy and Powdery Mildews
4. Discussion
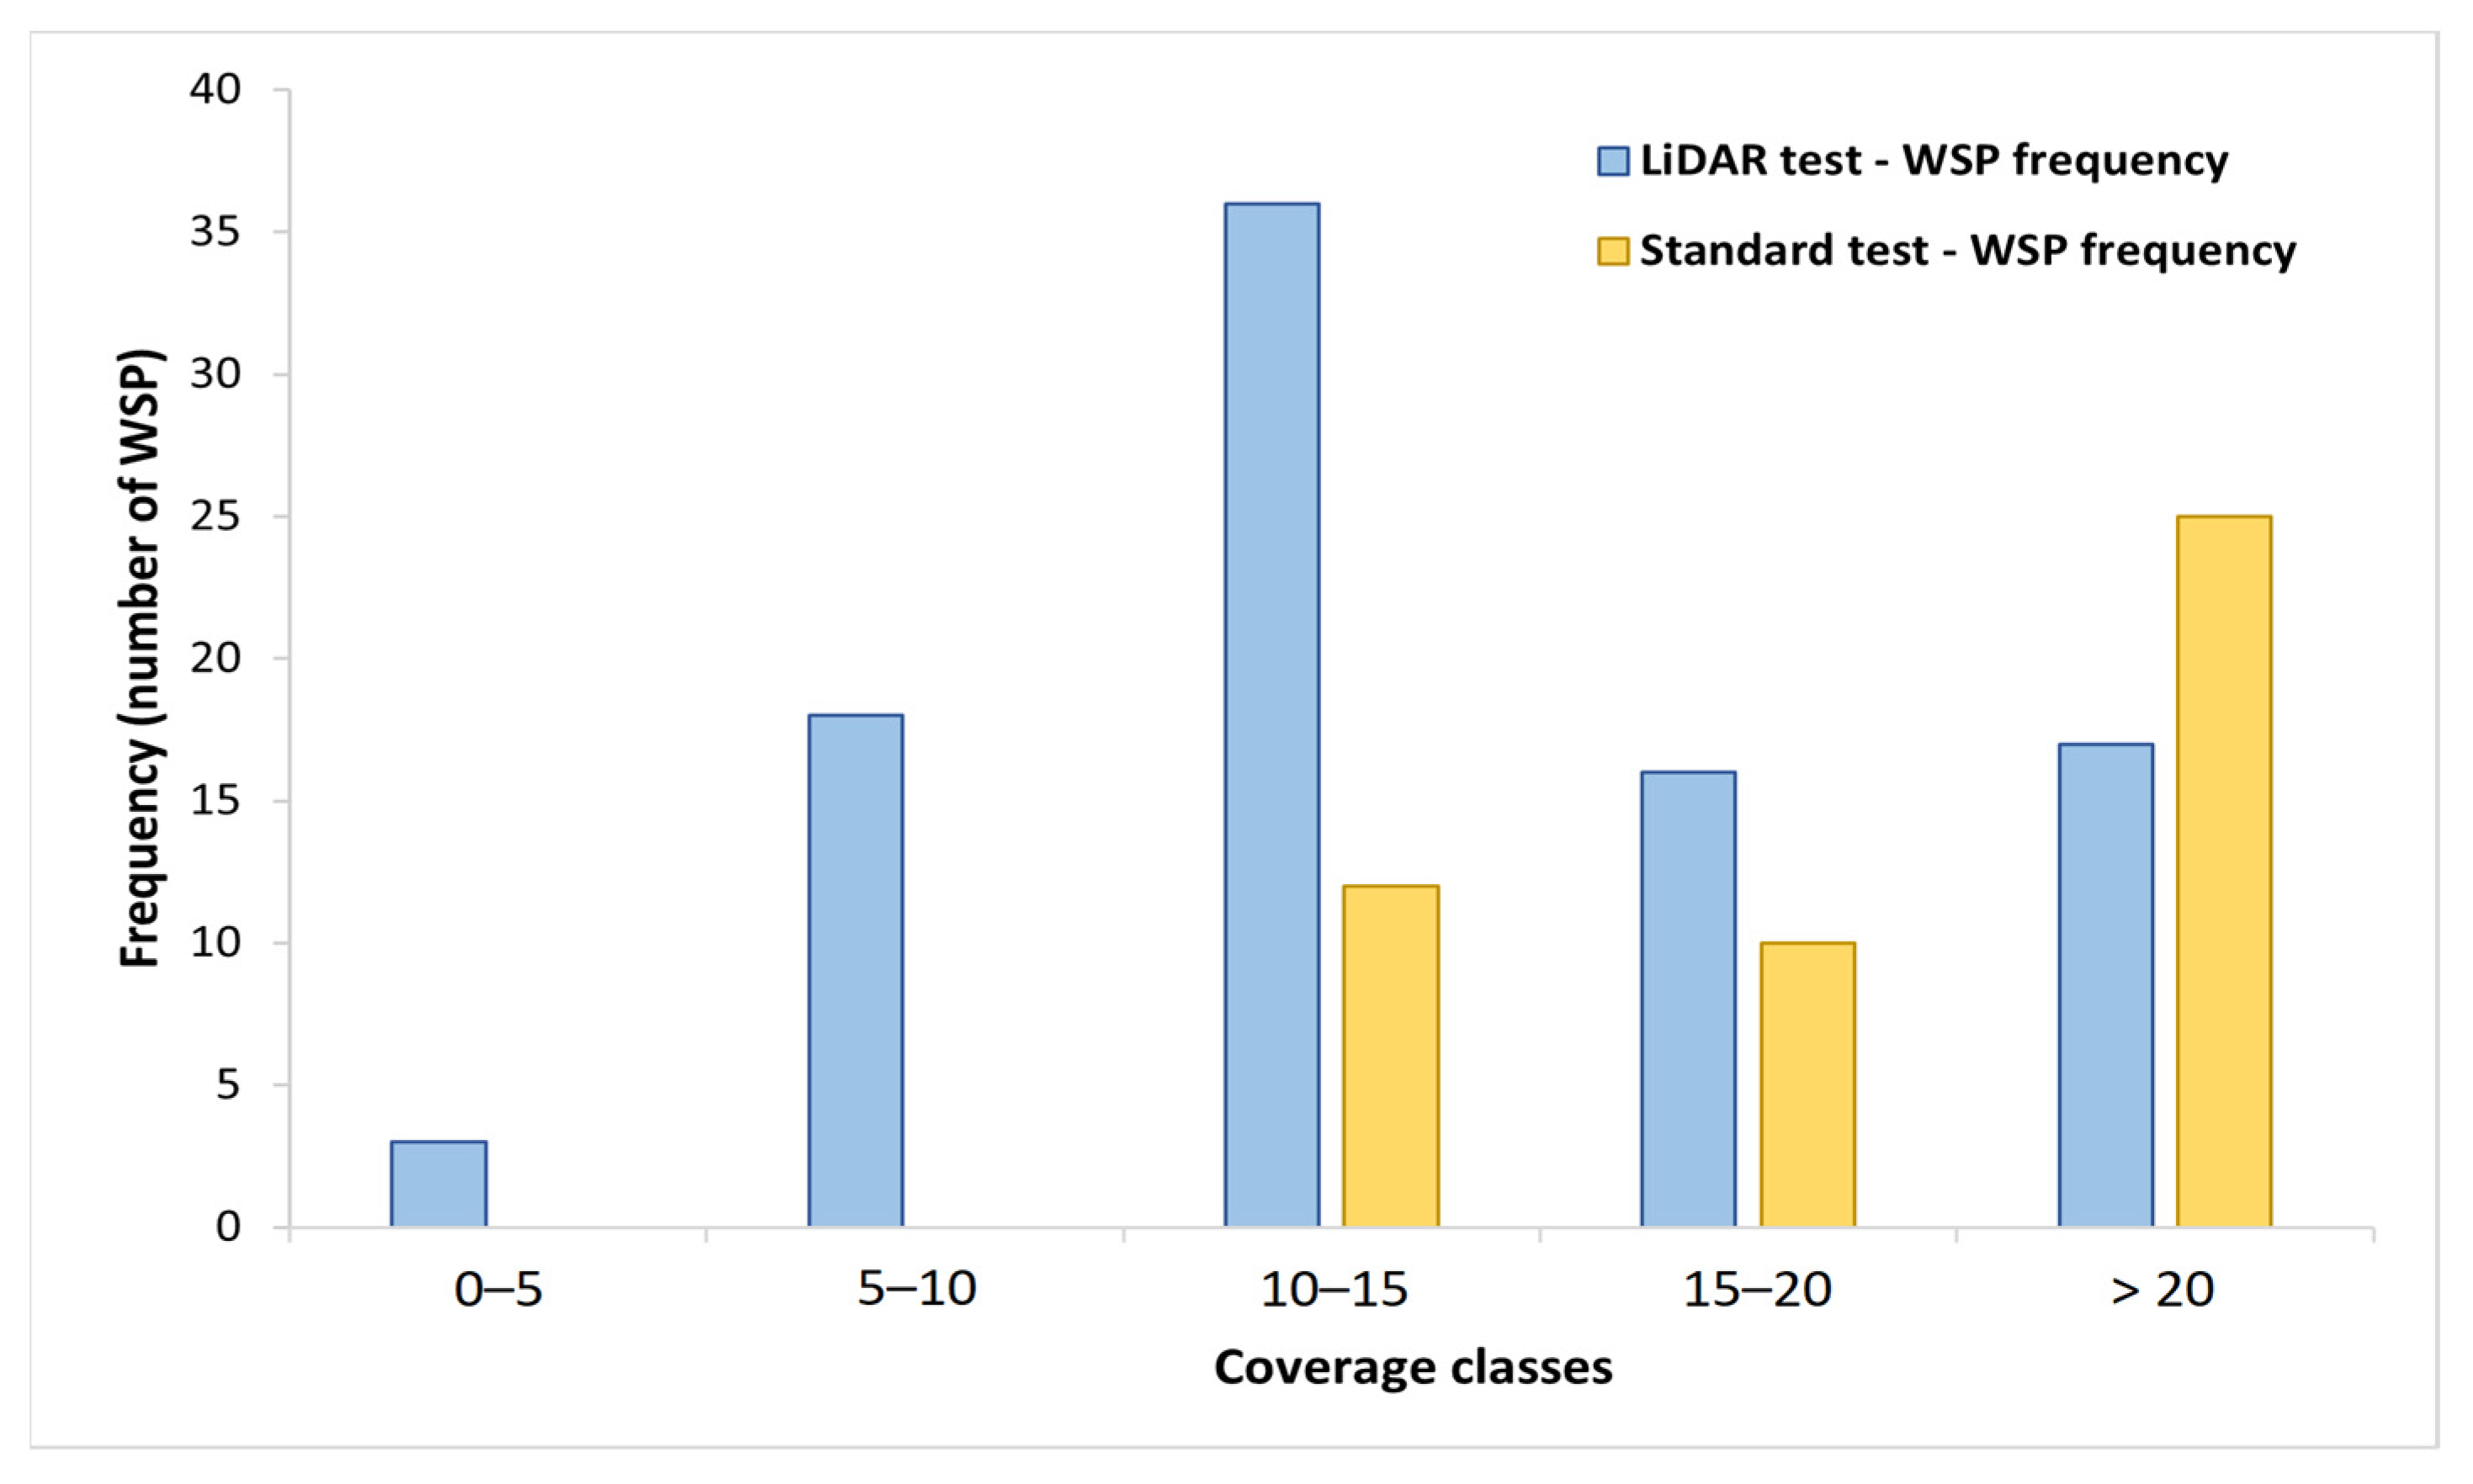
- The frequency of LiDAR vines gaps has a bell-shaped distribution, with the maximum frequency around 10–15%, and the variability observed with smart sprayer maybe depends on the variability of gaps size (small gaps are harder to spot than very large gaps, so it means that more agrochemicals is distributed on small gaps).
- The frequency of Standard vines gaps reflects an exponential trend, considering that the last coverage classes is “over 20%”.
5. Conclusions
Author Contributions
Funding
Institutional Review Board Statement
Informed Consent Statement
Data Availability Statement
Acknowledgments
Conflicts of Interest
References
- Roy, R.N.; Food and Agriculture Organization of the United Nations (Eds.) Plant Nutrition for Food Security: A Guide for Integrated Nutrient Management; FAO Fertilizer and Plant Nutrition Bulletin; Food and Agriculture Organization of the United Nations: Rome, Italy, 2006; ISBN 978-92-5-105490-1. [Google Scholar]
- Bongiovanni, R.; Lowenberg-Deboer, J. Precision Agriculture and Sustainability. Precis. Agric. 2004, 5, 359–387. [Google Scholar] [CrossRef]
- Calvitti, M.; Colonna, N.; Iannetta, M. La relazione cambiamenti climatici e sistema agricolo tra adattamento e mitigazione. Energ. Ambiente e Innov. 2016, 1, 74–81. [Google Scholar] [CrossRef]
- Pierce, F.J.; Nowak, P. Aspects of Precision Agriculture. Adv. Agron. 1999, 67, 1–85. [Google Scholar]
- Chamara, N.; Islam, M.D.; Bai, G.F.; Shi, Y.; Ge, Y. Ag-IoT for Crop and Environment Monitoring: Past, Present, and Future. Agric. Syst. 2022, 203, 103497. [Google Scholar] [CrossRef]
- Kazlauskas, M.; Bručienė, I.; Jasinskas, A.; Šarauskis, E. Comparative Analysis of Energy and GHG Emissions Using Fixed and Variable Fertilization Rates. Agronomy 2021, 11, 138. [Google Scholar] [CrossRef]
- Núñez-Cárdenas, P.; Diezma, B.; San Miguel, G.; Valero, C.; Correa, E.C. Environmental LCA of Precision Agriculture for Stone Fruit Production. Agronomy 2022, 12, 1545. [Google Scholar] [CrossRef]
- Wang, D.; Prato, T.; Qiu, Z.; Kitchen, N.R.; Sudduth, K.A. Economic and Environmental Evaluation of Variable Rate Nitrogen and Lime Application for Claypan Soil Fields. Precis. Agric. 2003, 4, 35–52. [Google Scholar] [CrossRef]
- Balafoutis, A.; Beck, B.; Fountas, S.; Vangeyte, J.; Wal, T.; Soto, I.; Gómez-Barbero, M.; Barnes, A.; Eory, V. Precision Agriculture Technologies Positively Contributing to GHG Emissions Mitigation, Farm Productivity and Economics. Sustainability 2017, 9, 1339. [Google Scholar] [CrossRef]
- Gadoury, D.M.; Cadle-Davidson, L.; Wilcox, W.F.; Dry, I.B.; Seem, R.C.; Milgroom, M.G. Grapevine Powdery Mildew (Erysiphe Necator): A Fascinating System for the Study of the Biology, Ecology and Epidemiology of an Obligate Biotroph: Grapevine Powdery Mildew. Mol. Plant Pathol. 2012, 13, 1–16. [Google Scholar] [CrossRef]
- Gessler, C.; Pertot, I.; Perazzolli, M. Plasmopara viticola: A Review of Knowledge on Downy Mildew of Grapevine and Effective Disease Management. Phytopathol. Mediterr. 2011, 50, 3–44. [Google Scholar]
- European Commission. A Farm to Fork Strategy for a Fair, Healthy and Environmentally-Friendly Food System; European Commission: Brussels, Belgium, 2020. [Google Scholar]
- Sharda, A.; Fulton, J.P.; McDonald, T.P.; Brodbeck, C.J. Real-Time Nozzle Flow Uniformity When Using Automatic Section Control on Agricultural Sprayers. Comput. Electron. Agric. 2011, 79, 169–179. [Google Scholar] [CrossRef]
- Alam, M.; Alam, M.S.; Roman, M.; Tufail, M.; Khan, M.U.; Khan, M.T. Real-Time Machine-Learning Based Crop/Weed Detection and Classification for Variable-Rate Spraying in Precision Agriculture. In Proceedings of the 2020 7th International Conference on Electrical and Electronics Engineering (ICEEE), Antalya, Turkey, 14–16 April 2020; IEEE: Antalya, Turkey, 2020; pp. 273–280. [Google Scholar]
- Le Cointe, R.; Simon, T.E.; Delarue, P.; Hervé, M.; Leclerc, M.; Poggi, S. Reducing the Use of Pesticides with Site-Specific Application: The Chemical Control of Rhizoctonia solani as a Case of Study for the Management of Soil-Borne Diseases. PLoS ONE 2016, 11, e0163221. [Google Scholar] [CrossRef] [PubMed] [Green Version]
- Zanin, A.R.A.; Neves, D.C.; Teodoro, L.P.R.; da Silva Júnior, C.A.; da Silva, S.P.; Teodoro, P.E.; Baio, F.H.R. Reduction of Pesticide Application via Real-Time Precision Spraying. Sci. Rep. 2022, 12, 5638. [Google Scholar] [CrossRef]
- Abbas, I.; Liu, J.; Faheem, M.; Noor, R.S.; Shaikh, S.A.; Solangi, K.A.; Raza, S.M. Different Sensor Based Intelligent Spraying Systems in Agriculture. Sens. Actuators Phys. 2020, 316, 112265. [Google Scholar] [CrossRef]
- Mehendale, N.; Neoge, S. Review on Lidar Technology. SSRN Electron. J. 2020, 9. [Google Scholar] [CrossRef]
- Xia, S.; Chen, D.; Wang, R.; Li, J.; Zhang, X. Geometric Primitives in LiDAR Point Clouds: A Review. IEEE J. Sel. Top. Appl. Earth Obs. Remote Sens. 2020, 13, 685–707. [Google Scholar] [CrossRef]
- Baek, N.; Shin, W.S.; Kim, K.J. Geometric Primitive Extraction from LiDAR-Scanned Point Clouds. Clust. Comput. 2017, 20, 741–748. [Google Scholar] [CrossRef]
- Raj, T.; Hashim, F.H.; Huddin, A.B.; Ibrahim, M.F.; Hussain, A. A Survey on LiDAR Scanning Mechanisms. Electronics 2020, 9, 741. [Google Scholar] [CrossRef]
- Royo, S.; Ballesta-Garcia, M. An Overview of Lidar Imaging Systems for Autonomous Vehicles. Appl. Sci. 2019, 9, 4093. [Google Scholar] [CrossRef]
- Ls, L. LS Lidar MS03. Available online: https://www.lslidar.com/en/mso/79 (accessed on 17 October 2022).
- Sick, S. SICK TiM1xx. Available online: https://www.sick.com/it/it/soluzioni-di-misurazione-e-rilevamento/sensori-2d-lidar/tim/c/g570093 (accessed on 17 October 2022).
- Gregorio, E.; Torrent, X.; Planas, S.; Rosell-Polo, J.R. Assessment of Spray Drift Potential Reduction for Hollow-Cone Nozzles: Part 2. LiDAR Technique. Sci. Total Environ. 2019, 687, 967–977. [Google Scholar] [CrossRef]
- Liu, B.; Li, L.; Zhang, R.; Tang, Q.; Ding, C.; Xu, G.; Hewitt, A.J.; Chen, L. Analysis of the Spatial and Temporal Distribution of a Spray Cloud Using Commercial LiDAR. Biosyst. Eng. 2022, 223, 78–96. [Google Scholar] [CrossRef]
- Ravier, I.; Haouisee, E.; Clément, M.; Seux, R.; Briand, O. Field Experiments for the Evaluation of Pesticide Spray-Drift on Arable Crops. Pest Manag. Sci. 2005, 61, 728–736. [Google Scholar] [CrossRef] [PubMed]
- Bedos, C.; Cellier, P.; Calvet, R.; Barriuso, E.; Gabrielle, B. Mass Transfer of Pesticides into the Atmosphere by Volatilization from Soils and Plants: Overview. Agronomie 2002, 22, 21–33. [Google Scholar] [CrossRef]
- Hossein, M.; Saeid, M.; Barat, G.; Hassan, M. Agricultural Sustainable Development by Variable-Rate Spraying. Int. J. Agron. Plant Prod. 2013, 4, 3455–3462. [Google Scholar]
- Hassen, N.S.; Sidik, N.A.C.; Sheriff, J.M. Advanced Techniques for Reducing Spray Losses in Agrochemical Application System. Life Sci. J. 2014, 11, 56–66. [Google Scholar]
- Seol, J.; Kim, J.; Son, H.I. Spray Drift Segmentation for Intelligent Spraying System Using 3D Point Cloud Deep Learning Framework. IEEE Access 2022, 10, 77263–77271. [Google Scholar] [CrossRef]
- Gil, E.; Arnó, J.; Llorens, J.; Sanz, R.; Llop, J.; Rosell-Polo, J.; Gallart, M.; Escolà, A. Advanced Technologies for the Improvement of Spray Application Techniques in Spanish Viticulture: An Overview. Sensors 2014, 14, 691–708. [Google Scholar] [CrossRef]
- Boatwright, H.; Zhu, H.; Clark, A.; Schnabel, G. Evaluation of the Intelligent Sprayer System in Peach Production. Plant Dis. 2020, 104, 3207–3212. [Google Scholar] [CrossRef]
- Salcedo, R.; Zhu, H.; Ozkan, E.; Falchieri, D.; Zhang, Z.; Wei, Z. Reducing Ground and Airborne Drift Losses in Young Apple Orchards with PWM-Controlled Spray Systems. Comput. Electron. Agric. 2021, 189, 106389. [Google Scholar] [CrossRef]
- Zhu, H.; Salyani, M.; Fox, R.D. A Portable Scanning System for Evaluation of Spray Deposit Distribution. Comput. Electron. Agric. 2011, 76, 38–43. [Google Scholar] [CrossRef]
- Chen, Y.; Ozkan, E.; Zhu, H.; Derksen, R.; Krause, C.R. Spray Deposition inside Tree Canopies from a Newly Developed Variable-Rate Air-Assisted Sprayer. Trans. ASABE 2013, 56, 1263–1272. [Google Scholar] [CrossRef]
- Nansen, C.; Ferguson, J.C.; Moore, J.; Groves, L.; Emery, R.; Garel, N.; Hewitt, A. Optimizing Pesticide Spray Coverage Using a Novel Web and Smartphone Tool, SnapCard. Agron. Sustain. Dev. 2015, 35, 1075–1085. [Google Scholar] [CrossRef]
- Brandoli, B.; Spadon, G.; Esau, T.; Hennessy, P.; Carvalho, A.C.P.L.; Amer-Yahia, S.; Rodrigues, J.F., Jr. DropLeaf: A Precision Farming Smartphone Tool for Real-Time Quantification of Pesticide Application Coverage. Comput. Electron. Agric. 2021, 180, 105906. [Google Scholar] [CrossRef]
- Beyaz, A.; Dagtekin, M.; Cilingir, I.; Gerdan, D. Evaluation of Droplet Size Spectra for Agricultural Pesticide Application Using Water Sensitive Paper and Image Analysis Techniques. Fresenius Environ. Bull. 2017, 26, 102–108. [Google Scholar]
- Cerruto, E.; Manetto, G.; Longo, D.; Failla, S.; Papa, R. A Model to Estimate the Spray Deposit by Simulated Water Sensitive Papers. Crop. Prot. 2019, 124, 104861. [Google Scholar] [CrossRef]
- Li, X.; Giles, D.K.; Andaloro, J.T.; Long, R.; Lang, E.B.; Watson, L.J.; Qandah, I. Comparison of UAV and fixed-wing Aerial Application for Alfalfa Insect Pest Control: Evaluating Efficacy, Residues, and Spray Quality. Pest Manag. Sci. 2021, 77, 4980–4992. [Google Scholar] [CrossRef]
- Tiffi Magi, A. Valutazione Della Funzionalità di Distribuzione di un Atomizzatore Innovativo; Università Politecnica delle Marche: Ancona, Italy, 2021. [Google Scholar]
- Romanazzi, G.; Mancini, V.; Feliziani, E.; Servili, A.; Endeshaw, S.; Neri, D. Impact of Alternative Fungicides on Grape Downy Mildew Control and Vine Growth and Development. Plant Dis. 2016, 100, 739–748. [Google Scholar] [CrossRef]
- McKinney, H.H. A New System of Grading Plant Diseases. J. Agric. Res. 1923, 26, 195–218. [Google Scholar]
- La Torre, A.; Iovino, V.; Caradonia, F. Copper in Plant Protection: Current Situation and Prospects. Phytopathol. Mediterr. 2018, 57, 201–236. [Google Scholar] [CrossRef]
- Duca, D.; Toscano, G.; Pizzi, A.; Rossini, G.; Fabrizi, S.; Lucesoli, G.; Servili, A.; Mancini, V.; Romanazzi, G.; Mengarelli, C. Evaluation of the Characteristics of Vineyard Pruning Residues for Energy Applications: Effect of Different Copper-Based Treatments. J. Agric. Eng. 2016, 47, 22. [Google Scholar] [CrossRef]
- Hobbelen, P.H.F.; Koolhaas, J.E.; van Gestel, C.A.M. Bioaccumulation of Heavy Metals in the Earthworms Lumbricus rubellus and Aporrectodea caliginosa in Relation to Total and Available Metal Concentrations in Field Soils. Environ. Pollut. 2006, 144, 639–646. [Google Scholar] [CrossRef] [PubMed]
- Rusjan, D.; Strlič, M.; Pucko, D.; Korošec-Koruza, Z. Copper Accumulation Regarding the Soil Characteristics in Sub-Mediterranean Vineyards of Slovenia. Geoderma 2007, 141, 111–118. [Google Scholar] [CrossRef]
- Komárek, M.; Čadková, E.; Chrastný, V.; Bordas, F.; Bollinger, J.-C. Contamination of Vineyard Soils with Fungicides: A Review of Environmental and Toxicological Aspects. Environ. Int. 2010, 36, 138–151. [Google Scholar] [CrossRef] [PubMed]
- Garde-Cerdán, T.; Mancini, V.; Carrasco-Quiroz, M.; Servili, A.; Gutiérrez-Gamboa, G.; Foglia, R.; Pérez-Álvarez, E.P.; Romanazzi, G. Chitosan and Laminarin as Alternatives to Copper for Plasmopara Viticola Control: Effect on Grape Amino Acid. J. Agric. Food Chem. 2017, 65, 7379–7386. [Google Scholar] [CrossRef] [PubMed]
- European Commission. Commission Implementing Regulation (EU) 2018/1981 of 13 December 2018—Renewing the Approval of the Active Substances Copper Compounds, as Candidates for Substitution, in Accordance with Regulation (EC) No 1107/2009 of the European Parliament and of the Council Concerning the Placing of Plant Protection Products on the Market and Amending the Annex to Commission Implementing Regulation (EU) No 540/2011. Off. J. Eur. Union 2018, 317, 16–20. [Google Scholar]
- Romanazzi, G.; Orçonneau, Y.; Moumni, M.; Davillerd, Y.; Marchand, P.A. Basic Substances, a Sustainable Tool to Complement and Eventually Replace Synthetic Pesticides in the Management of Pre and Postharvest Diseases: Reviewed Instructions for Users. Molecules 2022, 27, 3484. [Google Scholar] [CrossRef]
- Romanazzi, G.; Mancini, V.; Foglia, R.; Marcolini, D.; Kavari, M.; Piancatelli, S. Use of Chitosan and Other Natural Compounds Alone or in Different Strategies with Copper Hydroxide for Control of Grapevine Downy Mildew. Plant Dis. 2021, 105, 3261–3268. [Google Scholar] [CrossRef]
- European Commission. Commission Directive (EU) 2019/782 of 15 May 2019—Amending Directive 2009/128/EC of the European Parliament and of the Council as Regards the Establishment of Harmonised Risk Indicators. Off. J. Eur. Union 2019, 127, 7. [Google Scholar]


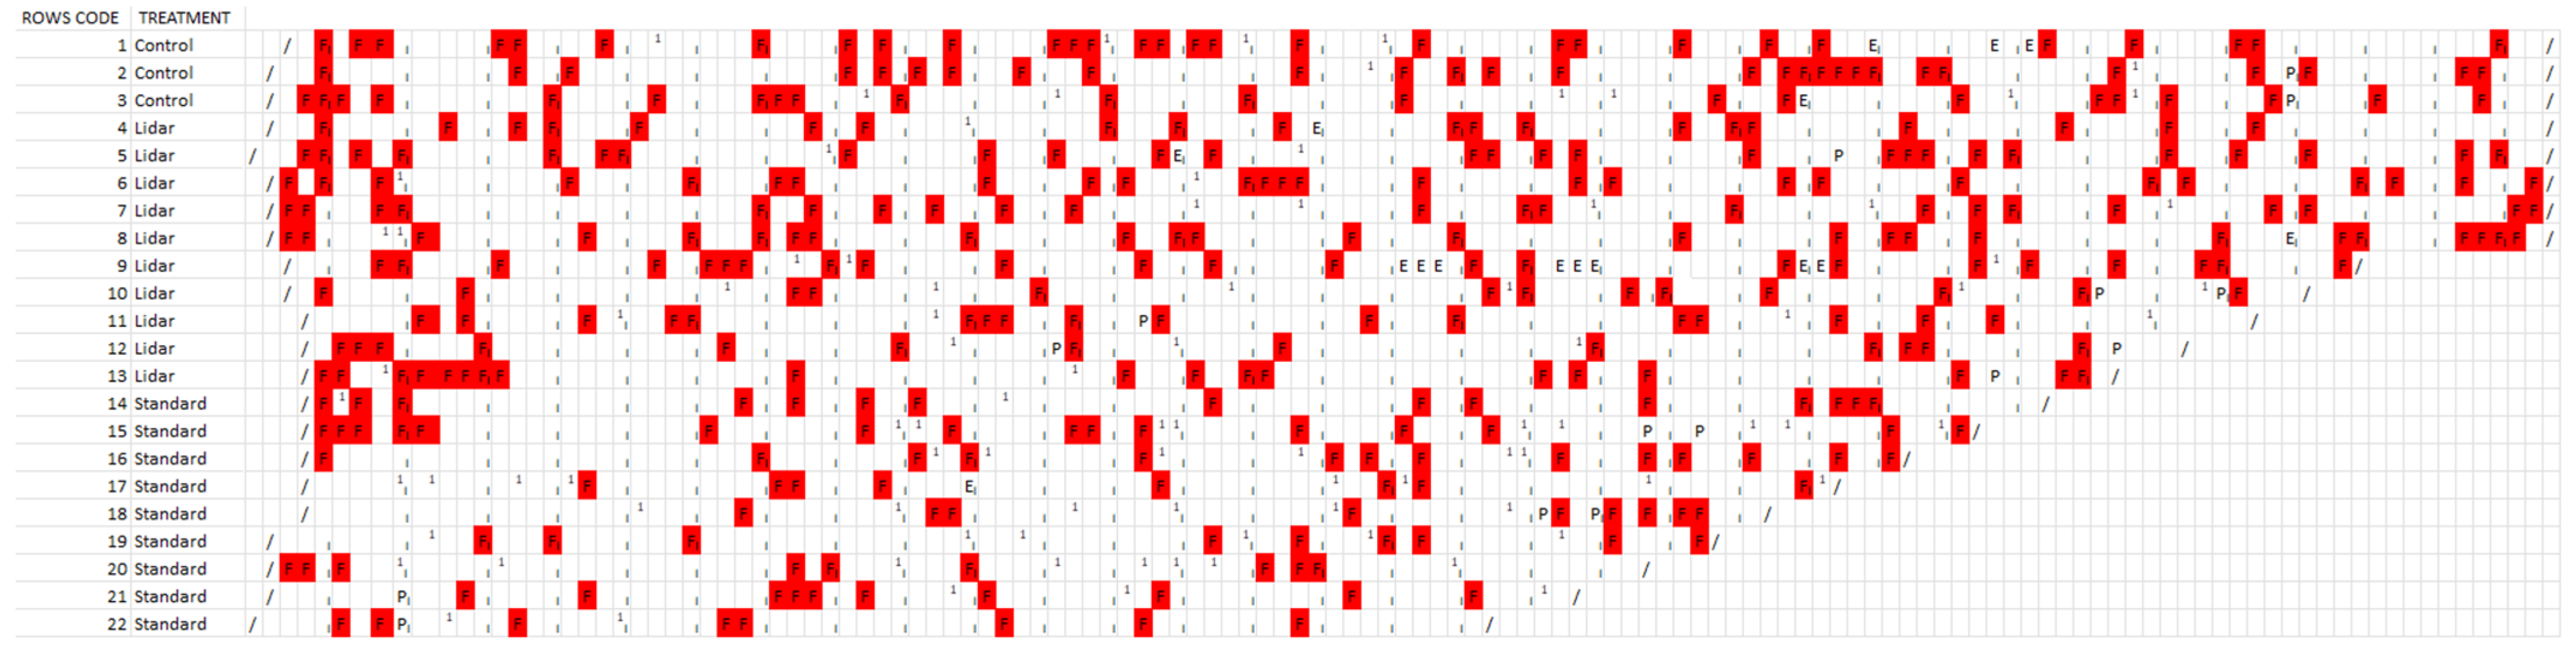
| Caption | Legend |
|---|---|
| vines gaps | F (red) |
| vines end post | / |
| vines support post | | |
| vines close to desiccation | 1 |
| vines gaps on end post or support post | F/—F| |
| vines close to desiccation on end post or support post | 1/—1| |
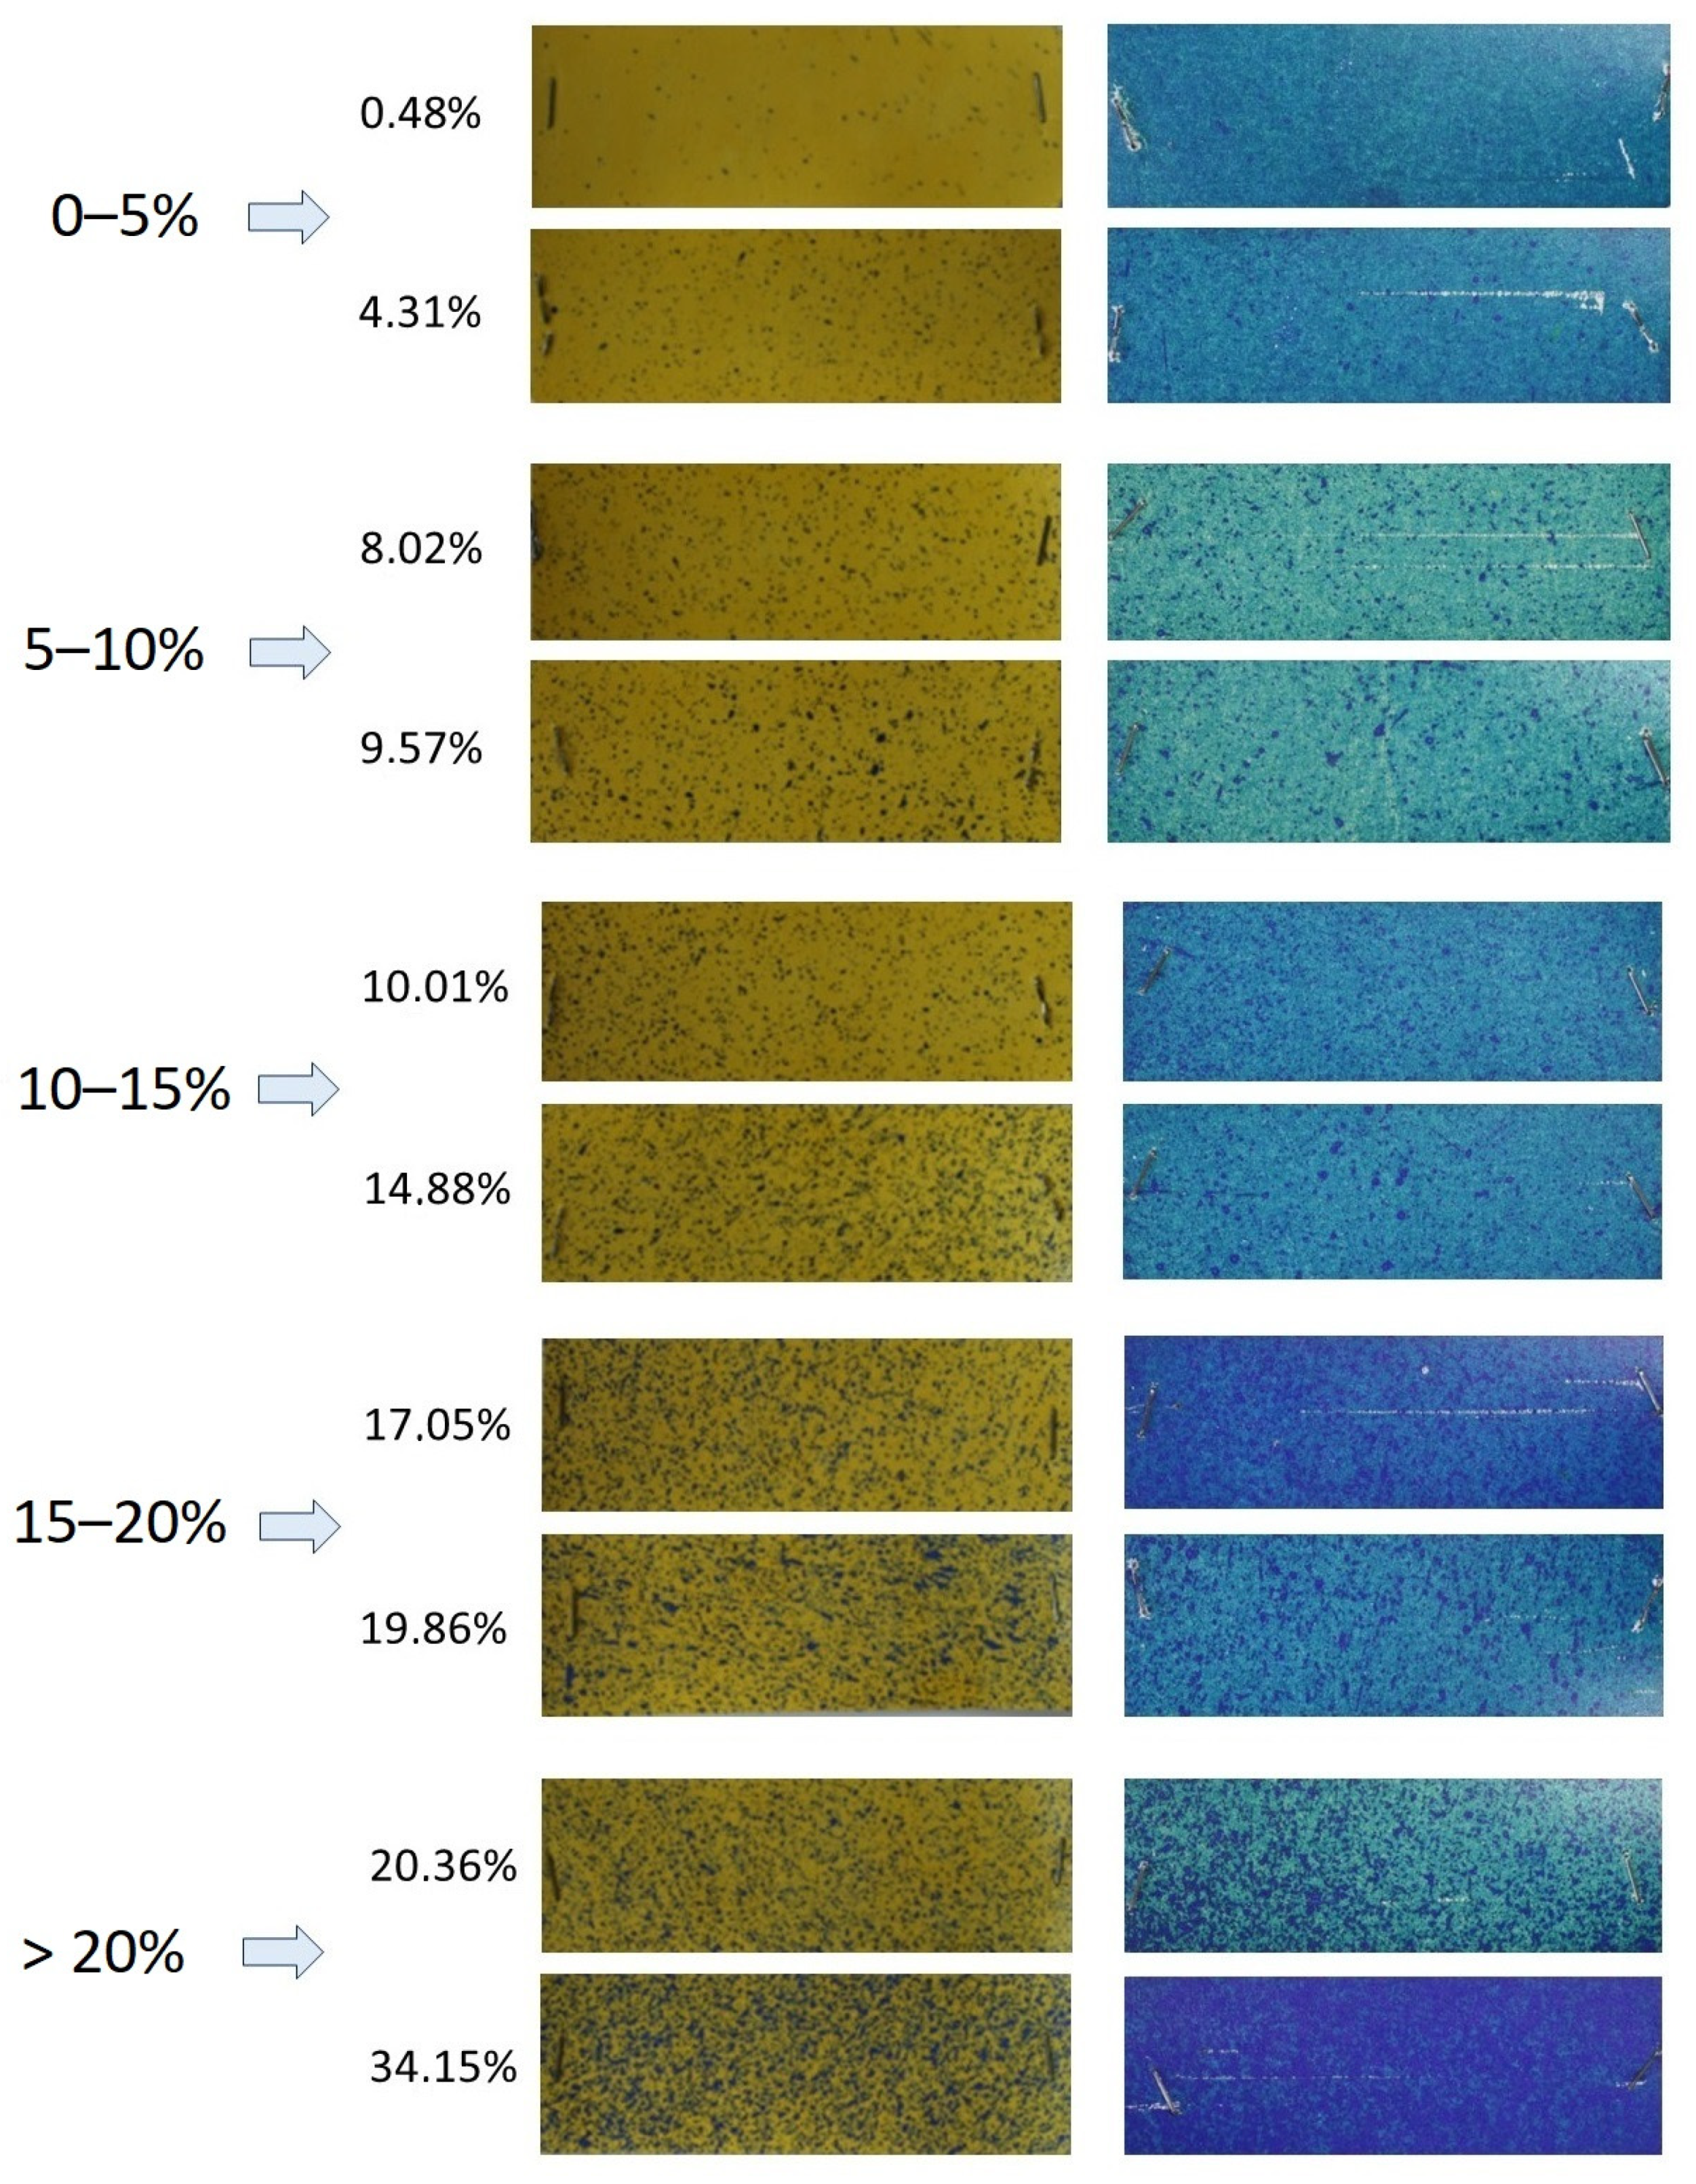
| Coverage Classes | Coverage Range (%) |
|---|---|
| 1 | 0–5 |
| 2 | 5–10 |
| 3 | 10–15 |
| 4 | 15–20 |
| 5 | >20 * |
| Thesis: LiDAR Gaps | ||||||||
|---|---|---|---|---|---|---|---|---|
| Block 1 | Block 2 | Block 3 | ||||||
| Number | Thread Position | Coverage Classes | Number | Thread Position | Coverage Classes | Number | Thread Position | Coverage Classes |
| 1 | 1 | 5 | 1 | 1 | 2 | 1 | 1 | 5 |
| 2 | 5 | 2 | 2 | 2 | 3 | |||
| 2 | 1 | 3 | 2 | 1 | 3 | 2 | 1 | 2 |
| 2 | 3 | 2 | 3 | 2 | 2 | |||
| 3 | 1 | 5 | 3 | 1 | 4 | 3 | 1 | 4 |
| 2 | 3 | 2 | 5 | 2 | 3 | |||
| 4 | 1 | 1 | 4 | 1 | 5 | 4 | 1 | 3 |
| 2 | 2 | 2 | 4 | 2 | 2 | |||
| 5 | 1 | 3 | 5 | 1 | 2 | 5 | 1 | 2 |
| 2 | 1 | 2 | 4 | 2 | 2 | |||
| 6 | 1 | 4 | 6 | 1 | 4 | 6 | 1 | 5 |
| 2 | 3 | 2 | 4 | 2 | 3 | |||
| 7 | 1 | 3 | 7 | 1 | 2 | 7 | 1 | 5 |
| 2 | 3 | 2 | 3 | 2 | 4 | |||
| 8 | 1 | 3 | 8 | 1 | 3 | 8 | 1 | 2 |
| 2 | 3 | 2 | 2 | 2 | 2 | |||
| 9 | 1 | 2 | 9 | 1 | 3 | 9 | 1 | 3 |
| 2 | 3 | 2 | 3 | 2 | 4 | |||
| 10 | 1 | 3 | 10 | 1 | 5 | 10 | 1 | 5 |
| 2 | 3 | 2 | 4 | 2 | 4 | |||
| 11 | 1 | 3 | 11 | 1 | 3 | 11 | 1 | 5 |
| 2 | 5 | 2 | 3 | 2 | 4 | |||
| 12 | 1 | 4 | 12 | 1 | 3 | 12 | 1 | 3 |
| 2 | 4 | 2 | 5 | 2 | 2 | |||
| 13 | 1 | 3 | 13 | 1 | 3 | 13 | 1 | 5 |
| 2 | 3 | 2 | 3 | 2 | 5 | |||
| 14 | 1 | 1 | 14 | 1 | 5 | 14 | 1 | 3 |
| 2 | 3 | 2 | 2 | 2 | 5 | |||
| 15 | 1 | 2 | 15 | 1 | 3 | 15 | 1 | 4 |
| 2 | 2 | 2 | 4 | 2 | 3 | |||
| Thesis: STANDARD Gaps | ||||||||
|---|---|---|---|---|---|---|---|---|
| Block 1 | Block 2 | Block 3 | ||||||
| Number | Thread Position | Coverage Classes | Number | Thread Position | Coverage Classes | Number | Thread Position | Coverage Classes |
| 1 | 1 | 5 | 1 | 1 | 5 | 1 | 1 | n/a |
| 2 | n/a | 2 | 4 | 2 | n/a | |||
| 2 | 1 | 5 | 2 | 1 | 5 | 2 | 1 | n/a |
| 2 | 5 | 2 | 3 | 2 | n/a | |||
| 3 | 1 | n/a | 3 | 1 | 5 | 3 | 1 | n/a |
| 2 | n/a | 2 | 5 | 2 | n/a | |||
| 4 | 1 | n/a | 4 | 1 | 5 | 4 | 1 | n/a |
| 2 | n/a | 2 | 5 | 2 | n/a | |||
| 5 | 1 | 5 | 5 | 1 | 5 | 5 | 1 | n/a |
| 2 | 5 | 2 | 5 | 2 | n/a | |||
| 6 | 1 | 5 | 6 | 1 | 4 | 6 | 1 | n/a |
| 2 | 4 | 2 | 3 | 2 | n/a | |||
| 7 | 1 | n/a | 7 | 1 | 3 | 7 | 1 | n/a |
| 2 | n/a | 2 | 3 | 2 | n/a | |||
| 8 | 1 | n/a | 8 | 1 | 3 | 8 | 1 | n/a |
| 2 | 3 | 2 | 3 | 2 | n/a | |||
| 9 | 1 | n/a | 9 | 1 | 4 | 9 | 1 | n/a |
| 2 | 5 | 2 | 4 | 2 | n/a | |||
| 10 | 1 | n/a | 10 | 1 | 3 | 10 | 1 | n/a |
| 2 | n/a | 2 | 3 | 2 | n/a | |||
| 11 | 1 | 5 | 11 | 1 | 4 | 11 | 1 | n/a |
| 2 | 5 | 2 | 5 | 2 | n/a | |||
| 12 | 1 | 5 | 12 | 1 | 4 | 12 | 1 | n/a |
| 2 | 4 | 2 | 3 | 2 | n/a | |||
| 13 | 1 | n/a | 13 | 1 | 3 | 13 | 1 | n/a |
| 2 | n/a | 2 | 3 | 2 | n/a | |||
| 14 | 1 | 5 | 14 | 1 | 5 | 14 | 1 | n/a |
| 2 | 4 | 2 | 5 | 2 | n/a | |||
| 15 | 1 | 5 | 15 | 1 | 5 | 15 | 1 | n/a |
| 2 | 5 | 2 | 4 | 2 | n/a | |||
| Coverage Classes | Coverage Range (%) | Lidar Vines Gaps Frequency | Standard Vines Gaps Frequency |
|---|---|---|---|
| 1 | 0–5 | 3 | 0 |
| 2 | 5–10 | 18 | 0 |
| 3 | 10–15 | 36 | 12 |
| 4 | 15–20 | 16 | 10 |
| 5 | >20 | 17 | 25 |
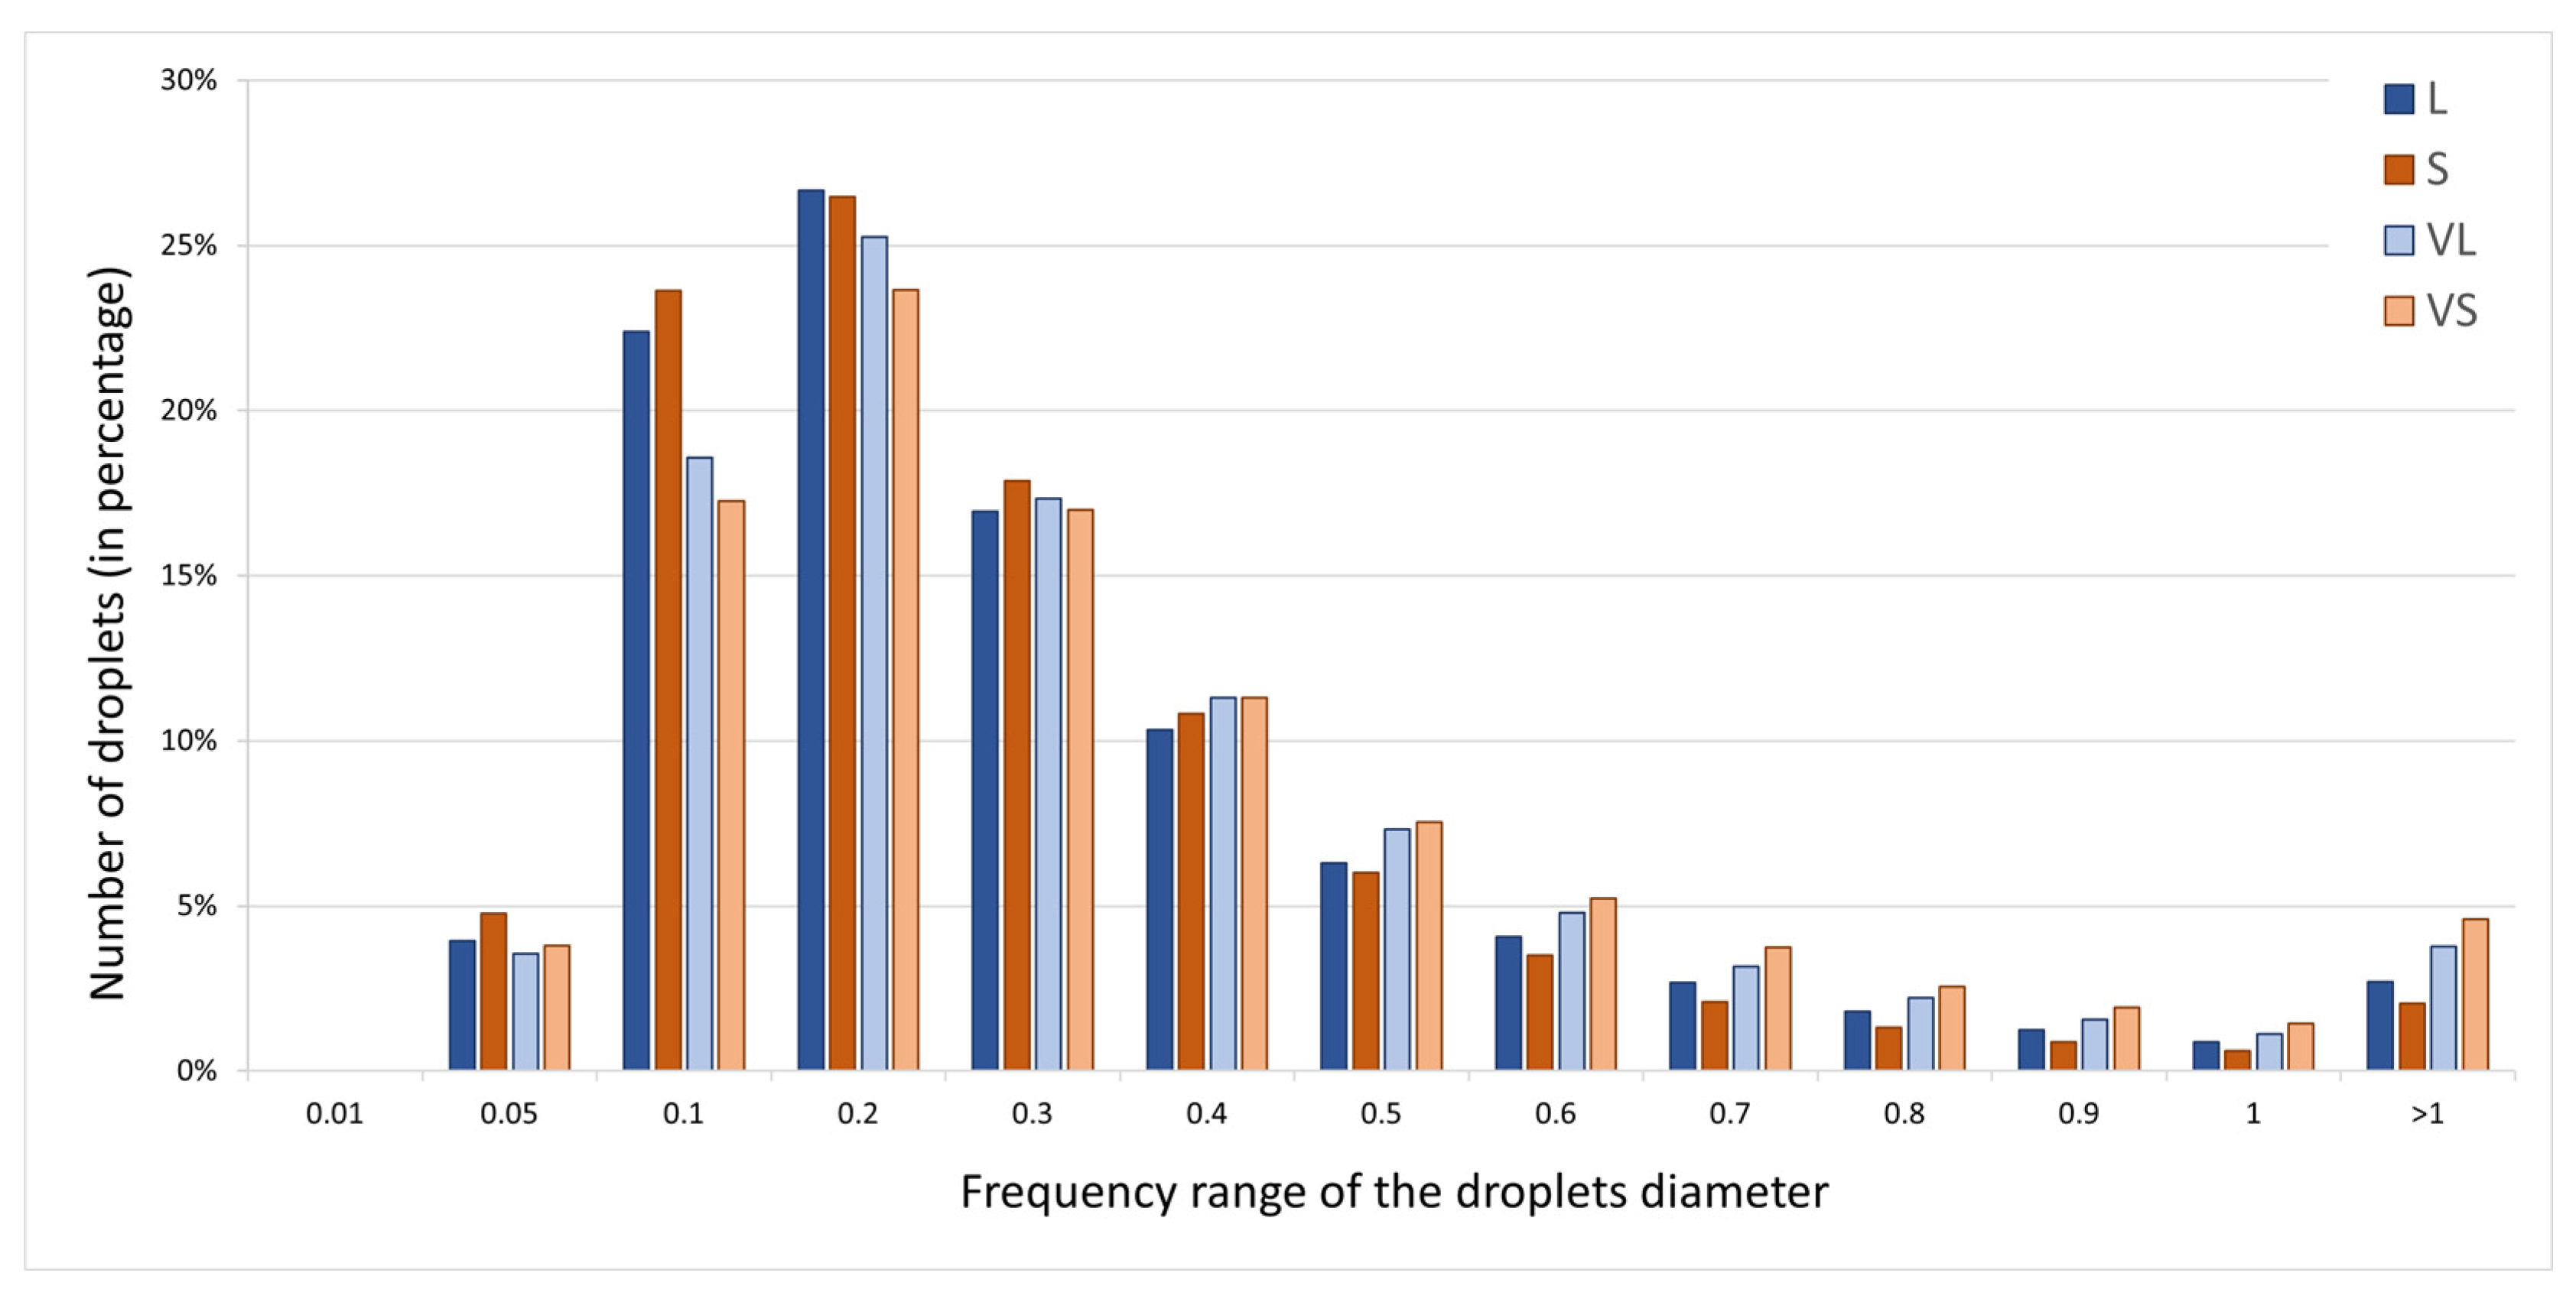
| Number of Droplets (in Percentage) | ||||
|---|---|---|---|---|
| Diameter Classes (mm) | L * | S * | VL * | VS * |
| 0.01 | 0 | 0 | 0 | 0 |
| 0.05 | 3.9% | 4.8% | 3.6% | 3.8% |
| 0.1 | 22.4% | 23.6% | 18.6% | 17.3% |
| 0.2 | 26.7% | 26.5% | 25.2% | 23.7% |
| 0.3 | 16.9% | 17.9% | 17.3% | 17.0% |
| 0.4 | 10.3% | 10.8% | 11.3% | 11.3% |
| 0.5 | 6.3% | 6.0% | 7.3% | 7.5% |
| 0.6 | 4.1% | 3.5% | 4.8% | 5.2% |
| 0.7 | 2.7% | 2.1% | 3.2% | 3.8% |
| 0.8 | 1.8% | 1.3% | 2.2% | 2.6% |
| 0.9 | 1.3% | 0.9% | 1.5% | 1.9% |
| 1 | 0.9% | 0.6% | 1.1% | 1.4% |
| >1 | 2.7% | 2.0% | 3.8% | 4.6% |
| Treatments | GPM 23 July 2021 | GDM 10 September 2021 | ||||
|---|---|---|---|---|---|---|
| Incidence (%) | Severity (1–7) | McKinney Index (%) | Incidence (%) | Severity (1–7) | McKinney Index (%) | |
| Untreated control | 1.72 ± 4.40 a | 1.83 ± 1.33 a | 0.47 ± 1.51 a | 9.34 ± 13.13 a | 1.80 ± 1.01 a | 2.58 ± 3.91 ab |
| LiDAR | 2.11 ± 4.56 a | 1.33 ± 0.71 b | 0.40 ± 0.95 a | 3.81 ± 7.26 b | 2.12 ± 1.42 a | 0.98 ± 1.76 b |
| Conventional sprayer | 1.36 ± 7.70 a | 1.00 ± 0.00 c | 0.19 ± 1.10 a | 11.21 ± 15.31 a | 2.00 ± 1.19 a | 3.21 ± 4.92 a |
Disclaimer/Publisher’s Note: The statements, opinions and data contained in all publications are solely those of the individual author(s) and contributor(s) and not of MDPI and/or the editor(s). MDPI and/or the editor(s) disclaim responsibility for any injury to people or property resulting from any ideas, methods, instructions or products referred to in the content. |
© 2023 by the authors. Licensee MDPI, Basel, Switzerland. This article is an open access article distributed under the terms and conditions of the Creative Commons Attribution (CC BY) license (https://creativecommons.org/licenses/by/4.0/).
Share and Cite
Ilari, A.; Piancatelli, S.; Centorame, L.; Moumni, M.; Romanazzi, G.; Foppa Pedretti, E. Distribution Quality of Agrochemicals for the Revamping of a Sprayer System Based on Lidar Technology and Grapevine Disease Management. Appl. Sci. 2023, 13, 2222. https://doi.org/10.3390/app13042222
Ilari A, Piancatelli S, Centorame L, Moumni M, Romanazzi G, Foppa Pedretti E. Distribution Quality of Agrochemicals for the Revamping of a Sprayer System Based on Lidar Technology and Grapevine Disease Management. Applied Sciences. 2023; 13(4):2222. https://doi.org/10.3390/app13042222
Chicago/Turabian StyleIlari, Alessio, Simone Piancatelli, Luana Centorame, Marwa Moumni, Gianfranco Romanazzi, and Ester Foppa Pedretti. 2023. "Distribution Quality of Agrochemicals for the Revamping of a Sprayer System Based on Lidar Technology and Grapevine Disease Management" Applied Sciences 13, no. 4: 2222. https://doi.org/10.3390/app13042222
APA StyleIlari, A., Piancatelli, S., Centorame, L., Moumni, M., Romanazzi, G., & Foppa Pedretti, E. (2023). Distribution Quality of Agrochemicals for the Revamping of a Sprayer System Based on Lidar Technology and Grapevine Disease Management. Applied Sciences, 13(4), 2222. https://doi.org/10.3390/app13042222