Article

Presenting Job Instructions Using an Augmented Reality Device, a Printed Manual, and a Video Display for Assembly and Disassembly Tasks: What Are the Differences?

College of Management, Chung Hua University, Hsin-Chu 30012, Taiwan
*
Author to whom correspondence should be addressed.
Appl. Sci. 2023, 13(4), 2186; https://doi.org/10.3390/app13042186
Submission received: 19 January 2023 / Revised: 4 February 2023 / Accepted: 7 February 2023 / Published: 8 February 2023

Abstract

:
Components assembly and disassembly are fundamental tasks in manufacturing and the product service industry. Job instructions are required for novice and inexperienced workers to perform such tasks. Conventionally, job instructions may be presented via printed manual and video display. Augmented reality (AR) device has been one of the recent alternatives in conveying such information. This research compared the presentation of job instruction via AR display, video display, and a printed manual in performing computer component assembly and disassembly tasks in terms of efficiency, quality, and usability. A Microsoft® HoloLens 2 device and a laptop computer were adopted to present the job instruction for the AR and video conditions, respectively. A total of 21 healthy adults, including 11 males and 10 females, participated in the study. Our findings were that AR display led to the least efficiency but the best quality of the task being performed. The differences of the overall usability scores among the three job instruction types were insignificant. The participants felt that support from a technical person for the AR device was significantly more than the printed manual. More male participants felt the AR display was easier to use than their female counterparts.

1. Introduction

Manufacturing is a complex process to produce goods. It is the process of changing raw materials into finished products with specific functions or values to fulfill the needs of customers. Automatic productions are widely used in contemporary manufacturing systems. Even in the highly industrialized era, workers are still required to perform certain tasks which may not be easily accomplished by machines [1]. With the advancement of science and technology, workers have opportunities to use sophisticated digital tools to accomplish their tasks more easily. One of the advancements in technology that facilitates the progress of industrialization is augmented reality (AR) [2].
AR is the technology to superimpose computer-generated images onto a real environment [3]. It is characterized by combining virtual objects in a real environment and allowing human interaction with the virtual objects in a real time manner [4,5]. AR is achievable in different ways. However, the most common approach to realize this technology is via the use of AR devices such as AR glasses [6]. A set of AR glasses is a transparent displayer which may display both 2D and/or 3D images in the visual field of the users. The images do not block the vision of the real world so that the users may see both what actually exists and those virtual visions generated by the AR device. The displayed images of the device may be assistive and supplemental to the users when incorporated into the real world. They may also be independent objects for special purposes.
AR devices have been applied for various purposes. They have been used as guidance for wire assembly tasks [7], product planning and design [8,9], logistics [10,11], maintenance and repairment [12,13], assembly and disassembly tasks [14,15,16,17], training and practices in both dentistry [18] and surgery [19,20], and so on. Empirical studies have shown the advantages of AR in training automotive service technicians [21,22] and medical students [19].
Assembly tasks are fundamental in both manufacturing and maintenance operations [14]. They may include alignment and fastening to put two or more parts together [23,24]. Disassembly tasks, on the other hand, refer to separating and removing parts in order to repair or replace them. They are fundamental in maintenance operations. Both assembly and disassembly are performed following specific standard operating procedures (SOPs) [25]. Assembly in mass productions is normally accomplished using automatic or semi-automatic machines unless they are technically unfeasible. Small lot size assembly and many disassembly tasks, on the other hand, are commonly performed manually. The SOPs for assembly and disassembly tasks are established by engineers and designers. They are established so that workers may follow them to perform the tasks successfully. Experienced and skilled workers may perform the tasks without reading the SOPs if they are very familiar with them. Novice or inexperienced workers, however, need to read those procedures either step by step or occasionally in order to complete their tasks.
Traditionally, hard copies of SOPs, such as printed manuals, are provided at workplaces. Inexperienced workers may read them step by step to accomplish their tasks. The procedures may also be presented on a computer monitor. Both printed manual and video presentation of job instructions have been used for a long time. Presenting a SOP in an AR device has been a relatively new approach in providing support to workers. There are studies discussing the use of an AR device at workplaces [26,27,28]. The literature has shown inconsistent results in using an AR device to convey job instructions in facilitating the assembly and disassembly tasks. For example, Tang et al. [29] has shown that using an AR device in assembly tasks reduced 82% of error rate. Several other authors, such as Fiorentino et al. [30], Wang et al. [16], and Masood and Egger [31], have shown that an AR device may improve worker efficiency and reduce the cost in both assembly and disassembly tasks. On the contrary of these findings, the literature [32,33] has also shown that the performance of wearing a set of AR glasses was not significantly higher than those without using such a device. There are even reports that AR devices could cause safety and health problems for workers including musculoskeletal problems [34] and motion sickness [35]. It is apparent that more studies are required to discover the benefits and applicability of using AR technology in assisting workers to perform assembly and disassembly tasks.
The purpose of this study was to compare the difference between using an AR device to convey job instructions and using traditional job instructions, including paper manual and computer monitor display, in assembly and disassembly tasks as performed in common maintenance and repairment services. In addition to the time to complete the task, the quality of the tasks being performed was assessed in terms of the number of errors made by the participants. Our hypothesis was that using an AR device to present job instructions may either improve the efficiency or the quality of the tasks being performed. The usability of the types of job instructions were also analyzed and discussed.

2. Materials and Methods

In this section, we introduce the participants, hand dexterity test, steps of assembly and disassembly tasks, types of job instruction, and experimental design and data analyses of this study.

2.1. Participants

A total of 21 participants, including 11 males and 10 females, were recruited. All the participants were college students without computer assembly and disassembly experience. Fifteen (nine males and six females) of them were right-handed. The other six (four females and two males) were left-handed. A Landolt C chart and a color book were used to examine the visual acuity and color deficiency of the participants. The mean (±SD) of the age and decimal visual acuity (both eyes) were 20.70 (±1.34) yrs and 0.91 (±0.27), respectively, for females and 19.91 (±2.16) yrs and 0.95 (±0.22), respectively, for males. The stature and body weight of female participants were 158.91 (±5.53) cm and 56.30 (±12.22) kg, respectively, and 172.55 (±5.84) cm and 66.73 (±12.56) kg, respectively, for male participants. None of the participants had color deficiency. Each participant received a cash reward of TWD 600 for their participation in the experiment.

2.2. Hand Dexterity Tests

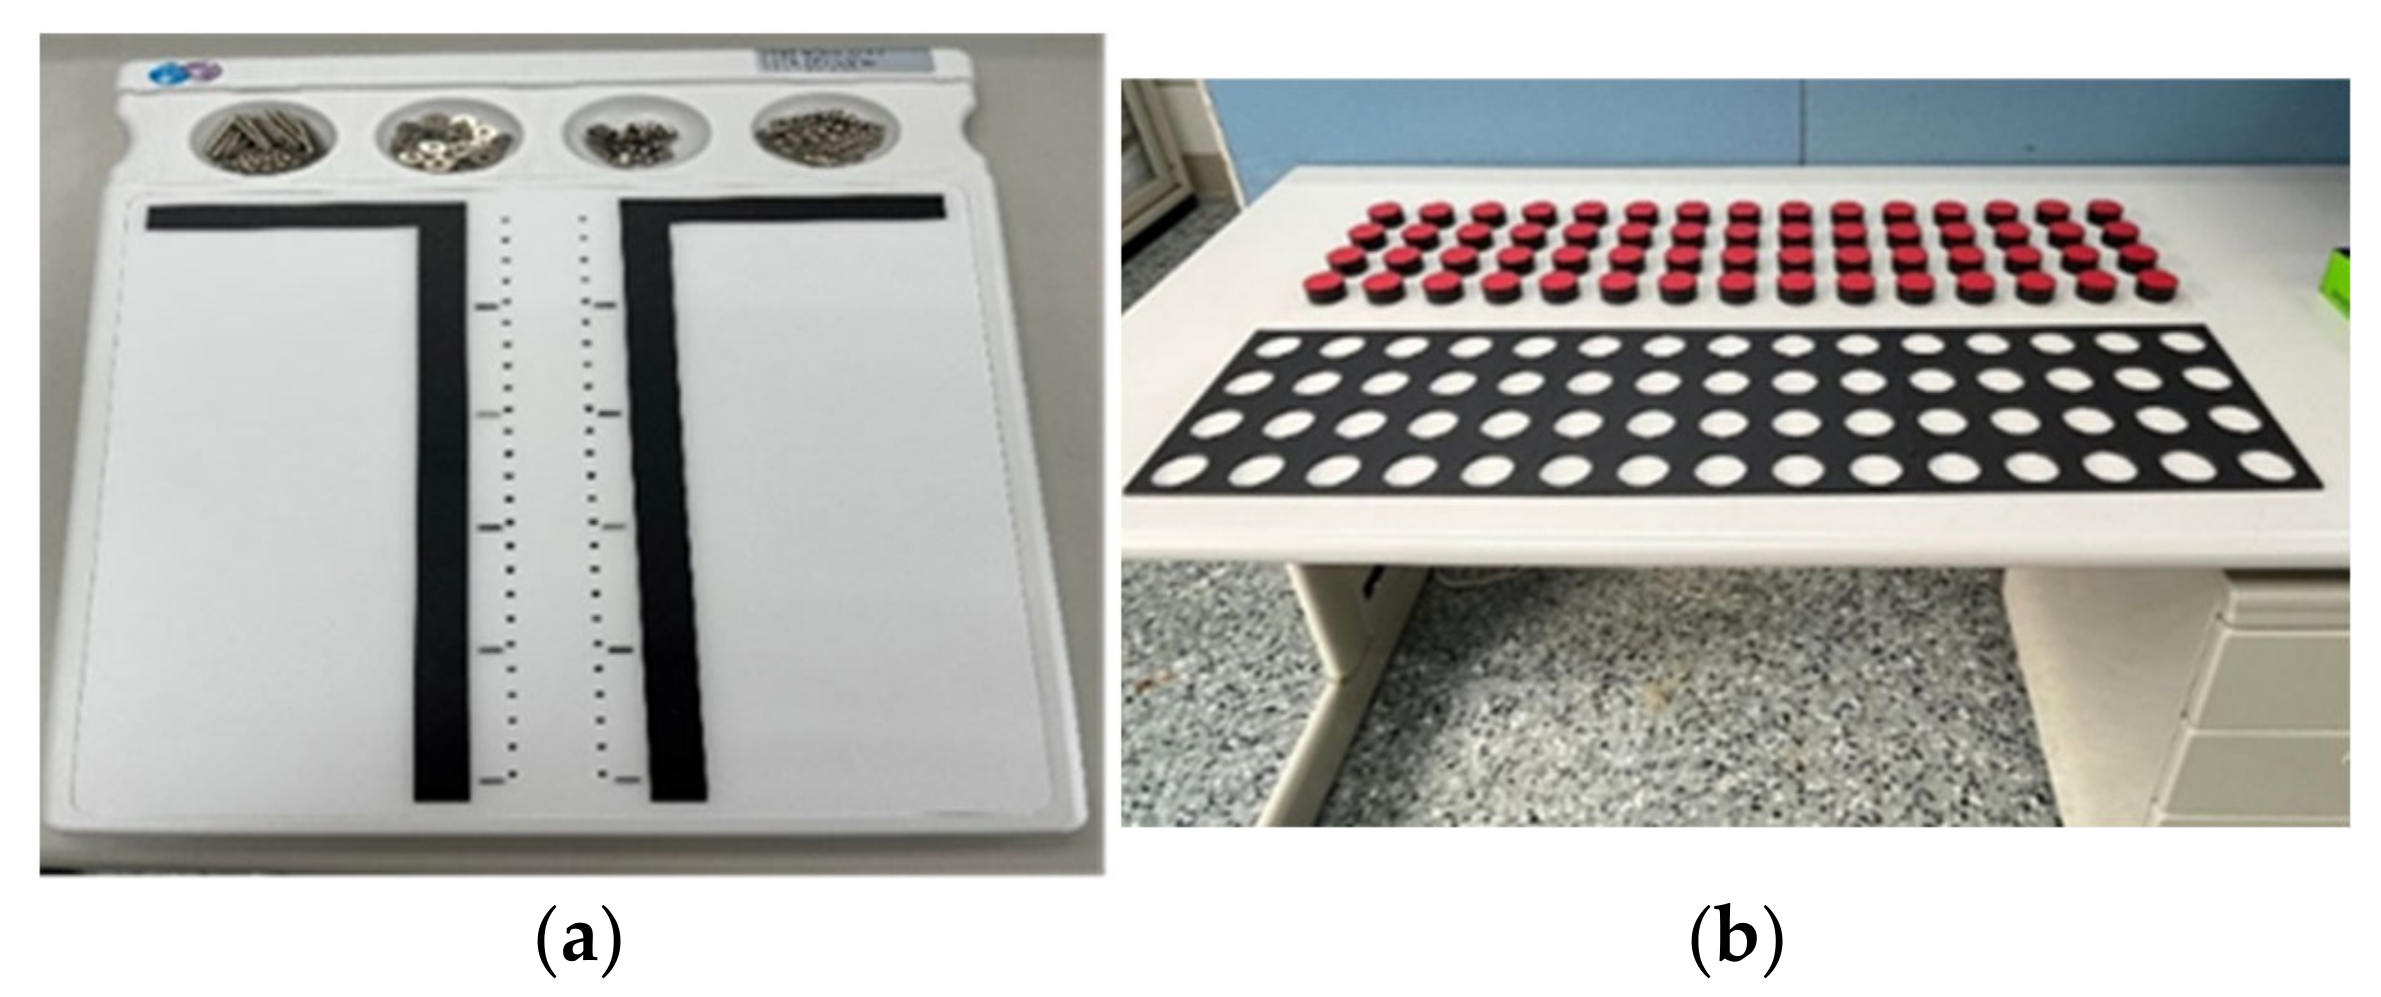
We measured the hand dexterity of the participants using both the Purdue Pegboard Test (PPT) and the Minnesota Dexterity Test (MDT) (see Figure 1). The test kits were placed on a table 75 cm high. The PPT required the seated participant to place as many pegs into the holes in 30 s, first with each hand separately and then together, followed by the assembly of as many pegs, washers, and collars as possible in 1 min [36,37,38,39]. We recorded the average numbers of pegs completed for two trials both using dominant hand in 30 s and assemblies of pegs, washers, and collars using both hands in 1 min for each trial. The MDT test included a turning test and a placing test [40,41]. The participants stood in front of the table to perform the tests. We recorded the average times of two trials to complete the placing test using dominant hand and the time to complete the turning test using both hands.

2.3. Assembly and Disassembly Tasks

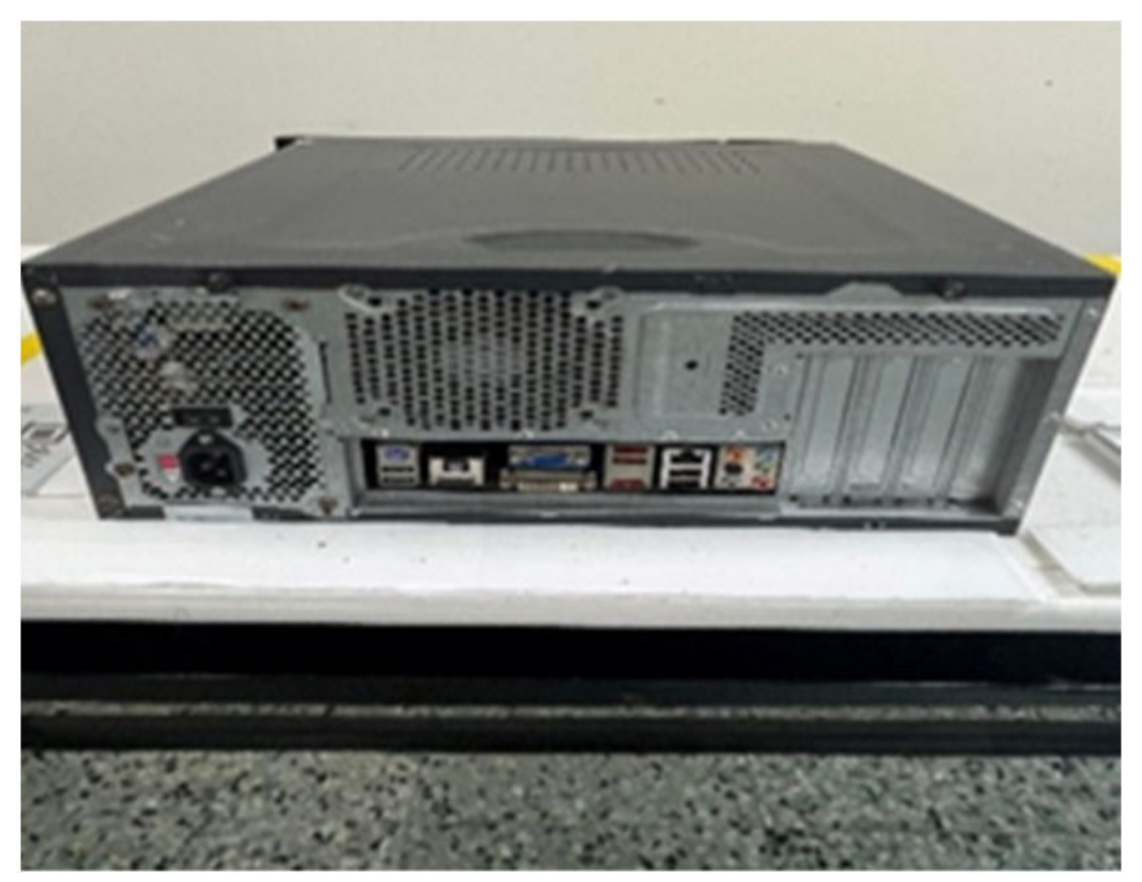
A desktop computer (ASUS®, ASD760, Taipei, Taiwan; see Figure 2) was prepared for the assembly and disassembly tasks on a table 75 cm above the floor. In computer maintenance and repairment services, only partial components are disassembled and assembled. In this study, we requested our participants to disassemble and assemble the following components: a fan unit, a power supply, a DVD drive, and a motherboard (see Figure 3).
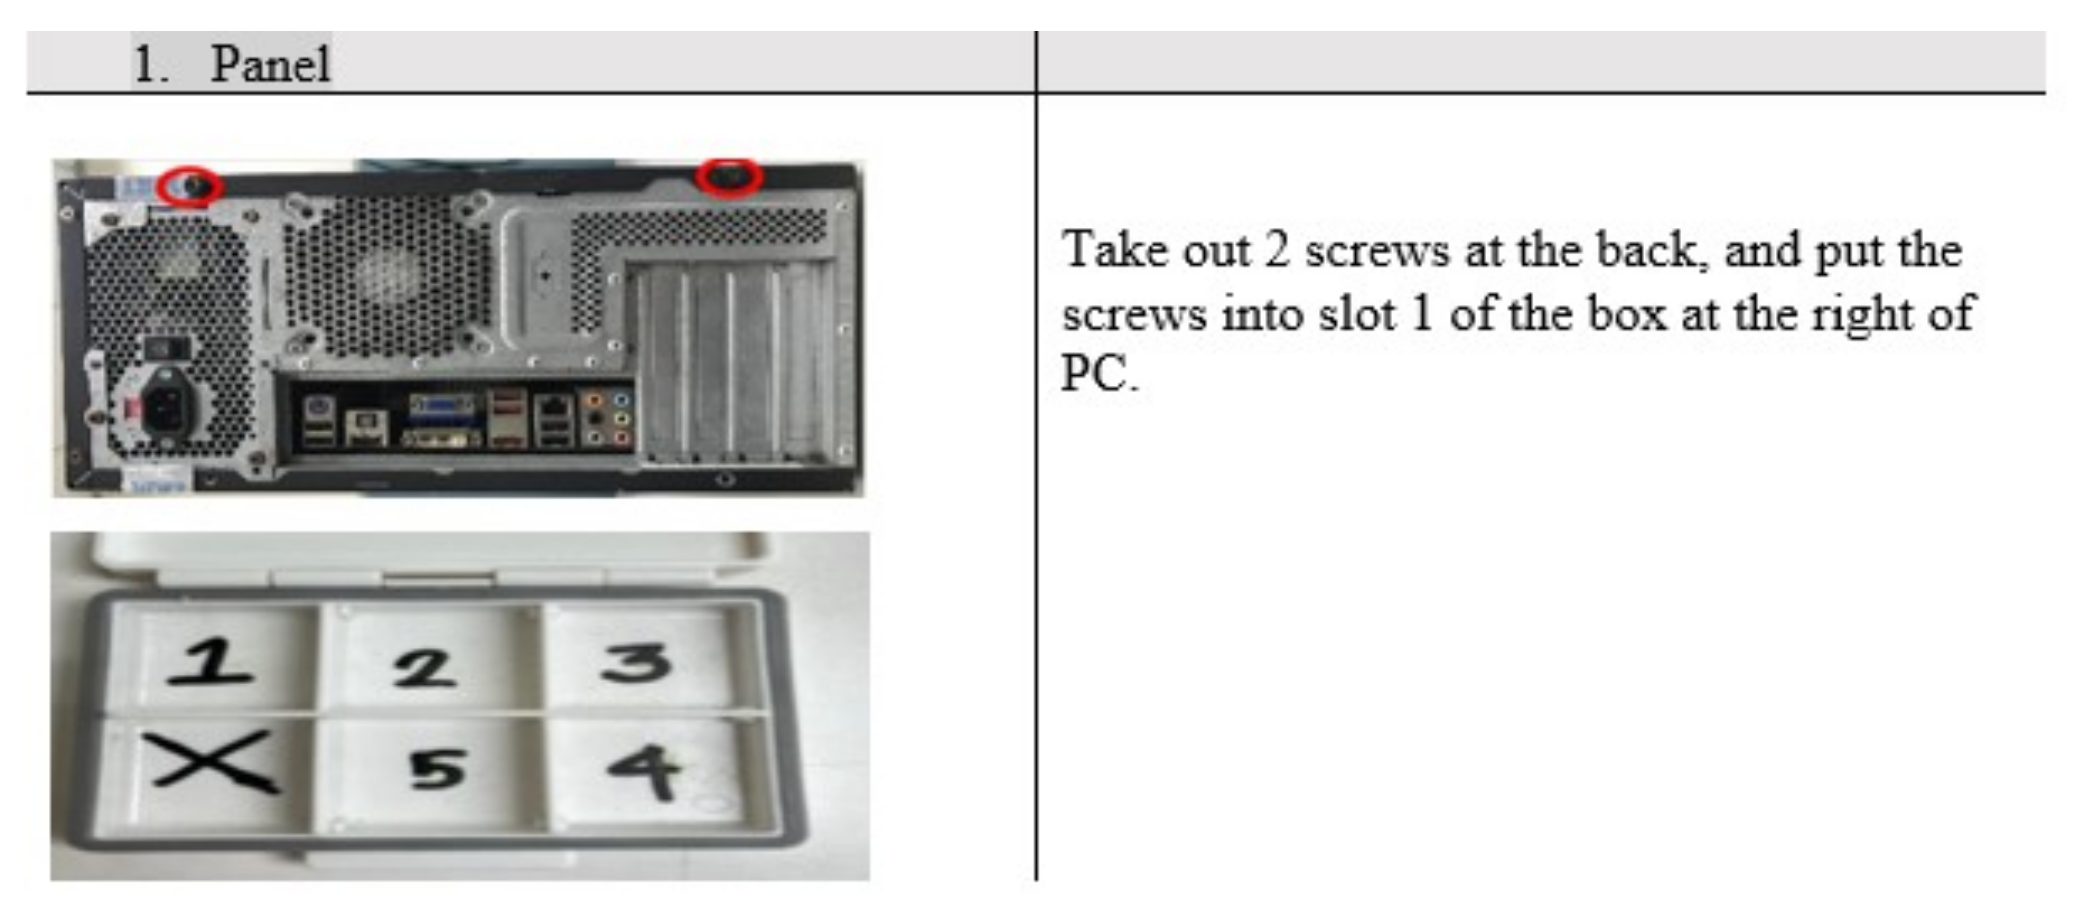
The steps of assembly and disassembly tasks are shown in Table 1.
For each assembly and disassembly task, a total of 20 screws needed to be tightened or unscrewed and 4 cable connectors needed to be plugged or unplugged.

2.4. Job Instructions

The job instructions or the steps of assembly and disassembly of the computer components were presented in three different ways, including a paper manual, a video displayed in a laptop computer, and an AR display. For all these job instructions, there were no vocal explanations.
For the printed manual, Chinese versions of both the disassembly and assembly steps are printed as two 6-page manuals. The steps in these manuals are illustrated using text accompanied with a photo highlighting the locations of the screws and cable connections (see Figure 4). For video display on a laptop computer (Acer® Swift 3, SF314-42, New Taipei, Taiwan), the steps were shown in a video without text explanation (see Figure 5). The participant could click to pause, reverse, and continue to see what he or she needed to do. The locations and connections were not highlighted in this condition because they were obvious in the video.
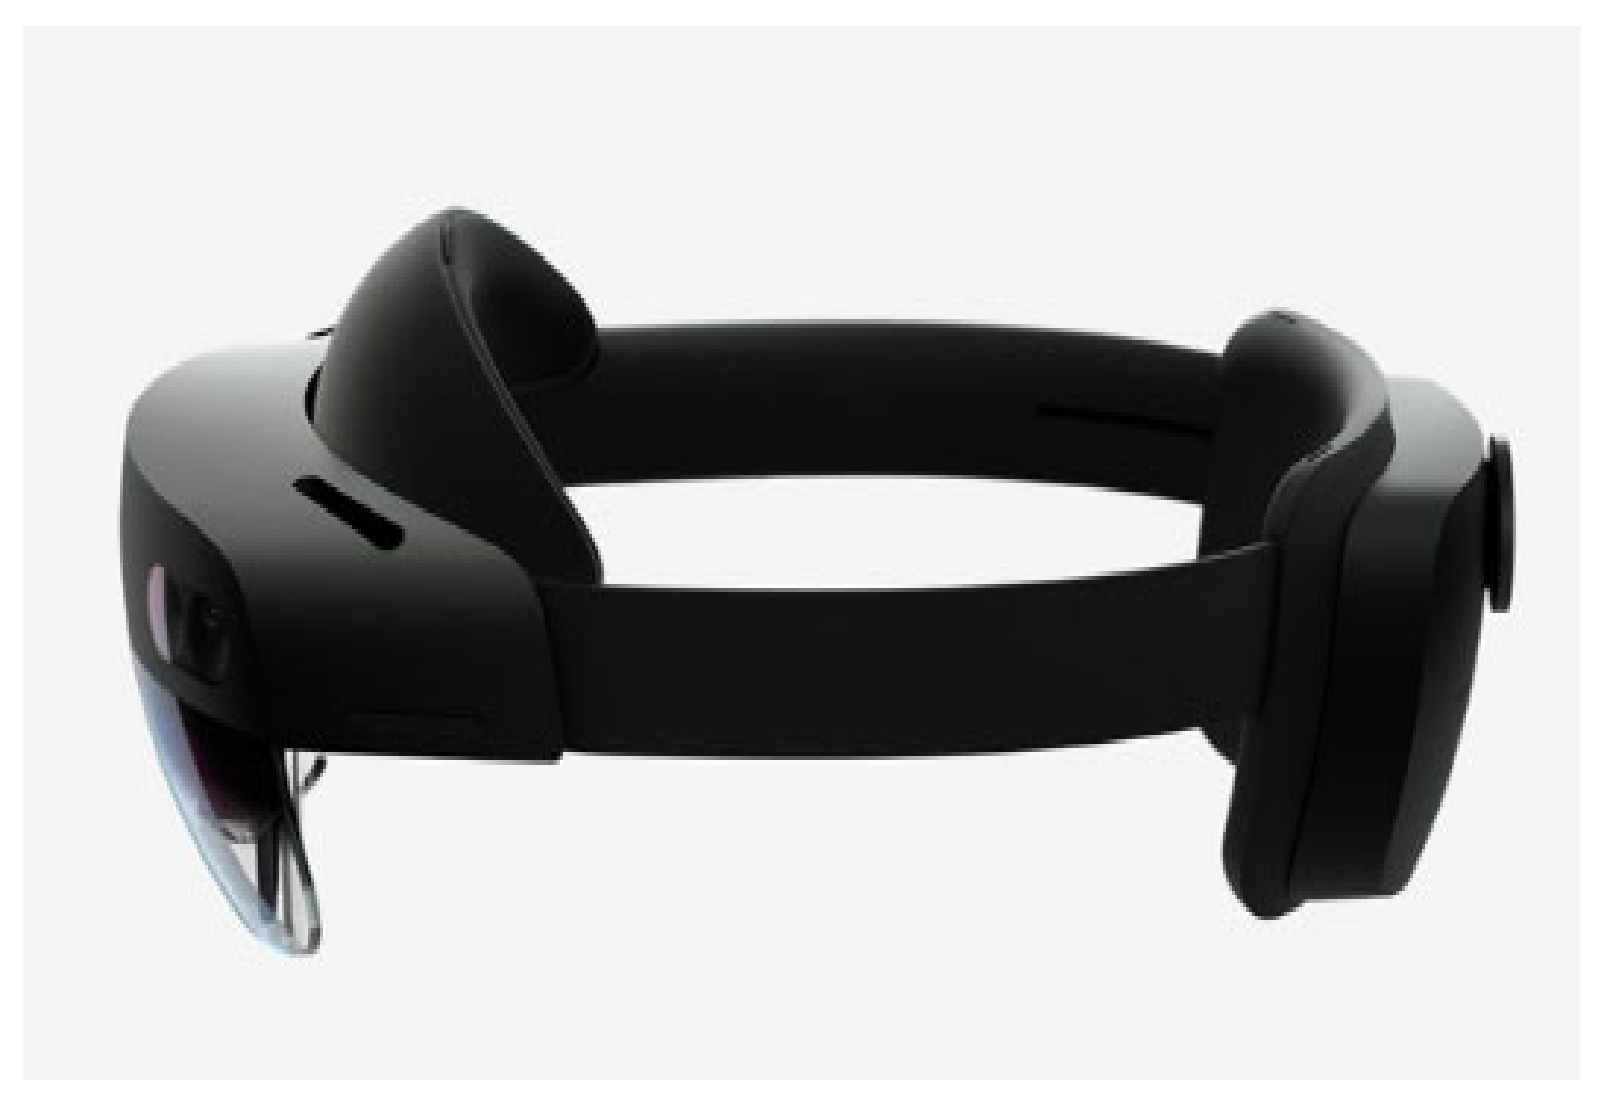
For AR-displayed condition, a set of smart glasses (HoloLens 2, Microsoft® Inc., Redmond, WA, USA) was adopted as the AR device in presenting the instructions of the tasks (see Figure 6). This device encompasses see-through holographic lenses. Users may see both virtual instruction and the components in the computer. The Dynamics 365 Guides app (Microsoft® Inc., Redmond, WA, USA) in the HoloLens 2 was adopted to present the job instructions. The text (in Chinese) of each step for both assembly and disassembly tasks were incorporated into the Dynamic 365 app. Virtual circles and squares were added using the AR toolkit to highlight the locations of the screws and cable connections, respectively (see 
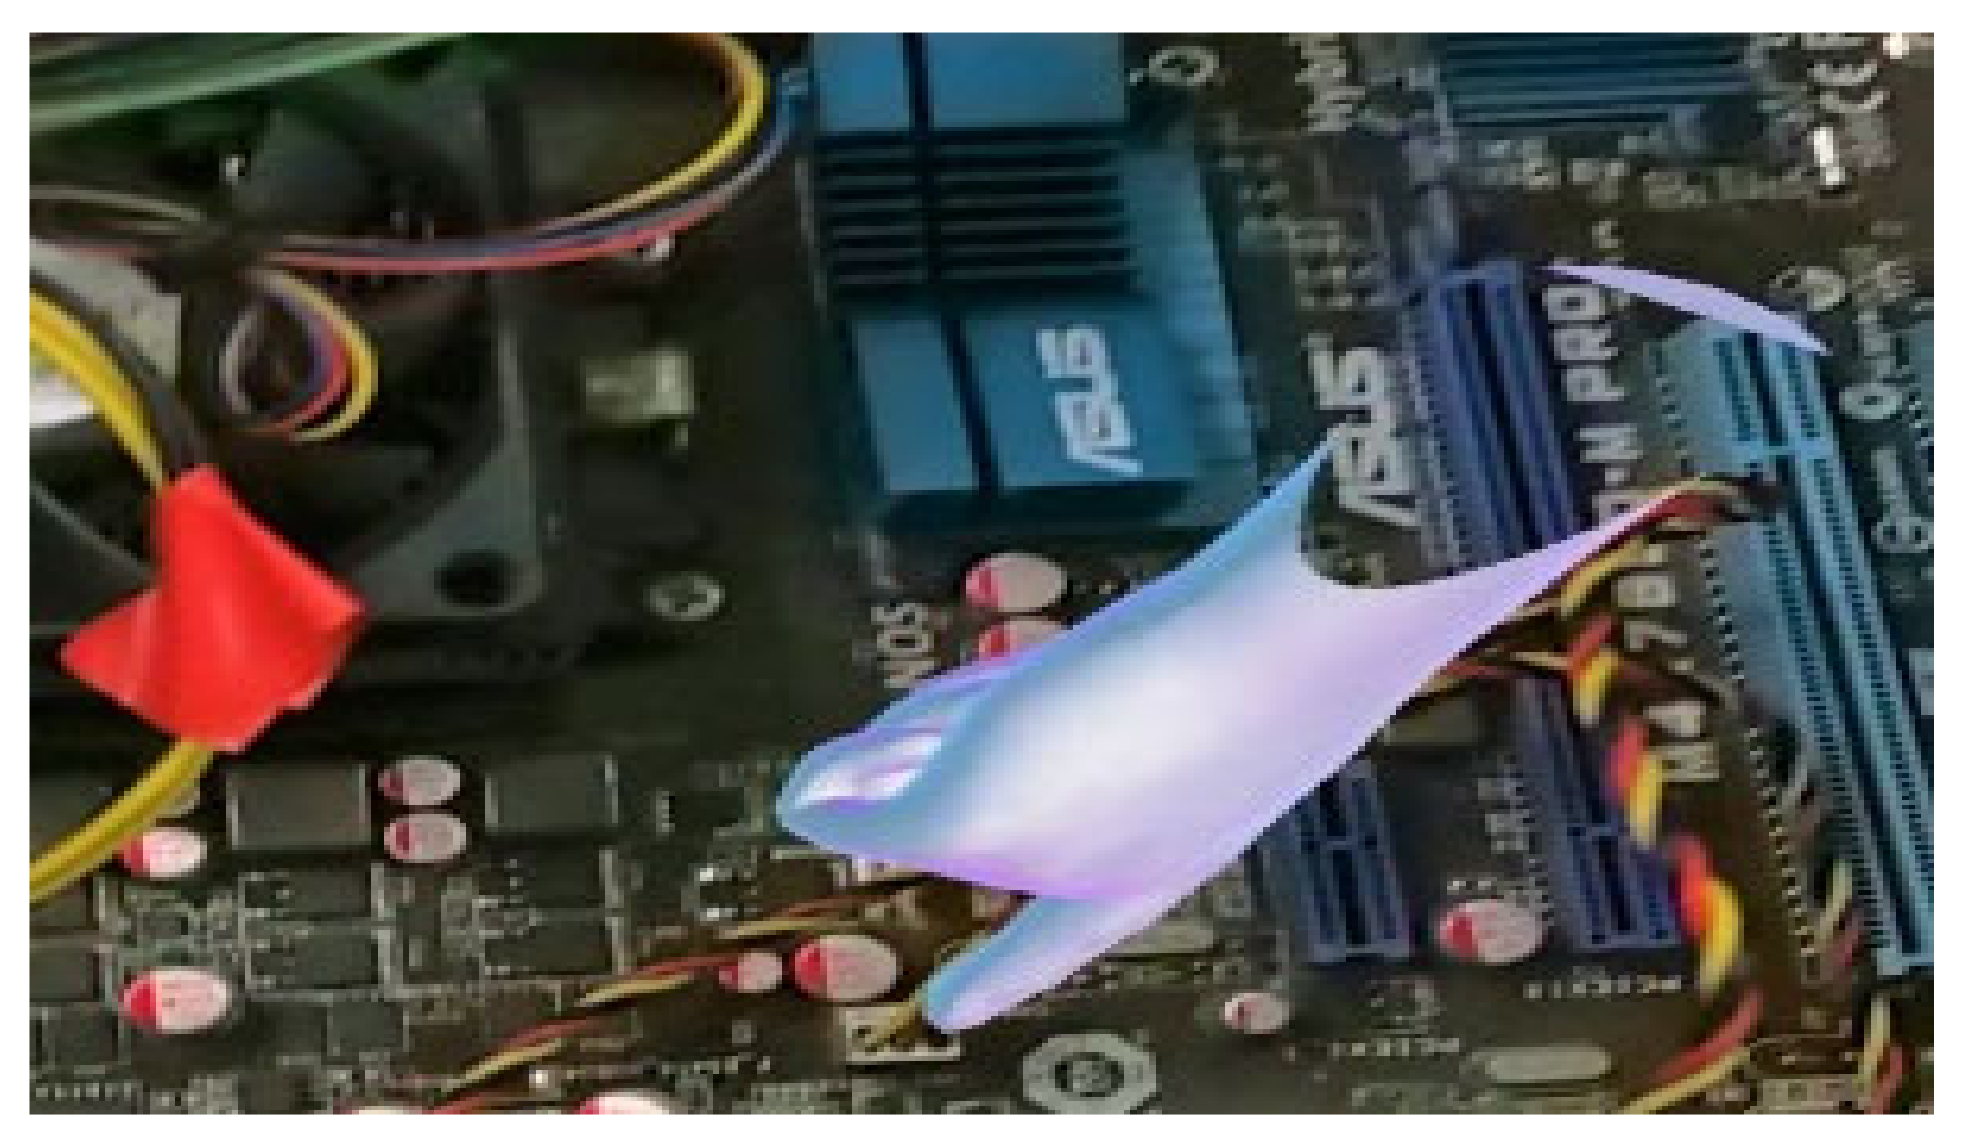
Figure 7), so as to provide supplemental information. When a cable needed to be plugged or unplugged, a virtual hand appeared to highlight the cable (dis)connection operation (see Figure 8). Virtual hand(s) also appeared when pushing or pulling a component was required (see Figure 9 and Figure 10). The virtual hand(s) disappeared after the participant had followed this instruction. The participant might click on a virtual arrow on the top right corner of the instruction to go to the next step when he/she has completed one step using his/her index finger.
All the participants could see and read the steps of assembly and disassembly tasks presented by the three types of job instruction without difficulty.

2.5. Procedure

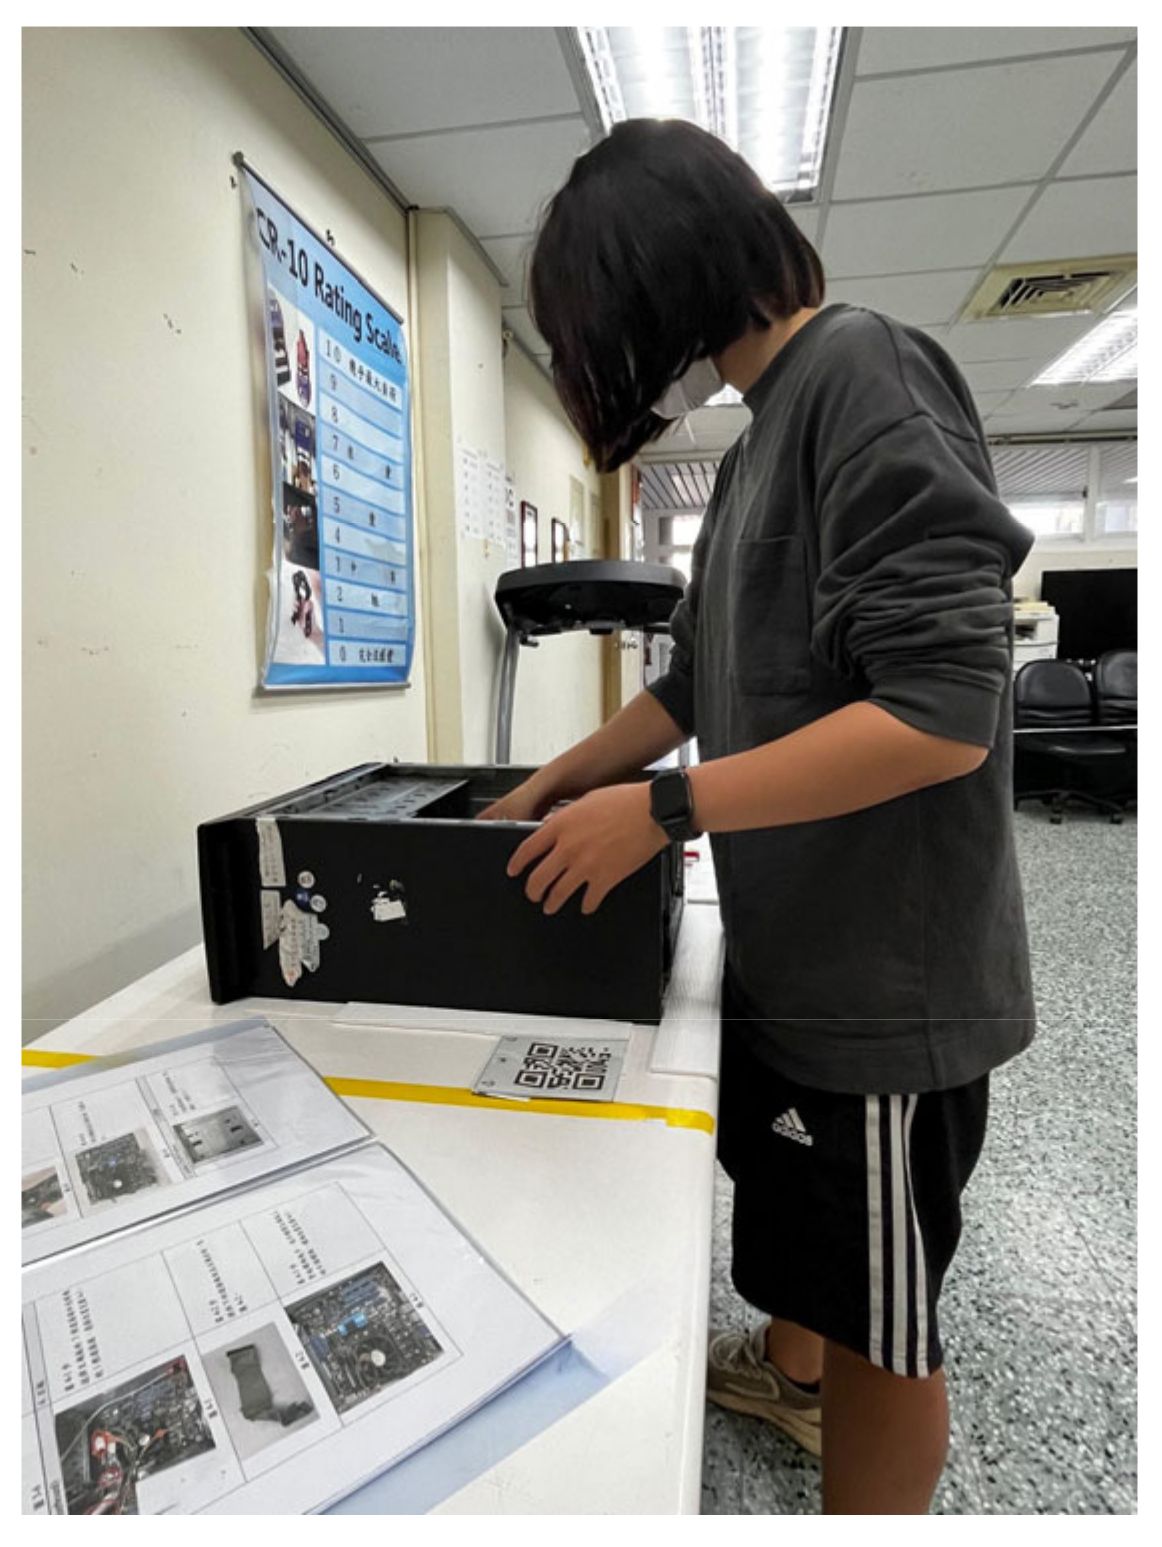
Before the experiment, an experimenter explained the purposes and procedures of the experiment. The components, cables and connectors, and screws were displayed, and the participants were requested to be able to identify them. Each participant attended six trials or treatments comprised of three types of instruction (printed manual, computer display, and AR display) and two tasks (assembly and disassembly). For the assembly task, the components were placed in each assigned location on the table by the experimenter before a trial. For the disassembly task, the location for each component disassembled was marked using colored tapes. For each trial, the participant was instructed that he or she needs to follow the instructions to complete the task. For the printed manual and laptop computer conditions, the printed manual and laptop computer were placed on the left of the computer to be handled (see Figure 11 and Figure 12). For the AR condition, the virtual manual was activated by an experimenter. The participant put on the HoloLens 2 head piece and had an opportunity to practice using the hand gesture to interact with the virtual manual. After the participant felt he or she could use this device without difficulty, he or she then started to perform the task once after hearing a vocal signal (see Figure 13). The trial ended when the participant completed the last step. The time to complete the task was recorded using a stopwatch.
An error in performing the task was recorded when the participant tightened or unscrewed a wrong screw or in a wrong screw hole, plugged or unplugged a wrong cable or in a wrong slot, and picked up or put a screw in a wrong grid in the container. In addition, the participant was required to fix each screw tight enough and press firmly when connecting cables in the assembly task. An error was also recorded if the participant did not put a screw tight enough or did not press the connector on a cable into the slot firmly (this could lead to missed connection) in the assembly task. An experimenter observed the participant performing the trial. She recorded the number of errors without telling the participant.
After the participant completed the trial, he or she filled out a rating scale of system usability (SUS) [42,43] to measure the usability of each job instruction type. The ratings of the SUS include 10 questions (see Appendix A). The participant rated each question on a 5-point Likert scale (1—strongly disagree to 5—strongly agree). After the participant completed one trial, he or she took a break of 4 h or longer before he or she joined the next trial so as to avoid the effects of fatigue on the dependent variables.

2.6. Experimental Design and Data Analyses

A completely randomized block design experiment was performed. As mentioned earlier, the order of the trials was randomized for each participant. A total of 126 trials (21 participants × 3 job instructions × 2 tasks) were performed. The results of the PPT and MDT were recorded to indicate the hand dexterity of the participants. The dependent variables were time to complete the task and rating of the SUS. For the SUS, the score of each question ranged between 1 and 5. The calculations of the total score followed those recommended by Brooke [42]. In addition to the total score, the individual scores of questions 3 (ease of use), 4 (need support from a technical person to use this system), and 10 (need to learn many things before using this system) were also analyzed.
Descriptive statistics were performed. Analyses of variance were performed to determine the significance of the factors affecting the dependent variables. Duncan’s multiple range tests were performed if the main effects of the factors reached the α = 0.05 level of significance. Pearson’s correlation coefficients between the hand dexterity scores and the time to complete the task were calculated to determine the correlation between the variables. Statistical analyses were performed using the SPSS® 20 software (IBM®, Armonk, NY, USA).

3. Results

3.1. Hand Dexterity

Table 2 shows the mean (SD) of the hand dexterity scores of the PPT and MDT for female and male participants. The differences of all the scores between male and female participants was not statistically significant.

3.2. Performance of the Task

The performance of the task was measured using the time to complete the task and the number of errors made in performing the task. These two variables were adopted to indicate the efficiency and quality of the task being performed. Table 3 shows the statistics of the time to complete the task. The ANOVA results of this variable indicated that the effects of type of task (p < 0.0001), gender (p < 0.05), and type of instruction (p < 0.05) were all statistically significant. None of the interaction effects of those three factors were significant at α = 0.05 level. The Duncan’s multiple range test results showed that the time to complete the assembly task (806.11 ± 234.96 s) was significantly (p < 0.05) higher than that of the disassembly task (486.63 ± 161.80 s). The time to complete the assembly and disassembly tasks for females (683.35 ± 272.48 s) was significantly (p < 0.05) higher than that of males (612.75 ± 239.35 s). The time to complete the assembly and disassembly tasks for AR instruction (714.55 ± 235.11 s) was significantly (p < 0.05) higher than those of the printed manual (627.88 ± 273.94 s) and video instruction (596.69 ± 252.05 s). The time to complete the task between using printed manual and video instruction was not statistically significant.
Table 4 shows the number of errors made during performing the task. All those errors occurred in the assembly tasks. The number of errors made by the participants ranged from 0 to 4. The participants did not make any errors in the disassembly tasks. The mean number of errors made by each participant for printed manual, video, and AR instructions were 1.33, 0.62, and 0.33. The participants who followed the printed manual and video instruction made an error four times and almost two times the errors of those following the AR instruction. The ANOVA results showed that the type of instruction significantly (p < 0.01) affected the number of errors made by the participants. The difference between male and female participants in making errors was not significant. Duncan’s multiple range test results indicated that the AR instruction led to significantly (p < 0.05) lower number of errors than that of the printed manual. The difference between that of AR and video instructions and between that of video instruction and printed manual were both insignificant.

3.3. Correlation Analyses

Theoretically, hand dexterity affects the performance of manual assembly and disassembly tasks. Workers with better hand dexterity should have better performance in manual tasks. This was the reason why we measured the hand dexterity scores and calculated the correlation coefficients between these scores and the time to complete the task. Pearson’s correlation coefficients between the hand dexterity score and time to complete the task are shown in Table 5. The correlation coefficients between the PPTd and the time of assembly task using video and AR instructions were −0.47 (p < 0.05) and −0.52 (p < 0.05), respectively. The correlation coefficients between the time to complete the assembly task using video instruction and the MDTd and MDTt were 0.43 and 0.46, respectively, and both were significant at p < 0.05.

3.4. Usability Test Results

Table 6 shows the means and standard deviations of the SUS scores. A high SUS score implies good usability. The ANOVA results showed that gender was a significant (p < 0.0001) factor affecting the SUS score. The SUS score of male participants (66.1 ± 15.3) was significantly higher than that (55.6 ± 12.8) of female participants. The effects of instruction type were insignificant. Neither were the effects of task significant.
The participant indicated the ease of use of the job instruction in Question 3 in the SUS. The ANOVA results of this response showed that both gender and interactions of gender and instruction were statistically significant (p < 0.05 for both). Duncan’s multiple range test results showed that the score of males (3.61 ± 1.09) was significantly higher than that of females (3.18 ± 0.83). Figure 14 shows the interaction effects of gender and job instruction on the score of ease of use.
Question 4 in the SUS measures the need of support from a technical person to use a system. The ANOVA results of this response showed that both gender (p < 0.0001) and job instruction (p < 0.001) affected this score significantly. All other effects were insignificant. Duncan’s multiple range test results indicated that the score of need of support for female participants (2.95 ± 1.13) was significantly higher than their male counterparts (2.09 ± 1.05). For job instruction, Duncan’s multiple range test results indicated that the score of need of support for AR instruction (3.05 ± 1.03) was significantly higher than those of the printed manual (2.36 ± 1.18) and video instruction (2.09 ± 1.08). The difference of the score of need support between that of printed manual and video display was not significant.
Question 10 in the SUS measures the need to learn to use a system. The only significant factor was gender (p < 0.0001). The score of females (2.90 ± 1.16) was significantly higher than that of males (1.89 ± 1.20). Type of job instruction did not affect this score significantly.

4. Discussion

The order of the assembly/disassembly and types of job instructions were randomly arranged for each participant. It was, therefore, reasonable to assume that learning effects contributed equally to both the task and type of job instruction in this study.
The time to complete the task was adopted as the main variable to indicate the performance of the participants. For inexperienced participants, assembly tasks required significantly (p < 0.05) longer time to complete than disassembly. This was not surprising at all. Disassembly is always easier and less time consuming than assembly. Our data showed that disassembling the four components needed only 60% of the time of assembling them. Gender was also a significant (p < 0.05) factor affecting the time to complete the assembly/disassembly tasks. Males could complete their tasks faster than their female counterparts. The time to complete the tasks for male participants was only 90% of their female counterparts. This gender difference might be attributed to the motor skills of males and females to tighten and loosen the screws. For job instructions, the participants using AR displays spent significantly (p < 0.05) longer time than those of the video display and printed manual conditions. Using AR display, on average, spent 118 and 87 s longer than those video display and printed manual, respectively, in performing the assembly and disassembly tasks. This was consistent with the findings in the literature [32,33] that wearing an AR device might not lead to better efficiency than those who did not wear one and watched a wall-mounted monitor instead. This, however, was inconsistent with the findings of some of the other literature [16,30,31]. All the participants were familiar with clicking a mouse to activate a continue button on a laptop display and to flip a sheet of paper of the manual. On the contrary, none of them were familiar with tapping on the “next page” button on the virtual-displayed instruction on the HoloLens 2. This might result in a longer time accessing the job instructions. The virtual hand(s) to highlight the push/pull movements was one of the innovations of the job instruction we created using the Dynamic 365 app in HoloLens 2 for the tasks. They clearly indicated what the participants should do using their hand(s). However, the participants might be distracted by this innovation and responded slower because of the attraction of the hand(s).
In addition to the time to complete the task, the errors made by the participant was also an important variable to assess the performance of the tasks. There were no errors made in the disassembly tasks. There were, however, 28, 13, and 7 errors in the printed manual, video display, and AR display conditions for the assembly task. The majority of the errors were observed when the participant was assembling the power supply. This component has three cables. Two of them needed to be plugged into two slots on the motherboard and the third needed to be plugged into the DVD drive. Most of the errors were that the participant simply put the connector into the slot without pressing it firmly. An assembly task failed so long as any cable connector was not well connected. The numbers of unsuccessful assembly for the printed manual, video display, and AR display conditions were 14, 8, and 5, respectively, out of 21. Job instruction via AR display apparently led to less failed assembly, which implies better quality of the tasks. This advantage might be attributed to innovation of virtual hand(s) to highlight the hand movements to be performed. Our results in the errors associated with the AR device were consistent with the findings of Tang et al. [29].
The hand dexterity of the participants was measured using both the PPT and MDT. The PPTd was negative correlated with the time to complete the assembly task for both video (−0.47, p < 0.05) and AR instructions (−0.52, p < 0.05). This was reasonable because high PPT number implies high hand dexterity. High hand dexterity should be associated with less time to complete the task. The correlation coefficients between the PPT scores tested and the time to complete the tasks for other task/job instruction conditions were, however, insignificant. For the MDT results, the MDTd (0.43, p < 0.05) and MDTt (0.46, p < 0.05) were both positively correlated with the time to complete the mission for video-displayed job instruction tasks. This was also reasonable because low MDT time implies high hand dexterity, which should be associated with less time to complete the task.
Usability is a core item in assessing a device or a system for human use. It has been defined as “the effectiveness, efficiency, and satisfaction with which specified users can achieve goals in particular environments” [44]. We used the SUS scores [
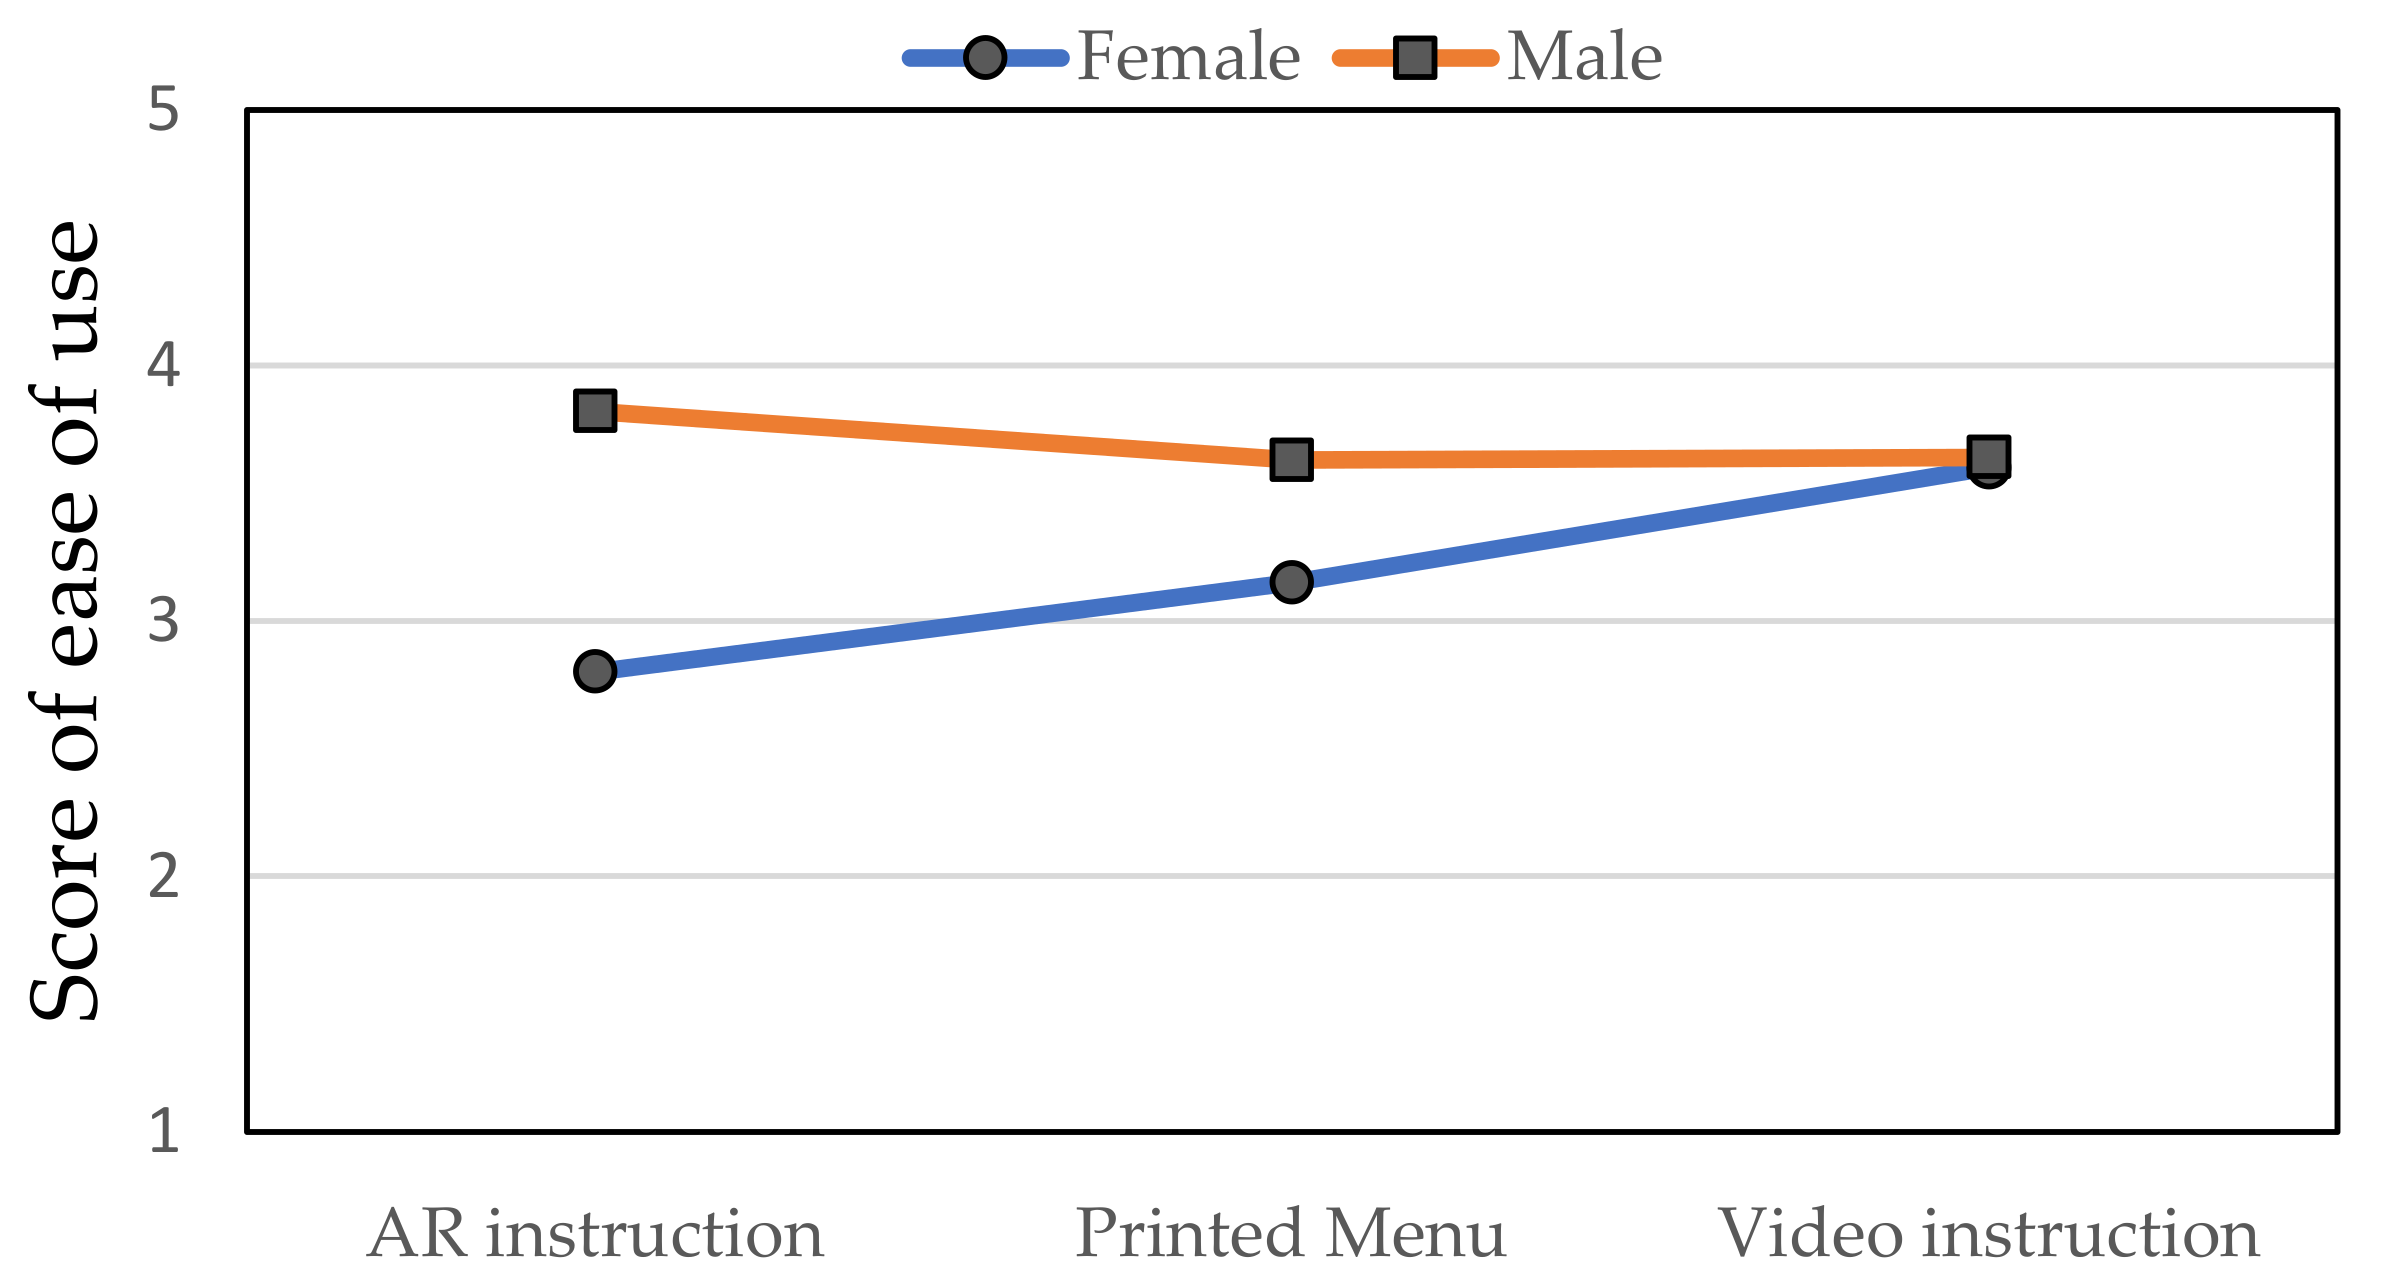
42] to assess the usability of the type of job instructions for male and female participants. In addition to the total score, we specifically analyzed the individual score of questions 3, 4, and 10, which assess the ease of use, need support from a technical person, and need to learn, respectively. The score of ease of use of the SUS results showed that both gender and gender × job instruction interactions were significant (p < 0.05). Figure 14 shows that the difference of the score of ease of use between males and females was most significant for the AR instruction condition, next for printed manual condition. For the video display condition, there was no difference between the two genders. This implies that AR instruction was easier to use for males than for females. Regarding the question asking the need of support from a technical person to use a system, female participants responded with a significantly higher score than male participants. This implies that females needed support from a technical person more than males. Comparing the need to learn for different job instructions, the score of AR instruction was significantly higher than those of the printed manual and video instruction. This was consistent with what actually happened in that all the participants needed both detailed instructions from the experimenter on how to use the HoloLens 2 to access the job instructions and to practice. For the other two types of job instructions, only simple verbal instruction was required.
There are limitations to the study. There were essential differences among the three types of job instructions. The information displayed on printed manual and AR display were both static and the image displayed on video was dynamic. For printed manual, the participants needed to flip the printed manual three times to read all six pages. For AR display, the participants needed to click 12 and 11 times on the arrow button to go to the next step for the assembly and disassembly tasks, respectively. For video display, the number of clicking the mouse to pause and display was dependent on the participant. The participants might watch multiple steps and make one mouse click to pause. This might reduce their time in performing the tasks. These might be the main reasons that AR display was most time consuming and video display was most efficient. In fact, dynamic information such as video display may also be presented via the HoloLens 2. Future research may be designed to compare the difference between presenting static and dynamic job instruction on an AR device. Another limitation of this study was that we did not consider vocal information in our job instructions. In fact, vocal instruction may be added to both the video and AR displays. Future research may also be designed to study the effects of vocal information in the job instruction on the performance of assembly and disassembly tasks. In addition, we only considered four components in the assembly and disassembly tasks. Assembly and disassembly of all the components in a computer may be investigated in the future using both AR and other types of job instruction presentation. Finally, it should be noted that there are many other AR devices, and we only used the HoloLens 2 in the AR instruction condition. Our results may not be generalized to AR devices other than the HoloLens 2.

5. Conclusions

An experiment was performed to compare the performance and usability of printed manual, video display, and AR display in presenting job instructions for computer assembly and disassembly tasks. The results showed that the time to complete the tasks by reading the job instructions presented via the HoloLens 2 AR glasses was significantly longer than those of the printed manual and video display conditions. Using the AR-based job instructions did not improve the efficiency in assembly and disassembly of computer components under our experimental conditions. On the other hand, the results of the number of errors made by the participants indicated that, among the three types of job instruction, AR-based job instructions led to the best quality of the tasks being performed. The differences of the overall usability score among the three types of job instruction were insignificant. However, more male participants felt that the AR-based job instruction was easy to use than their female counterparts. Support from a technical person was needed more for the AR-based job instruction than the other two traditional instruction types.

Author Contributions

Conceptualization, H.D. and K.-W.L.; methodology, H.D.; software, H.D.; validation, S.K.; formal analysis, H.D. and K.-W.L.; resources, K.-W.L.; data curation, H.D.; writing—original draft preparation, H.D. and K.-W.L.; writing—review and editing, S.K.; visualization, S.K.; project administration, K.-W.L.; funding acquisition, K.-W.L. All authors have read and agreed to the published version of the manuscript.

Funding

This research was funded by National Science and Technology Council of the ROC, grant number MOST 110-2221-E-216-004.

Institutional Review Board Statement

This study was conducted according to the guidelines of the Declaration of Helsinki and was approved by an external ethics committee (Jen-Ai Hospital, 110-55).

Informed Consent Statement

Informed consent was obtained from all subjects involved in the study.

Data Availability Statement

The data presented in this study are available upon request from the corresponding author. The data are not publicly available due to privacy reasons.

Conflicts of Interest

The authors declare no conflict of interests.

Abbreviations

ARAugmented reality
MDTMinnesota Dexterity Test
MDTdPlacing test using dominant hand of Minnesota Dexterity Test
MDTtTurning test using both hands of Minnesota Dexterity Test
PPTPurdue Pegboard Test
PPTaAssembly of Purdue Pegboard Test
PPTdDominant hand of Purdue Pegboard Test
SDStandard deviation
SOPsStandard operating procedures
SUSSystem usability scale

Appendix A

Questions of the system usability scale (SUS)
  • I think that I would like to use this system frequently.
  • The system was unnecessarily complex.
  • The system was easy to use.
  • I would need the support of a technical person so as to use this system.
  • Various functions in this system were well integrated.
  • There was too much inconsistency in this system.
  • I believe that most people would learn to use this system very quickly.
  • The system was very cumbersome to use.
  • I felt very confident using this system.
  • I needed to learn many things before using this system.

References

  1. Stock, T.; Seliger, G. Opportunities of Sustainable Manufacturing in Industry 4.0. Procedia CIRP 2016, 40, 536–541. [Google Scholar] [CrossRef]
  2. Rentzos, L.; Papanastasiou, S.; Papakostas, N.; Chryssolouris, G. Augmented Reality for Human-Based Assembly: Using Product and Process Semantics. IFAC Proc. Vol. 2013, 46, 98–101. [Google Scholar] [CrossRef]
  3. Doil, F.; Schreiber, W.; Alt, T.; Patron, C. Augmented Reality for Manufacturing Planning. In Proceedings of the Workshop on Virtual Environments 2003-EGVE ’03, Zurich, Switzerland, 22–23 May 2003; ACM Press: Zurich, Switzerland, 2003; pp. 71–76. [Google Scholar] [CrossRef]
  4. Azuma, R.; Baillot, Y.; Behringer, R.; Feiner, S.; Julier, S.; MacIntyre, B. Recent Advances in Augmented Reality. IEEE Comput. Graph. Appl. 2001, 21, 34–47. [Google Scholar] [CrossRef]
  5. Boboc, R.G.; Băutu, E.; Gîrbacia, F.; Popovici, N.; Popovici, D.-M. Augmented Reality in Cultural Heritage: An Overview of the Last Decade of Applications. Appl. Sci. 2022, 12, 9859. [Google Scholar] [CrossRef]
  6. Zhao, C.; Li, K.W.; Peng, L. Movement Time for Pointing Tasks in Real and Augmented Reality Environments. Appl. Sci. 2023, 13, 788. [Google Scholar] [CrossRef]
  7. Navab, N. Developing Killer Apps for Industrial Augmented Reality. IEEE Comput. Graph. Appl. 2004, 24, 16–20. [Google Scholar] [CrossRef]
  8. Luh, Y.-P.; Wang, J.-B.; Chang, J.-W.; Chang, S.-Y.; Chu, C.-H. Augmented Reality-Based Design Customization of Footwear for Children. J. Intell. Manuf. 2013, 24, 905–917. [Google Scholar] [CrossRef]
  9. Nee, A.Y.C.; Ong, S.K.; Chryssolouris, G.; Mourtzis, D. Augmented Reality Applications in Design and Manufacturing. CIRP Ann. 2012, 61, 657–679. [Google Scholar] [CrossRef]
  10. Plakas, G.; Ponis, S.T.; Agalianos, K.; Aretoulaki, E.; Gayialis, S.P. Augmented Reality in Manufacturing and Logistics: Lessons Learnt from a Real-Life Industrial Application. Procedia Manuf. 2020, 51, 1629–1635. [Google Scholar] [CrossRef]
  11. Stoltz, M.-H.; Giannikas, V.; McFarlane, D.; Strachan, J.; Um, J.; Srinivasan, R. Augmented Reality in Warehouse Operations: Opportunities and Barriers. IFAC-Pap. 2017, 50, 12979–12984. [Google Scholar] [CrossRef]
  12. Henderson, S.; Feiner, S. Exploring the Benefits of Augmented Reality Documentation for Maintenance and Repair. IEEE Trans. Vis. Comput. Graph. 2011, 17, 1355–1368. [Google Scholar] [CrossRef]
  13. Quandt, M.; Knoke, B.; Gorldt, C.; Freitag, M.; Thoben, K.-D. General Requirements for Industrial Augmented Reality Applications. Procedia CIRP 2018, 72, 1130–1135. [Google Scholar] [CrossRef]
  14. Baird, K.M.; Barfield, W. Evaluating the Effectiveness of Augmented Reality Displays for a Manual Assembly Task. Virtual Real. 1999, 4, 250–259. [Google Scholar] [CrossRef]
  15. Danielsson, O.; Syberfeldt, A.; Holm, M.; Wang, L. Operators Perspective on Augmented Reality as a Support Tool in Engine Assembly. Procedia CIRP 2018, 72, 45–50. [Google Scholar] [CrossRef]
  16. Wang, X.; Ong, S.K.; Nee, A.Y.C. A Comprehensive Survey of Augmented Reality Assembly Research. Adv. Manuf. 2016, 4, 1–22. [Google Scholar] [CrossRef]
  17. Westerfield, G.; Mitrovic, A.; Billinghurst, M. Intelligent Augmented Reality Training for Motherboard Assembly. Int. J. Artif. Intell. Educ. 2015, 25, 157–172. [Google Scholar] [CrossRef]
  18. Fahim, S.; Maqsood, A.; Das, G.; Ahmed, N.; Saquib, S.; Lal, A.; Khan, A.A.G.; Alam, M.K. Augmented Reality and Virtual Reality in Dentistry: Highlights from the Current Research. Appl. Sci. 2022, 12, 3719. [Google Scholar] [CrossRef]
  19. Barcali, E.; Iadanza, E.; Manetti, L.; Francia, P.; Nardi, C.; Bocchi, L. Augmented Reality in Surgery: A Scoping Review. Appl. Sci. 2022, 12, 6890. [Google Scholar] [CrossRef]
  20. Chang, C.-C.; Kuo, C.-H.; Chang, H.-K.; Tu, T.-H.; Fay, L.-Y.; Wu, J.-C.; Cheng, H.; Huang, W.-C. Augmented Reality-Assisted Percutaneous Pedicle Screw Instrumentation: A Cadaveric Feasibility and Accuracy Study. Appl. Sci. 2022, 12, 5261. [Google Scholar] [CrossRef]
  21. Anastassova, M.; Burkhardt, J.-M. Automotive Technicians’ Training as a Community-of-Practice: Implications for the Design of an Augmented Reality Teaching Aid. Appl. Ergon. 2009, 40, 713–721. [Google Scholar] [CrossRef]
  22. Langley, A.; Lawson, G.; Hermawati, S.; D’Cruz, M.; Apold, J.; Arlt, F.; Mura, K. Establishing the Usability of a Virtual Training System for Assembly Operations within the Automotive Industry. Hum. Factors Ergon. Manuf. Serv. Ind. 2016, 26, 667–679. [Google Scholar] [CrossRef]
  23. Ikeuchi, K.; Suehiro, T. Toward an Assembly Plan from Observation. I. Task Recognition with Polyhedral Objects. IEEE Trans. Robot. Autom. 1994, 10, 368–385. [Google Scholar] [CrossRef]
  24. Radkowski, R.; Herrema, J.; Oliver, J. Augmented Reality-Based Manual Assembly Support With Visual Features for Different Degrees of Difficulty. Int. J. Hum.-Comput. Interact. 2015, 31, 337–349. [Google Scholar] [CrossRef]
  25. Boothroyd, G.; Alting, L. Design for Assembly and Disassembly. CIRP Ann. 1992, 41, 625–636. [Google Scholar] [CrossRef]
  26. Hahn, J.; Ludwig, B.; Wolff, C. Augmented Reality-Based Training of the PCB Assembly Process. In Proceedings of the 14th International Conference on Mobile and Ubiquitous Multimedia, MUM ’15, Linz, Austria, 30 November–2 December 2015; Association for Computing Machinery: New York, NY, USA, 2015; pp. 395–399. [Google Scholar] [CrossRef]
  27. Masood, T.; Egger, J. Adopting Augmented Reality in the Age of Industrial Digitalisation. Comput. Ind. 2020, 115, 103112. [Google Scholar] [CrossRef]
  28. Werrlich, S.; Nitsche, K.; Notni, G. Demand Analysis for an Augmented Reality Based Assembly Training. In Proceedings of the 10th International Conference on PErvasive Technologies Related to Assistive Environments, Island of Rhodes, Greece, 21–23 June 2017; ACM: Island of Rhodes, Greece, 2017; pp. 416–422. [Google Scholar] [CrossRef]
  29. Tang, A.; Owen, C.; Biocca, F.; Mou, W. Comparative Effectiveness of Augmented Reality in Object Assembly. In Proceedings of the SIGCHI Conference on Human Factors in Computing Systems, CHI ’03, Fort Lauderdale, FL, USA, 5–10 April 2003; Association for Computing Machinery: New York, NY, USA, 2003; pp. 73–80. [Google Scholar] [CrossRef]
  30. Fiorentino, M.; Uva, A.E.; Gattullo, M.; Debernardis, S.; Monno, G. Augmented Reality on Large Screen for Interactive Maintenance Instructions. Comput. Ind. 2014, 65, 270–278. [Google Scholar] [CrossRef]
  31. Masood, T.; Egger, J. Augmented Reality in Support of Industry 4.0—Implementation Challenges and Success Factors. Robot. Comput.-Integr. Manuf. 2019, 58, 181–195. [Google Scholar] [CrossRef]
  32. Iben, H.; Baumann, H.; Ruthenbeck, C.; Klug, T. Visual Based Picking Supported by Context Awareness: Comparing Picking Performance Using Paper-Based Lists versus Lists Presented on a Head Mounted Display with Contextual Support. In Proceedings of the 2009 International Conference on Multimodal Interfaces, ICMI-MLMI ’09, Cambridge, MA, USA, 2–6 November 2009; Association for Computing Machinery: New York, NY, USA, 2009; pp. 281–288. [Google Scholar] [CrossRef]
  33. Theis, S.; Mertens, A.; Wille, M.; Rasche, P.; Alexander, T.; Schlick, C.M. Effects of Data Glasses on Human Workload and Performance during Assembly and Disassembly Tasks. In Proceedings of the 19th Triennial Congress of the IEA, Melbourne, Australia, 9–14 August 2015; Volume 9, pp. 14–21. [Google Scholar]
  34. Wille, M.; Grauel, B.; Adolph, L. Strain Caused by Head Mounted Displays. In Proceedings of the Human Factors and Ergonomics Society Europe, Torino, Italy, 13–15 October 2013; pp. 267–277. [Google Scholar]
  35. Pfendler, C.; Thun, J. Geografische Orientierung Mit Egozentrischen Und Geozentrischen Karten Auf Einem Head-Mounted Display und Einem Personal Digital Assistant; Fraunhofer FKIE Bericht: Wachtberg, Germany, 2010. [Google Scholar]
  36. Agnew, J.; Bolla-Wilson, K.; Kawas, C.H.; Bleecker, M.L. Purdue Pegboard Age and Sex Norms for People 40 Years Old and Older. Dev. Neuropsychol. 1988, 4, 29–35. [Google Scholar] [CrossRef]
  37. Berger, M.A.M.; Krul, A.J.; Daanen, H.A.M. Task Specificity of Finger Dexterity Tests. Appl. Ergon. 2009, 40, 145–147. [Google Scholar] [CrossRef] [PubMed]
  38. Lawson, I. Purdue Pegboard Test. Occup. Med. 2019, 69, 376–377. [Google Scholar] [CrossRef]
  39. Rule, K.; Ferro, J.; Hoffman, A.; Williams, J.; Golshiri, S.; Padre, R.; Avila, J.; Coca, C.; Valdes, K. Purdue Manual Dexterity Testing: A Cohort Study of Community-Dwelling Elderly. J. Hand Ther. 2021, 34, 116–120. [Google Scholar] [CrossRef] [PubMed]
  40. Desrosiers, J.; Rochette, A.; Hébert, R.; Bravo, G. The Minnesota Manual Dexterity Test: Reliability, Validity and Reference Values Studies with Healthy Elderly People. Can. J. Occup. Ther. 1997, 64, 270–276. [Google Scholar] [CrossRef]
  41. Wang, Y.-C.; Wickstrom, R.; Yen, S.-C.; Kapellusch, J.; Grogan, K.A. Assessing Manual Dexterity: Comparing the WorkAbility Rate of Manipulation Test with the Minnesota Manual Dexterity Test. J. Hand Ther. 2018, 31, 339–347. [Google Scholar] [CrossRef]
  42. Brooke, J. SUS-A Quick and Dirty Usability Scale. Usability Eval. Ind. 1996, 189, 4–7. [Google Scholar]
  43. Bangor, A.; Kortum, P.T.; Miller, J.T. An Empirical Evaluation of the System Usability Scale. Int. J. Hum.-Comput. Interact. 2008, 24, 574–594. [Google Scholar] [CrossRef]
  44. ISO 9241-11:2018; Ergonomics of Human-System Interaction—Part 11: Usability: Definitions and Concepts. International Standard Organization (ISO): Geneva, Switzerland, 2018. Available online: https://www.iso.org/obp/ui/#iso:std:iso:9241:-11:ed-2:v1:en (accessed on 18 January 2023).
Figure 1. Manual dexterity test kits. (a) Purdue Pegboard Test (PPT); (b) Minnesota Dexterity Test (MDT).
Applsci 13 02186 g001
Figure 2. A desktop computer.
Applsci 13 02186 g002
Figure 3. Components in the assembly/disassembly tasks. (a) Fan; (b) power supply; (c) DVD drive; (d) motherboard.
Applsci 13 02186 g003
Figure 4. Step 1 of disassembly task in the printed manual.
Applsci 13 02186 g004
Figure 5. Video display showing how to unplug the cable of the fan connected to the motherboard in the disassembly task (step 3).
Applsci 13 02186 g005
Figure 6. Microsoft® HoloLens 2 AR glasses.
Applsci 13 02186 g006
Figure 7. Virtual image in the HoloLens 2 showing both the text explanation to unscrew the power supply unit and the highlighted (dotted circles) screws to be unscrewed and removed (step 5 of disassembly task).
Applsci 13 02186 g007
Figure 8. A virtual hand highlights the cable needed to be unplugged.
Applsci 13 02186 g008
Figure 9. Virtual hands show how to grab the motherboard to move it out.
Applsci 13 02186 g009
Figure 10. A virtual hand shows that a push on the DVD drive is needed to remove it from computer case.
Applsci 13 02186 g010
Figure 11. Job instruction on a printed manual.
Applsci 13 02186 g011
Figure 12. Job instruction via a video display.
Applsci 13 02186 g012
Figure 13. Job instruction via an AR display.
Applsci 13 02186 g013
Figure 14. Interaction effects of gender and job instructions on the score of ease of use.
Applsci 13 02186 g014
Table 1. Steps of assembly and disassembly tasks.
Assembly TaskDisassembly Task
1. Pick up the DVD drive from the table and put it into the DVD slot of the case.1. Use a screwdriver to unscrew two screws of the panel. Put the screws in grid 1 in the container on the right.
2. Pick up the screwdriver and two screws in grid 5 of the container. Tighten the screws to fix the DVD drive.2. Pull and remove the panel and put it in the assigned location on the table.
3. Pick up the motherboard on the table using both hands and put it in the assigned area inside the computer case.3. Unplug the fan cable connected to the motherboard.
4. Pick up the screwdriver and 8 screws in grid 4 of the container. Tighten the screws to fix the motherboard.4. Use a screwdriver to unscrew 4 screws of the fan unit and put them in grid 2 in the container. Put the fan unit in the assigned location on the table.
5. Pick up the power supply unit on the table and put it in the assigned location inside the computer case.5. Use a screwdriver to unscrew 4 screws of the power supply unit and put the screws in grid 3 of the container.
6. Pick up the screwdriver and 4 screws in grid 3 of the container. Tighten the screws to fix the power supply unit.6. Unplug the two cables of the power supply connected to the motherboard. Unplug the 3rd cable of the power supply connected to the DVD drive.
7. Grab a cable connector attached to the power supply unit (see the job instruction) and plug it into the designated slot on the motherboard. Press it firmly. Grab another cable connector attached to the power supply (see the job instruction) and plug it into another designated slot on the motherboard. Press it firmly. Grab the third cable connector attached to the power supply (see the job instruction) and plug it into the designated slot on the DVD drive. Press it firmly to ensure successful connection.7. Remove the power supply unit and put it in the assigned location on the table.
8. Pick up the fan unit on the table and put it in the assigned area inside the computer case.8. Use a screwdriver to unscrew 8 screws fixing the motherboard and put the screws in grid 4 in the container.
9. Pick up the screwdriver and 4 screws in grid 2 of the container. Tighten the screws to fix the fan unit.9. Take the motherboard out using both hands and put it in the assigned location on the table.
10. Grab the connector of the fan cable and plug it into the designated slot on the motherboard. Press it firmly to ensure successful connection.10. Use a screwdriver to unscrew the two screws of the DVD drive and put them in grid 5 in the container.
11. Pick up the panel on the table using both hands and put it on the top of the computer case.11. Push then pull out the DVD drive from its slot and put it in the assigned location on the table.
12. Pick up the screwdriver and 2 screws in grid 1 of the container. Tighten the screws to fix the panel.
Table 2. Mean (SD) scores of the PPT and MDT.
PPTdPPTaMDTd (s)MDTt (s)
Female16.70 (1.16)43.40 (3.08)62.35 (4.55)55.80 (8.16)
Male16.86 (1.75)41.55 (6.31)60.55 (6.24)51.73 (6.86)
Note: PPTd: dominant hand test of the PPT; PPTa: assembly test using both hands of the PPT; MDTd: placing test using dominant hand of the MDT; MDTt: turning test using both hands of the MDT.
Table 3. Means and standard deviations (SD) of the time(s) to complete the task.
TaskGenderInstructionMeanSD
AssemblyFemaleAR872.30253.52
Printed manual804.10182.90
Video878.90257.28
MaleAR817.72173.96
Printed manual797.63333.39
Video678.45159.66
DisassemblyFemaleAR657.90 *237.49
Printed manual482.50170.80
Video404.3082.99
MaleAR519.4577.96
Printed manual430.09115.07
Video433.18112.94
* p < 0.05.
Table 4. Number of errors per participant during performing the task.
GenderAR InstructionVideo InstructionPrinted Manual
Female0.400.701.50
Male0.270.551.18
total0.33 *0.621.33
* p < 0.05.
Table 5. Pearson’s correlation coefficients between time to complete the task and hand dexterity test score.
AssemblyDisassembly
Printed ManualVideoARPrinted ManualVideoAR
PPTd0.10−0.47 *−0.52 *−0.37−0.04−0.24
PPTa0.34−0.25−0.12−0.140.170.11
MDTd−0.100.43 *0.230.250.050.17
MDTt−0.020.46 *0.360.160.09−0.07
* p < 0.05.
Table 6. Means and standard deviations (SD) of the SUS score.
TableGenderInstructionSUS
MeanSD
AssemblyFemalesAR52.0012.00
Printed manual52.7511.87
Video60.759.13
MalesAR63.6317.04
Printed manual66.5915.05
Video67.7210.98
DisassemblyFemalesAR52.2515.91
Printed manual54.0013.29
Video62.0012.57
MalesAR73.8614.67
Printed manual65.6820.55
Video71.3612.61
Disclaimer/Publisher’s Note: The statements, opinions and data contained in all publications are solely those of the individual author(s) and contributor(s) and not of MDPI and/or the editor(s). MDPI and/or the editor(s) disclaim responsibility for any injury to people or property resulting from any ideas, methods, instructions or products referred to in the content.

