Abstract
The Folin-Ciocalteu assay is a widely used method for measuring the total phenolic content (TPC) in honey, but it can be affected by the presence of reducing sugars in honey, which can lead to interference and an over-estimation of its TPC. To optimize the Folin-Ciocalteu assay for honey analysis, the effect of pH on the assay was investigated. A number of pH scenarios were tested using different concentrations of Na2CO3 (0.00%, 0.75%, 0.94%, and 7.50%) in order to minimize reducing sugar interference and maximize the reaction of phenolics in the assay. The modified TPC method was then validated in accordance with current International Council on Harmonisation (ICH) guidelines. The findings of this study demonstrate that the traditional Folin-Ciocalteu assay (using 7.50% aqueous Na2CO3 solution, pH 10.8) leads to a significant overestimation of the TPC of honey due to the interference of reducing sugars. However, a pH of 7.9, achieved by using a 0.75% aqueous Na2CO3 solution, provides suitable conditions to account for most of the phenolic compounds without interference from reducing sugars. This finding was further confirmed by testing various sugar solutions and artificial honey which yielded TPC values below the established limit of detection and quantification of the assay. However, a slight increase in pH, even by a moderate deviation (pH 8.9), leads to significant discrepancies in absorbance readings, indicating that pH control is crucial for the accurate analysis of TPC in honey.
1. Introduction
Honey is a natural food product made by Apis mellifera bees from the nectar of plants or honeydew with the aid of enzymes secreted from the glands of worker bees [1]. With its high sugar content (approximately 80%), honey acts as a major source of carbohydrates for bees. The sugars mainly comprise the monosaccharides fructose and glucose, and to a lesser extent, the disaccharides sucrose and maltose. Honey also contains about 17% water [2,3].
The remaining approximately 3% is made up of a very diverse range of up to 200 different compounds, which are often related to the honey’s floral source [3]. Taken together, these “other” constituents significantly contribute to the honey’s organoleptic characteristics and its bioactivities [4]. Amongst them are a range of phenolic compounds, including phenolic acids (e.g., gallic acid, p-hydroxybenzoic acid, caffeic acid) and various flavonoids such as flavonols (e.g., kaempferol, quercetin), flavones (e.g., apigenin, chrysin, luteolin), flavanones, flavanols, anthocyanidins, isoflavones, and chalcones [3,5,6,7,8]. The presence of phenolic compounds in food products, beverages, honey, and other natural products is of interest as they have been linked to a range of potentially useful bioactivities [3], including antioxidant effects like radical scavenging activity and inhibition of lipid oxidation [3]. The determination of the total phenolics content (TPC) of various food products and beverages and with this an inference on their potential antioxidant activity in vivo is therefore very common.
The TPC assay, also known as the Folin-Ciocalteu (FC) method, is well established and uses the FC reagent to oxidise phenolic compounds. The reaction results in a blue-coloured reduced FC reagent, which is measured at 760 nm [9] with the intensity of the blue colour correlating with the sample’s phenolics content [10]. When carrying out the traditional FC assay in Na2CO3, the basic reaction conditions maximise the reaction’s efficiency as it proceeds faster with phenolates compared to phenols [9]. However, since the assay is based on a redox reaction, compounds other than phenolics, for instance reducing sugars (e.g., glucose, fructose, maltose) and ascorbic acid, are also able to reduce the FC reagent [9,10].
The interference has been documented for certain food products, such as fruit juice [11] and vegetables [12], but is normally of minor concern for most food items as they have relatively low sugar and Vitamin C contents [10]. For food rich in sugar like beets, apples, oranges, and milk chocolates, where sugars are a major component, Vinson employed an acidic version of the FC assay [13,14]. Reducing sugars and enolates, for example ascorbic acid and dehydroascorbic acid, were also found to be a major interference in the FC assay of flours. To improve the specificity of the analysis, Pico et al. [15] introduced solid phase extraction as a pre-assay clean-up technique, Carrez clarification, and subtracting the ascorbic acid reducing activity. Furthermore, an assay known as Fast Blue BB assay was utilized and was found to eliminate sugar interference, but interference of tyrosine was observed, necessitating SPE extraction prior to analysis [15]. Bridi et al. [16] also reported the interference of reducing sugars in measuring the TPC of beverages like commercial fruit juices, powdered fruit juices, iced tea, and wines and attempted to improve the specificity of the assay using polyvinylpolypyrrolidone (PVPP) to remove the non-phenolic constituents from the samples. However, the findings of the study indicate that PVPP was unable to adsorb these interfering compounds, in particular fructose, despite its effectiveness in separating phenolics from their original food matrix. Magalhães et al. also acknowledged the interference of sugar in the analysis of beer, wines, teas, and fruit juices and improved the sensitivity of the assay by using sodium hydroxide instead of the typical sodium carbonate as a base [17]. Sánchez-Rangel et al. [10] acknowledged the interference of sugars and ascorbic acid in the measurement of TPC in strawberry, kiwifruit, and carrots. The methods tested included the use of solid phase extraction (SPE) to remove interfering substances, hydrogen peroxide (H2O2) treatments, and the quantification of ascorbic acid (AA) to obtain a corrected TPC. The authors also proposed a modification to the FC assay procedure that allows the simultaneous quantification of total AA content and TPC in plant food extracts. The findings demonstrated that SPE is only recommended for flavonoids, while H2O2 treatments may result in an overestimation of TPC values if a proper standard is not selected. The proposed method of obtaining the total AA content to calculate the corrected TPC was, however, found to be a simple and efficient approach as it allows the simultaneous quantification of both TPC and total AA content without additional requirements of chemicals and equipment.
In honey, its high sugar content can affect the accuracy of TPC measurements, particularly when using the traditional FC assay [9]. This sugar interference can make it difficult to compare TPC results in honey with those of food products and beverages with lower sugar contents. To address this issue, some researchers have attempted to reduce sugar interference in honey analysis. Beretta et al. [18] employed an acidic version of the FC assay, as suggested by Vinson [13,14], whereas Šarić et al., utilized PVPP as a pre-assay clean-up step prior to TPC analysis [19]. Finally, Nakaya et al. [20] utilized phenolic honey extracts in their TPC determination.
A multitude of more advanced methods has also been published for the determination and often also quantification of phenolic constituents in honey. In a recent review, it was found that HPLC is the most popular method, followed by LC-MS [8]. More recently, a novel approach, using HPTLC derived data has also been published [21]. While an interference of honey’s sugar matrix might be of no concern for these analyses, they nonetheless face their own set of challenges, such as higher costs and more complex instrumentation, and also a strong dependence on the availability of appropriate phenolic standards. Moreover, an identification/quantification approach is taking a very different angle to the total phenolics content assay reported here, which is meant to be a basic screening tool for the total activity of a given sample, rather than a focus on individual constituents that might contribute to this effect. Both approaches are useful and complementary rather than mutually exclusive.
Based on the review of 217 papers that reported the antioxidant activity in honeys across the globe, 95% of the said papers correlated the observed antioxidant activity with the honeys’ TPC. It can also be concluded from this review that for expressing the TPC in honey, the FC assay remains an assay of choice [22,23,24,25,26,27,28,29,30,31,32,33,34,35,36,37,38,39,40,41,42,43,44,45,46], even though a more sophisticated HPLC-based total phenolic quantification is also available [47,48]. Therefore, the aim of this study is to modify the traditional FC assay for determining the TPC in honey with an emphasis on minimising the sugar matrix effect.
2. Materials and Methods
2.1. Chemicals and Reagents
The chemicals and reagents that were used in this study were obtained as follows: Folin-Ciocalteu Phenol solution 2N, fructose, and maltose were from Sigma-Aldrich, Truganina, Victoria, Australia; galactose, glucose, lactose, maltodextrin, mannose, anhydrous sodium carbonate, sucrose, and xylose were from Chem-Supply Pty Ltd., Port Adelaide, South Australia, Australia; and 3,4,5-trihydroxybenzoic acid (gallic acid) was from Ajax Chemicals Ltd., Sydney, New South Wales, Australia. All reagents were of analytical reagent grade and water used was deionised.
2.2. Honey Samples and Preparation
Table 1 shows the details of the honey samples used in the study. To ensure sample homogeneity prior to sampling, the respective honeys were warmed in a water bath at no more than 40 °C for 10 min and then stirred. A 20% m/v honey solution was prepared by weighing ≥0.400 g of the warm and homogenised honeys and made up volumetrically to 2.00 mL with deionised water, followed by vortex mixing. All honey solutions were prepared in triplicate.

Table 1.
Honey Samples used in the study.
2.3. Preparation of Reagents and Standards
The FC reagent was prepared by mixing 1 mL of FC Phenol solution with 30 mL of deionised water. Aqueous solutions of anhydrous sodium carbonate with concentrations of 0.75%, 0.94%, and 7.5% (w/v) were also prepared. An artificial honey stock solution consisting of 43.25% fructose, 36.25% glucose, 2.00% maltose, 1.50% sucrose, and 17.00% water was also prepared. The solution was diluted with water to the required concentration (0.4 g/mL) then stored under refrigeration and used within a week, both as a spiking solution for samples and as a blanking solution for UV measurements in the total phenolic assays [49]. Furthermore, aqueous solutions of artificial honey, fructose, galactose, glucose, lactose, maltodextrin, maltose, mannose, sucrose, and xylose, all at a concentration of 20% w/v, were prepared as controls. A gallic acid stock solution (2 mg/mL) was prepared by dissolving 200 mg of gallic acid in 100 mL of deionised water, and varying concentrations were prepared depending on the analysis performed as indicated in Table 2. All reagents were freshly prepared prior to use.
Table 2.
Assay Parameters used to Optimise and to Validate the Modified FC Assay.
2.4. Folin-Ciocalteu Assays
This study performed a thorough evaluation of the FC assay using four distinct stages of analysis: optimization, validation, confirmation of sugar matrix reduction, and application. Table 2 provides a detailed breakdown of the assay conditions used in each stage of the analysis.
The traditional FC assay, as described by Singleton et al. (1999), is performed in strongly basic conditions (pH 10.9) using 7.5% w/v sodium carbonate solution. The FC assay has also been performed in strongly acidic conditions (pH 1.8) using water in lieu of the sodium carbonate solution [9]. In this study, the FC assay was performed in pH 10.9 and in pH 1.8, following the methods of Singleton et al. and Beretta et al., respectively, with slight modifications. In addition, the FC assay was modified to minimise the sugar matrix effect for honey analysis by performing the assay in slightly basic conditions (pH 7.9 and 8.9) using 0.75% and 0.94% (w/v) sodium carbonate solutions (see Table 2 for details on each assay condition).
In all the assays above, 1 mL of FC reagent was added to 200 µL of the respective gallic acid standards or samples or to 200 µL gallic acid-spiked artificial honey solution (0.4 mg/mL). The mixtures were allowed to react for 5 min at ambient temperature before 800 µL of Na2CO3 solution (0.00%, 0.75%, 0.94%, or 7.50% w/v) were added. The resulting mixtures were incubated without light exposure for 2 h before their absorbance was measured at 760 nm (Carry 60 Bio UV-Vis Spectrophotometer). Two hundred microliters of water or water spiked with artificial honey solution (0.4 mg/mL), along with the other reagents used in the assay were used as blanks for the UV measurements of untreated (non-spiked) and spiked gallic acid standards, respectively. Samples were analysed in triplicate, and the mean results for each sample were obtained. A more detailed description of all assay parameters is included in Table 2.
To optimise the conditions for the FC assay for the specific context of honey analysis, parameters such as effect of change in pH and incubation time were investigated.
2.4.1. Effect of pH
To determine the effect of pH, the FC assay was conducted at varying pH conditions specifically at 1.8, 7.9, 8.9, and 10.9 achieved using 0.00%, 0.75%, 0.94%, and 7.50% w/v of aqueous sodium carbonate solution, respectively. The absorbance of untreated gallic acid samples were compared with the absorbances of gallic acid samples spiked and blanked with artificial honey (see Table 2 for specific assay parameters).
2.4.2. Effect of Incubation Time
The effect of incubation time on the absorbance of the gallic acid standards was also determined by subjecting the samples to either 2 h or 3 h of incubation in the modified version of the FC assay (see Table 2 for the specific assay parameters used).
2.5. Validation of the Modified Folin-Ciocalteu Assay Suited to Honey Analysis
Based on the guidelines provided by the International Council for Harmonisation (ICH), specificity, range and linearity, limit of detection, limit of quantification, accuracy, and precision as well as robustness were evaluated for the modified FC assay which was specifically developed for the determination of TPC in honey.
2.5.1. Specificity
The specificity of an assay is defined as its capability to determine the analyte in the presence of additional components such as impurities, degradation products, and matrix compounds [50]. In this study, the specificity of the modified assay was assessed by comparing the absorbance obtained from an artificial honey matrix with that from the artificial honey matrix containing gallic acid. Furthermore, to confirm whether the sugar matrix effect was minimised in the modified assay conditions, 20% (m/v) aqueous solutions of fructose, galactose, glucose, lactose, maltodextrin, maltose, mannose, sucrose, and xylose as well as the artificial honey stock solution were all assayed, and the results were expressed as mg GAE/100 g (see Table 2 for the specific assay parameters used).
2.5.2. Linearity and Range
The linearity and range of the modified assay was evaluated by testing different concentrations of the working standard corresponding to 20–200% of the target concentration. Replicate determinations (n = 3) were carried out for each test concentration in a randomised manner, and the peak areas were plotted against test concentrations. Statistical analysis was performed via the least squares method. Linearity was predicted by estimating the regression coefficient (R2), and the linear regression y-intercept of the response versus concentration plot [50] (see Table 2 for the specific assay parameters used).
2.5.3. Limit of Detection (LOD) and Limit of Quantification (LOQ)
These parameters are useful to demonstrate the sensitivity of the method and show that the analysis is conducted in a concentration range that is above the quantitation limit. LOD and LOQ for the modified assay were determined from the linearity study using a linear regression model as defined by the ICH Q2(R1) guidelines [50] (see Table 2 for the specific assay parameters used). The parameters were calculated using the following equations:
where: σ is the standard deviation of the response and S is the slope of the calibration curve.
2.5.4. Accuracy
The accuracy of the modified assay was evaluated by applying the modified assay method to the analysis of artificial honey spiked with known amounts of gallic acid covering the linear range of the method and equivalent to 80%, 100%, and 120% of the nominal levels. The accuracy (% recovery) was calculated as the percentage of gallic acid detected in the spiked samples [50] (see Table 2 for the specific assay parameters used).
2.5.5. Precision
The precision of the modified assay was assessed by repeatability (intraday) and intermediate precision. The intraday precision was verified through the analysis of 50, 70, and 80 µg/mL gallic acid standards (n = 3) on the same day and under the same experimental conditions. The intermediate precision of the method was assessed by carrying out the analysis on three different days (interday) in the same laboratory. The test samples were analysed, and the results evaluated based on the relative standard deviation (RSD) (see Table 2 for the specific assay parameters used).
2.5.6. Robustness
To test the robustness of the modified total phenolics assay, the impact of changes to incubation time and pH of the reaction were investigated as described in Section 2.4 (see Table 2 for the specific assay parameters used).
2.6. Measurement of Total Phenolics Content of Honeys Using Different Folin-Ciocalteu Assays
The TPC of the four honeys (see Table 1) was determined at four different pH levels using the methods described in Section 2.4. The TPC obtained from each assay was expressed as gallic acid equivalents (GAE) per 100 g of honey sample (see Table 2 for the specific assay parameters used).
2.7. Statistical Analysis
The t-test and one-way ANOVA analyses (statistical significance was set at p > 0.05) with Tukey’s post hoc comparison were carried out using Graphpad Prism 9.5.0 (730) (GraphPad Software, San Diego, CA, USA).
3. Results and Discussion
3.1. Modification of the Folin-Ciocalteu Assay Suited to Honey Analysis
3.1.1. pH Effect
To optimise the FC assay conditions for honey analysis, different pH scenarios were trialed using different concentrations of Na2CO3 with the aim to minimise reducing sugar interference and maximise the reaction of phenolics in the assay. The extent of sugar interference was determined by comparing the absorbances of gallic acid samples with gallic acid samples spiked and blanked with artificial honey solution (0.4 g/mL). It was assumed that the absorbance readings of both samples would be very similar if there was no sugar interference.
Figure 1 captures the extent of interference of reducing sugars in honey when the assay is carried out with gallic acid as a test sample (blanked with water) as compared to being spiked and blanked with 0.4 g/mL artificial honey solution using 7.50% aqueous Na2CO3 (pH 10.8), in line with the traditional FC assay conditions. A significant difference (p =< 0.0001) in the mean (n = 3) absorbance of both the 20 and 40 µg/mL aqueous gallic acid solutions can be observed with the mean absorbance of the spiked solutions being 49.33% (for 20 µg/mL) and 48.61% (for 40 µg/mL) higher.
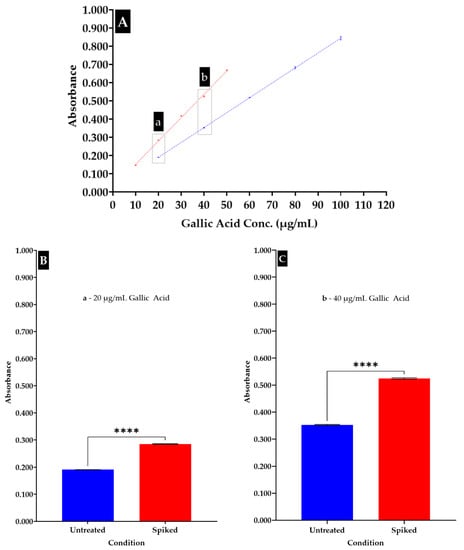
Figure 1.
(A–C). (A)—Comparison of the standard curve of gallic acid blanked with water (blue line) and of gallic acid spiked and blanked with 0.4 g/mL artificial honey solution (red line); (B,C) show the absorbances of 20 µg/mL and 40 µg/mL concentrations of gallic acid blanked with water (blue) and spiked and blanked with 0.4 g/mL artificial honey solution (red). Both assays used FC reagent and 7.50% Na2CO3 (pH 10.8). Significance levels were determined using a two-tailed t-test and is indicated as **** = p < 0.0001.
This confirms the findings of previous studies that have reported the interference of reducing sugars when using the FC reagent at high pH [12,15,17].
The literature also reports the use of acidic assay conditions for the FC method [24,29,51], which can be achieved by replacing the 7.50% Na2CO3 solution with water due to the acidic nature of the FC reagent. The assay of 20 µg/mL and 40 µg/mL gallic acid solutions and gallic acid solutions spiked and blanked with artificial honey under acidic conditions (pH 1.8, achieved by replacing Na2CO3 with water) resulted in very similar absorbance values, indicating an absence of or negligible sugar interference (Figure 2). Statistically, no significant difference in the mean (n = 3) of the absorbances of 20 µg/mL gallic solution for both conditions was noted when treated with FC reagent and 0.00% Na2CO3 solution (p = 0.1028). However, a significant increase in the absorbance of the 40 µg/mL gallic acid solution when compared with the same solution spiked and blanked with the artificial honey solution could be noted (p = 0.0074), but the said increase was only 2.77%. An overall marked decrease in absorbance readings was, however, noted for the samples analysed under acidic conditions (absorbance range 0.020–0.150, see Figure 2) compared to corresponding samples analysed under basic conditions (absorbance range 0.050–0.650, see Figure 1). This reduction in absorbance might be explained by a reduced reaction rate of phenolics compared to the corresponding phenolates. Ultimately, this might lead to an underestimation of the TPC of the honey sample.
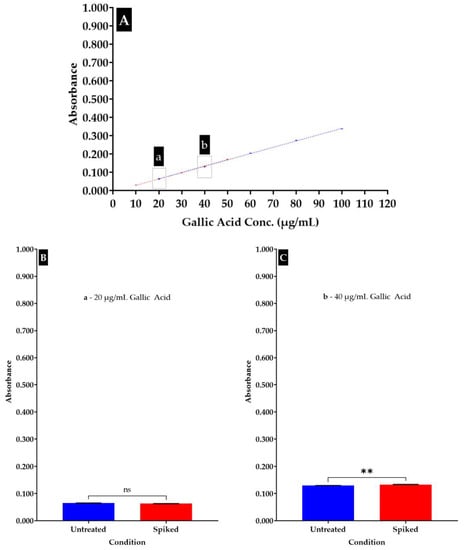
Figure 2.
(A–C). (A)—Comparison of the standard curve of gallic acid blanked with water (blue line) and of gallic acid spiked and blanked with 0.4 g/mL artificial honey solution (red line); (B,C) show the absorbances of 20 µg/mL and 40 µg/mL gallic acid solutions blanked with water (blue) and spiked and blanked with 0.4 g/mL artificial honey solutions (red). Both assays used FC reagent and 0.00% Na2CO3 (pH 1.8). Significance levels were determined using a two-tailed t-test and are indicated as ns = not significant, and ** = p < 0.005).
A pH of about 7.9, achieved by using 0.75% aqueous Na2CO3 solution, was found to provide suitable conditions with most of the phenolic compounds being accounted with very minimal interference from reducing sugars (Figure 3). Although the difference between the means of the untreated and spiked samples were statistically significant (p = 0.0015 for 20 µg/mL and p = 0.0001 for 40 µg/mL), a very low difference in the absorbance readings was detected (5.72% for 20 µg/mL and 5.97% for 40 µg/mL). It is also noteworthy that the absorbance readings were considerably higher compared to those obtained under acidic conditions (absorbance range 0.050–0.350, see Figure 2).
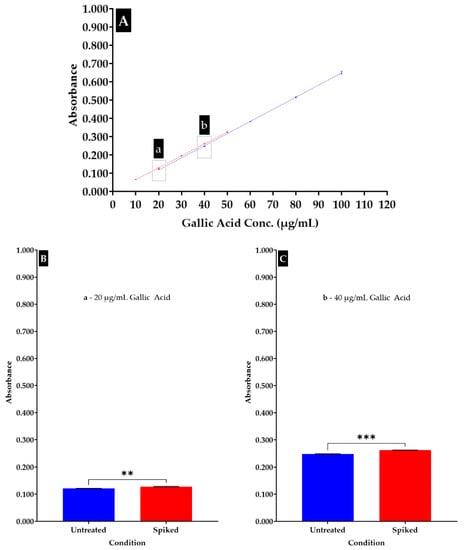
Figure 3.
(A–C). Comparison of the standard curve of gallic acid blanked with water (blue line) and of gallic acid spiked and blanked with 0.4 g/mL artificial honey solution (red line); (B,C) shows the absorbances of 20 µg/mL and 40 µg/mL solutions of gallic acid blanked with water (blue) and spiked and blanked with 0.4 g/mL artificial honey solution (red). Both assays used FC reagent and 0.75% Na2CO3 (pH 10.8). Significance levels were determined using a two-tailed t-test and are indicated as ** = p < 0.005 and *** = p < 0.0005).
It was also tested whether a slight increase in pH can affect sugar interference. As is evident from Figure 4, it was found that even a moderate deviation in pH (pH 8.9) by using a 0.94% aqueous solution of Na2CO3 leads to discrepancies in absorbance readings for equivalent gallic acid concentrations (p =< 0.0001, 13.33% difference for 20 µg/mL and p =< 0.0001, 15.95% difference for 40 µg/mL).
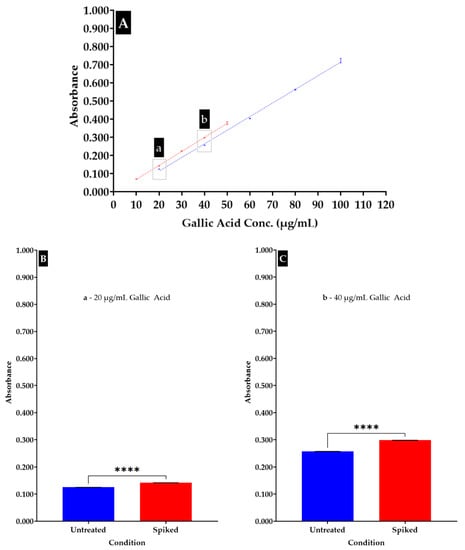
Figure 4.
(A–C). Comparison of the standard curve of gallic acid solution blanked with water (blue line) and of gallic acid solution spiked and blanked with 0.4 g/mL artificial honey solution (red line); (B,C) show the absorbances of 20 µg/mL and 40 µg/mL solutions of gallic acid blanked with water (blue) and spiked and blanked with 0.4 g/mL artificial honey solution (red). Both assays used FC reagent and 0.94% Na2CO3 (pH 10.8). Significance levels were determined using a two-tailed t-test and is indicated as **** = p < 0.0001).
3.1.2. Effect of Incubation Time
Incubation time was also noticed to play a part in the modified FC assay. Figure 5 compares the standard curve of gallic acid incubated for 2 and 3 h after being treated with FC reagent. It was found that an incubation time of 2 h ensured that reducing sugars were not accounted for but phenolics present in the sample had sufficient time to react. After 3 h of incubation, an increase in absorbance readings was noted, which might stem from a partial, albeit slow, reaction of sugars. The interference in the FC assay is mainly due to reducing sugars, as established by Pico and colleagues [36]. Carmona-Hernandez et al., optimized the assay for the analysis of Colombian Passion Fruits, using 3.5% Na2CO3 and tested three incubation time points (0.5, 1.5, and 3.33 h). Their findings demonstrated that the TPC was highest when measured after 1.5 h [52]. These findings highlight the importance of carefully considering the incubation time in the FC assay to obtain accurate results.
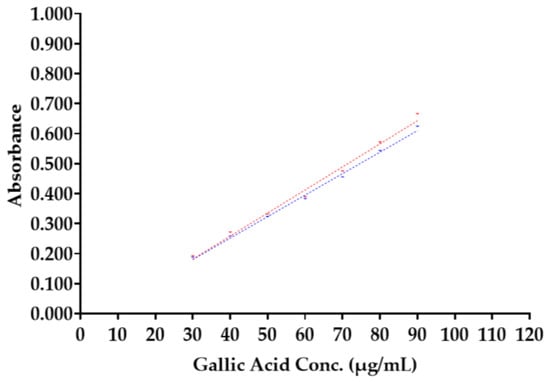
Figure 5.
Comparison of the standard curves of gallic acid spiked and blanked with 0.4 g/mL artificial honey solution after treatment with FC reagent and 0.75% Na2CO3 (pH 7.9) after 2 h of incubation (blue line) and after 3 h of incubation (red line).
3.2. Validation of the Modified Folin-Ciocalteu Assay Suited to Honey Analysis
3.2.1. Specificity
Specificity reflects the ability of an assay to detect the analyte(s) in the presence of other constituents. In the specific context of honey analysis, the traditional FC assay (pH 10.8) lacks sufficient specificity as, under basic conditions, other reductants (e.g., reducing sugars) and not just phenolics, will react (Figure 1). Therefore, changes were made to the assay protocol to increase its specificity for the analysis of TPC of honey. Figure 3 illustrates the increased specificity of the modified assay at pH 7.9. Earlier, it was described that reducing sugars also have the ability to react with the FC reagent under strongly basic reaction conditions, a finding that has also been confirmed by other researchers [12,15,17]. Figure 2 demonstrates that lowering the pH effectively removes this interference which is in accordance with other studies [13,51].
To confirm the effectiveness of the modified FC assay protocol in minimizing the interference of the sugar matrix, 20% m/v aqueous solutions of individual sugars and also an artificial honey solution (see Section 2.4 for composition) were also analysed using the modified protocol. Table 3 illustrates that the artificial honey solution produced a detectable reaction in the modified assay, equivalent to 0.59 ± 0.02 mg GAE/100 g, whereas among the individual sugar solutions, only maltodextrin (2.82 ± 0.16), fructose (2.23 ± 0.06), galactose (0.55 ± 0.07), and sucrose (0.08 ± 0.03) could be detected; however, all were below the established limit of quantification of the assay.
Table 3.
Total Phenolic Content of Sugar Solutions.
The impact of reducing sugars on the FC assay was explored in a number of previous studies. Muñoz-Bernal et al., found that among the tested sugars (glucose, sucrose, fructose, xylose, mannose, rhamnose, and arabinose), glucose and sucrose had the least effect while fructose and xylose had the highest effect [12]. Bastola et al. reported significant interference from xylose, while glucose also had a noticeable interference when 11.50% Na2CO3 was used [58]. Magalhães et al., found that glucose had higher interference compared to fructose, with sucrose showing no reaction in the assay [17].
The findings of this study demonstrate that only fructose, sucrose, and galactose, which are commonly found in honeys, react under the modified assay condition, but that their interference, while not completely hindered, can be minimized by adjusting the pH to 7.9.
The artificial honey analyzed in this study contained glucose, fructose, sucrose, and maltose, and its detectable reaction was most likely due to its fructose and sucrose constituents. Magalhães et al. [17] discovered an additive effect when fructose is combined with gallic acid and analyzed using the FC assay with 6.00% base. Interestingly, in that study glucose was shown to have a synergistic effect, where it regenerates oxidized phenols to allow further reaction with the FC reagent. Therefore, spiking gallic acid standards with artificial honey solution can be assumed to eliminate various reaction mechanisms that cause interferences by reducing sugars. This highlights the effectiveness of the modified FC assay for analyzing samples with high sugar content, such as honey.
3.2.2. Range/Linearity
The linearity of the modified assay protocol was investigated by analysing, in triplicate, seven aqueous concentrations of gallic acid (30–90 µg/mL) spiked with artificial honey (0.2 g/mL). The correlation coefficients of the straight lines were found to be 0.9942, 0.9966, and 0.9984 respectively, demonstrating adequate linearity in the modified assay protocol.
3.2.3. Limit of Detection (LOD) and Limit of Quantitation (LOQ)
For the modified FC assay the LOD was found to be 2.55 µg/mL, and the LOQ was 7.74 µg/mL.
3.2.4. Accuracy
The results of the accuracy and precision tests are shown in Table 4. The percentage recovery was found to be 99.5, 99.1, and 100.2% for 50, 70, and 80 µg/mL gallic acid, respectively, which were all within the acceptable limit (95% confidence interval) stipulated by the ICH guidelines, confirming that the method is accurate in determining the TPC of honey.
Table 4.
Accuracy and Precision (n = 3).
3.2.5. Precision
The precision of the method, expressed as coefficient of variation, is also shown in Table 4 and is divided into intra-day precision and inter-day precision. All values were found to be less than 1%, thus within the acceptable limit (95% confidence interval) as per ICH guidelines, suggesting excellent precision.
3.2.6. Robustness
The robustness of an analytical procedure is a measure of its capacity to remain unaffected by small, but deliberate variations in method parameters and provides an indication of its reliability during normal usage. To test the robustness of the modified TPC assay, incubation time and the pH of the reaction were slightly modified. In terms of incubation time, the method was found to be robust if deviation from the 2 h incubation time was not greater than +30 min, as demonstrated by Figure 6. However, if the incubation time was extended from 2 h to 3 h, an increase in absorbance values could be noted (Figure 5). Similarly, as discussed earlier, the pH of the reaction appears to be an important factor (see Figure 1). In the specific context of the analysis of total phenolics in honey, the robustness of the FC method is therefore limited, and it is important to control incubation time and pH.
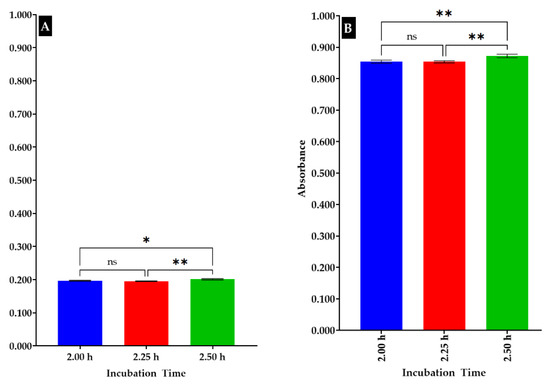
Figure 6.
(A,B). Comparison of the absorbances of 30 µg/mL (A) and 110 µg/mL (B) concentrations of gallic acid spiked and blanked with 0.4 g/mL artificial honey solution when treated with FC reagent and 0.75% Na2CO3 (pH 7.9) and measured after 2 h of incubation time (blue), after 2 h and 15 min of incubation time (red), and after 2 h and 30 min incubation time (green). Significance levels were determined using a one-way ANOVA (p < 0.0001) and Tukey post hoc comparison method was used to further compare the results, with different symbols indicating the level of significance (ns = not significant, * = p < 0.05, and ** = p < 0.005).
3.3. Honey Analysis
Table 5 shows the TPC (expressed as mg gallic acid equivalent/100 g sample) of four different commercial honeys measured using the FC assay in different pH conditions.
Table 5.
Total Phenolics Content (expressed in mg gallic acid equivalent/100 g sample) for different commercial honeys obtained by the FC Assay in different pH conditions.
The results demonstrate the strong pH-dependence of the assay and highlight the importance of carrying out the analysis in near neutral pH (7.9) to minimise any interference of reducing sugars and to maximise the reactivity associated with the various phenolics present in the honey samples; as can be seen from the data presented in Table 5, the absolute value of TPC can be more than triple for a honey, depending on the pH of the assay conditions. As has been demonstrated in this study, higher absorbance readings and thus higher calculated TPCs are found in strongly basic conditions (pH 10.8) due to the contributions of reducing sugars. Thus, in this instance, the TPC of the honeys is overestimated which is further reflected by the % difference of the calculated TPC for each samples when assayed with FC using the modified versus the traditional version of the assay. Comparing TPC data for acidic and slightly basic conditions, where sugar interference has been found to be below the limit of quantification (see Table 5), illustrates the different levels of reactivity associated with phenols and phenolates. To allow comparative analyses of the TPC between honey and other, less sugar-rich food items, which are traditionally analysed at basic pH where the various phenolic compounds are accounted for in their phenolate state, for the analysis of honey, the FC assay should be carried out at pH 7.9 to maximise absorbance readings from its phenolic constituents.
By employing the modified assay conditions, Jarrah (JAR) honey was found to contain 56.03 ± 0.57 and Manuka (MAN) honey 54.00 ± 1.44 mg GAE/100 g, and the TPC of two multifloral honeys (MIX and TAB) was 18.55 ± 0.08 and 34.60 ± 0.27 mg GAE/100 g, respectively. The TPC values determined in this study fall within previously reported TPC values for these honeys since Western Australian Jarrah (n = 6) was reported to have a TPC between 46.26 and 56.09 mg GAE/100 g with a mean of 50.58 ± 3.76, and for Australian and New Zealand Manuka honeys (n = 29), TPC values ranged between 22.60 and 66.30 mg GAE/100 g with a mean of 35.40 ± 10.54. The TPC of Western Australian multifloral honeys (n = 12) ranged from 17.60 to 45.90 with a reported mean TPC of 35.1 ± 10.9 mg GAE/100 g [59,60,61]. The difference in the TPC of each honey type can be attributed to the quantity and quality of its phenolic compounds [62].
Table 5 shows the percentage difference in the TPC obtained from the modified method and the traditional FC assay. It reflects the overestimation of TPC due to sugar interference. A relatively consistent level of percentage difference was observed for MIX, MAN, and JAR honeys (34.82, 36.40, and 29.53%, respectively). The value obtained for the multifloral TAB honey was lower (19.77%), which might be attributed to the reactivity and quantity of its phenolic compounds as well as its individual sugar profile [62]. However, more analyses would need to be carried out to confirm this assumption. Generally, the comparison of TPC values should be approached with caution, as only one honey sample each was analyzed in this study. Further investigations using larger sample sizes would be necessary to validate the results and provide a more accurate representation of the overall TPC values for these honeys.
4. Conclusions
This study aimed to improve the accuracy of the Folin-Ciocalteu assay for honey analysis by examining the impact of pH. The traditional method, which uses a 7.50% aqueous Na2CO3 solution (pH 10.8) was found to result in a significant overestimation of honey’s total phenolic content due its high sugar content, specifically the presence of reducing sugars. It could be demonstrated that a pH of 7.9, achieved using a 0.75% aqueous Na2CO3 solution, allows for an accurate measurement of phenolic compounds without interference from reducing sugars. This was confirmed by analyzing various sugar solutions and also an artificial honey. The modified method was validated according to the International Council on Harmonisation guidelines and found to produce precise, accurate, and repeatable results. Next to highlighting the importance of pH control, it could also be shown that an incubation time of 2 h (+30 min) is recommended to obtain accurate results. The modified assay was used in this study to determine the total phenolics content of four Western Australian honey samples (Jarrah, Manuka, and two multifloral honeys).
Author Contributions
Conceptualisation, E.S.N., A.A.M.S., I.L.L. and C.L.; methodology, E.S.N., A.A.M.S., I.L.L. and C.L.; formal analysis, E.S.N., A.A.M.S. and I.L.L.; writing—original draft preparation, E.S.N., A.A.M.S., I.L.L. and C.L.; writing—review and editing, C.L. and L.Y.L.; supervision, C.L. and L.Y.L.; project administration, C.L.; funding acquisition, C.L. All authors have read and agreed to the published version of the manuscript.
Funding
This research was funded by the Cooperative Research Centre for Honey Bee Products (CRC HBP) Project 33.
Institutional Review Board Statement
Not applicable.
Informed Consent Statement
Not applicable.
Data Availability Statement
Not applicable.
Acknowledgments
The authors would like to thank Edith Tang of the Division of Pharmacy, School of Allied Health, University of Western Australia for her invaluable input and guidance in performing the validation experiments.
Conflicts of Interest
The authors declare that they have no known competing financial interest or personal relationships that could have appeared to influence the work reported in this paper.
References
- White, J.W. Honey. Adv. Food Res. 1978, 24, 287–374. [Google Scholar] [PubMed]
- Da Silva, P.M.; Gauche, C.; Gonzaga, L.V.; Costa, A.C.O.; Fett, R. Honey: Chemical composition, stability and authenticity. Food Chem. 2016, 196, 309–323. [Google Scholar] [CrossRef] [PubMed]
- Ball, D.W. The Chemical Composition of Honey. J. Chem. Educ. 2007, 84, 1643. [Google Scholar] [CrossRef]
- Dai, Y.; Jin, R.; Verpoorte, R.; Lam, W.; Cheng, Y.C.; Xiao, Y.; Xu, J.; Zhang, L.; Qin, X.M.; Chen, S. Natural deep eutectic characteristics of honey improve the bioactivity and safety of traditional medicines. J. Ethnopharmacol. 2020, 250, 112460. [Google Scholar] [CrossRef] [PubMed]
- Jasicka-Misiak, I.; Gruyaert, S.; Poliwoda, A.; Kafarski, P. Chemical profiling of polyfloral belgian honey: Ellagic acid and pinocembrin as antioxidants and chemical markers. J. Chem. 2017, 2017, 5393158. [Google Scholar] [CrossRef]
- Perna, A.; Intaglietta, I.; Simonetti, A.; Gambacorta, E. A comparative study on phenolic profile, vitamin C content and antioxidant activity of Italian honeys of different botanical origin. Int. J. Food Sci. Technol. 2013, 48, 1899–1908. [Google Scholar] [CrossRef]
- Khalil, M.I.; Alam, N.; Moniruzzaman, M.; Sulaiman, S.A.; Gan, S.H. Phenolic Acid Composition and Antioxidant Properties of Malaysian Honeys. J. Food Sci. 2011, 76, C921–C928. [Google Scholar] [CrossRef]
- Lawag, I.L.; Lim, L.-Y.; Joshi, R.; Hammer, K.A.; Locher, C. A Comprehensive Survey of Phenolic Constituents Reported in Monofloral Honeys around the Globe. Foods 2022, 11, 1152. [Google Scholar] [CrossRef]
- Singleton, V.L.; Orthofer, R.; Lamuela-Raventós, R.M. [14] Analysis of total phenols and other oxidation substrates and antioxidants by means of folin-ciocalteu reagent. Methods Enzymol. 1999, 299, 152–178. [Google Scholar]
- Sánchez-Rangel, J.C.; Benavides, J.; Heredia, J.B.; Cisneros-Zevallos, L.; Jacobo-Velázquez, D.A. The Folin–Ciocalteu assay revisited: Improvement of its specificity for total phenolic content determination. Anal. Methods 2013, 5, 5990–5999. [Google Scholar] [CrossRef]
- Ma, S.; Kim, C.; Neilson, A.P.; Griffin, L.E.; Peck, G.M.; O’Keefe, S.F.; Stewart, A.C. Comparison of Common Analytical Methods for the Quantification of Total Polyphenols and Flavanols in Fruit Juices and Ciders. J. Food Sci. 2019, 84, 2147–2158. [Google Scholar] [CrossRef] [PubMed]
- Muñoz-Bernal, Ó.A.; Torres-Aguirre, G.A.; Núñez-Gastélum, J.A.; de la Rosa, L.A.; Rodrigo-García, J.; Ayala-Zavala, J.F.; Álvarez-Parrilla, E. Nuevo Acercamiento A la Interacción del Reactivo de Folin-Ciocalteu con Azúcares Durante la Cuantificación de Polifenoles Totales. TIP 2017, 20, 23–28. [Google Scholar] [CrossRef]
- Vinson, J.A.; Proch, J.; Bose, P. Determination of quantity and quality of polyphenol antioxidants in foods and beverages. Methods Enzymol. 2001, 335, 103–114. [Google Scholar]
- Vinson, J.A.; Proch, J.; Zubik, L. Phenol antioxidant quantity and quality in foods: Cocoa, dark chocolate, and milk chocolate. J. Agric. Food Chem. 1999, 47, 4821–4824. [Google Scholar] [CrossRef] [PubMed]
- Pico, J.; Pismag, R.Y.; Laudouze, M.; Martinez, M.M. Systematic evaluation of the Folin-Ciocalteu and Fast Blue BB reactions during the analysis of total phenolics in legumes, nuts and plant seeds. Food Funct. 2020, 11, 9868–9880. [Google Scholar] [CrossRef]
- Bridi, R.; Troncoso, M.J.; Folch-Cano, C.; Fuentes, J.; Speisky, H.; López-Alarcón, C. A Polyvinylpolypyrrolidone (PVPP)-Assisted Folin–Ciocalteu Assay to Assess Total Phenol Content of Commercial Beverages. Food Anal. Methods 2014, 7, 2075–2083. [Google Scholar] [CrossRef]
- Magalhães, L.M.; Santos, F.; Segundo, M.A.; Reis, S.; Lima, J.L. Rapid microplate high-throughput methodology for assessment of Folin-Ciocalteu reducing capacity. Talanta 2010, 83, 441–447. [Google Scholar] [CrossRef]
- Beretta, G.; Orioli, M.; Facino, R.M. Antioxidant and radical scavenging activity of honey in endothelial cell cultures (EA.hy926). Planta Med. 2007, 73, 1182–1189. [Google Scholar] [CrossRef]
- Saric, G.; Markovic, K.; Major, N.; Krpan, M.; Ursulin-Trstenjak, N.; Hruskar, M.; Vahcic, N. Changes of antioxidant activity and phenolic content in acacia and multifloral honey during storage. Food Technol. Biotechnol. 2012, 50, 434–441. [Google Scholar]
- Nayaka, N.M.D.M.W.; Fidrianny, I.; Sukrasno; Hartati, R.; Singgih, M. Antioxidant and antibacterial activities of multiflora honey extracts from the Indonesian Apis cerana bee. J. Taibah Univ. Med. Sci. 2020, 15, 211–217. [Google Scholar] [CrossRef]
- Lawag, I.L.; Sostaric, T.; Lim, L.Y.; Hammer, K.; Locher, C. The Development and Application of a HPTLC-Derived Database for the Identification of Phenolics in Honey. Molecules 2022, 27, 6651. [Google Scholar] [CrossRef]
- Pauliuc, D.; Dranca, F.; Oroian, M. Antioxidant Activity, Total Phenolic Content, Individual Phenolics and Physicochemical Parameters Suitability for Romanian Honey Authentication. Foods 2020, 9, 306. [Google Scholar] [CrossRef]
- Albu, A.; Radu-Rusu, R.-M.; Simeanu, D.; Radu-Rusu, C.-G.; Pop, I.M. Phenolic and Total Flavonoid Contents and Physicochemical Traits of Romanian Monofloral Honeys. Agriculture 2022, 12, 1378. [Google Scholar] [CrossRef]
- Flanjak, I.; Kenjerić, D.; Bubalo, D.; Primorac, L. Characterisation of selected Croatian honey types based on the combination of antioxidant capacity, quality parameters, and chemometrics. Eur. Food Res. Technol. 2016, 242, 467–475. [Google Scholar] [CrossRef]
- Smetanska, I.; Alharthi, S.; Selim, K. Physicochemical, antioxidant capacity and color analysis of six honeys from different origin. J. King Saud Univ. Sci. 2021, 33, 101447. [Google Scholar] [CrossRef]
- Di Marco, G.; Gismondi, A.; Panzanella, L.; Canuti, L.; Impei, S.; Leonardi, D.; Canini, A. Botanical influence on phenolic profile and antioxidant level of Italian honeys. J. Food Sci. Technol. 2018, 55, 4042–4050. [Google Scholar] [CrossRef] [PubMed]
- Goslinski, M.; Nowak, D.; Szwengiel, A. Multidimensional Comparative Analysis of Bioactive Phenolic Compounds of Honeys of Various Origin. Antioxidants 2021, 10, 530. [Google Scholar] [CrossRef]
- Miłek, M.; Bocian, A.; Kleczyńska, E.; Sowa, P.; Dżugan, M. The Comparison of Physicochemical Parameters, Antioxidant Activity and Proteins for the Raw Local Polish Honeys and Imported Honey Blends. Molecules 2021, 26, 2423. [Google Scholar] [CrossRef]
- Tomczyk, M.; Tarapatskyy, M.; Dzugan, M. The influence of geographical origin on honey composition studied by Polish and Slovak honeys. Czech J. Food Sci. 2019, 37, 232–238. [Google Scholar] [CrossRef]
- Milosavljević, S.; Jadranin, M.; Mladenović, M.; Tešević, V.; Nebojsa, M.; Mutavdžić, D.; Krstic, G. Physicochemical Parameters as Indicators of The Authenticity of Monofloral Honey from the Territory of the Republic of Serbia. Maced. J. Chem. Chem. Eng. 2021, 40, 49. [Google Scholar] [CrossRef]
- Sakač, M.B.; Jovanov, P.T.; Marić, A.Z.; Pezo, L.L.; Kevrešan, Ž.S.; Novaković, A.R.; Nedeljković, N.M. Physicochemical properties and mineral content of honey samples from Vojvodina (Republic of Serbia). Food Chem. 2019, 276, 15–21. [Google Scholar] [CrossRef]
- Zivkovic, J.; Sunaric, S.; Stanković, N.; Mihajilov-Krstev, T.; Ana, S. Total Phenolic and Flavonoid Contents, Antioxidant and Antibacterial Activities of Selected Honeys Against Human Pathogenic Bacteria. Acta Pol. Pharm. 2019, 67, 671–681. [Google Scholar]
- Akgün, N.; Çelik, Ö.F.; Kelebekli, L. Physicochemical properties, total phenolic content, and antioxidant activity of chestnut, rhododendron, acacia and multifloral honey. J. Food Meas. Charact. 2021, 15, 3501–3508. [Google Scholar] [CrossRef]
- Boussaid, A.; Chouaibi, M.; Rezig, L.; Hellal, R.; Donsì, F.; Ferrari, G.; Hamdi, S. Physicochemical and bioactive properties of six honey samples from various floral origins from Tunisia. Arab. J. Chem. 2018, 11, 265–274. [Google Scholar] [CrossRef]
- Al-Farsi, M.; Al-Amri, A.; Al-Hadhrami, A.; Al-Belushi, S. Color, flavonoids, phenolics and antioxidants of Omani honey. Heliyon 2018, 4, e00874. [Google Scholar] [CrossRef]
- Pena Junior, D.S.; Almeida, C.A.; Santos, M.C.F.; Fonseca, P.H.V.; Menezes, E.V.; de Melo Junior, A.F.; Brandao, M.M.; de Oliveira, D.A.; Souza, L.F.; Silva, J.C.; et al. Antioxidant activities of some monofloral honey types produced across Minas Gerais (Brazil). PLoS ONE 2022, 17, e0262038. [Google Scholar] [CrossRef]
- Liben, T.; Atlabachew, M.; Abebe, A. Total phenolic, flavonoids and some selected metal content in honey and propolis samples from South Wolo zone, Amhara region, Ethiopia. Cogent Food Agric. 2018, 4, 1475925. [Google Scholar] [CrossRef]
- Wabaidur, S.M.; Ahmed, Y.B.H.; Alothman, Z.A.; Obbed, M.S.; Al-Harbi, N.M.; Al-Turki, T.M. Ultra high performance liquid chromatography with mass spectrometry method for the simultaneous determination of phenolic constituents in honey from various floral sources using multiwalled carbon nanotubes as extraction sorbents. J. Sep. Sci. 2015, 38, 2597–2606. [Google Scholar] [CrossRef]
- Shamsudin, S.; Selamat, J.; Abdul Shomad, M.; Ab Aziz, M.F.; Haque Akanda, M.J. Antioxidant Properties and Characterization of Heterotrigona itama Honey from Various Botanical Origins according to Their Polyphenol Compounds. J. Food Qual. 2022, 2022, 2893401. [Google Scholar] [CrossRef]
- Gorjanovic, S.Z.; Alvarez-Suarez, J.M.; Novakovic, M.M.; Pastor, F.T.; Pezo, L.; Battino, M.; Suznjevic, D.Z. Comparative analysis of antioxidant activity of honey of different floral sources using recently developed polarographic and various spectrophotometric assays. J. Food Compos. Anal. 2013, 30, 13–18. [Google Scholar] [CrossRef]
- Sahin, H.; Ozkok, A.; Tanugur Samanci, A.E.; Onder, E.Y.; Kolayli, S. Identification of the Main Phenolic Markers in Turkish Pine Honeys and Their Biological Functions. Chem. Biodivers. 2022, 19, e202200835. [Google Scholar] [CrossRef]
- Kolayli, S.; Kazaz, G.; Özkök, A.; Keskin, M.; Kara, Y.; Demir Kanbur, E.; Ertürk, Ö. The phenolic composition, aroma compounds, physicochemical and antimicrobial properties of Nigella sativa L. (black cumin) honey. Eur. Food Res. Technol. 2022, 1–12. [Google Scholar] [CrossRef]
- Hussein, S.Z.; Yusoff, K.M.; Makpol, S.; Mohd Yusof, Y.A. Antioxidant capacities and total phenolic contents increase with gamma irradiation in two types of Malaysian honey. Molecules 2011, 16, 6378–6395. [Google Scholar] [CrossRef] [PubMed]
- Vela, L.; de Lorenzo, C.; Pérez, R.A. Antioxidant capacity of Spanish honeys and its correlation with polyphenol content and other physicochemical properties. J. Sci. Food Agric. 2007, 87, 1069–1075. [Google Scholar] [CrossRef]
- Gül, A.; Pehlivan, T. Antioxidant activities of some monofloral honey types produced across Turkey. Saudi J. Biol. Sci. 2018, 25, 1056–1065. [Google Scholar] [CrossRef]
- Sousa, J.M.; de Souza, E.L.; Marques, G.; Meireles, B.; de Magalhães Cordeiro, Â.T.; Gullón, B.; Pintado, M.M.; Magnani, M. Polyphenolic profile and antioxidant and antibacterial activities of monofloral honeys produced by Meliponini in the Brazilian semiarid region. Food Res. Int. 2016, 84, 61–68. [Google Scholar] [CrossRef]
- Akalin, H.; Bayram, M.; Anli, R.E. Determination of some individual phenolic compounds and antioxidant capacity of mead produced from different types of honey. J. Inst. Brew. 2017, 123, 167–174. [Google Scholar] [CrossRef]
- Cheung, Y.; Meenu, M.; Yu, X.; Xu, B. Phenolic acids and flavonoids profiles of commercial honey from different floral sources and geographic sources. Int. J. Food Prop. 2019, 22, 290–308. [Google Scholar] [CrossRef]
- Lawag, I.L.; Yoo, O.; Lim, L.Y.; Hammer, K.; Locher, C. Optimisation of Bee Pollen Extraction to Maximise Extractable Antioxidant Constituents. Antioxidants 2021, 10, 1113. [Google Scholar] [CrossRef]
- Patel, N.G.; Patel, K.G.; Patel, K.V.; Gandhi, T.R. Validated HPTLC Method for Quantification of Luteolin and Apigenin in Premna mucronata Roxb., Verbenaceae. Adv. Pharmacol. Sci. 2015, 2015, 682365. [Google Scholar]
- Beretta, G.; Granata, P.; Ferrero, M.; Orioli, M.; Maffei Facino, R. Standardization of antioxidant properties of honey by a combination of spectrophotometric/fluorimetric assays and chemometrics. Anal. Chim. Acta 2005, 533, 185–191. [Google Scholar] [CrossRef]
- Carmona-Hernandez, J.C.; Taborda-Ocampo, G.; González-Correa, C.H. Folin-Ciocalteu Reaction Alternatives for Higher Polyphenol Quantitation in Colombian Passion Fruits. Int. J. Food Sci. 2021, 2021, 8871301. [Google Scholar] [CrossRef] [PubMed]
- Islam, M.K.; Lawag, I.L.; Green, K.J.; Sostaric, T.; Hammer, K.A.; Lim, L.Y.; Locher, C. An investigation of the suitability of melissopalynology to authenticate Jarrah honey. Curr. Res. Food Sci. 2022, 5, 506–514. [Google Scholar] [CrossRef] [PubMed]
- Aljohar, H.I.; Maher, H.M.; Albaqami, J.; Al-Mehaizie, M.; Orfali, R.; Orfali, R.; Alrubia, S. Physical and chemical screening of honey samples available in the Saudi market: An important aspect in the authentication process and quality assessment. Saudi Pharm. J. 2018, 26, 932–942. [Google Scholar] [CrossRef]
- Sajwani, A.M.; Eltayeb, E.A.; Farook, S.A.; Patzelt, A. Sugar and Protein Profiles of Omani Honey from Muscat and Batinah Regions of Oman. Int. J. Food Prop. 2007, 10, 675–690. [Google Scholar] [CrossRef]
- Nayik, G.A.; Dar, B.N.; Nanda, V. Physico-chemical, rheological and sugar profile of different unifloral honeys from Kashmir valley of India. Arab. J. Chem. 2015, 12, 3151–3162. [Google Scholar] [CrossRef]
- Val, A.; Huidobro, J.F.; Sánchez, M.P.; Muniategui, S.; Fernández-Muiño, M.A.; Sancho, M.T. Enzymatic Determination of Galactose and Lactose in Honey. J. Agric. Food Chem. 1998, 46, 1381–1385. [Google Scholar] [CrossRef]
- Bastola, K.; Guragain, Y.; Bhadriraju, V.; Vadlani, V. Evaluation of Standards and Interfering Compounds in the Determination of Phenolics by Folin-Ciocalteu Assay Method for Effective Bioprocessing of Biomass. Am. J. Anal. Chem. 2017, 8, 416–431. [Google Scholar] [CrossRef]
- Lawag, I.L.; Islam, M.K.; Sostaric, T.; Lim, L.Y.; Hammer, K.; Locher, C. Antioxidant Activity and Phenolic Compound Identification and Quantification in Western Australian Honeys. Antioxidants 2023, 12, 189. [Google Scholar] [CrossRef]
- Green, K.J.; Lawag, I.L.; Locher, C.; Hammer, K.A. Correlation of the antibacterial activity of commercial manuka and Leptospermum honeys from Australia and New Zealand with methylglyoxal content and other physicochemical characteristics. PLoS ONE 2022, 17, e0272376. [Google Scholar] [CrossRef]
- Green, K.J.; Islam, M.K.; Lawag, I.; Locher, C.; Hammer, K.A. Honeys derived from plants of the coastal sandplains of Western Australia: Antibacterial and antioxidant activity, and other characteristics. J. Apic. Res. 2022, 1–14. [Google Scholar] [CrossRef]
- Platzer, M.; Kiese, S.; Herfellner, T.; Schweiggert-Weisz, U.; Eisner, P. How Does the Phenol Structure Influence the Results of the Folin-Ciocalteu Assay? Antioxidants 2021, 10, 811. [Google Scholar] [CrossRef] [PubMed]


Disclaimer/Publisher’s Note: The statements, opinions and data contained in all publications are solely those of the individual author(s) and contributor(s) and not of MDPI and/or the editor(s). MDPI and/or the editor(s) disclaim responsibility for any injury to people or property resulting from any ideas, methods, instructions or products referred to in the content. |
© 2023 by the authors. Licensee MDPI, Basel, Switzerland. This article is an open access article distributed under the terms and conditions of the Creative Commons Attribution (CC BY) license (https://creativecommons.org/licenses/by/4.0/).