Article

Field Radiometric Calibration of a Micro-Spectrometer Based on Remote Sensing of Plateau Inland Water Colors

1
Big Earth Data Reveals Imbalance in Progress towards the Environmental SDG Indicators in China, Beijing 100094, China
2
Key Laboratory of Digital Earth Science, Aerospace Information Research Institute, Chinese Academy of Sciences, Beijing 100094, China
*
Author to whom correspondence should be addressed.
Appl. Sci. 2023, 13(4), 2117; https://doi.org/10.3390/app13042117
Submission received: 15 November 2022 / Revised: 3 February 2023 / Accepted: 4 February 2023 / Published: 7 February 2023

Abstract

:
Remote sensing reflectance (Rrs), which is currently measured mainly using the above-water approach, is the most crucial parameter in the remote sensing inversion of plateau inland water colors. It is very difficult to measure the Rrs of plateau inland unmanned areas; thus, we provide a measurement solution using a micro-spectrometer. Currently, commercial micro-spectrometers are not factory calibrated for radiation, and thus, a radiometric calibration of the micro-spectrometer is an essential step. This article uses an Ocean Optics micro-spectrometer (STS-VIS) and a traditional water spectrometer (Trios) to simultaneously measure the irradiance and radiance of diffuse reflectance plates with different reflectance values for field calibration. The results show the following: (1) different fiber types have different calibration coefficients, and the integration time is determined according to the diameter of the fiber and the type of fiber, and (2) by comparing the simultaneous measurement results of STS-VIS with Trios, the mean absolute percentage difference (MAPD) of both reached 18.64% and 5.11% for Qinghai Lake and Golmud River, respectively, which are accurate Rrs measurements of water bodies. The Rrs of the Hoh Xil and Qarhan Salt Lake water bodies in unmanned areas of China was measured, and this was the first collection of in situ spectral information with a micro-spectrometer. This article shows that the micro-spectrometer can perform the in situ measurement of water Rrs in unmanned inland areas. With this breakthrough in the radiometric performance of the micro-spectrometer, we are able to obtain more accurate remote sensing reflectance results of unmanned water bodies.

1. Introduction

Remote sensing reflectance (sr−1) of water bodies is an important apparent optical quantity that can be detected in water color remote sensing and is one of the important parameters to quantify the spectral information of water bodies [1]. The field measurement of water remote sensing reflectance is a key step in the remote sensing of water color, and is widely used in the research and commercialization of satellite authenticity verification, water quality parameter inversion [2], cyanobacterial bloom [3] and black-odor water body identification [4]. The remote sensing of water color can be divided into the remote sensing of marine water bodies and the remote sensing of inland water bodies, with the remote sensing of marine water bodies being utilized to mainly observe the surface chlorophyll-a (Chl-a) concentration [5], suspended particular matter (SPM) concentration [6] and colored dissolved organic matter (CDOM) [7]. The remote sensing of inland water bodies has been used to estimate, in addition to the parameters mentioned above, total phosphorus (TP), total nitrogen (TN), the trophic state index (TSI) and, more recently, dissolved organic carbon in an eutrophic lake [8] and methane emissions in a lake [9].
Current spectrometers dedicated to Rrs based on water bodies include the Analytical Spectral Devices (ASD) series from Malvern Panalytical in the UK [10], the Profiling Reflectance Radiometer (PRR) series from Biospherical in the USA [11], the PAMSES series from Trios in Germany [12] and the Satlantic series from a subsidiary of SeaBird in the USA [13]. Measuring the Rrs is an essential step in both marine remote sensing and inland water remote sensing. In oceanic remote sensing, the spectrometer is mainly carried on board a research vessel for walk-around measurements, and the same method is applied in inland lakes. There is a great deal of preparation before the measurement is carried out: firstly, the spectrometer is charged; secondly, the instruments are inventoried for transport; and finally, the spectrometer is deployed on board the research vessel. All of the above spectrometers can be utilized for the measurement of parameters in water bodies. However, they all are of a large size and weight and require a power supply, and thus, we cannot bring the spectrometer to lakes or rivers in unmanned areas such as the Tibetan Plateau. Therefore, there has been a gap in our knowledge on the water spectra of lakes or rivers in unmanned areas of the Tibetan Plateau. Furthermore, in inland water environments there are often unpopulated waters and waters that cannot be measured by using large vessels, and the above-mentioned water body Rrs cannot be measured. Micro-spectrometers have the advantage of being small in size [14], and instead of spectrometers, they have been carried on board unmanned aerial vehicles or unmanned ships for Rrs measurements to solve these problems. Nowadays, scholars often use imaging spectrometers for spectrometric measurements via unmanned aerial vehicles, and there are empirical linear-based [15] and look-up table methods [16] for radiometric calibrations of imaging spectrometers. The main applications are in vegetation and crop studies [17], and scholars have also used them to perform techniques for estimating water quality parameters [18,19]. However, imaging spectrometers tend to have a low signal-to-noise ratio for measuring the remote sensing spectra of water bodies. However, none of the current commercial micro-spectrometers are radiometrically calibrated; thus, we need to carry out a radiometric calibration of the micro-spectrometer.
The radiometric calibration of the micro-spectrometer can be performed by using a high-precision spectrometer and a micro-spectrometer to simultaneously measure high-precision stable irradiance and irradiance sources and to solve for the conversion relationship between the digital number (DN) recorded by the micro-spectrometer and the radiance and irradiance values received by the micro-spectrometer. The main radiometric calibration methods used thus far for remote sensing sensors are laboratory integrating sphere calibration [20,21,22], on-station calibration [23], diffuse reflectance plate calibration [24,25], etc. Laboratory integrating sphere calibration is mainly a high-precision test of parameters, such as the remote sensor electronic gain and bias, central wavelength and bandwidth of each channel, signal-to-noise ratio, spatial resolution and spectral response function using relevant laboratory equipment, which is traceable with a low-temperature absolute radiometer or a standard blackbody uniform radiation quantification standard. On-station calibrations use a calibration system mounted on a satellite platform to periodically monitor changes in the radiation response of the satellite during its orbital operation. Diffuse reflectance plate calibration uses a diffuse reflectance plate and a spectrometer probe for simultaneous fixed-point continuous observation. Concerning the radiometric calibration methods for remote sensing sensors, only laboratory integrating sphere calibration and field diffuse reflectance plate calibration methods can meet the requirements for the radiometric calibration of micro-spectrometers. The field diffuse reflector calibration method is simple and easy to operate, whereas the laboratory integrating sphere calibration requires a lot of time and money, and our group does not meet the conditions for conducting laboratory integrating sphere calibration. Therefore, the field diffuse reflector calibration method is chosen for the radiation calibration of the micro-spectrometer.
The main purpose of this article is a preliminary evaluation of the feasibility and accuracy of micro-spectrometer measurements of the Rrs of plateau inland water colors. Specifically: (1) we calculated the micro-spectrometer radiometric calibration coefficients using different fiber types; (2) we quantified the accuracy of measuring the Rrs of clear and turbid waters in plateau inland water bodies and (3) we provided a case study of the application of the micro-spectrometer to Rrs of plateau inland water bodies in unmanned areas.

2. Data and Methods

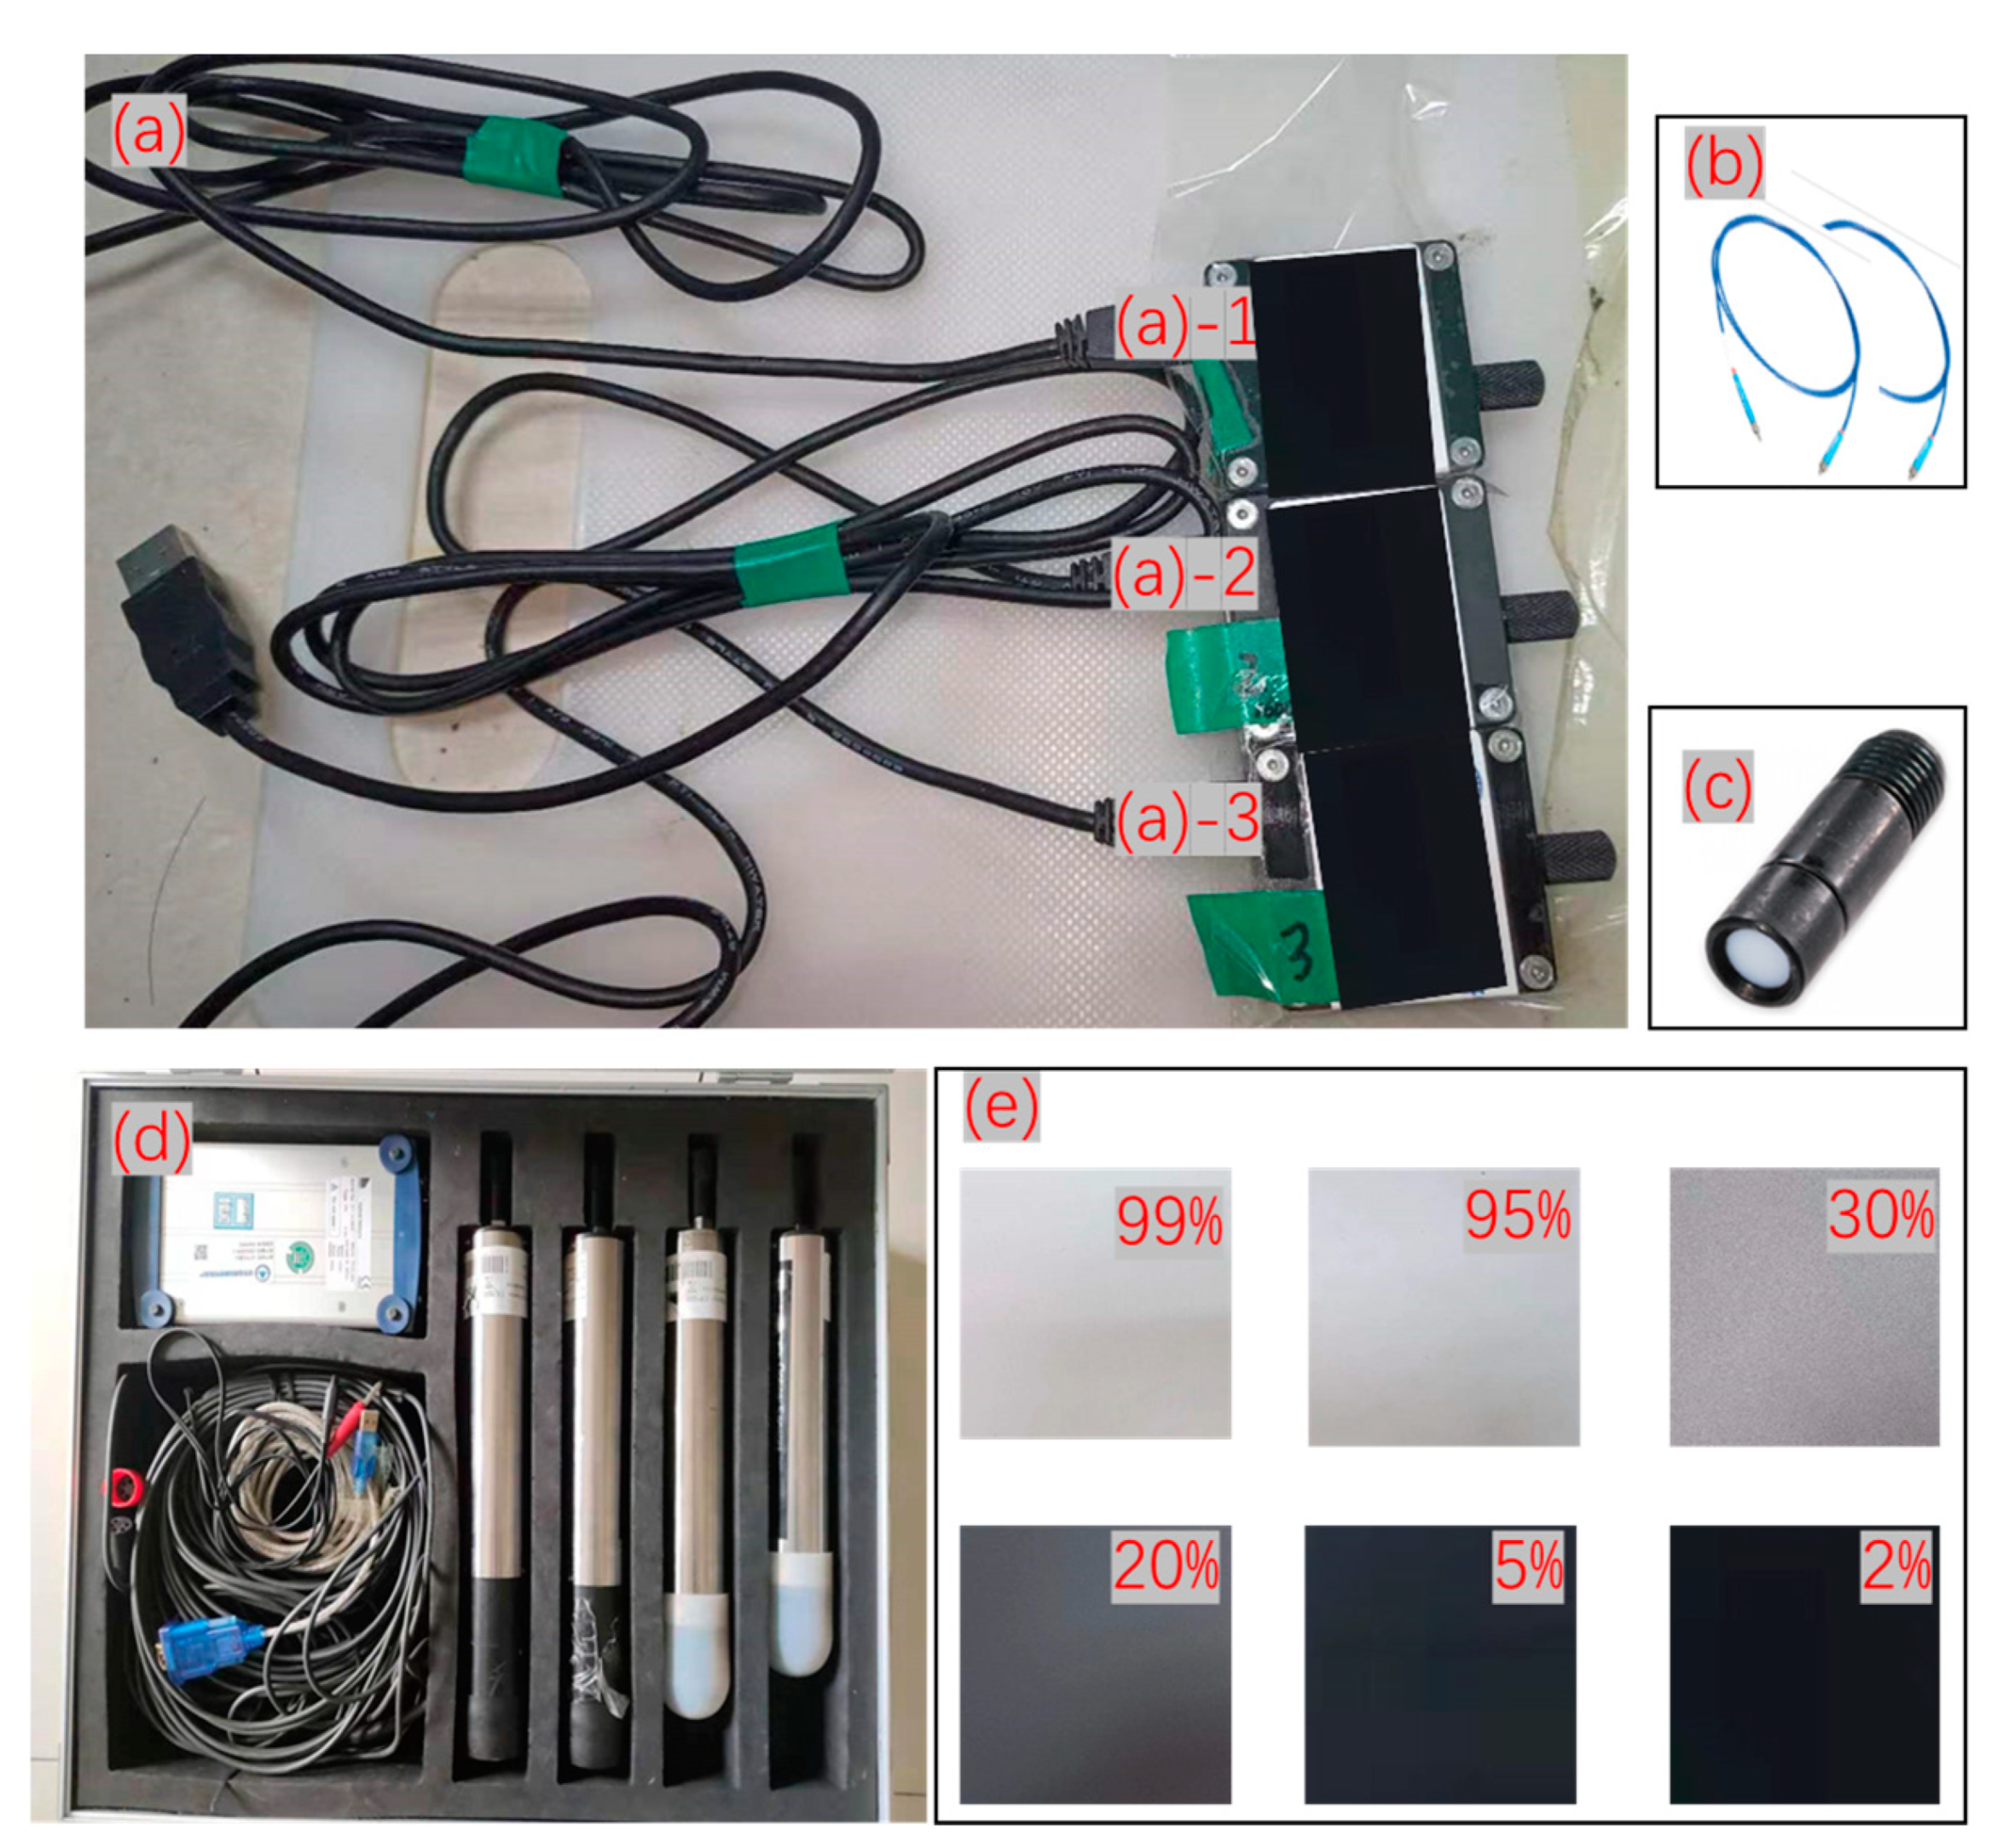
2.1. Equipment and Methods

The equipment used in the micro-spectrometer radiometric calibration is shown in Figure 1 and includes the following: the micro-spectrometer (STS-VIS, Ocean Optics company, Orlando, FL, USA), an optical fiber, a cosine receiver, a spectrometer (Trios, TriOS Mess, Rastede, Germany), a diffuse reflectance plate with different reflectance values and a target cloth, a micro-spectrometer linked to the optical fiber to measure radiance and a micro-spectrometer linked to the optical fiber and cosine receiver to measure irradiance. The diffuse reflectance plate and the target cloth provide stable and varying values of irradiance and radiance. The measured spectral ranges and spectral resolution of Trios and STS-VIS are shown in Table 1. The Trios can measure spectra from 200 nm up to 1100 nm with a spectral resolution of 3.3 nm, whereas the STS-VIS can measure spectra from 350 to 810 nm with a spectral resolution of 2.2 nm. There are three common methods of field measurements of remotely-sensed reflectance ratios in water bodies: the in-water approach [26], the above-water approach [27] and the skylight-blocked approach [28]. The in-water approach generally uses more expensive instruments, which are complex to operate and deploy, and are subject to a certain amount of self-shadowing and uncertainty in the data results. This method can generally only be used in water depths greater than 10 m, and thus, this method is very widely used in pelagic Class I waters, but rarely in inland waters. The skylight-blocked approach uses a mask to directly block the sky light from the field of view of the observation sensor, thus enabling the direct measurement of the off-water irradiance of a water body. This method avoids the geometrical errors in observation caused by the complexity of the field and the uncertainties associated with the skylight rejection method. However, it requires a continuous power supply, and therefore, cannot measure water spectra in the unmanned areas of the Tibetan Plateau. The above-water method has the advantages of a simple field operation and the low cost of field experiments, and is currently the most commonly used measurement method in the study of the spectral properties of water bodies; however, it is affected by water and weather conditions. The details of this method of measurement can be found in Figure A1 in Appendix A. The main zenith angle conditions met by the instrument are that the downward irradiance sensor should point vertically towards the sky, the radiance sensor for measuring sky light should be equal to 50° and the radiance sensor for measuring sky light should be equal to 140°. The main azimuth angle conditions met by the instrument are that the angle between the left and right sunlight should be equal to 45°. This helps avoid sun glint. This method is the easiest water body measurement method to implement in unmanned lakes on a plateau; therefore, the above-water method was selected for this paper to carry out spectral measurements of water bodies in unmanned areas on the Tibetan Plateau, and the formula for measuring Rrs is as follows (Equation (1)):
R r s ( λ ) = L w ( λ ) E d ( λ ) = L u ( λ ) r s k y ( λ ) L s k y ( λ ) E d ( λ )
Rrs is equal to the ratio of the off-water radiance to the downward irradiance, and in the above formula, Lu(λ) is the total off-water radiance, rsky(λ) can be derived from the look-up table [29], Lsky(λ) is the skylight radiance and Ed(λ) is the downward irradiance. They are measured simultaneously using a micro-spectrometer, using (a)-1 for sky radiance, (a)-2 for total off-water radiance and (a)-3 for downward irradiance, so as to avoid the effects of weather variations.
The procedure for field calibration is to use the Trios sensors and micro-spectrometer to simultaneously measure diffuse reflectors with different reflectance values against a target cloth, and to obtain the simultaneously measured Trios radiance, irradiance and micro-spectra with their corresponding DN values. The formula for field-calibrated radiance is presented in Equation (2) and for field-calibrated irradiance in Equation (3).
L T rios = g a i n × D N S T S V I S + o f f s e t
E d T r i o s = g a i n × D N ˜ S T S V I S + o f f s e t
In Formula (2) above, LTrios is the radiance of the different diffuse reflection plates measured by Trios, and DNSTS-VIS is the DN of the different diffuse reflection plates measured by the micro-spectrometer. EdTrios in Formula (3) is the irradiance of the different diffuse reflectors measured by Trios and D N ˜ S T S V I S is the the DN of the different diffuse reflection plates measured by the micro-spectrometer.
We used the micro-spectrometer to obtain the Rrs of plateau lakes as follows: firstly, the DN values obtained with the micro-spectrometers (a)-1, (a)-2 and (a)-3 are converted into radiance and irradiance according to Formulas (2) and (3), and then the Rrs of the micro-spectrometer is calculated according to Formula (1).
The micro-spectrometer needs to be physically connected to the micro-computer in the unmanned ship using a USB cable; additionally, we also need to use professional software to identify the sensor, and only after the identification is passed can the data acquisition parameters be set. The main parameters to be set are integration time, multiple scan averaging, sliding average width and other parameters. It is also necessary to set the address where the spectrum file is to be saved. Once the settings are complete, the micro-spectrometer can be used for water spectrum acquisition.

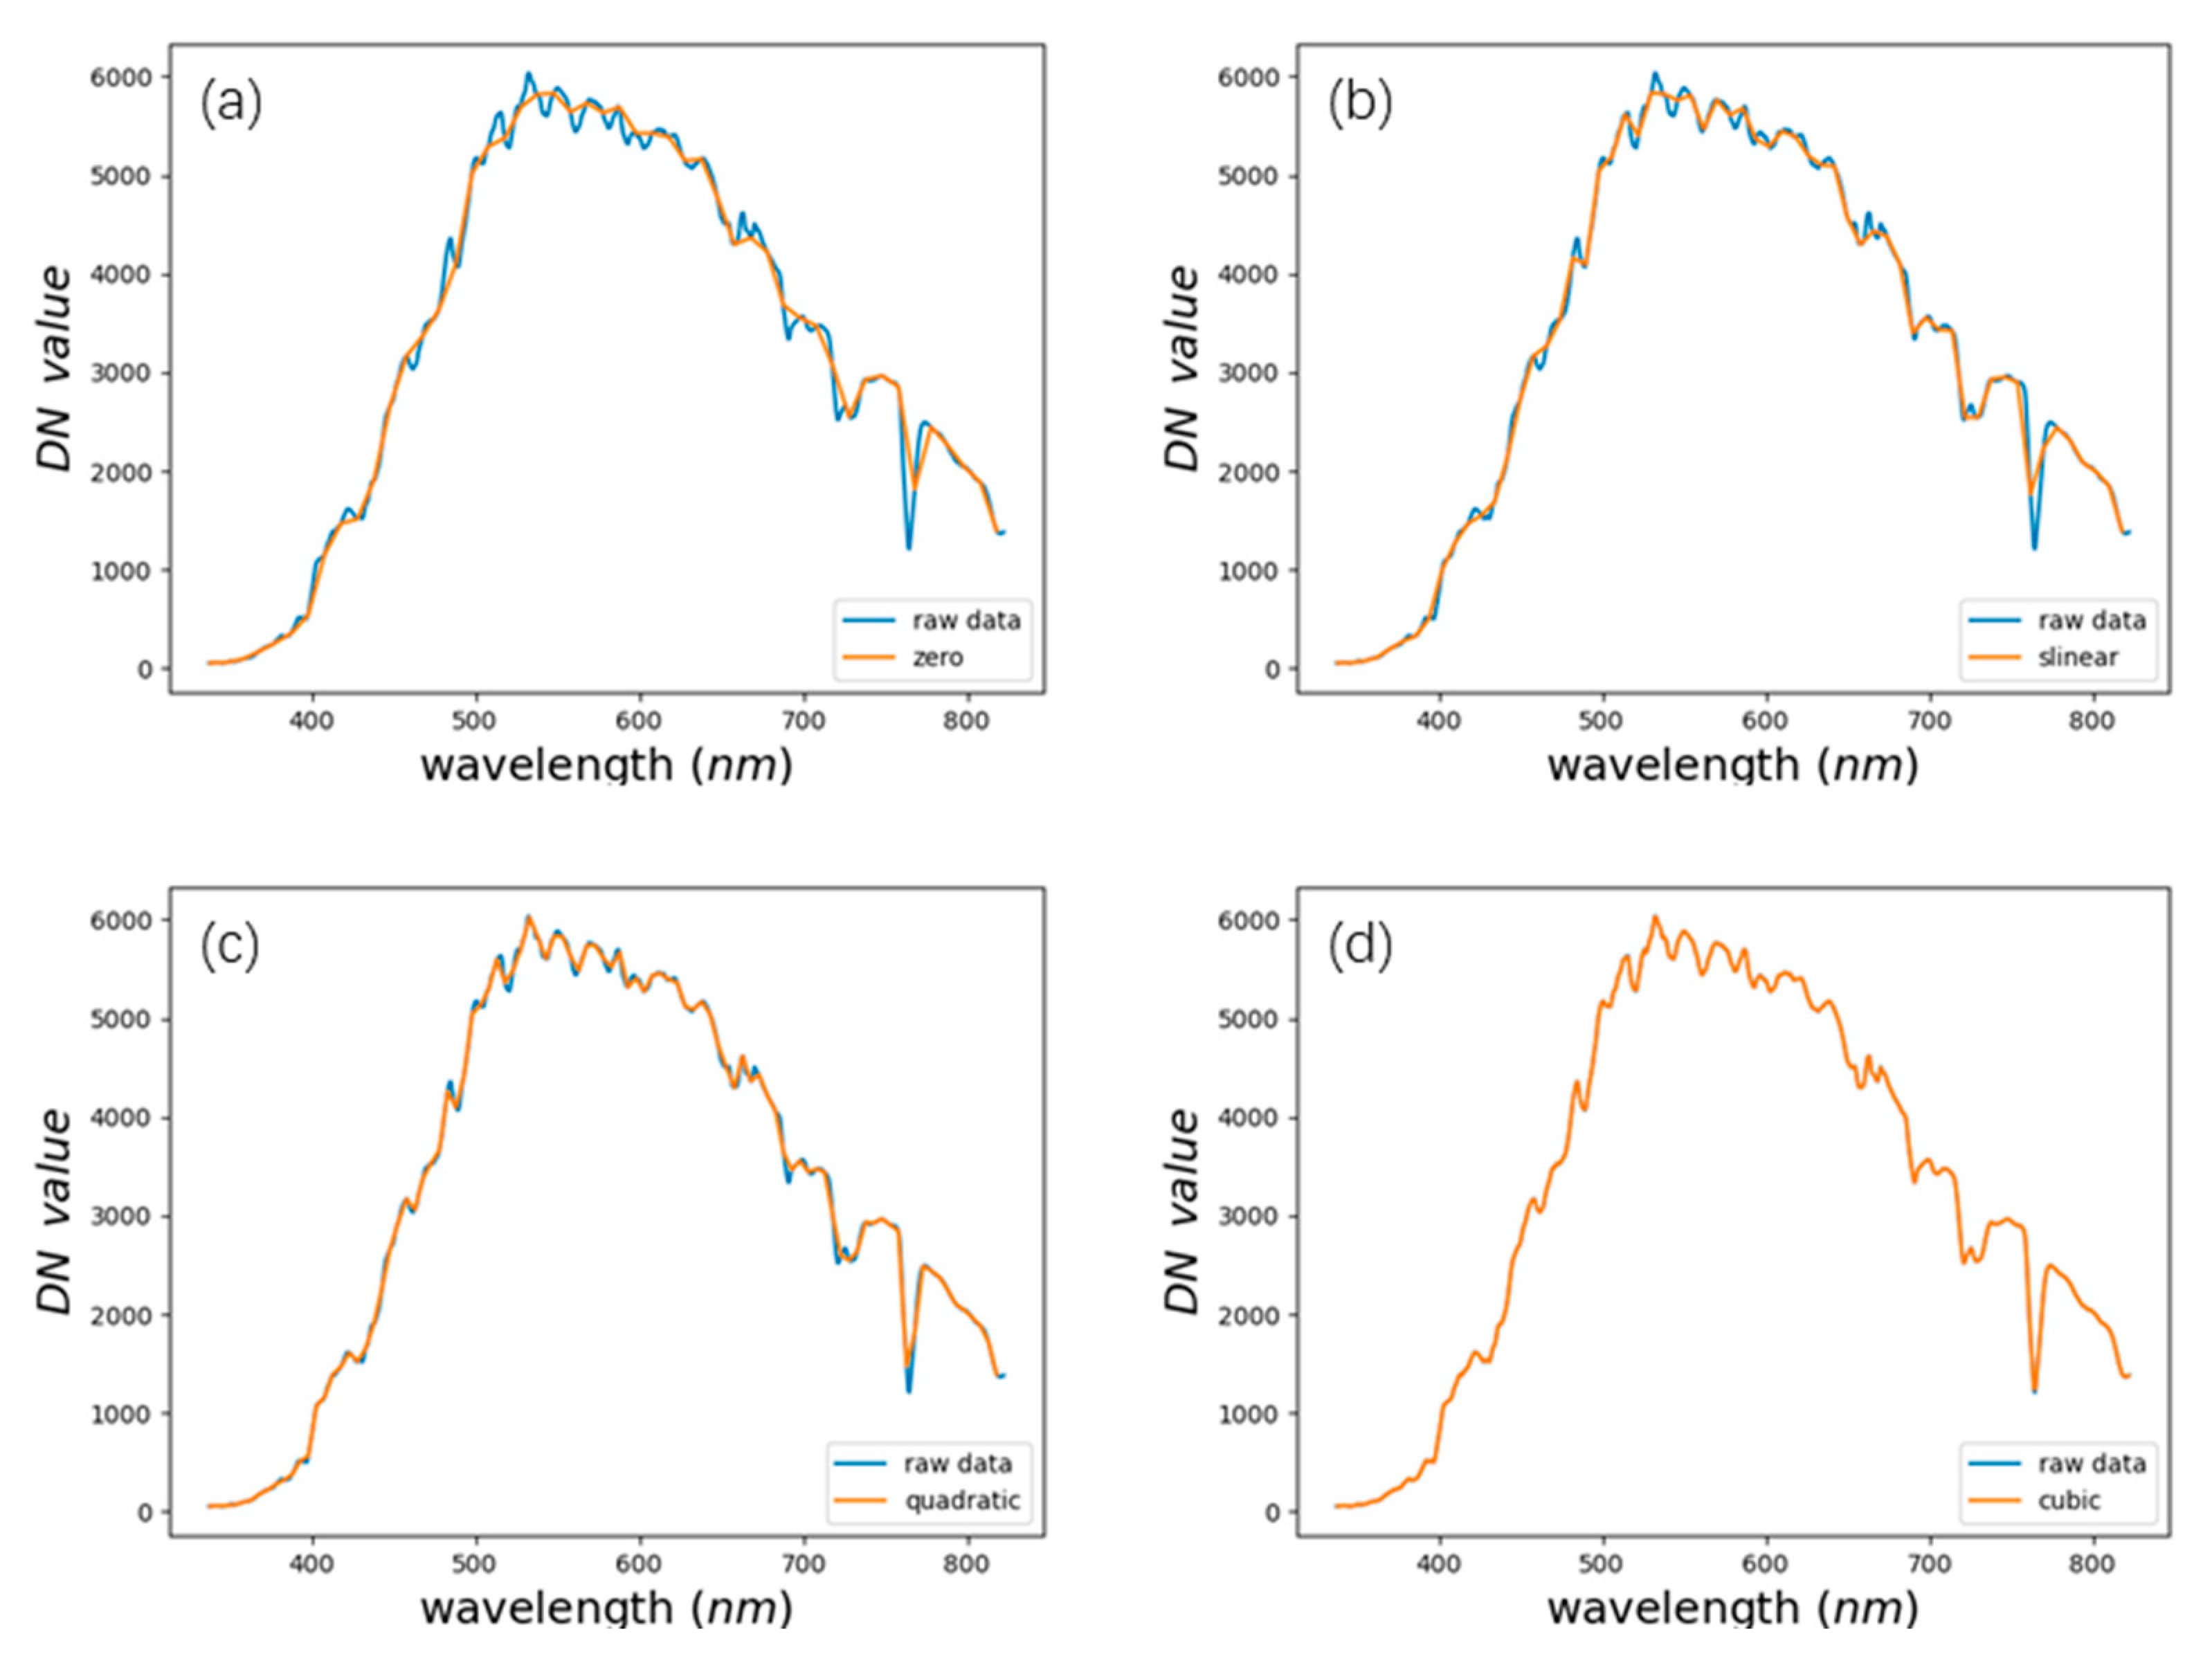
2.2. Data Processing and Evaluation Metrics

We used the Oceanview 6.0 software for hardware control and we needed to set the integration time before collection. The integration times of the micro-spectrometer for measuring radiance and measuring irradiance are described in detail in Section 3.1. The micro-spectrometer and Trios both measure different floating-point wavelength data; therefore, we needed to resample the Trios and STS-VIS spectrometer data to the same integer wavelength for field radiation calibration. The cubic spline interpolation method has a small error (we have also compared the results of the other three resampling methods plotted in Figure A2 Appendix A). Thus, we used this method and obtained a result that is very small, as shown in Figure 2.
The following statistics were used to evaluate the spectral results, including the correlation coefficient (r), bias and mean absolute percentage difference (MAPD).
r = i = 1 n ( S i , 1 S 1 ¯ ) ( S i , 2 S 2 ¯ ) i = 1 n ( S i , 1 S 1 ¯ ) 2 + i = 1 n ( S i , 2 S 2 ¯ ) 2
bias = ( S i , 1 S i , 2 ) / S i , 2 × 100 %
MAPD = 1 N i = 1 N | ( S i , 1 S i , 2 ) / S i , 2 | × 100 %
where Si,1 and Si,2 denote the DN values corresponding to the measured diffuse reflectance plates, the gain and offset observed under different conditions and the Rrs measure with the Trios and micro-spectrometer.
In this article, we compare the effects of different fibers on the gain and offset, which is followed by a quantitative analysis to measure the spectra of different diffuse reflectors with clear water and turbid water, and finally, we perform a first application demonstration in an unmanned area.

3. Results

We first determined the important acquisition parameter integration times for the micro-spectrometer under sunny conditions, then compared the gain and offset of two fiber types using a Hygirel fiber-optic micro-spectrometer (detailed parameters of the two types of micro-spectrometers are given in Section 3.2) and Trios under sunny conditions, and finally, we evaluated the simultaneous measurements of 95% and 20% for the diffuse reflectance plates, and 5% and 2% for the target cloth.

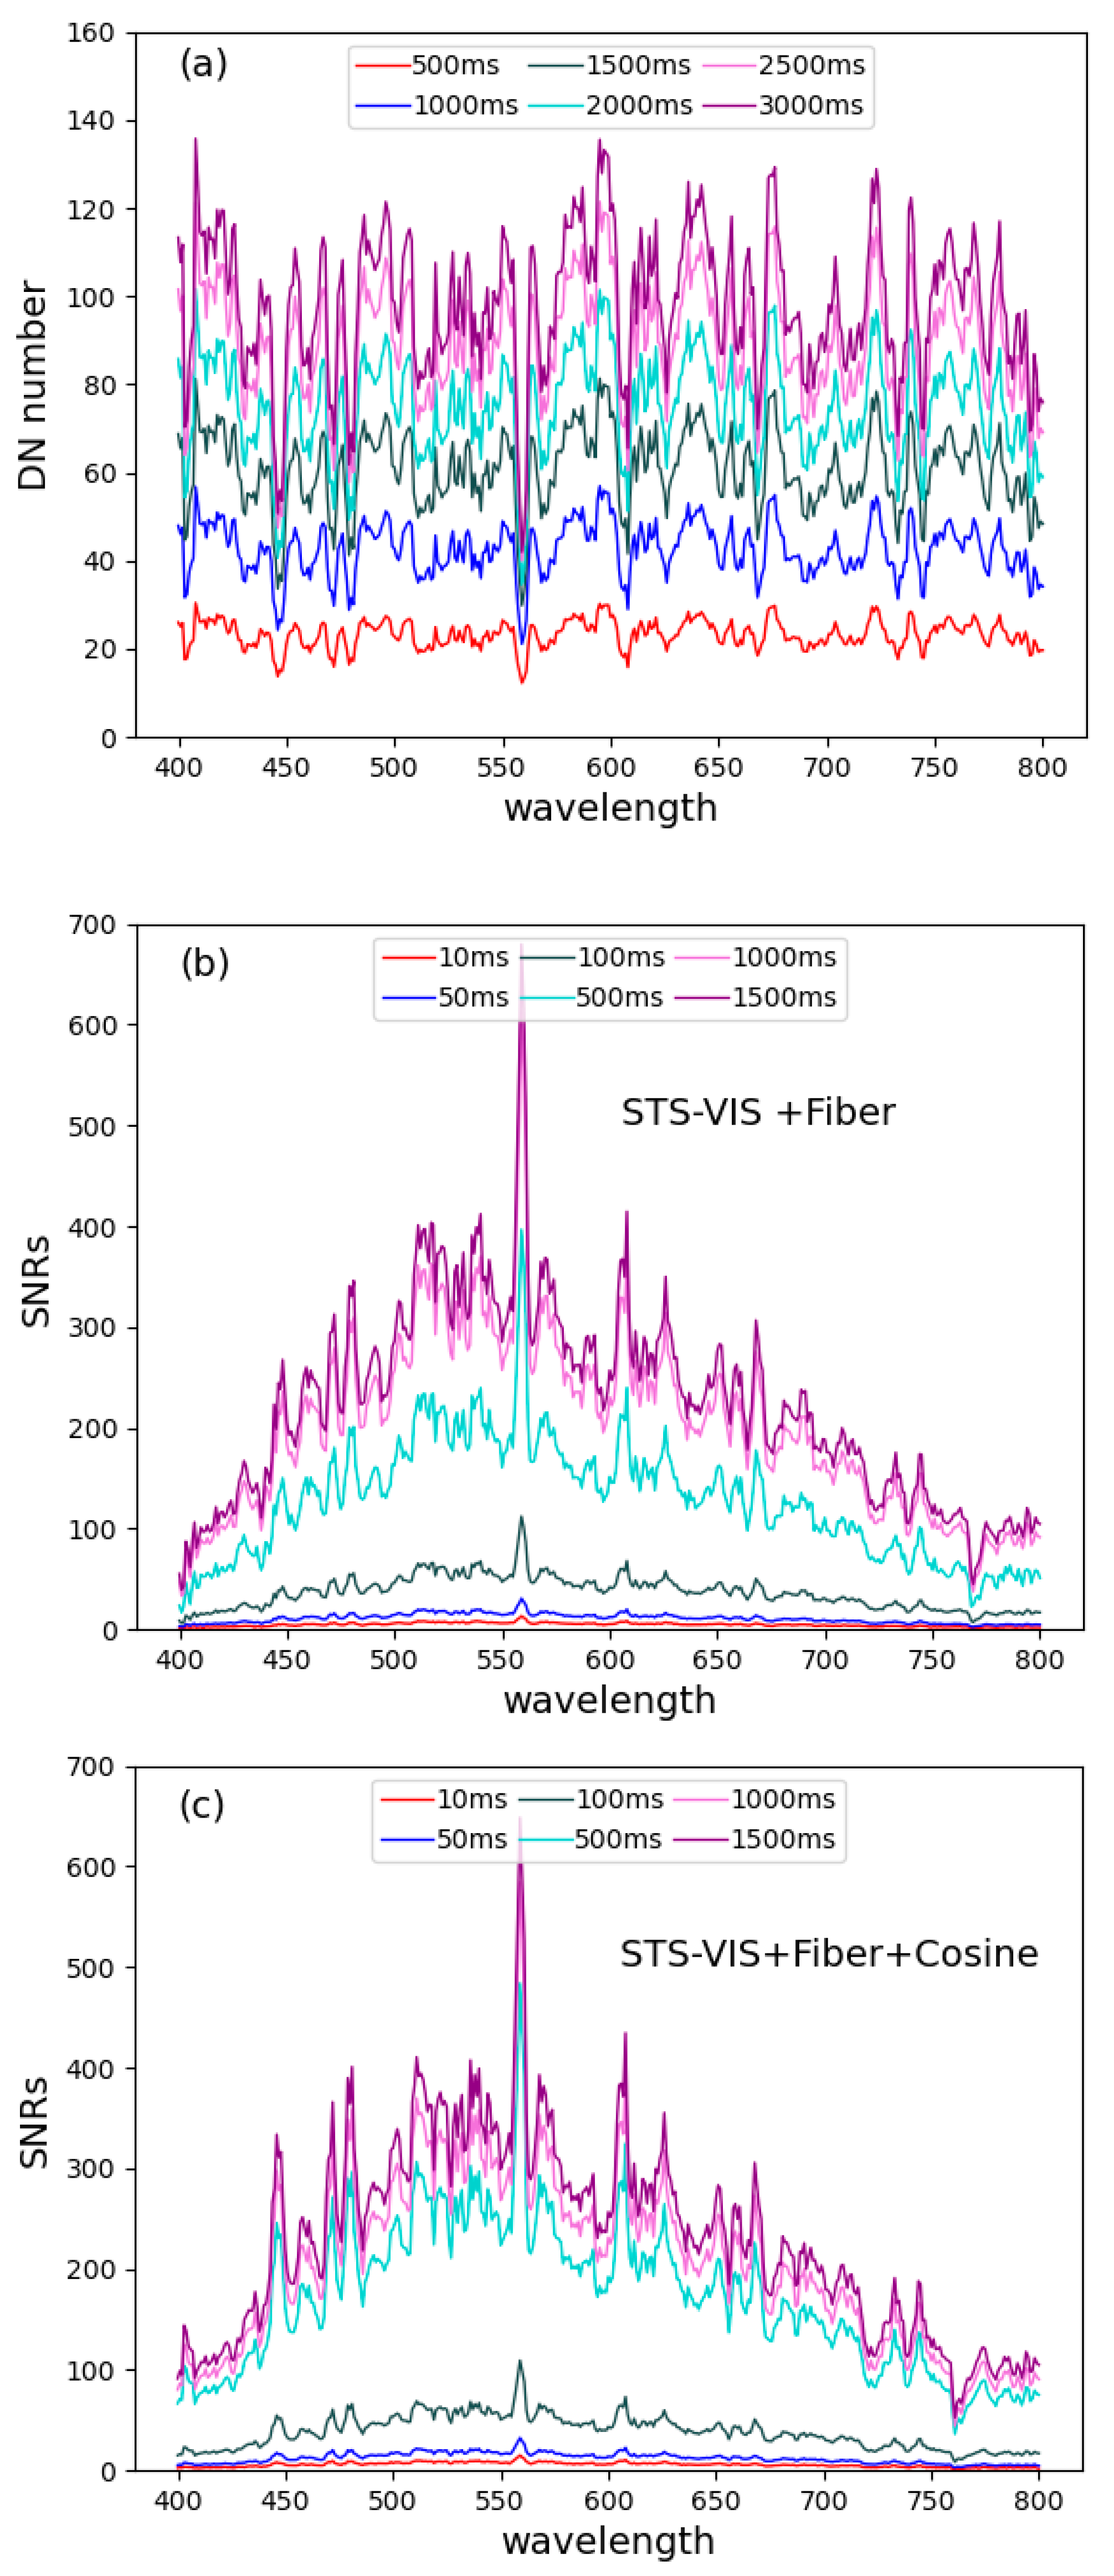
3.1. Effect of Integration Time on Spectral Acquisition of Water

We all know that when a spectrometer performs electro-optical conversion it is mainly influenced by three main parameters [30]: the integration time, aperture and temperature of the micro-spectrometer. The longer the integration time, the more energy is collected by the micro-spectrometer; the larger the aperture, the more energy is collected by the micro-spectrometer; the temperature of the micro-spectrometer creates thermal noise; and different temperatures bring about different thermal noises. When measuring in the field, we pre-warmed the micro-spectrometer for 60 min to keep it below normal operating temperature to avoid the effects of thermal noise caused by temperature. For dealing with the effects of the aperture, micro-spectrometers are often used with a fixed fiber; thus, we use a fixed fiber diameter to control the effect of the aperture on the spectrum.
The signal-to-noise ratio (SNR) of a spectrometer is a very important metric when using micro-spectrometers for the spectral acquisition of water bodies. The current international water color satellites MODIS Terra/Aqua (spatial resolution: 250 m and 500 m), MERIS Envisat (spatial resolution: 300 m), VIIRS (spatial resolution: 750 m) and Sentinel-3A/B (spatial resolution: 300 m) all have SNRs greater than 1000 for measurements that occur in the ocean [31]; measurements in inland lakes mainly use Landsat OLI (spatial resolution: 30 m) HJ-1 (spatial resolution: 30 m), etc., all of which have SNRs greater than 100 [32]. The use of Landsat as a data source for lake water observations on the Qinghai–Tibet Plateau requires that the signal-to-noise ratio of the micro-spectrometer be greater than 100 for application in field measurements.
We believe that in the electro-optical conversion of a micro-spectrometer, the noise of the micro-spectrometer is caused by the dark current; thus, we calculated the SNRs as the total signal ratio over the dark current signal (Equation (7)). The SNRs are the ratio of the useful signal to the noisy signal in the total signal. The higher the signal-to-noise ratio, the better.
S N R s = L t o t a l L d a r k c u r r e n t
We first measured the dark current at different integration times after warming up the micro-spectrometer for 60 min (Figure 3a) and found that the dark current increased in a logarithmic fashion with integration time. The micro-spectrometer is considered to operate at a stable maximum temperature after 60 min of operation. As we used a reference plate with a maximum reflectance of 95% for field calibrations, but the DN range of the micro-spectrometer is 0–65,535, we first needed to ensure that we did not exceed the DN limit when collecting 95% of the reference plat and that our integration time was not too long, as the state of the water body changes rapidly. We should ideally be able to measure a water body spectrum within 2 s, but in a full water body spectrum measurement, the effects of waves, boat wake, etc., need to be taken into account. We generally took several measurements to average the water body spectra for field measurements.
Two schemes were used to measure 95% of the reference plate, the first using a micro-spectrometer and optical fiber to measure the DN values corresponding to radiance, and the second using a micro-spectrometer, optical fiber and cosine receiver to measure the DN values corresponding to irradiance. The SNR plot of the DN values corresponding to radiance (Figure 3b) shows that the integration time exceeds the SNRs ~100:1 at 500 ms, but that there are higher SNRs at 1000 ms and 1500 ms; therefore, we chose 1000 ms as the integration time for the DN values of radiance. The SNR diagram for the irradiance corresponding to the DN value (Figure 3c) shows that the integration time exceeds the SNRs ~100:1 at 500 ms, and has similar SNRs at 500 ms, 1000 ms and 1500 ms; thus, we chose 500 ms as the integration time for the DN value of the irradiance.

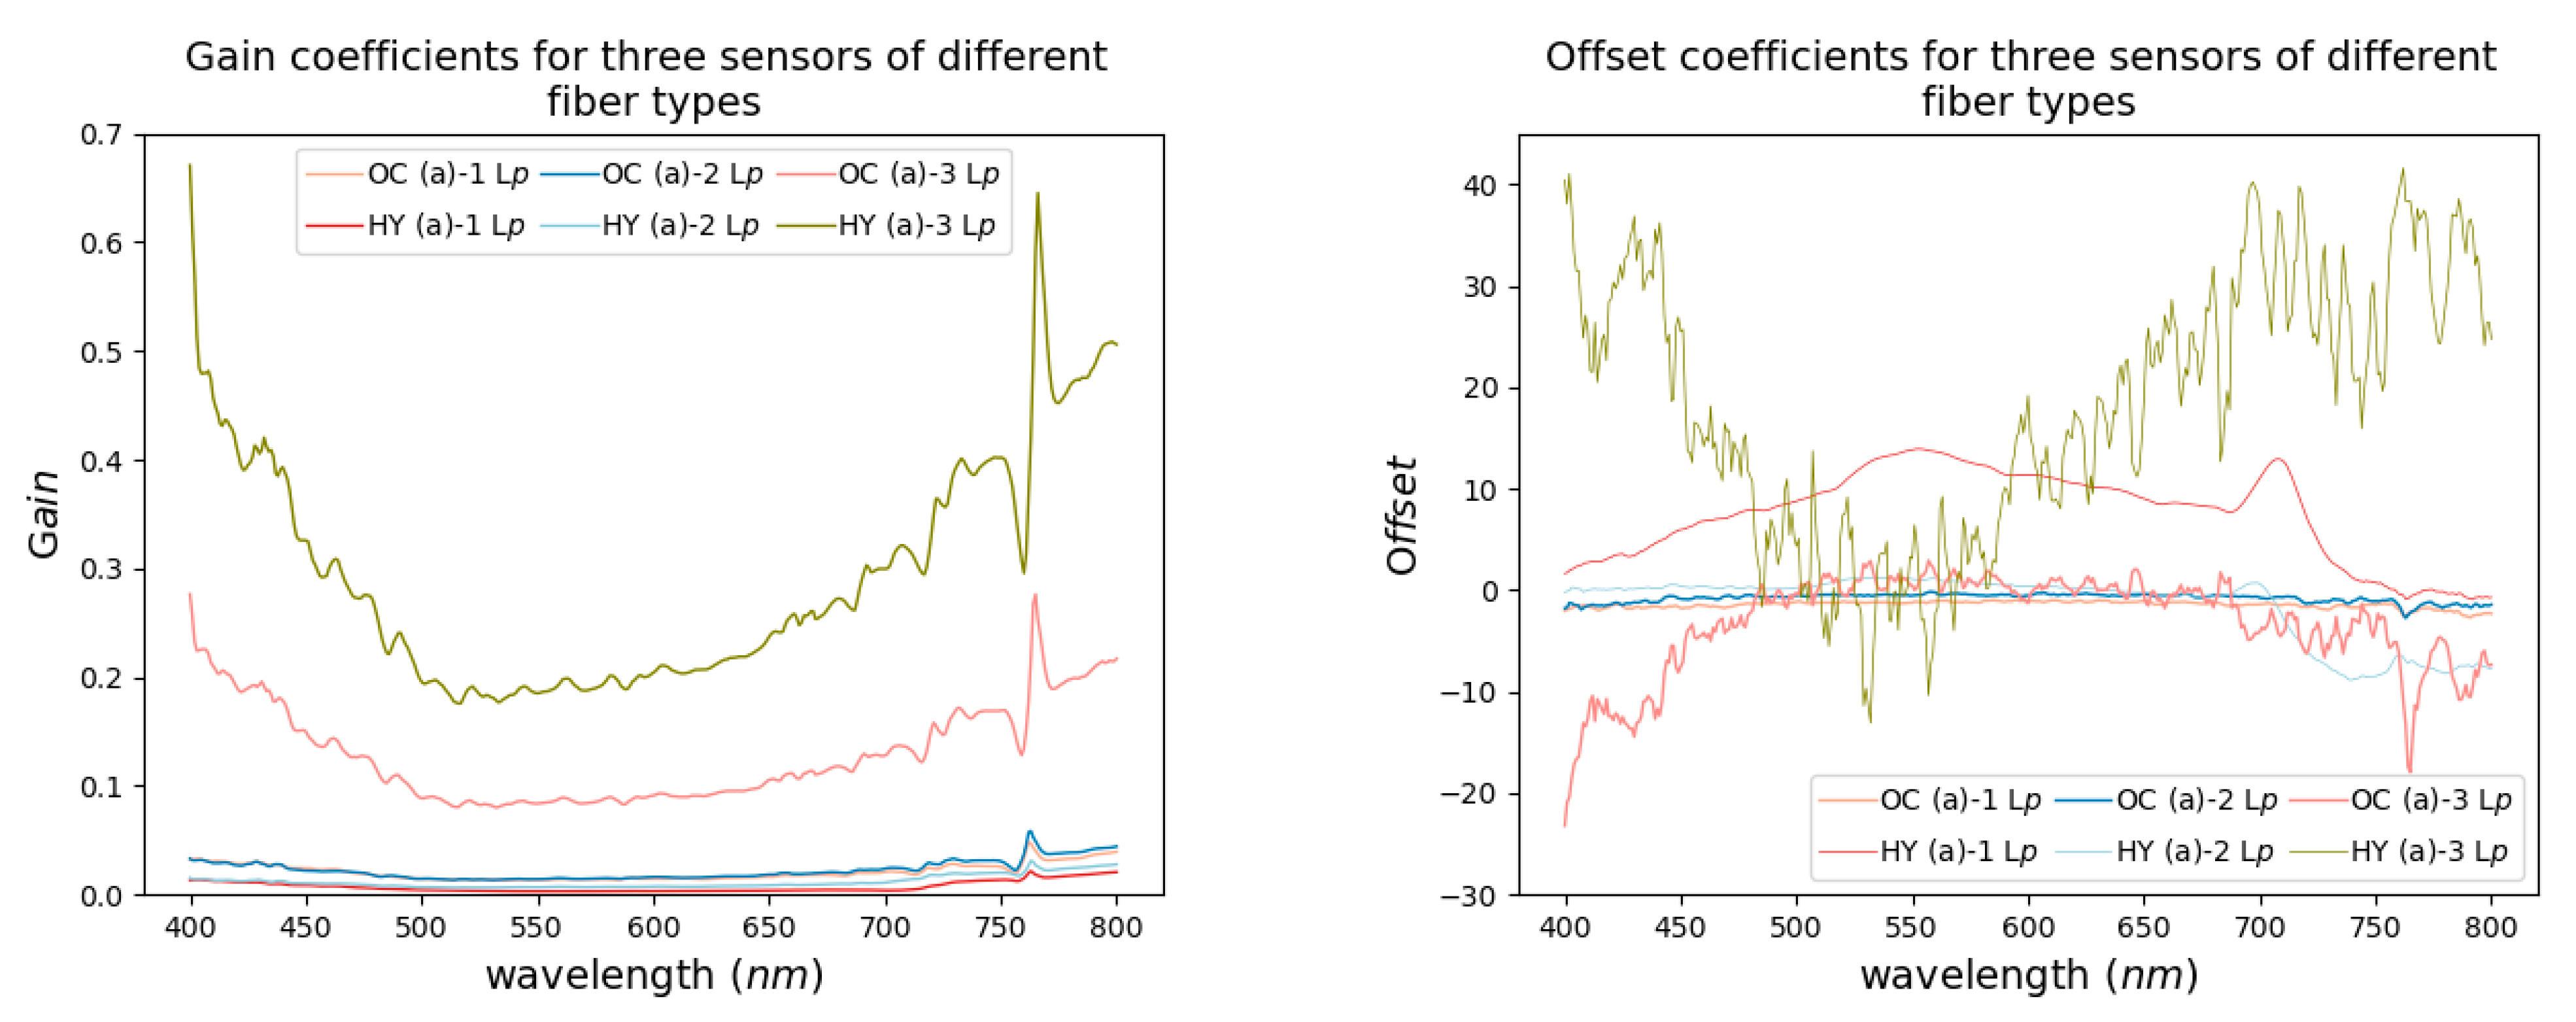
3.2. Comparison of Gain and Offset Via Two Fiber Types

We performed field radiometric calibrations using different fiber types (Table 2). The two different fibers are from Ocean Optics (OC) and Hygirel (HY). The OC fiber is manufactured by Ocean Optics and has a spectral range of 200–1000 nm, and its core diameter is 600 μm and its length is 2 m; HY is manufactured by HAIJILEKEJI and has a spectral range of 200–1100 nm, and its core diameter is 1000 μm and its length is 2 m. Figure 4 shows the results of the field radiometric calibration coefficients gain and offset, which we evaluated using r for least squares regression coefficient accuracy. We found that (a)-1, (a)-2 and (a)-3 have a large variation in gain coefficients across fiber types, but there is a linear relationship, with r reaching 0.99 for Ocean Optics’ gain and Hygirel’s gain. The gain data are again noticeably jittery at 760 nm, which we attribute to the different integration times measured by Trios and STS-VIS at the time of measurement and to the variation in atmospheric gases. We post-processed the gain data by means of smoothing in subsequent processing. We also found for (a)-1, (a)-2 and (a)-3 that the offset coefficients vary considerably across fiber types and do not have any linear relationship, with r reaching 0.99 for offset obtained on sunny days. We found that the overall offset coefficient of HY is much larger than that of OC, which we believe is due to the different core diameters of the two fibers and the different amounts of sunlight energy entering the micro-spectrometer at the same integration time for HY and OC.
We found that for a fixed integration time and different fiber types, there are different field radiometric calibration coefficients for gain and offset. We have made the gain and offset for sunny days for Ocean Optics and Hygirel fiber types publicly available for use so that a field radiometric calibration can be performed before use if a more accurate Rrs is required. Different fiber types mainly affect the calibration coefficients of gain and offset, and the field radiometric calibration coefficients of gain and offset for different fiber types can be found at https://github.com/765302995/FRC_Micro-spec (accessed on 15 November 2022).

3.3. Comparison of Radiance/Irradiance Measured in Four Diffuse Reflector/Target Cloths

When measuring four different reference plates using Trios and STS-VIS, we used the vertical measurement method because the reference plates are diffuse light sources. The results of the simultaneous measurements of the diffuse reflectance plate/target cloth using the micro-spectrometer and Trios under sunny conditions are shown in Figure 5. It can be seen that the micro-spectrometer and Trios have a large error at 760 nm in the oxygen absorption. In 95% of the diffuse reflectance plate results, the bias error of Rrs measured by the micro-spectrometer and Trios ranged from 0.5 to 1.6%; in 20% of the diffuse reflectance plate results, the bias error of Rrs measured by the micro-spectrometer and Trios ranged from −4.15 to −7.44%; in 5% of the target cloth results, the bias error of Rrs measured by the micro-spectrometer and Trios ranged from −1.87 to −12.63%; and in 2% of the target cloth results, the bias error of Rrs measured by the micro-spectrometer and Trios ranged from −22.9 to −47.41%. The lower the reflectance, the poorer the signal-to-noise ratio of the micro-spectrometer and, therefore, the greater the error in the measured reflectance.

4. Discussion

The Rrs accuracy and availability of micro-spectrometer measurements are evaluated here. We firstly evaluate the simultaneous measurements from Qinghai Lake and Golmud River waters using the micro-spectrometer and Trios, and finally, we carry the calibrated micro-spectrometer in the unmanned boat to perform the first measurement of the water body in plateau unmanned lakes.
The water body has a clear bidirectional reflectance distribution, so when we measure the water body, the measurement angle needs to meet the zenith angle of the sun at 40° and the solar azimuth angle at 135° or 45° to eliminate the influence of sun glint. We use the above-water approach to measure water bodies from the same angles as described above.

4.1. Comparison of Rrs Measured in Two Plateau Inland Water Body Types

We carried out and compared Rrs measurements by using the micro-spectrometer and Trios on Qinghai Lake and in the Golmud city River, and the comparison results are shown in Figure 6: there is an overestimation of Rrs when measured using the micro-spectrometer in Qinghai Lake (Figure 6a), where the r of Rrs measured by the micro-spectrometer and Trios is 0.99; the MAPD reaches 18.64%; and the bias is at 400–450 nm, 590–610 nm and 700–750 nm, all which exceeded 20%. We can see from the in situ photo (a) that this inland lake of the Qinghai–Tibet Plateau is a clean type. The cleaner the water body, the lower the reflectivity of the water body and the lower the SNR of the micro-spectrometer, meaning that the MPAD is larger. However, we can see by the shape of the water body spectrum that we obtained a complete measurement of the spectral shape of the clean water body. There is an underestimation of Rrs in the Golmud River when measured with the micro-spectrometer (Figure 6b); the micro-spectrometer and Trios reached an r of 0.99 for Rrs, an MAPD of 5.11% and a bias of over 10% at 700–750 nm. We can see from the in situ photo (b) that this inland river of the Qinghai–Tibet Plateau has a turbid type. The more turbid the water body, the higher the reflectance of the water body, and the higher the SNR of the micro-spectrometer. We can see by the shape of the water body spectrum that we obtained a complete measurement of the spectral shape of the clean water body. For the turbid water body, not only is the water body shape the same, but the value of the water body spectrum is also very similar; thus, the water body spectrum measured by the micro-spectrometer can be used for quantitative water body parameter research.

4.2. Unmanned Area Applications

In field experiments that are carried out in plateau inland waters, many lakes and rivers are in unmanned areas and, therefore, cannot be measured with spectrometers such as Trios. Instead, we can use micro-spectrometers to measure the spectra of unmanned water bodies. The calibrated micro-spectrometer is carried on unmanned boats for the measurements. We designed the route according to the GPS of the unmanned boat and in accordance with the experiment time to ensure that the three probes of the micro-spectrometer met the solar zenith angle of 40° and the solar azimuth angle of 135°, or met the 45° water measurement angle requirements. When the unmanned boat arrives at the predetermined point, the unmanned boat will stop and sway according to the water waves; thus, we arrived at the point moving slowly in order to obtain the measurement of the point walking water body spectrum. Here, the water spectra of the Qarhan Salt Lake (DBX,NHBX) and the Hoh Xil Salt Lake (KKXL) were measured, as shown in Figure 7. From the in situ photos, it can be seen that DBX3 is the most turbid, with the highest water reflectance at 590 nm at 0.055 sr−1, and at 500–700 nm exceeding 0.03 sr−1, resulting in a heavy greyish-brown color. DBX8 is also more turbid, with the highest water reflectance at 600 nm at 0.039 sr−1, and 550–720 nm. The reflectance of DBX6 reached the highest value at 600 nm at 0.02 sr−1, and had a grey-green color; the reflectance of KKXL1 and KKXL2 reached the highest value at 580 nm, and the reflectance was more stable at 400–580 nm, and thus, the color of the water body was blue.

5. Conclusions

Radiation calibration is needed to carry out irradiance and radiance measurements with micro-spectrometers. This work introduces the method of field radiation calibration for micro-spectrometers, analyzes the effect of different types of connected fibers on the radiation calibration, and analyzes the performance of micro-spectrometers in measuring Rrs in inland waters. The main findings are as follows: (1) Different fiber types mainly affect the calibration coefficients of gain and offset, and the field radiometric calibration coefficients of gain and offset for different fiber types can be found at https://github.com/765302995/FRC_Micro-spec (accessed on 15 November 2022). (2) The MAPD of the micro-spectrometer reached 18.64% and 5.11% for clear water and turbid water, respectively, and the water body Rrs values of unmanned plateau lakes were obtained for the first time using the micro-spectrometer. This article shows that the micro-spectrometer can meet the requirements for field measurements of Rrs of water bodies in inland unmanned areas, and with this breakthrough in the radiation performance of the micro-spectrometer, we can obtain more accurate Rrs measurements of water bodies in unmanned areas.

Author Contributions

Conceptualization J.S. and Q.S.; project administration, Y.Y. and J.L.; writing—original draft preparation, J.S.; writing—review and editing, Q.S.; validation, L.W. and F.Z.; supervision, Q.S.; methodology, J.S. All authors have read and agreed to the published version of the manuscript.

Funding

This work was supported in part by the National Key Research and Development Program of China under grant number 2021YFB3901101.

Institutional Review Board Statement

Not applicable.

Informed Consent Statement

Not applicable.

Data Availability Statement

Not applicable.

Acknowledgments

The authors would like to thank Qian Shen from the Key Laboratory of Digital Earth Science, Aerospace Information Research Institute, Chinese Academy of Sciences for help with writing. We are also thankful to all anonymous reviewers for their constructive comments provided on the study. Thanks to Ge Yongquan and Gao Hangyu from Shenyang Jianzhu University for their help in obtaining the data.

Conflicts of Interest

The authors declare no conflict of interest.

Appendix A

Figure A1. Conceptual view of the unmanned ship carrying a micro-spectrometer to collect water body spectrum; the side view details the angle of measurement of the zenith angle of the three sensors followed for spectrum collection and the top view details the angle of measurement of the azimuth of the three sensors for spectrum collection.
Applsci 13 02117 g0a1
Figure A2. Comparison figure of different spectral resampling methods, (a) zero spline interpolation; (b) linear spline interpolation; (c) quadratic spline interpolation; (d) cubic spline interpolation.
Applsci 13 02117 g0a2

References

  1. Antoine, D.; IOCCG. Ocean-Colour Observations from a Geostationary Orbit; International Ocean Colour Coordinating Group (IOCCG): Dartmouth, NS, Canada, 2012. [Google Scholar]
  2. Chawla, I.; Karthikeyan, L.; Mishra, A.K. A Review of Remote Sensing Applications for Water Security: Quantity, Quality, and Extremes. J. Hydrol. 2020, 585, 124826. [Google Scholar] [CrossRef]
  3. Hou, X.; Feng, L.; Dai, Y.; Hu, C.; Gibson, L.; Tang, J.; Lee, Z.; Wang, Y.; Cai, X.; Liu, J.; et al. Global Mapping Reveals Increase in Lacustrine Algal Blooms over the Past Decade. Nat. Geosci. 2022, 15, 130–134. [Google Scholar] [CrossRef]
  4. Shen, Q.; Yao, Y.; Li, J.; Zhang, F.; Wang, S.; Wu, Y.; Ye, H.; Zhang, B. A CIE Color Purity Algorithm to Detect Black and Odorous Water in Urban Rivers Using High-Resolution Multispectral Remote Sensing Images. IEEE Trans. Geosci. Remote Sens. 2019, 57, 6577–6590. [Google Scholar] [CrossRef]
  5. O’Reilly, J.; Maritorena, S.; Mitchell, B.; Siegel, D.; Carder, K.; Garver, S.; Kahru, M.; McClain, C. Ocean Color Chlorophyll Algorithms for SEAWIFS. J. Geophys. Res. 1998, 103, 24937–24953. [Google Scholar] [CrossRef]
  6. Ni, Z.; Wang, S.; Wang, Y. Characteristics of Bioavailable Organic Phosphorus in Sediment and Its Contribution to Lake Eutrophication in China. Environ. Pollut. 2016, 219, 537–544. [Google Scholar] [CrossRef]
  7. Chen, Z.; Hu, C.; Comny, R.N.; Muller-Karger, F.; Swarzenski, P. Colored Dissolved Organic Matter in Tampa Bay, Florida. Mar. Chem. 2007, 104, 98–109. [Google Scholar] [CrossRef]
  8. Liu, D.; Yu, S.; Xiao, Q.; Qi, T.; Duan, H. Satellite Estimation of Dissolved Organic Carbon in Eutrophic Lake Taihu, China. Remote Sens. Environ. 2021, 264, 112572. [Google Scholar] [CrossRef]
  9. Federico, B.; Marco, C.; Jixi, G.; Robert, H.; Massimo, M.; Yanming, R.; Patrizia, S.; Luigi, T. Remote Sensing Methodology for the Estimation of Methane Emissions from Chinese Lakes. In Proceedings of the 2008 International Workshop on Earth Observation and Remote Sensing Applications, Beijing, China, 30 June–2 July 2008; IEEE: Piscataway, NJ, USA, 2018; pp. 1–6. [Google Scholar]
  10. The Analytical Spectral Devices, FieldSpec. Available online: https://www.malvernpanalytical.com/en/products/product-range/asd-range/fieldspec-range (accessed on 9 August 2022).
  11. High-Resolution Profiling Reflectance Radiometer (PRR). Available online: http://www.biospherical.com/index.php?option=com_content&view=article&id=51&Itemid=67 (accessed on 9 August 2022).
  12. GmbH, T. RAMSES. Available online: https://www.trios.de/en/ramses.html (accessed on 9 August 2022).
  13. Hyperspectral Surface Acquisition System Sea-Bird Scientific. Available online: https://www.seabird.com/hyperspectral-surface-acquisition-system/product?id=54627923900&callback=qs (accessed on 9 August 2022).
  14. Yang, Z.; Albrow-Owen, T.; Cai, W.; Hasan, T. Miniaturization of Optical Spectrometers. Science 2021, 371, 0722. [Google Scholar] [CrossRef]
  15. Zarzar, C.M.; Dash, P.; Dyer, J.L.; Moorhead, R.; Hathcock, L. Development of a Simplified Radiometric Calibration Framework for Water-Based and Rapid Deployment Unmanned Aerial System (UAS) Operations. Drones 2020, 4, 17. [Google Scholar] [CrossRef]
  16. Cao, H.; Gu, X.; Wei, X.; Yu, T.; Zhang, H. Lookup Table Approach for Radiometric Calibration of Miniaturized Multispectral Camera Mounted on an Unmanned Aerial Vehicle. Remote Sens. 2020, 12, 4012. [Google Scholar] [CrossRef]
  17. Shi, G.; Du, X.; Du, M.; Li, Q.; Tian, X.; Ren, Y.; Zhang, Y.; Wang, H. Cotton Yield Estimation Using the Remotely Sensed Cotton Boll Index from UAV Images. Drones 2022, 6, 254. [Google Scholar] [CrossRef]
  18. Gege, P.; Dekker, A.G. Spectral and Radiometric Measurement Requirements for Inland, Coastal and Reef Waters. Remote Sens. 2020, 12, 2247. [Google Scholar] [CrossRef]
  19. Cao, Z.; Ma, R.; Liu, J.; Ding, J. Improved Radiometric and Spatial Capabilities of the Coastal Zone Imager Onboard Chinese HY-1C Satellite for Inland Lakes. IEEE Geosci. Remote Sens. Lett. 2021, 18, 193–197. [Google Scholar] [CrossRef]
  20. Leroy, M.; Henry, P.; Guenther, B.; McLean, J. Comparison of CNES Spherical and NASA Hemispherical Large Aperture Integration Sources: II. Using the SPOT-2 Satellite Instruments. Remote Sens. Environ. 1990, 31, 97–104. [Google Scholar] [CrossRef]
  21. Shi, J.; Li, M.; Hu, Y.; Wang, X.; Xu, H.; Chi, G.; Hong, J. Laboratory Calibration of an Ultraviolet–Visible Imaging Spectropolarimeter. Remote Sens. 2022, 14, 3898. [Google Scholar] [CrossRef]
  22. Sun, Y.C.; Huang, C.; Xia, G.; Jin, S.Q.; Lu, H.B. Accurate Wavelength Calibration Method for Compact CCD Spectrometer. J. Opt. Soc. Am. A Opt. Image Sci. Vis. 2017, 34, 498–505. [Google Scholar] [CrossRef]
  23. Xiong, X.; Erives, H.; Xiong, S.; Xie, X.; Esposito, J.; Sun, J. Performance of Terra MODIS Solar Diffuser and Solar Diffuser Stability Monitor. In Proceedings of the Optics and Photonics 2005, San Diego, CA, USA, 31 July–4 August 2005; pp. 58820S.1–58820S.10. [Google Scholar]
  24. Xiong, X.; Barnes, W. An Overview of MODIS Radiometric Calibration and Characterization. Adv. Atmos. Sci. 2006, 23, 69–79. [Google Scholar] [CrossRef]
  25. Adão, T.; Hruška, J.; Pádua, L.; Bessa, J.; Peres, E.; Morais, R.; Sousa, J.J. Hyperspectral Imaging: A Review on UAV-Based Sensors, Data Processing and Applications for Agriculture and Forestry. Remote Sens. 2017, 9, 1110. [Google Scholar] [CrossRef]
  26. Smith, R.C.; Booth, C.R.; Star, J.L. Oceanographic Biooptical Profiling System. Appl. Opt. 1984, 23, 2791–2797. [Google Scholar] [CrossRef]
  27. Mueller, J.L. Above-Water Radiance and Remote Sensing Reflectance Measurement and Analysis Protocols. In Ocean Optics Protocols for Satellite Ocean Color Sensor Validation Revision 3; NASA Goddard Space Flight Center: Greenbelt, MD, USA, 2000; Volume 2, pp. 171–181. [Google Scholar]
  28. Lee, Z.; Pahlevan, N.; Ahn, Y.-H.; Greb, S.; O’Donnell, D. Robust Approach to Directly Measuring Water-Leaving Radiance in the Field. Appl. Opt. 2013, 52, 1693–1701. [Google Scholar] [CrossRef]
  29. Mobley, C.D. Estimation of the Remote-Sensing Reflectance from above-Surface Measurements. Appl. Opt. 1999, 38, 7442–7455. [Google Scholar] [CrossRef]
  30. Huang, C.; Zhang, L.; Fang, J.; Tong, Q. A Radiometric Calibration Model for the Field Imaging Spectrometer System. IEEE Trans. Geosci. Remote Sens. 2013, 51, 2465–2475. [Google Scholar] [CrossRef]
  31. Hu, C.; Feng, L.; Lee, Z.; Davis, C.O.; Mannino, A.; McClain, C.R.; Franz, B.A. Dynamic Range and Sensitivity Requirements of Satellite Ocean Color Sensors: Learning from the Past. Appl. Opt. 2012, 51, 6045–6062. [Google Scholar] [CrossRef]
  32. Cao, Z.; Ma, R.; Duan, H.; Xue, K. Effects of Broad Bandwidth on the Remote Sensing of Inland Waters: Implications for High Spatial Resolution Satellite Data Applications. ISPRS J. Photogramm. Remote Sens. 2019, 153, 110–122. [Google Scholar] [CrossRef]
Figure 1. (a) Ocean Optics micro-spectrometers (STS-VIS); (a)-1 sensor for measuring sky radiance; (a)-2 sensor for measuring water radiance; (a)-3 sensor for measuring downward irradiance. (b) Ocean Optics and Hygirel fiber. (c) Cosine Correctors. (d) Trios. (e) Diffuse reflectance plates and target cloth (99%, 95%, 30%, 20%, 5%, and 2%).
Applsci 13 02117 g001
Figure 2. Comparison of raw and resampled data.
Applsci 13 02117 g002
Figure 3. Dark current diagram for different integration times (a), SNR diagram for radiance measurement of DN values (b), SNR diagram for irradiance measurement of DN values (c).
Applsci 13 02117 g003
Figure 4. Graphs of gain and offset of micro-spectrometer connection with different fiber types.
Applsci 13 02117 g004
Figure 5. Diffuse reflectance plate results with bias plots for 95%, 20%, 5% and 2% measurements using Trios and micro-spectrometer.
Applsci 13 02117 g005
Figure 6. Micro-spectrometer measurements of clear water and turbid water Rrs and bias, and in situ photos of (a) spectrum of Qinghai Lake, (b) spectrum of Golmud city River.
Applsci 13 02117 g006
Figure 7. Micro-spectrometer measurements of unmanned areas of Qarhan and Hoh Xil Salt Lake Rrs and in situ photos.
Applsci 13 02117 g007
Table 1. Parameter table of Trios and STS-VIS.
TriosSTS-VIS
Wavelength (nm)200–1100350–810
Optical Resolution (nm)3.3 nm2.2 nm
Table 2. Parameter table of different fiber types.
Ocean Optics (OC)Hygirel (HY)
Wavelength (nm)200–1100200–1100
Core Diameter (μm)6001000
Length (m)22
Disclaimer/Publisher’s Note: The statements, opinions and data contained in all publications are solely those of the individual author(s) and contributor(s) and not of MDPI and/or the editor(s). MDPI and/or the editor(s) disclaim responsibility for any injury to people or property resulting from any ideas, methods, instructions or products referred to in the content.

