Article

Heterotrophic and Photoautotrophic Media Optimization Using Response Surface Methodology for the Novel Microalga Chlorococcum amblystomatis

1
CCMAR—Centro de Ciências do Mar, Campus de Gambelas, University of Algarve, 8005-139 Faro, Portugal
2
Allmicroalgae Natural Products S.A., Research and Development Department-Rua 25 de Abril, 2445-413 Alcobaça, Portugal
3
LNEG—Laboratório Nacional de Energia e Geologia I.P., Bioenergy and Biorefineries Department, Estrada do Paço do Lumiar 22, 1649-038 Lisbon, Portugal
4
GreenCoLab-Associação Oceano Verde, Campus de Gambelas, Universidade do Algarve, 8005-139 Faro, Portugal
*
Author to whom correspondence should be addressed.
Appl. Sci. 2023, 13(4), 2089; https://doi.org/10.3390/app13042089
Submission received: 20 December 2022 / Revised: 18 January 2023 / Accepted: 3 February 2023 / Published: 6 February 2023
(This article belongs to the Special Issue Recent Developments and Emerging Trends in Marine Biotechnology)

Abstract

:
The nutritional requirements of novel microalgal strains are key for their effective cultivation and metabolite content. Therefore, the optimization of heterotrophic and photoautotrophic culture media is crucial for novel Chlorococcum amblystomatis growth. Heterotrophic and photoautotrophic biomass samples were characterized to identify the differences between their heterotrophic and photoautotrophic biomass composition and their biotechnological potential. Media optimization through surface response methodology led to 44.9 and 51.2% increments in C. amblystomatis-specific growth rates under heterotrophic and photoautotrophic growth, respectively. This microalga registered high protein content (61.49–73.45% dry weight), with the highest value being observed in the optimized photoautotrophic growth medium. The lipid fraction mainly constituted polyunsaturated fatty acids, ranging from 44.47 to 51.41% for total fatty acids (TFA) in cells under heterotrophy. However, these contents became significantly higher (70.46–72.82% TFA) in cultures cultivated under photoautotrophy. An interesting carotenoids content was achieved in the cultures grown in optimized photoautotrophic medium: 5.84 mg·g−1 β-carotene, 5.27 mg·g−1 lutein, 3.66 mg·g−1 neoxanthin, and 0.75 mg·g−1 violaxanthin. Therefore, C. amblystomatis demonstrated an interesting growth performance and nutritional profile for food supplements and feed products that might contribute to meeting the world’s nutritional demand.

1. Introduction

Alternative sources of nutrients and food ingredients rich in bioactive compounds have sparked great interest in the last years, particularly due to their benefits for human and animal health [1,2]. Microalgae can produce a wide range of metabolites such as proteins, lipids, carbohydrates, and valuable pigments with relevant bioactivities that can be used to enhance the nutritional value of food and feed, providing significant health benefits [3,4,5]. Furthermore, these micro-organisms have the great advantage of growing in industrial reactors, preventing their competition with food crops for fresh water supply and arable land. In addition, they can be harvested daily and offer higher reliability and even seasonal-independence, particularly if they are grown under controlled conditions indoors, as in heterotrophy [6,7,8]. Finally, microalgae industrial production still entails high production costs, and the scale-up of cultures from the laboratory scale to industrial photobioreactors is a highly time-consuming process that needs to be addressed [9].
Besides photoautotrophic growth, some microalgae species have the ability to grow heterotrophically using alternative metabolic pathways [10,11]. Heterotrophic cultivation implies the ability to grow in the absence of light, with organic carbon supplementation to replace light energy [12]. This type of cultivation appears to be an alternative to more economical industrial cultivation since it enables stricter control of the process parameters and higher growth rates, leading to cell concentrations in the order of 100 g·L−1 [11,12,13,14] and a reduction in harvesting costs [15]. Nevertheless, this cultivation mode decreases the protein and pigment contents in the resulting biomass [15]. According to Barros et al. [9], a two-stage approach, combining heterotrophic inoculum and photoautotrophic cultivation, might be an advantageous strategy to improve industrial production since it overcomes these limitations and provides high-quality biomass.
Moreover, increasing microalgae growth rates and biomass productivity while reducing operational costs is essential for the future of industrial producers. In addition, the production of different microalgal species is key to promoting a thorough portfolio of bioactive compounds. These compounds can be of interest for different biotechnological applications towards the development of sustainable and economical solutions for today’s needs [16,17]. In addition, the appropriate culture medium recipes, a factor that is crucial for obtaining highly concentrated microalgal cultures, must be developed to enhance biomass and target metabolite productivities [18].
In order to achieve the aforementioned goal, the use and design of experiment methodologies has been applied, which allows for a reduction in time and the number of experiments and is more accurate than ‘one variable at a time methods’ since it evaluates interactions between the variables tested [19,20]. Response surface methodology (RSM) is a compilation of mathematical/statistical techniques that allow for the designing of experiments and the assessment of their effects and significance, and the monitoring of the interaction of several variables in specific responses through the evaluation of empirical models [21]. RSM has become a fundamental tool in numerous branches of scientific and technological research, such as biotechnology, namely in medium-optimization studies [22,23]. Therefore, the present work focused on the optimization of photoautotrophic and heterotrophic culture media for a novel microalga, previously known as Oophila amblystomatis and recently reclassified as Chlorococcum amblystomatis [24]. The biomass composition of C. amblystomatis was evaluated regarding protein, pigments, lipid, and carbohydrate contents to determine the nutritional profile attained in each cultivation condition.

2. Materials and Methods

2.1. Microalgal Strain and Growth Conditions

Chlorococcum amblystomatis was obtained from Allmicroalgae (Pataias, Portugal) culture collection.
Heterotrophic culture conditions: for the Plackett–Burman screening and Box–Behnken experiment, Chlorococcum amblystomatis axenic cultures were incubated in 250-mL Erlenmeyer flasks with 50 mL of culture medium that were placed on an orbital shaker (150 rpm, at 28 °C in the absence of light). The validation of medium optimization was performed under the same conditions.
Photoautotrophic culture conditions: for the Box–Behnken experiment, a heterotrophic C. amblystomatis culture was used to inoculate the photoautotrophic reactors. Axenic cultures were grown in 100 mL bubble columns with 30 mL of culture medium at 23 ± 1 °C with continuously injected compressed 0.2 µm filtered air under the continuous radiation of 100 µmol photons m−2·s−1. Optimal medium validation was performed in 1 L bubble column reactors with 0.8 L of culture medium, at 23 ± 1 °C with continuously injected compressed 0.2 µm filtered air under continuous radiation of 100 µmol photons m−2·s−1. pH was kept between 7.5 and 8.0 by CO2 injection.

2.2. Growth Assessment

Microalgal growth was assessed by measuring dry weight (DW) until the cultures reached the stationary phase. Briefly, a defined sample volume was filtered on microglass filters (0.7 µm, VWR), washed with an equal volume of deionized water, and dried using a moisture analyzer (KERN DBS, KERN & Sohn GmbH, Balingen-Frommern, Germany) at 120 °C.
Volumetric biomass productivity (P) was calculated as the difference in biomass concentration (X) during a specific time (t), in g·L−1·h−1 for heterotrophy and in g·L−1·d−1 for photoautotrophy, following the Equation (1):
P = X 2 X 1 t 2 t 1
Specific growth rate (μ) was determined by the quotient between the linearized biomass concentration (X) within a period of time (t) in h−1 for heterotrophy and d−1 for photoautotrophy, as depicted in Equation (2):
µ = ln ( X 2 / X 1 ) t 2 t 1
where X2 and X1 refer to biomass concentration in grams per liter, and t2 and t1 refer to different time points.

2.3. Experimental Design

The Plackett–Burman design was accomplished as a preliminary assay to evaluate the influence of two coded levels and two central points of temperature (T), vitamins, and thirteen nutrients on Chlorococcum amblystomatis-specific growth rate. Based on the company’s basal medium, the lowest and highest concentration levels of vitamins, phosphorus, calcium, magnesium, iron, zinc, cobalt, molybdate, manganese, nickel, copper, boron, and nitrogen, as well as the nitrogen source, namely urea ((NH2)2CO) and ammonium sulfate ((NH4)2SO4), were set. The significance of each medium component towards the culture growth, mainly specific growth rates, was considered as the response variable, and the results of variance analysis were achieved using the Minitab® v.20 software.
Thereafter, a Response Surface Methodology was performed using Box–Behnken methodology to determine the optimal values of the significant factors resulting from the Plackett–Burman screening. The concentrations of non-significant factors were constant. To verify the model, the variance analysis was evaluated using Design-Expert® v.11 software, and the experimental-specific growth rates were compared with the predicted values given by the linear polynomial Equation (3), obtained from the model:
Y = a0 + a1 A + a2 B + a3 C + a4 AB + a5 AC + a6 BC
where Y represents the specific growth rate value; A, B, and C correspond to the factors with significant effects on specific growth rates; a0 is the intercept, and a1a6 are the estimated coefficients.

2.4. Biochemical Composition

Total lipid content was determined according to the Bligh and Dyer [25] method with some modifications [26]. Briefly, approximately 20 mg of freeze-dried biomass was extracted with a mixture of chloroform, methanol, and water (1:2:0.8, v:v:v) and homogenized for 3 minutes in a mixer mill (MM400, Retsch GmbH, Retsch-Alle 1-5, 42781 Haan, Germany) with glass beads at 30 Hz. The chloroform layer, separated by centrifugation, was transferred to new vessels. Then, 0.7 mL were pipetted to preweighed tubes and evaporated at 60 °C. The resulting dried residue was weighed (Sartorius Lab Instruments GmbH & Co. 37070 Gottingen, Germany-MSA36S-000-DH) and compared with the initial weight to provide an accurate result of the lipid fraction.
Protein content was calculated by multiplying the N content with the standard conversion factor of 6.25 [27] after CHN analysis using a Vario EL III (Vario EL, Elementar Analyser System, GmbH, Hanau, Germany).
The ash content was determined by the biomass’s weight difference before and after combustion. Biomass was heated at 550 °C for 8 h using a furnace (LE062K17N1, Nabertherm, Lilienthal, Germany).
Carbohydrates were determined by differences from other macronutrients.
Fatty acid methyl esters (FAME) were determined according to Lepage and Roy [28] protocol, modified by Pereira et al. [26]. Briefly, 20 mg of freeze-dried biomass was added to 1.5 mL of methanol/acetyl chloride (20:1 v:v) and homogenized for 3 minutes in a mixer mill (MM400, Retsch GmbH, Retsch-Alle 1-5, 42781 Haan, Germany) with glass beads, at 30 Hz. Then, 1 mL of n-hexane was added to the derivatization vessels and placed in a water bath (70 °C for 60 min). Thereafter, water and n-hexane (1:4, v:v) were added and homogenized in a vortex. The hexane fraction, obtained by centrifugation, was transferred to new tubes, and anhydrous sodium sulfate (Na2SO4) was added to the extracts. After filtration, samples were evaporated under nitrogen gas flow. The pellet was resuspended in 0.5 mL of gas chromatography-grade hexane and analyzed in a GC-MS analyzer (Bruker SCION 456/GC, SCION TQ MS) equipped with a ZB-5MS capillary column (30 m × 0.25 mm of internal diameter, 0.25 μm of film thickness, Phenomenex), using helium as the carrier gas. The temperature was set to 60 °C for 1 min, then 30 °C min−1 to 120 °C, 5 °C min−1 to 250 °C and finally increased to 20 °C min−1 up to 300 °C, with the injection temperature being 300 °C as well. To establish the calibration curves, five different concentrations of the standards Supelco® 37 component FAME Mix 41 (Sigma-Aldrich, Sintra, Portugal) were analyzed for further identification and quantification of FAME.
For chlorophylls a and b quantification, 10 mg of freeze-dried biomass were weighed, 6 mL acetone was added and homogenized for 10 min with glass beads in a vortex. The samples were centrifuged (HERMLE Z300, New York, NY, USA) at 2500× g for 10 min until complete loss of the pellet or the supernatant color. The supernatant was analyzed using a spectrophotometer (Genesys 10S UV-VIS, Waltham, MA, USA) in the scanning spectrum (380 to 700 nm), and the resultant data by the Excel Add-In Solver on Windows 2013.
The content of carotenoids was determined based on Couso et al. [29]. Briefly, 10 mg of freeze-dried biomass was resuspended in methanol containing 0.03% of butylhydroxytoluene and homogenized for 3 minutes in a mixer mill (MM400, Retsch GmbH, Retsch-Alle 1-5, 42781 Haan, Germany), with glass beads and one tungsten bead, at 30 Hz, until complete loss of the pellet or the supernatant color. Then, the centrifuged extract was completely dried under nitrogen flow, and the pellet was resuspended in high-performance liquid chromatography (HPLC)-grade methanol and filtered (0.22 μm) into amber vials. The chromatographic analysis of the carotenoids was performed in a Prominence-i LC-2030Cplus (Shimadzu) HPLC equipped with a diode-array detector, using a column Surf C18 TriF100A 3µm 10 × 2.1 mm and a flow rate of 1 mL.min−1. The mobile phase consisted of ethyl acetate as solvent A and 9:1 (v:v) acetonitrile:water as solvent B. The gradient program applied was: 0–16 min, 0– 60% A; 16–30 min, 60% A; 30–32 min, 100% A, and 30–35 min 100% B. The injection volume was 100 µL, and the quantification was carried out at 450 nm using calibration curves of the neoxanthin, violaxanthin, lutein, and β-carotene standards. The respective calibration curves of pigment standards are supplied in Supplementary Materials (Table S1).

2.5. Statistical Analysis

For the design of experiments (DoE) assays, the statistical analysis of variance of Plackett–Burman was obtained with Minitab® v.20 software, and for Box–Behnken, the Design-Expert® v.11 software was used. The adequacy of the model was evaluated according to the correlation coefficient (R2), F-test, and p-value, with a 95% of confidence level.
Regarding the experiments aside from DoE, statistical analyses were performed using R software version 3.6.1 in RStudio IDE version 1.2.1335. The mean and standard deviation were determined using biological triplicates for each experiment. The results were compared using one-way ANOVA, followed by Tukey-HSD multiple comparisons. Experimental results are presented with a 95% confidence level.

3. Results and Discussion

3.1. Preliminary Screening Using Plackett–Burman Design

The Plackett–Burman experimental layout was obtained with Minitab® v.20 software, and the respective results of the specific growth rates are described in Table S2 in Supplementary Materials. The results of the variance analysis are presented in Table 1.
The nitrogen sources, NaH2PO4·H2O + K2HPO4, and CuSO4·5H2O were the statistically significant factors (p < 0.05) affecting the C. amblystomatis heterotrophic-specific growth rate, suggesting that the remaining factors were not limiting culture growth. Moreover, since the categoric factor registered a negative effect, the lower-level factor of (NH2)2CO was the most appropriate nitrogen source.
The model registered a multiple correlation coefficient (R2) of 0.951, indicating that more than 95% of the data in this screening could be explained by this model. Furthermore, an F-value of 7.70 and a p-value lower than 0.05 also support the significance of the model and the fit between the data and the model used.

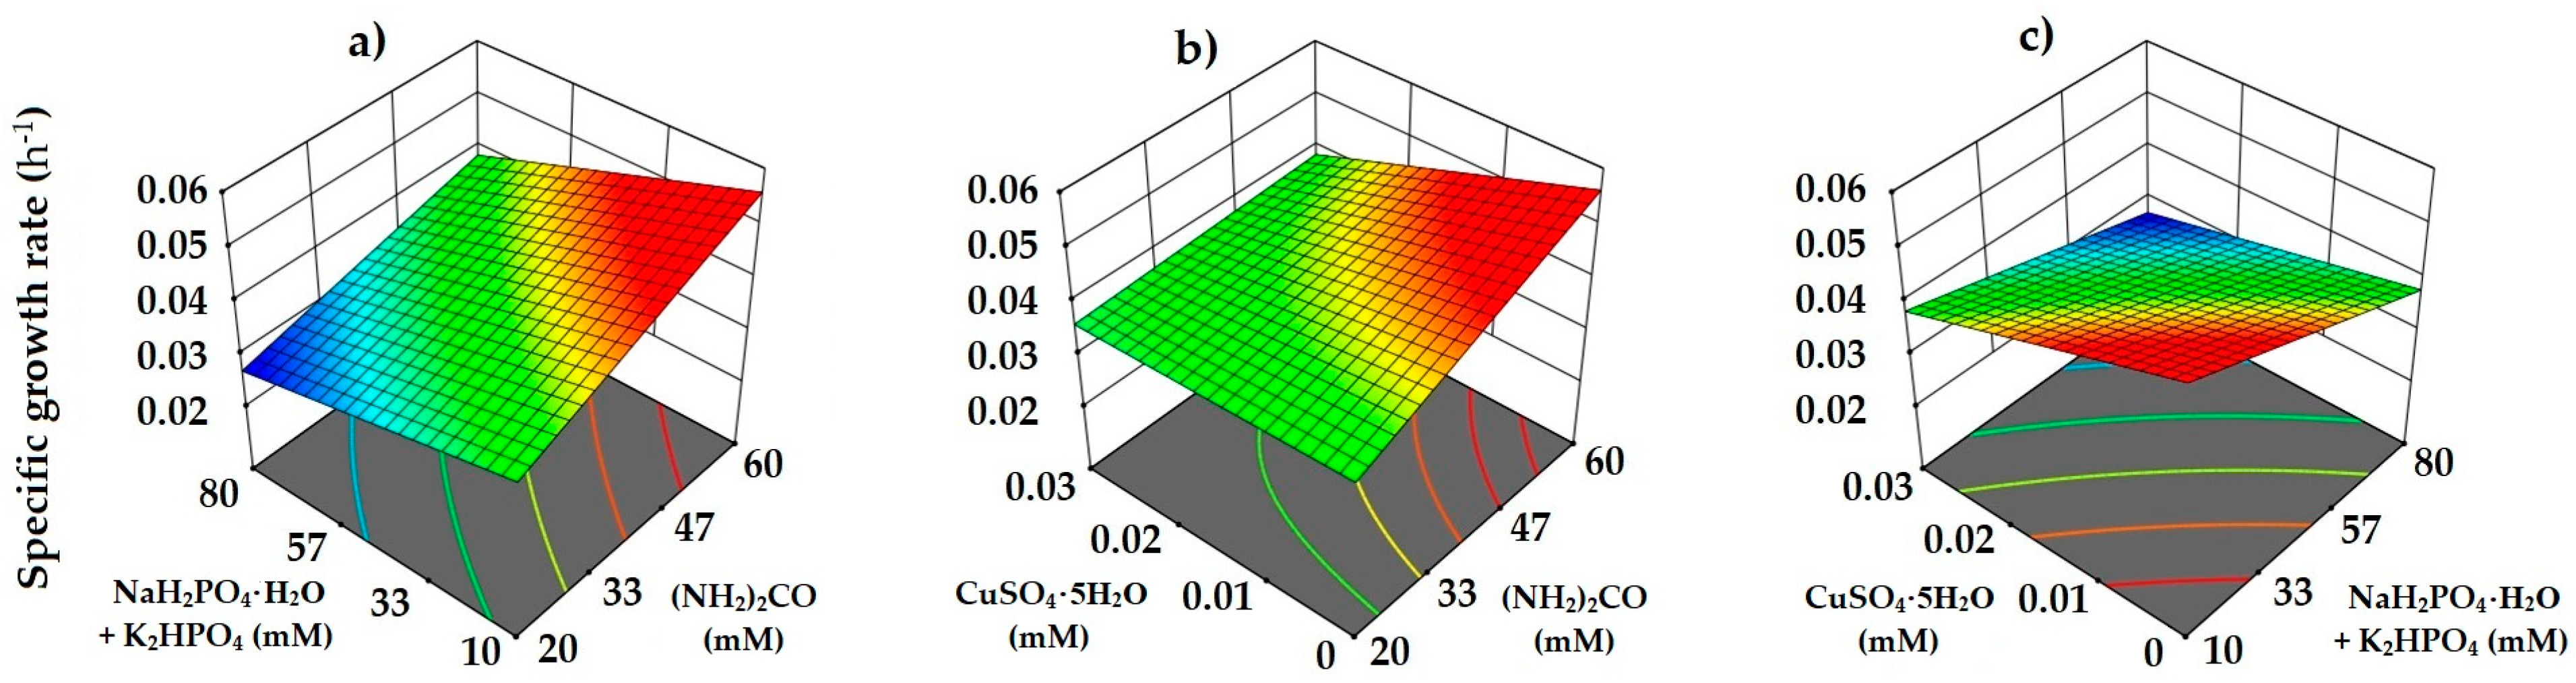
3.2. Heterotrophic Medium Optimization Using Box–Behnken Design

Based on the previous results, a response surface methodology (Box–Behnken) was performed to determine the optimal values of (NH2)2CO, NaH2PO4·H2O + K2HPO4, and CuSO4·5H2O, as well as their interactions to maximize C. amblystomatis heterotrophic specific growth rates.
The Box–Behnken layout, as well as the experimental and predicted results of specific growth rates, are shown in Table 2.
The 12th experiment (60 mM of (NH2)2CO, 10m M of NaH2PO4·H2O + K2HPO4 and 0.015 mM of CuSO4·5H2O) registered the highest specific growth rate (0.048 h−1), while the 7th experiment (20 mM of (NH2)2CO, 80 mM of NaH2PO4·H2O + K2HPO4 and 0.015 mM of CuSO4·5H2O) resulted in the lowest value (0.028 h−1).
The predicted results were obtained from the linear polynomial Equation (4), given by the model, as follows:
S p e c i f i c   g r o w t h   r a t e = 0.027707 + 0.000596 A 0.000124 B + 0.291714 C 0.00000244306 A × B 0.020235 A × C + 0.003894 B × C
The statistical analysis, described in Table 3, demonstrated the (NH2)2CO, NaH2PO4·H2O + K2HPO4 and CuSO4·5H2O concentrations, as well as their interactions, which significantly affected (p < 0.05) C. amblystomatis-specific growth rate. The model registered a correlation coefficient R2 of 0.980, suggesting the suitability of this model for predicting the responses in this experiment.
Moreover, the interactions between (NH2)2CO, NaH2PO4·H2O + K2HPO4, and CuSO4·5H2O and specific growth rates (h−1) were revealed by response surface plots (Figure 1). Varying the concentration of these factors causes a significant effect on the specific growth rates. According to the results, the model predicted the highest specific growth rates at approximately 60 mM of (NH2)2CO, 10 mM of NaH2PO4·H2O + K2HPO4 and 0.005 mM of CuSO4·5H2O.
Herewith, the final composition of the heterotrophic optimized medium was set as 60 mM of (NH2)2CO; 10 mM of NaH2PO4·H2O + K2HPO4; 3 mM of CaCl2·2H2O; 5.50 mM of MgSO4·7H2O; 0.30 mM of FeSO4·7H2O; 1.50 mM of ZnSO4·7H2O; 0.02 mM of Cl2Co·6H2O; 0.05 mM of Na2MoO4·2H2O; 0.85 mM of MnSO4·H2O; 0.005 mM of CuSO4·5H2O; 1 mM of H3BO3; 0.01 mM of NiCl2·6H2O and 1 dose of heterotrophic vitamins mix (Thiamine-HCl (1.0 g·L−1), d-Biotin (0.015 g·L−1), cyanocobalamin (B12) (0.012 g·L−1), calcium pantothenate (0.030 g·L−1), and PABA (p-Aminobenzoic acid) (0.060 g·L−1). Dose: 1.50 mL·L−1).

3.3. Validation of Heterotrophic Medium Optimization

Hereupon, C. amblystomatis cultures grown with the company’s heterotrophic basal medium were compared to those grown with the optimized heterotrophic medium (Table 4).
Cultures grown with the optimized medium registered an improvement of 44.9% in specific growth rate, from 0.034 to 0.050 h−1 (p < 0.05). Consequently, improvements of 67.4% were registered for global productivity, increasing from 0.12 to 0.19 g·L−1·h−1 (p < 0.05) and over 109.7% for maximum productivity, from 0.29 to 0.60 g·L−1·h−1 (p < 0.05). Furthermore, the highest biomass concentration of 10.53 g·L−1, in comparison to 7.66 g·L−1, was obtained from cultures grown with the optimized medium (p < 0.05). This appropriate culture medium recipe brought improvements in C. amblystomatis growth rates and productivity and resulted in higher cell concentrations, which is key to nutrient cost reduction and the operational costs of production in an industrial setting [18].

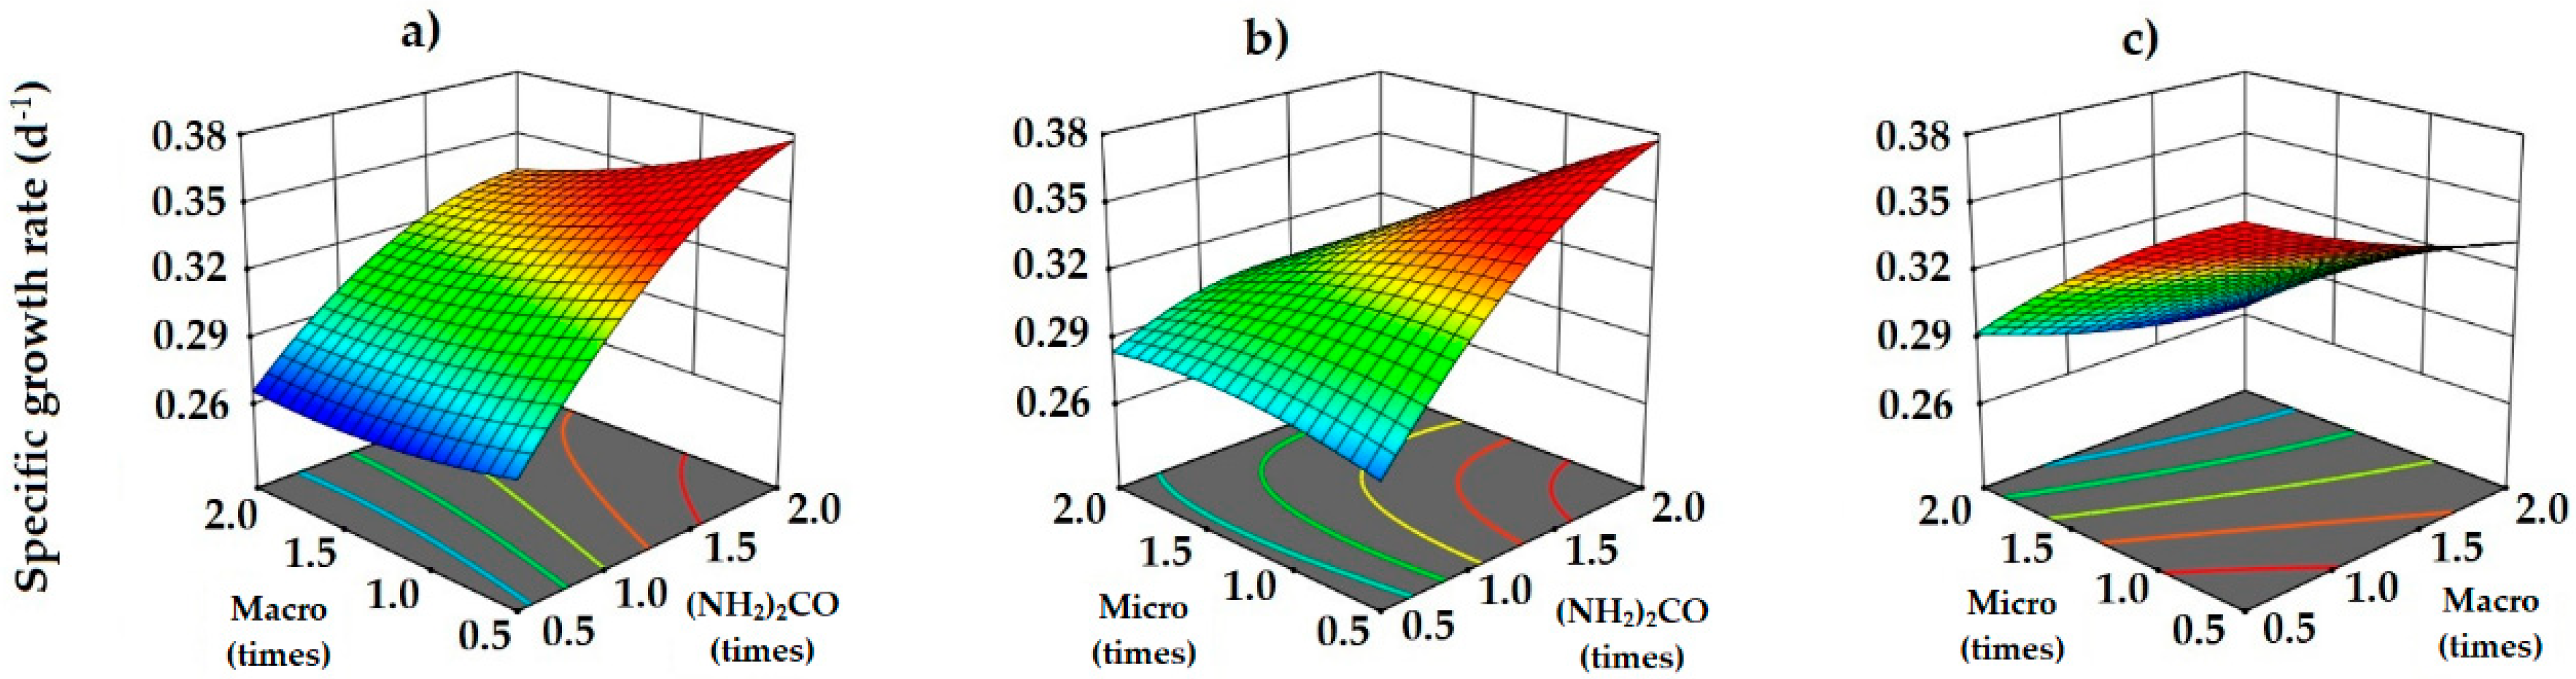
3.4. Photoautotrophic Medium Optimization Using Box–Behnken Design

Thereafter, a Box–Behnken design was performed for the photoautotrophic cultures based on the results obtained during the optimization of heterotrophic growth. The optimum nutrient concentration was diluted 10 times to fit the photoautotrophic growth requirements. Different nutrient concentrations were evaluated using half to double the amount of each class of nutrients to find the best proportion for this strain’s photoautotrophic growth. “Other Macro” corresponds to the macronutrients NaH2PO4·H2O + K2HPO4, CaCl2·2H2O, and MgSO4·7H2O and “Micro” corresponds to the micronutrients FeSO4·7H2O, ZnSO4·7H2O, Cl2Co·6H2O, Na2MoO4·2H2O, MnSO4·H2O, NiCl2·6H2O, CuSO4·5H2O, and H3BO3. The design layout and the respective specific growth rate, experimental, and predicted results are described in Table 5.
According to the results, the 5th and the 15th experiments offered the highest specific growth rates (0.35 d−1), while the 8th and 12th experiments registered the lowest specific growth rate (0.27 d−1).
The predicted results were obtained from the quadratic Equation (5), given by the model as follows:
S p e c i f i c   g r o w t h   r a t e = 0.198540 + 0.166906 A 0.024934 B + 0.052475 C 0.015188 A × B 0.042049 A × C + 0.007058 B × C 0.028010 A 2 + 0.008854 B 2 0.011739 C 2
The statistical analysis described in Table 6 demonstrates that urea, other macro- and micronutrients, and the interaction between urea and micronutrients were significant factors affecting the culture’s specific growth rate (p < 0.05). Moreover, the model registered a correlation coefficient R2 of 0.969, suggesting that this model was suitable for predicting the responses in this experiment.
Additionally, the interactions between urea, other macronutrients, and the micronutrients and the specific growth rates were revealed by response surface plots (Figure 2).
According to the results, the model predicted the highest specific growth rate using two times the concentration of urea, and half the concentration of other macronutrients and micronutrients.
Herewith, the final composition of the photoautotrophic optimized medium was set as 12 mM of (NH2)2CO; 0.50 mM of NaH2PO4·H2O + K2HPO4; 0.15 mM of CaCl2·2H2O; 0.275 mM of MgSO4·7H2O; 0.015 mM of FeSO4·7H2O; 0.075 mM of ZnSO4·7H2O; 0.001 mM of Cl2Co·6H2O; 0.0025 mM of Na2MoO4·2H2O; 0.0425 mM of MnSO4·H2O; 0.00025 mM of CuSO4·5H2O; 0.05 mM of H3BO3; 0.0005 mM of NiCl2·6H2O, and 1 dose of photoautotrophic vitamins mix (Thiamine-HCl (350 mg·L−1), d-Biotin (50 mg·L−1), cyanocobalamin (B12) (30 mg·L−1). Dose: 0.5 mL·L−1).

3.5. Validation of Photoautotrophic Medium Optimization

Afterwards, C. amblystomatis cultures grown with the company’s photoautotrophic basal medium were compared to those grown with the resultant photoautotrophic optimized medium. The biomass volumetric productivities, specific growth rates, and biomass production are described in Table 7.
Cultures grown with the optimized medium registered a higher specific growth rate (0.35 d−1) compared to those grown with the basal medium (0.23 d−1), offering an improvement of 51.2%. Moreover, 55.8% and 65.8% improvements were registered for global and maximum productivity, respectively. Cultures grown with the optimized medium also achieved a higher maximum biomass concentration (1.91 g·L−1) compared to that obtained with the basal medium, which reached 1.36 g·L−1, enabling an improvement of 40.8%.

3.6. Biochemical Composition

3.6.1. Proximate Composition

The proteins, lipids, carbohydrates, and ashes contents were determined to further characterize the biochemical composition of the biomass resultant from both heterotrophic and photoautotrophic media optimization (Table 8).
Proteins are the main product of several microalgal-based biorefineries [30]. Microalgae proteins are high quality since these micro-organisms can synthesize all the essential amino acids and also have functional biological activities with increased human health benefits [4,31,32]. Furthermore, algal sources of protein are largely used as feed additive in aquaculture [8]. The cultures grown with the optimized media registered the highest protein contents, 61.49–73.45% dry weight (DW) (p < 0.05). Therefore, C. amblystomatis might strengthen the microalgal protein market, which is expected to cover 50% of the total alternative protein market by 2054 [33].
The lowest carbohydrate content was registered in the photoautotrophic cultures (p < 0.05). The cells grown with a heterotrophic-optimized medium contained a much lower content of carbohydrates (14.11% of DW) than those obtained from cultures grown with heterotrophic basal medium (47.68% of DW). In microalgae, the high content of carbohydrates might be stored under unfavorable conditions at the expense of proteins [32,34], which can also explain the low content of protein in the cultures grown with the heterotrophic basal medium.
The cultures grown in heterotrophy registered the lowest lipid content (7.41–8.88% of DW) (p < 0.05). The highest content was achieved in the cultures grown with de basal photoautotrophic medium: 19.74% of DW, which is in concordance with the results reported for this microalga [35]: 18.33% of DW, using the same cultivation medium in a 2.5 m3 closed tubular photobioreactor.
The ash contents were also similar to those reported for this microalga [35] (9.88–15.85% of DW), being the lowest value registered in the cultures grown with the optimized photoautotrophic medium (6.07% of DW) (p < 0.05).

3.6.2. Fatty Acids Profile

In order to evaluate the lipid composition, the fatty acid methyl esters (FAME) profile was analyzed (Table 9). FAME contents below 0.50% of total fatty acids were excluded.
The dominant FAME in the heterotrophic cultures of C. amblystomatis was C16:0 (30.95–32.33% of total fatty acids; TFA), while in the photoautotrophic cultures, it was C18:3n-3 (28.46–34.26% of TFA), which was not detected in the heterotrophic cultures. The second most abundant FAME was C16:4n-3 (14.09–18.635% of TFA), followed by C18:2n-6 (5.38–13.38% of TFA), C18:3n-6 (4.47–10.30% of TFA), C18:1 (1.54–11.46% of TFA), and C16:1 (1.21–9.68% of TFA). The remaining FAME values were similar between the cultures grown in both the hetero- and photoautotrophic conditions.
Furthermore, the prevalent polyunsaturated fatty acids (PUFAs) were more abundant in the photoautotrophic cultures (70.46–72.82% of TFA) compared to the heterotrophically grown cultures (44.47–51.64% of TFA). On the contrary, monosaturated fatty acids (MUFA) displayed higher concentrations in heterotrophic biomass (13.08–21.14% of TFA) compared to the photoautotrophic cultures (3.27–3.31% of TFA; p < 0.05). Lastly, the amount of saturated fatty acids (SFA) was slightly higher in heterotrophic cultures (34.39–35.28% of TFA) in comparison to the photoautotrophic ones (23.87–26.27% of TFA).
The Σn-6/Σn-3 ratio plays an important role in human health, being recommended by the World Health Organization to be lower than 10 to prevent a negative impact on human health since n-6 PUFAs are pro-inflammatory whereas n-3 PUFAs are anti-inflammatory [36,37]. All hetero- and photoautotrophic cultures registered a Σn-6/Σn-3 ratio from 0.2 to 1.37 and more PUFA content in comparison to SFAs (with PUFA/SFA ratio above 1, from 1.29 to 3.06). Thereby, C. amblystomatis might represent an interesting source of PUFAs.

3.6.3. Chlorophylls and Carotenoids Contents

The content of carotenoids and chlorophylls of C. amblystomatis was evaluated (Table 10).
Pigments are high-value products that are synthesized naturally under photoautotrophic conditions. Nevertheless, some pigments can be produced in heterotrophic dark conditions but at lower concentrations [11,38]. Thereby, as expected, the C. amblystomatis cultures grown in heterotrophic conditions registered a decreased content of pigments globally compared to cultures grown in photoautotrophic conditions (p < 0.05), except for β-carotene.
C. amblystomatis registered lower chlorophyll content values than those previously reported (40.24 mg·g−1 in 2.5 m3 tubular photobioreactor) [35]. Under heterotrophic growth, this microalga registered 8.53–14.59 mg·g−1 of chlorophyll a and b, and under photoautotrophy, they registered 12.88–29.32 mg·g−1. Chlorophylls are mainly used as a natural food dye and have several reported human health benefits due to their antioxidant and anti-inflammatory properties [38,39]. Besides chlorophylls, carotenoids are the second most abundant pigment group [11]. The main carotenoids in the C. amblystomatis profile were lutein and β-carotene, with 1.23–1.60 mg·g−1 and 4.32–5.27 mg·g−1 of lutein, and 0.81–4.15 mg·g−1 and 5.37–5.84 mg·g−1 of β-carotene in heterotrophy and photoautotrophy, respectively. Carotenoids are strong antioxidants and have been described to prevent several cardiovascular and neurodegenerative diseases, cancer, diabetes, and macular degeneration [40]. β-carotene plays an important role in human nutrition because it acts as provitamin A, being converted into vitamin A in vivo [41,42]. Vitamin A deficiency represents a global problem in developing countries, and it is related to human visual malfunction and decreased immune function [41,43]. Lutein is among the most important carotenoids in the human diet (as a food colorant) and prevents macular degeneration [43,44]. C. amblystomatis registered high lutein content, similar to the main lutein producers Muriellopsis sp. (4.3 mg·g−1) and Scenedesmus almeriensis (4.5 mg·g−1) [45]. The main application of microalgae as lutein producers is as feed additive in aquaculture [44,45] and poultry livestock.
C. amblystomatis also registered a high content of neoxanthin in the cultures grown with optimized photoautotrophic medium (3.66 mg·g−1). Neoxanthin was reported to significantly reduce the risk of prostate cancer, proving to be one of the strongest carotenoids with antiproliferative effects on human prostate cancer cells [46].
Finally, it is worth mentioning that the global carotenoids market size had already reached USD 1.44 billion in 2019 and is expected to rise to USD 1.84 billion by 2027 [47]. Indeed, higher demand for natural sources of pigments has been observed over the last years, and, therefore, C. amblystomatis presents great pigment content even without any biosynthesis induction, which is promising in the context of these market opportunities.

4. Conclusions

Medium optimization through surface response methodology revealed increments of 44.9–51.2% in Chlorococcum amblystomatis-specific growth rates and 36.6–40.8% in biomass production under heterotrophy and photoautotrophy, respectively. Heterotrophic cultivation registered a 5.5-fold increase in biomass production compared to photoautotrophic cultivation at the laboratory scale, supporting the two-stage approach for further industrial high-quality biomass production with a reduced scale-up time. Moreover, optimizing the cultivation medium towards biomass production has shown significant differences in the biochemical composition of the resultant biomass in comparison to the biomass obtained from the basal media cultivation. The optimized biomass revealed an interesting composition that is rich in protein (61.49–73.45% of dry weight (DW)), registering higher content than those reported for the biomass obtained from the basal media (33.49–56.67% of DW) in heterotrophy and photoautotrophy, respectively, representing an alternative protein source. C. amblystomatis was also demonstrated to be a promising source of polyunsaturated fatty acids (51.64–72.82% of total fatty acids) and might be a natural food colorant due to its high carotenoids content (1.60–5.27 mg·g−1 of DW of lutein and 4.15–5.84 mg·g−1 of DW of β-carotene) in heterotrophic and photoautotrophic optimized biomasses, respectively, being a sustainable alternative as a source of nutrients to address the increasing world food and feed demands.

Supplementary Materials

The following supporting information can be downloaded at: https://www.mdpi.com/article/10.3390/app13042089/s1, Table S1: Calibration curves of pigments standards; Table S2: Experimental layout of the Plackett–Burman design and results of heterotrophic Chlorococcum amblystomatis-specific growth rates (µ).

Author Contributions

Conceptualization, N.C., H.P., J.L.S., L.G., J.V.; methodology, N.C., H.P., P.S.C.S., M.M.C., G.E.S., I.G., M.T., J.L.S., L.G., J.V.; validation, N.C., H.P., P.S.C.S., A.B., H.C., J.L.S., L.G., J.V.; formal analysis, N.C., H.P., P.S.C.S., J.L.S., L.G., J.V.; writing—original draft preparation, N.C., H.P., G.E.S., I.G., M.T., J.L.S., L.G., J.V.; writing—review and editing, N.C., H.P., P.S.C.S., M.M.C., G.E.S., I.G., M.T., A.B., H.C., J.L.S., L.G., J.V.; supervision, J.L.S., L.G., J.V.; funding acquisition, J.L.S., L.G., J.V. All authors have read and agreed to the published version of the manuscript.

Funding

This research was funded by FCT-Foundation for Science and Technology through Ph.D. fellowships 2020.07229.BD, 2020.06814.BD, and 2021.07423.BD, and through projects UIDB/04326/2020, UIDP/04326/2020, and LA/P/0101/2020. This work also received funding under the project AlgaValor, from the European Union’s Horizon 2020 research and innovation program (grant agreement nº POCI-01-0247-FEDER-035234; LISBOA-01-0247-FEDER-035234; ALG-01-0247-FEDER-035234), by the Portuguese national budget P2020 in the scope of the project no. 023310–ALGACO2, and from the European Union’s Horizon 2020 research and innovation program (grant agreement nº ALG-01-0247-FEDER-069961 - Performalgae).

Data Availability Statement

Data is available upon request.

Acknowledgments

The authors would like to acknowledge all members of CCMAR, GreenCoLab, Allmicroalgae, and LNEG for their kind support and help throughout this work, and FCT, AlgaValor, ALGACO2, and Performalgae for the funding.

Conflicts of Interest

The authors declare no conflict of interest.

References

  1. Pulz, O.; Gross, W. Valuable products from biotechnology of microalgae. Appl. Microbiol. Biotechnol. 2004, 65, 635–648. [Google Scholar] [CrossRef]
  2. Hlaing, S.A.A.; Sadiq, M.B.; Anal, A.K. Enhanced yield of Scenedesmus obliquus biomacromolecules through medium optimization and development of microalgae based functional chocolate. J. Food Sci. Technol. 2020, 57, 1090–1099. [Google Scholar] [CrossRef]
  3. Priyadarshani, I.; Rath, B. Commercial and industrial applications of micro algae—A review. J. Algal Biomass Util. 2012, 3, 89–100. [Google Scholar]
  4. Ejike, C.E.; Collins, S.A.; Balasuriya, N.; Swanson, A.K.; Mason, B.; Udenigwe, C.C. Prospects of microalgae proteins in producing peptide-based functional foods for promoting cardiovascular health. Trends Food Sci. Technol. 2017, 59, 30–36. [Google Scholar] [CrossRef]
  5. Caporgno, M.P.; Mathys, A. Trends in Microalgae Incorporation Into Innovative Food Products With Potential Health Benefits. Front. Nutr. 2018, 5, 58. [Google Scholar] [CrossRef] [PubMed]
  6. Rumin, J.; Junior, R.G.D.O.; Bérard, J.-B.; Picot, L. Improving Microalgae Research and Marketing in the European Atlantic Area: Analysis of Major Gaps and Barriers Limiting Sector Development. Mar. Drugs 2021, 19, 319. [Google Scholar] [CrossRef] [PubMed]
  7. de Medeiros, V.P.B.; da Costa, W.K.A.; da Silva, R.T.; Pimentel, T.C.; Magnani, M. Microalgae as source of functional ingredients in new-generation foods: Challenges, technological effects, biological activity, and regulatory issues. Crit. Rev. Food Sci. Nutr. 2021, 62, 4929–4950. [Google Scholar] [CrossRef] [PubMed]
  8. Spolaore, P.; Joannis-Cassan, C.; Duran, E.; Isambert, A. Commercial applications of microalgae. J. Biosci. Bioeng. 2006, 101, 87–96. [Google Scholar] [CrossRef]
  9. Barros, A.; Pereira, H.; Campos, J.; Marques, A.; Varela, J.; Silva, J. Heterotrophy as a tool to overcome the long and costly autotrophic scale-up process for large scale production of microalgae. Sci. Rep. 2019, 9, 13935. [Google Scholar] [CrossRef]
  10. Daneshvar, E.; Ok, Y.S.; Tavakoli, S.; Sarkar, B.; Shaheen, S.M.; Hong, H.; Luo, Y.; Rinklebe, J.; Song, H.; Bhatnagar, A. Insights into upstream processing of microalgae: A review. Bioresour. Technol. 2021, 329, 124870. [Google Scholar] [CrossRef]
  11. Hu, J.; Nagarajan, D.; Zhang, Q.; Chang, J.-S.; Lee, D.-J. Heterotrophic cultivation of microalgae for pigment production: A review. Biotechnol. Adv. 2018, 36, 54–67. [Google Scholar] [CrossRef]
  12. Bumbak, F.; Cook, S.; Zachleder, V.; Hauser, S.; Kovar, K. Best practices in heterotrophic high-cell-density microalgal processes: Achievements, potential and possible limitations. Appl. Microbiol. Biotechnol. 2011, 91, 31–46. [Google Scholar] [CrossRef]
  13. Perez-Garcia, O.; Escalante, F.M.E.; De-Bashan, L.E.; Bashan, Y. Heterotrophic cultures of microalgae: Metabolism and potential products. Water Res. 2011, 45, 11–36. [Google Scholar] [CrossRef] [PubMed]
  14. Chen, G.-Q.; Chen, F. Growing Phototrophic Cells without Light. Biotechnol. Lett. 2006, 28, 607–616. [Google Scholar] [CrossRef] [PubMed]
  15. Ogbonna, J.C.; Masui, H.; Tanaka, H. Sequential heterotrophic/autotrophic cultivation-An efficient method of producing Chlorella biomass for health food and animal feed. J. Appl. Phycol. 1997, 9, 359–366. [Google Scholar] [CrossRef]
  16. Dionisi, H.M.; Lozada, M.; Olivera, N.L. Bioprospection of marine microorganisms: Biotechnological applications and methods. Rev. Argent Microbiol. 2012, 44, 49–60. [Google Scholar] [CrossRef]
  17. Pandey, M.K.; Dasgupta, C.N.; Mishra, S.; Srivastava, M.; Gupta, V.K.; Suseela, M.R.; Ramteke, P.W. Bioprospecting microalgae from natural algal bloom for sustainable biomass and biodiesel production. Appl. Microbiol. Biotechnol. 2019, 103, 5447–5458. [Google Scholar] [CrossRef]
  18. Fábregas, J.; Domínguez, A.; Regueiro, M.; Maseda, A.; Otero, A. Optimization of culture medium for the continuous cultivation of the microalga Haematococcus pluvialis. Appl. Microbiol. Biotechnol. 2000, 53, 530–535. [Google Scholar] [CrossRef]
  19. Mandenius, C.-F.; Brundin, A. Review: Biocatalysts and bioreactor design Bioprocess Optimization Using Design-of-Experiments Methodology. Biotechnol. Prog. 2008, 24, 1191–1203. [Google Scholar] [CrossRef] [PubMed]
  20. Cheng, K.-C.; Demirci, A.; Catchmark, J.M. Enhanced pullulan production in a biofilm reactor by using response surface methodology. J. Ind. Microbiol. Biotechnol. 2010, 37, 587–594. [Google Scholar] [CrossRef]
  21. Sarabia, L.A.; Ortiz, M.C. Response Surface Methodology. Compr. Chemom. 2009, 1, 345–390. [Google Scholar] [CrossRef]
  22. Steinberg, D.M.; Bursztyn, D. Response Surface Methodology in Biotechnology. Qual. Eng. 2010, 22, 78–87. [Google Scholar] [CrossRef]
  23. Chen, J.; Lan, X.; Jia, R.; Hu, L.; Wang, Y. Response Surface Methodology (RSM) Mediated Optimization of Medium Components for Mycelial Growth and Metabolites Production of Streptomyces alfalfae XN-04. Microorganisms 2022, 10, 1854. [Google Scholar] [CrossRef] [PubMed]
  24. Chlorococcum Amblystomatis (F.D.Lambert ex N.Wille) N.Correia, J.Varela & Leonel Pereira: AlgaeBase. Available online: https://www.algaebase.org/search/species/detail/?species_id=175845 (accessed on 16 September 2022).
  25. Bligh, E.G.; Dyer, W.J. A rapid method of total lipid extraction and purification. Can. J. Biochem. Physiol. 1959, 37, 911–917. [Google Scholar] [CrossRef]
  26. Pereira, H.; Barreira, L.; Mozes, A.; Florindo, C.; Polo, C.; Duarte, C.V.; Custódio, L.; Varela, J. Microplate-based high throughput screening procedure for the isolation of lipid-rich marine microalgae. Biotechnol. Biofuels 2011, 4, 61. [Google Scholar] [CrossRef]
  27. Nunez, M.; Quigg, A. Changes in growth and composition of the marine microalgae phaeodactylum tricornutum and nannochloropsis salina in response to changing sodium bicarbonate concentrations. J. Appl. Phycol. 2016, 28, 2123–2138. [Google Scholar] [CrossRef]
  28. Lepage, G.; Roy, C.C. Improved recovery of fatty acid through direct transesterification without prior extraction or purification. J. Lipid Res. 1984, 25, 1391–1396. [Google Scholar] [CrossRef] [PubMed]
  29. Couso, I.; Vila, M.; Vigara, J.; Cordero, B.F.; Vargas, M.; Rodríguez, H.; León, R. Synthesis of carotenoids and regulation of the carotenoid biosynthesis pathway in response to high light stress in the unicellular microalga Chlamydomonas reinhardtii. Eur. J. Phycol. 2012, 47, 223–232. [Google Scholar] [CrossRef]
  30. Chew, K.W.; Yap, J.Y.; Show, P.L.; Suan, N.H.; Juan, J.C.; Ling, T.C.; Lee, D.-J.; Chang, J.-S. Microalgae biorefinery: High value products perspectives. Bioresour. Technol. 2017, 229, 53–62. [Google Scholar] [CrossRef]
  31. Guedes, A.C.; Malcata, F.X. Nutritional Value and Uses of Microalgae in Aquaculture. Aquaculture 2012, 10, 59–78. [Google Scholar] [CrossRef]
  32. Becker, E.W. Micro-algae as a source of protein. Biotechnol. Adv. 2007, 25, 207–210. [Google Scholar] [CrossRef]
  33. Khanra, S.; Mondal, M.; Halder, G.; Tiwari, O.; Gayen, K.; Bhowmick, T.K. Downstream processing of microalgae for pigments, protein and carbohydrate in industrial application: A review. Food Bioprod. Process. 2018, 110, 60–84. [Google Scholar] [CrossRef]
  34. Del Río, E.; García-Gómez, E.; Moreno, J.; Guerrero, M.G.; García-González, M. Microalgae for oil. Assessment of fatty acid productivity in continuous culture by two high-yield strains, Chlorococcum oleofaciens and Pseudokirchneriella subcapitata. Algal Res. 2017, 23, 37–42. [Google Scholar] [CrossRef]
  35. Correia, N.; Pereira, H.; Silva, J.T.; Santos, T.; Soares, M.; Sousa, C.B.; Schüler, L.M.; Costa, M.; Varela, J.; Pereira, L.; et al. Isolation, Identification and Biotechnological Applications of a Novel, Robust, Free-living Chlorococcum (Oophila) amblystomatis Strain Isolated from a Local Pond. Appl. Sci 2020, 10, 3040. [Google Scholar] [CrossRef]
  36. Pereira, H.; Barreira, L.; Figueiredo, F.; Custódio, L.; Vizetto-Duarte, C.; Polo, C.; Rešek, E.; Engelen, A.; Varela, J. Polyunsaturated fatty acids of marine macroalgae: Potential for nutritional and pharmaceutical applications. Mar. Drugs 2012, 10, 1920–1935. [Google Scholar] [CrossRef] [PubMed]
  37. Schmitz, G.; Ecker, J. The opposing effects of n-3 and n-6 fatty acids. Prog. Lipid Res. 2008, 47, 147–155. [Google Scholar] [CrossRef] [PubMed]
  38. Morales-Sánchez, D.; A Martinez-Rodriguez, O.; Martinez, A. Heterotrophic cultivation of microalgae: Production of metabolites of commercial interest. J. Chem. Technol. Biotechnol. 2017, 92, 925–936. [Google Scholar] [CrossRef]
  39. Balder, H.F.; Vogel, J.; Jansen, M.C.; Weijenberg, M.P.; van den Brandt, P.A.; Westenbrink, S.; Van Der Meer, R.; Goldbohm, R.A. Heme and chlorophyll intake and risk of colorectal cancer in the Netherlands cohort study. Cancer Epidemiol. Biomark. Prev. 2006, 15, 717–725. [Google Scholar] [CrossRef]
  40. Paiva, S.A.R.; Russell, R.M. Beta-carotene and other carotenoids as antioxidants. J. Am. Coll. Nutr. 1999, 18, 426–433. [Google Scholar] [CrossRef]
  41. Tang, G.; Russell, R.M. Carotenoids as Provitamin, A. Carotenoids 2009, 5, 149–172. [Google Scholar] [CrossRef]
  42. Chen, B.H.; Chuang, J.R.; Lin, J.H.; Chiu, C.P. Quantification of Provitamin A Compounds in ChInese Vegetables by High-Performance Liquid Chromatography. J. Food Prot. 1993, 56, 51–54. [Google Scholar] [CrossRef] [PubMed]
  43. Mostafa, S.S.M. Microalgal Biotechnology: Prospects and Applications. Plant Sci. 2012, 12, 276–314. [Google Scholar] [CrossRef]
  44. Fernández-Sevilla, J.M.; Fernández, F.A.; Grima, E.M. Biotechnological production of lutein and its applications. Appl. Microbiol. Biotechnol. 2010, 86, 27–40. [Google Scholar] [CrossRef] [PubMed]
  45. Del Campo, J.A.; García-González, M.; Guerrero, M.G. Outdoor cultivation of microalgae for carotenoid production: Current state and perspectives. Appl. Microbiol. Biotechnol. 2007, 74, 1163–1174. [Google Scholar] [CrossRef] [PubMed]
  46. Kotake-Nara, E.; Asai, A.; Nagao, A. Neoxanthin and fucoxanthin induce apoptosis in PC-3 human prostate cancer cells. Cancer Lett. 2005, 220, 75–84. [Google Scholar] [CrossRef] [PubMed]
  47. Market Research Report. Available online: https://www.fortunebusinessinsights.com/industry-reports/carotenoids-market-100180 (accessed on 19 December 2022).
Figure 1. Response surface plots showing the interactions effects of (a) (NH2)2CO and NaH2PO4·H2O + K2HPO4; (b) CuSO4·5H2O and (NH2)2CO, and (c) CuSO4·5H2O and NaH2PO4·H2O + K2HPO4 for the heterotrophic cultures.
Applsci 13 02089 g001
Figure 2. Response surface plots showing the interaction effects of (a) other macronutrients (Macro) and (NH2)2CO; (b) micronutrients (Micro) and (NH2)2CO, and (c) Macro and Micro of the photoautotrophic cultures.
Applsci 13 02089 g002
Table 1. Statistical analysis of Plackett–Burman experiment for specific growth rates of heterotrophic cultures.
FactorLow Level (−)High Level (+)Effectt-Valuep-Value
Nitrogen source(NH2)2CO(NH4)2SO4−0.006−7.330.000
(NH2)2CO
(NH4)2SO4
20.00 mM60.00 mM−0.002−2.240.067
NaH2PO4·H2O + K2HPO4 *10.00 mM100.00 mM−0.005−6.050.001
CaCl2·2H2O1.00 mM5.00 mM0.0000.450.667
MgSO4·7H2O1.00 mM10.00 mM−0.002−2.430.051
FeSO4·7H2O0.05 mM0.50 mM0.0011.690.142
ZnSO4·7H2O0.50 mM2.50 mM0.000−0.080.935
Cl2Co·6H2O0.00 mM0.04 mM0.000−0.520.621
Na2MoO4·2H2O0.00 mM0.10 mM0.000−0.120.905
MnSO4·H2O0.20 mM1.50 mM0.0000.290.778
NiCl2·6H2O0.00 mM0.02 mM0.0011.370.221
CuSO4·5H2O0.00 mM0.02 mM−0.002−2.880.028
H3BO30.50 mM1.50 mM0.000−0.440.673
Vitamins Mix **0.5 dose3 doses0.0000.220.835
Temperature26 °C30 °C0.0000.550.601
Model: R2 = 0.951; Radj2 = 0.827; Rpred2 = 0.597; p-value = 0.010; F-value = 7.70. * Na/K ratio = 3.24. ** Heterotrophic vitamins mix: Thiamine-HCl (1.0 g·L−1), d-Biotin (0.015 g·L−1), cyanocobalamin (B12) (0.012 g·L−1), calcium pantothenate (0.030 g·L−1) and PABA (p-Aminobenzoic acid) (0.060 g·L−1). Dose: 1.50 mL·L−1.
Table 2. Experimental layout of Box–Behnken design; the experimental and predicted results of the specific growth rates (µ) of heterotrophic cultures.
Run Order(NH2)2CO
mM
NaH2PO4·H2O + K2HPO4
mM
CuSO4·5H2O
mM
µ Experimental
h−1
µ Predicted
h−1
160800.0150.0320.033
260450.0050.0460.048
320100.0150.0360.037
440450.0150.0370.036
540100.0250.0370.037
660450.0250.0320.033
720800.0150.0280.029
840450.0150.0390.036
940800.0250.0290.029
1020450.0050.0320.032
1140450.0150.0370.036
1260100.0150.0480.048
1320450.0250.0340.033
1440100.0050.0470.047
1540800.0050.0340.033
Table 3. Statistical analysis of Box–Behnken experiment for specific growth rates of heterotrophic cultures.
SourceSum of SquaresDegree of FreedomMean SquareCoefficient EstimateF-Valuep-Value
Model0.000560.0001 65.25<0.0001
A-(NH2)2CO0.000110.00010.003476.66<0.0001
B-NaH2PO4·H2O + K2HPO40.000310.0003−0.0064186.76<0.0001
C-CuSO4·5H2O0.000110.0001−0.003567.35<0.0001
AB0.000010.0000−0.00108.400.0200
AC0.000110.0001−0.004247.020.0001
BC0.000010.00000.00135.330.0498
Residual0.000080.0000
Lack of Fit0.000060.0000 1.240.5107
Pure Error0.000020.0000
Corr. Total0.000614
Model: R2 = 0.980; Radj2 = 0.965; Rpred2 = 0.937.
Table 4. Maximum and global volumetric productivities (g·L−1·h−1), specific growth rates (h−1), and biomass production (g·L−1) of heterotrophic cultures grown using the company’s basal medium and optimized medium. Different letters indicate significant differences between media. Values are given as means ± standard deviation (n = 3).
Volumetric Productivity
g·L−1·h−1
Specific Growth Rate
h−1
Biomass Production
g·L−1
GlobalMaximum
Basal medium0.12 ± 0.01 b0.29 ± 0.02 b0.03 ± 0.00 b7.71 ± 0.62 b
Optimized medium0.19 ± 0.01 a0.60 ± 0.06 a0.05 ± 0.00 a10.53 ± 0.59 a
% of increment67.4109.744.936.6
Table 5. Experimental layout of the Box–Behnken design and the results of the experimental and predicted specific growth rates (µ) of the photoautotrophic cultures.
Run Order[Urea]
Times
[Other Macro]
Times
[Micro]
Times
µ Experimental
d−1
µ Predicted
d−1
11.250.502.000.300.30
22.000.501.250.340.34
30.501.252.000.290.28
41.251.251.250.310.31
51.250.500.500.350.34
61.251.251.250.310.31
71.252.002.000.290.29
80.501.250.500.270.27
90.500.501.250.280.29
101.251.251.250.320.31
111.252.000.500.310.32
122.001.252.000.270.27
130.502.001.250.280.28
142.002.001.250.310.30
152.001.250.500.350.35
Table 6. Statistical analysis of Box–Behnken experiment for specific growth rates of photoautotrophic cultures.
SourceSum of SquaresDegrees of FreedomMean SquareCoefficient EstimateF-Valuep-Value
Model0.009390.0010 17.070.0030
A-Urea0.002910.00290.019047.530.0010
B-Other Macronutrients0.000810.0008−0.009712.440.0168
C-Micronutrients0.001910.0019−0.015531.460.0025
AB0.000310.0003−0.00854.800.0799
AC0.002210.0022−0.023736.820.0018
BC0.000110.00010.00401.040.3552
A20.000910.0009−0.015815.080.0116
B20.000110.00010.00501.510.2743
C20.000210.0002−0.00662.650.1645
Residual0.000350.0001
Lack of Fit0.000130.0000 0.390.7775
Pure Error0.000220.0001
Corr. Total0.009614
Model: R2 = 0.969; Radj2 = 0.912; Rpred2 = 0.770.
Table 7. Maximum and overall volumetric productivity (g·L−1·d−1), specific growth rate (d−1), and biomass production (g·L−1) of the photoautotrophic cultures grown with the company’s basal medium and optimized medium in 1 L bubble columns. Different letters indicate significant differences between media. Values are given as mean ± standard deviation (n = 3).
Volumetric Productivity
g·L−1·d−1
Specific Growth Rate
d−1
Biomass Production
g·L−1
GlobalMaximum
Basal medium0.12 ± 0.00 b0.17 ± 0.01b0.23 ± 0.01 b1.36 ± 0.02 b
Optimized medium0.19 ± 0.01a0.27 ± 0.02 a0.35 ± 0.01 a1.91 ± 0.06 a
% of increment55.865.851.240.8
Table 8. Proximate composition of biomass with hetero- and photoautotrophic basal and optimized media. Proteins, lipids, carbohydrates, and ashes are presented as the percentage of the biomass dry weight. Different letters indicate significant differences between media. Values are given as means ± standard deviation (n = 3).
MediumProteins (%)Lipids (%)Carbohydrates (%)Ashes (%)
Hetero.Basal33.49 ± 0.38 d7.41 ± 1.89 c47.68 ± 2.19 a11.42 ± 0.07 c
Optimized61.49 ± 0.13 b8.88 ± 0.70 c14.11 ± 0.58 b15.52 ± 0.24 b
Photoauto.Basal56.67 ± 1.06 c19.74 ± 1.07 a4.26 ± 0.47 c19.39 ± 1.53 a
Optimized73.45 ± 1.91 a13.28 ± 0.45 b8.23 ± 0.02 c6.07 ± 0.07 d
Table 9. Fatty acid methyl esters (FAME) profile; presented in percentage of total fatty acids of Chlorococcum amblystomatis biomass grown with hetero- and photoautotrophic basal and optimized media. Different letters indicate significant differences between media. Values are given as mean ± standard deviation (n = 3).
FAME
%
HeterotrophyPhotoautotrophy
BasalOptimizedBasalOptimized
C14:00.88 ± 0.05 a0.66 ± 0.03 b0.66 ± 0.00 bnd
C16:4n-314.09 ± 0.14 b18.63 ± 1.509 a15.07 ± 0.40 b14.88 ± 0.12 b
C16:3n-3nd1.10 ± 0.38 a1.31 ± 0.07 a1.14 ± 0.03 a
C16:2n-62.38 ± 0.08 b1.68 ± 0.03 c1.23 ± 0.10 d3.12 ± 0.23 a
C16:19.68 ± 0.33 a5.50 ± 0.33 b1.21 ± 0.19 c1.77 ± 0.94 c
C16:030.95 ± 0.38 a32.33 ± 1.51 a23.25 ± 0.16 b22.35 ± 0.76 b
C17:35.07 ± 0.22 a4.32 ± 0.20 b2.71 ± 0.10 c3.06 ± 0.18 c
C18:4n-32.56 ± 0.03 d5.03 ± 0.15 b6.03 ± 0.35 a3.49 ± 0.29 c
C18:3n-3ndnd34.26 ± 0.20 a28.46 ± 0.38 b
C18:3n-68.10 ± 0.11 b10.30 ± 0.09 a4.47 ± 0.04 d5.27 ± 0.06 c
C18:2n-612.26 ± 0.62 a,b10.59 ± 0.56 b5.38 ± 0.19 c13.38 ± 0.79 a
C18:111.46 ± 0.06 a7.58 ± 3.71 a,b2.05 ± 0.02 b,c1.54 ± 0.05 c
C18:02.55 ± 0.53 a2.29 ± 0.14 a,b2.03 ± 0.11 a,b1.52 ± 0.19 b
Σ SFA34.39 ± 0.29 a35.28 ± 1.67 a26.27 ± 0.48 b23.87 ± 0.94 b
Σ MUFA21.14 ± 0.37 a13.08 ± 4.01 a3.27 ± 0.20 b3.31 ± 0.89 b
Σ PUFA44.47 ± 0.57 c51.64 ± 2.37 b70.46 ± 0.63 a72.82 ± 0.07 a
Σ n-316.66 ± 0.15 d24.76 ± 2.02 c56.68 ± 0.38 a47.26 ± 0.62 b
Σ n-622.74 ± 0.75 a22.57 ± 0.55 a11.07 ± 0.29 b21.78 ± 0.56 a
Σn-6/Σn-31.37 ± 0.06 a0.92 ± 0.05 b0.20 ± 0.00 d0.45 ± 0.02 c
PUFA/SFA1.29 ± 0.03 c1.46 ± 0.02 c2.68 ± 0.07 b3.06 ± 0.12 a
nd: not detected.
Table 10. Pigment profile in mg·g−1 of Chlorococcum amblystomatis biomass grown with hetero- and photoautotrophic basal and optimized heterotrophic media. Different letters indicate significant differences between media. Values are given as mean ± standard deviation (n = 3).
Pigments (mg·g−1)HeterotrophyPhotoautotrophy
Basal Optimized Basal Optimized
Neoxanthin0.52 ± 0.05 c0.79 ± 0.06 c1.46 ± 0.12 b3.66 ± 0.33 a
Violaxanthin0.02 ± 0.00 c0.06 ± 0.01 c0.51 ± 0.03 b0.75 ± 0.06 a
Lutein1.23 ± 0.10 c1.60 ± 0.11 c4.32 ± 0.15 b5.27 ± 0.37 a
β-carotene0.81 ± 0.16 b4.15 ± 0.22 a5.37 ± 0.44 a5.84 ± 0.98 a
Chlorophyll a and b8.53 ± 0.35 c14.59 ± 0.74 b12.88 ± 0.61 b29.32 ± 0.39 a
Disclaimer/Publisher’s Note: The statements, opinions and data contained in all publications are solely those of the individual author(s) and contributor(s) and not of MDPI and/or the editor(s). MDPI and/or the editor(s) disclaim responsibility for any injury to people or property resulting from any ideas, methods, instructions or products referred to in the content.

