
Supply Chain Management Maturity and Business Performance: The Balanced Scorecard Perspective


Abstract
1. Introduction
2. Models of Supply Chain Management Maturity
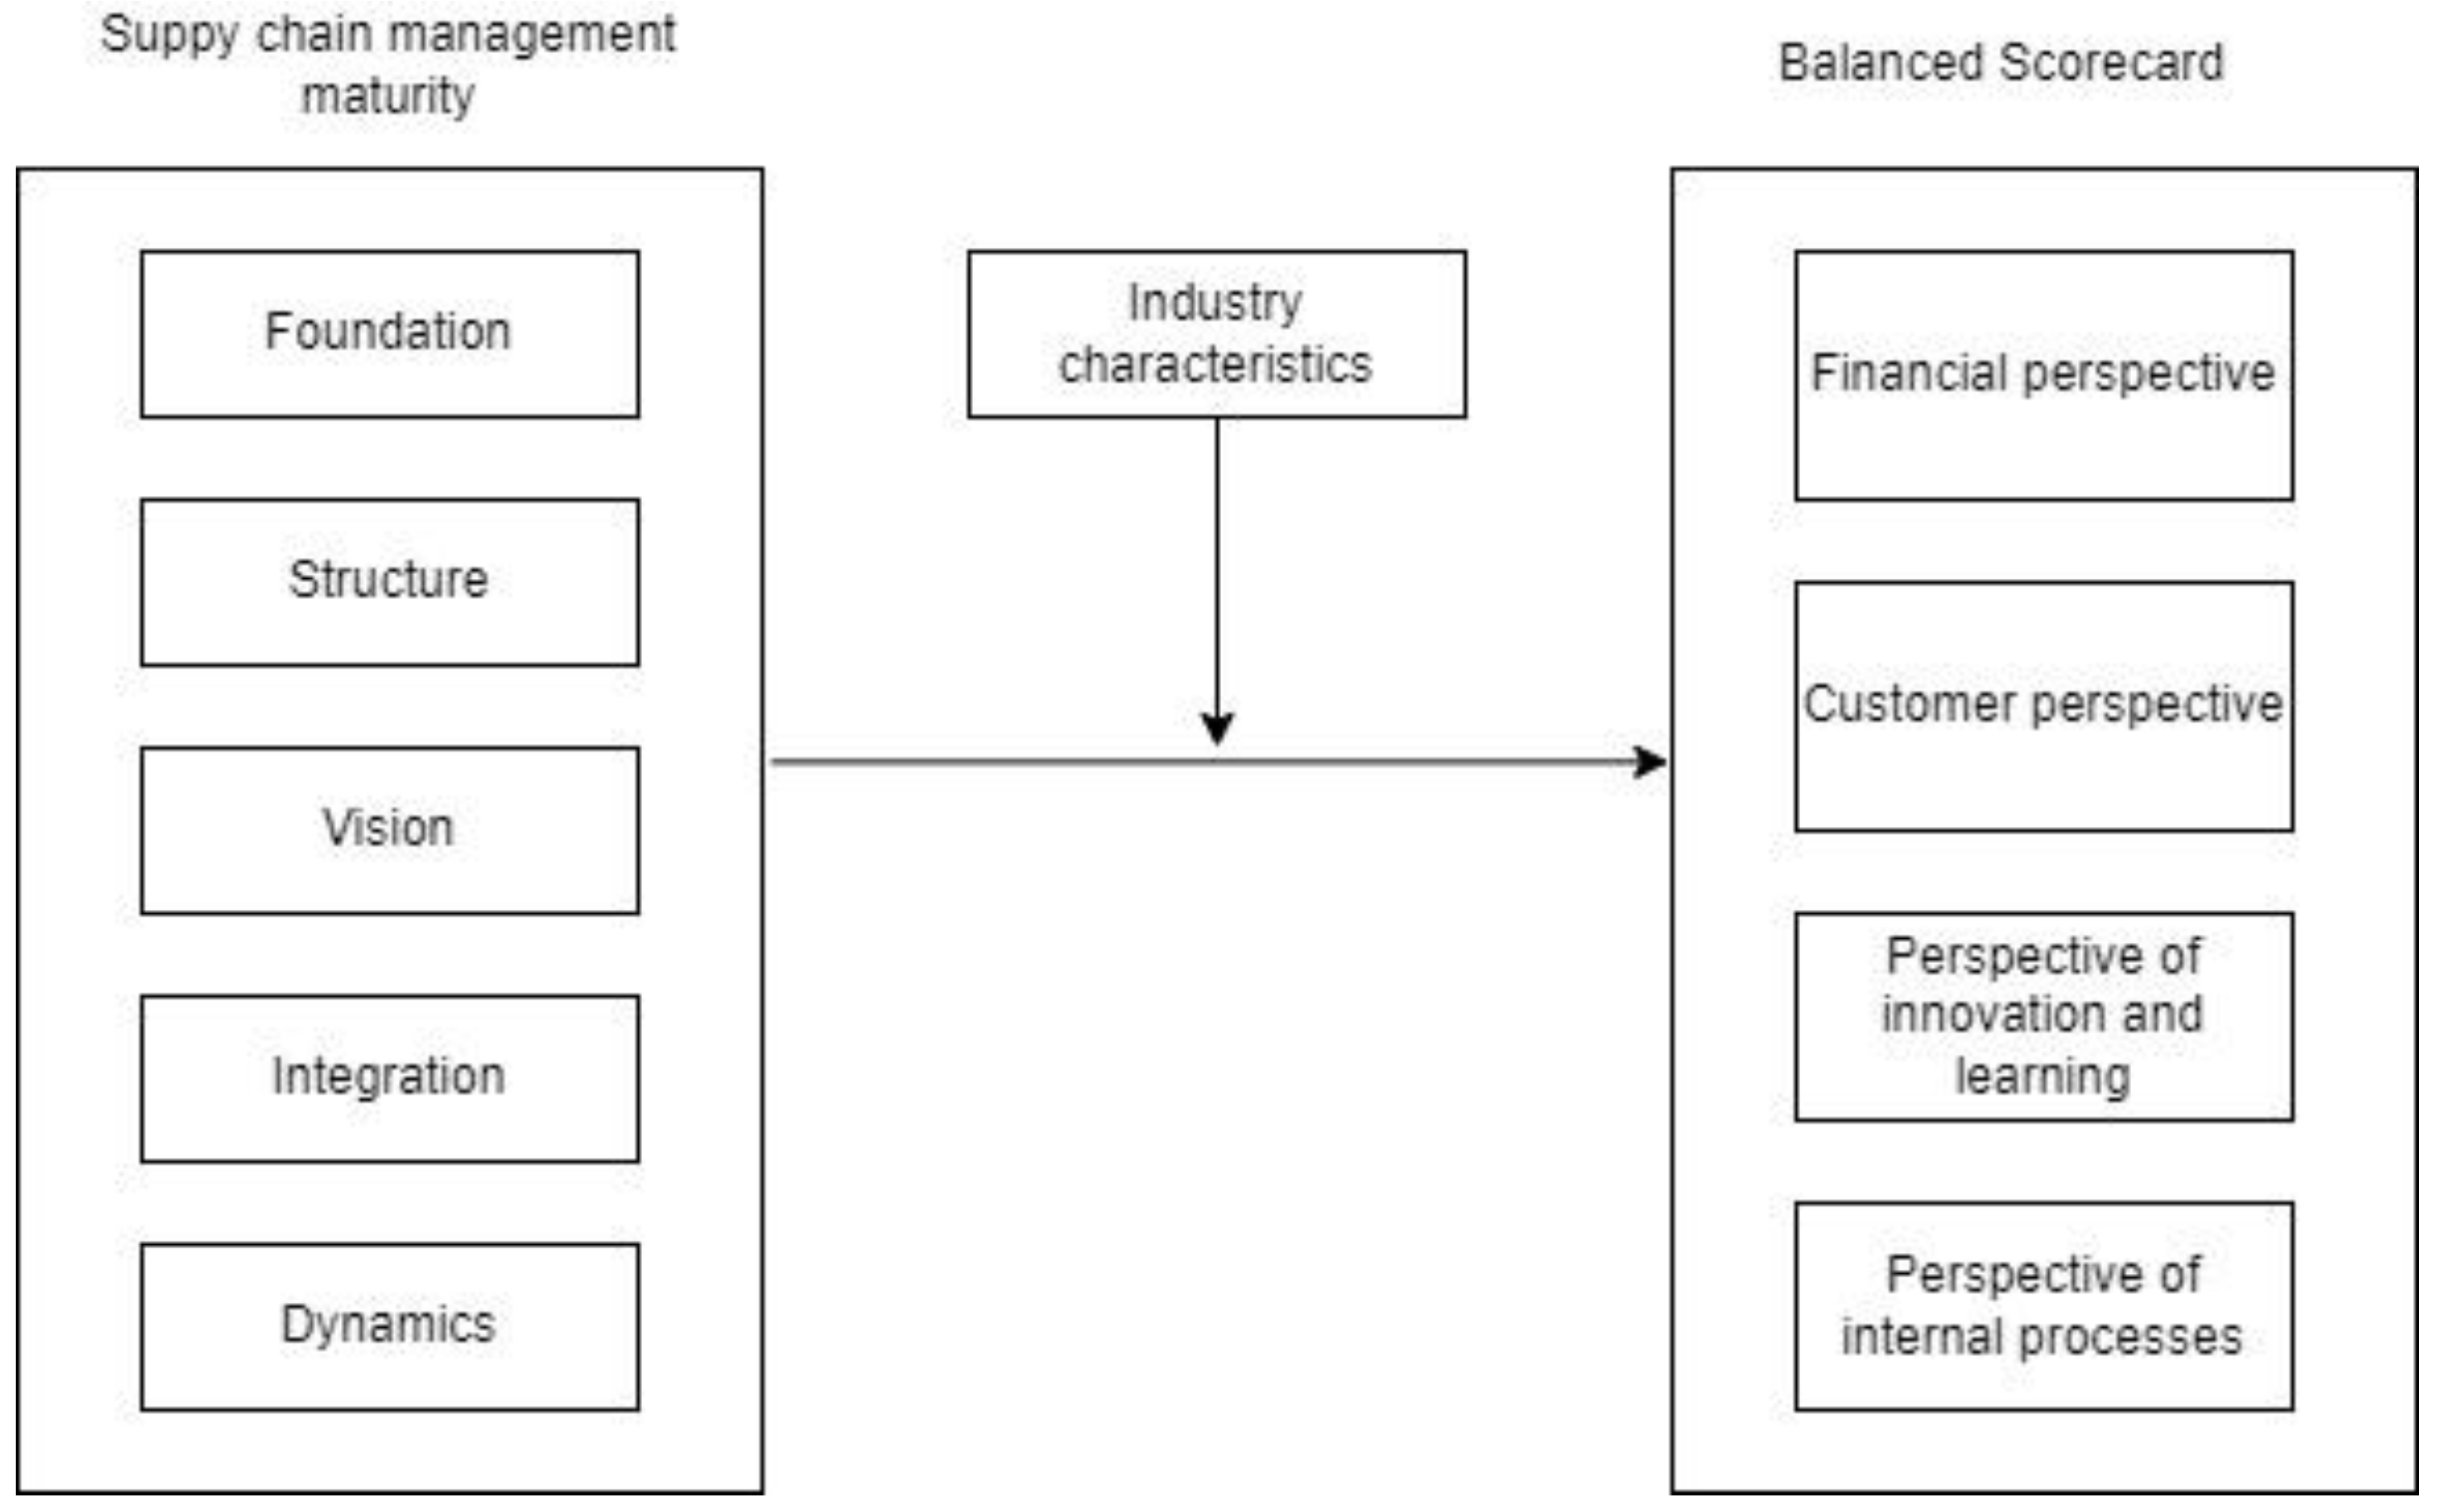
3. Supply Chain Management Maturity and Balanced Scorecard Perspective: Hypothesis Development
3.1. Relationship between Supply Chain Maturity and Business Performance from the Financial Perspective of the Balanced Scorecard Framework
3.2. Relationship between Supply Chain Maturity and Business Performance from the Customer Perspective of the Balanced Scorecard Framework
3.3. Relationship between Supply Chain Maturity and Business Performance from the Perspective of Innovation and Learning of the Balanced Scorecard Framework
3.4. Relationship between Supply Chain Maturity and Business Performance from the Perspective of Internal Processes of the Balanced Scorecard Framework
3.5. Moderating Effects of Industry Characteristics on the Strength of the Relationship between Supply Chain Management Maturity and Business Performance of the Balanced Scorecard Framework
4. Methodology
5. Results
5.1. Partial-Least-Squares Structural Equation Modelling
5.2. Convergent Validity Testing
5.3. Discriminant Validity Testing
5.4. PLS-SEM Model for Testing Hypothesis H1–H4
5.5. Moderating Role of Industry Characteristics for Testing Hypothesis H5–H6
6. Discussion
7. Conclusions
Author Contributions
Funding
Institutional Review Board Statement
Informed Consent Statement
Data Availability Statement
Conflicts of Interest
References
- Lockamy, A.; McCormack, K. The development of a supply chain management process maturity model using the concepts of business process orientation. Supply Chain Manag. Int. J. 2004, 9, 272–278. [Google Scholar] [CrossRef]
- McCormack, K.; Ladeira, M.B.; de Oliveira, M.P.V. Supply chain maturity and performance in Brazil. Supply Chain. Manag. Int. J. 2008, 13, 272–282. [Google Scholar] [CrossRef]
- Guzmán, G.M.; Serna, M.D.C.M.; Ramírez, R.G. The relationship between supply chain management and competitiveness in the manufacturing SMEs of Aguascalientes. Merc. Neg. 2015, 16, 67–88. [Google Scholar]
- Monczka, R.M.; Handfield, R.B.; Giunipero, L.C.; Patterson, J.L. Purchasing and Supply Chain Management; South-Western Cengage Learning: Mason, OH, USA, 2009. [Google Scholar]
- Roblek, V.; Thorpe, O.; Pejić Bach, M.; Jerman, A.; Meško, M. The Fourth Industrial Revolution and the Sustainability Practices: A Comparative Automated Content Analysis Approach of Theory and Practice. Sustainability 2020, 12, 8497. [Google Scholar] [CrossRef]
- Knežević, B.; Škrobot, P.; Žmuk, B. Position and role of social supermarkets in food supply chains. Bus. Syst. Res. Int. J. Soc. Adv. Innov. Res. Econ. 2021, 12, 179–196. [Google Scholar] [CrossRef]
- Kopanaki, E.; Stroumpoulis, A.; Oikonomou, M. The Impact of Blockchain Technology on Food Waste Management in the Hospitality Industry. ENTRENOVA—Enterp. Res. Innov. 2021, 7, 428–437. [Google Scholar] [CrossRef]
- Chen, F.H.; Tsai, Y.-T.; Oen, W.A. Configurations of green human resource management practices on supply chain integration. Int. J. Eng. Bus. Manag. 2022, 14, 18479790221146443. [Google Scholar] [CrossRef]
- Netland, T.H.; Alfnes, E.; Fauske, H. How mature is your supply chain?—A supply chain maturity assessment test. In Proceedings of the 14th International EurOMA Conference Managing Operations in an Expanding Europe, Ankara, Turkey, 17–20 June 2007; pp. 17–20. [Google Scholar]
- Chang, H.H.; Hung, C.-J.; Wong, K.H.; Lee, C.-H. Using the balanced scorecard on supply chain integration performance—A case study of service businesses. Serv. Bus. 2013, 7, 539–561. [Google Scholar] [CrossRef]
- Söderberg, L.; Bengtsson, L. Supply chain management maturity and performance in SMEs. Oper. Manag. Res. 2010, 3, 90–97. [Google Scholar] [CrossRef]
- Frederico, G. Supply Chain Management Maturity: A Comprehensive Framework Proposal from Literature Review and Case Studies. Int. Bus. Res. 2017, 10, 68. [Google Scholar] [CrossRef]
- Akyuz, A.G.; Erkan, E.T. Supply chain performance measurement: A literature review. Int. J. Prod. Res. 2010, 48, 5137–5155. [Google Scholar] [CrossRef]
- De Sousa, T.B.; Melo, I.C.; De Oliveira, P.H.; Lourenço, C.M.; Guerrini, F.M.; Esposto, K. Balanced Scorecard for evaluating the performance of supply chains: A bibliometric study. J. Eng. Res. 2020, 8. [Google Scholar] [CrossRef]
- Bhagwat, R.; Sharma, M.K. Performance measurement of supply chain management: A balanced scorecard approach. Comput. Ind. Eng. 2007, 53, 43–62. [Google Scholar] [CrossRef]
- Suša Vugec, D.; Bosilj Vukšić, V.; Pejić Bach, M.; Jaklič, J.; Indihar Štemberger, M. Business intelligence and organizational performance: The role of alignment with business process management. Bus. Process Manag. J. 2020, 26, 1709–1730. [Google Scholar] [CrossRef]
- Radosavljević, M. Process Orientation as a Basis for increasing supply chain Management Maturity. Econ. Themes 2015, 53, 398–414. [Google Scholar] [CrossRef]
- Fraser, P.; Moultrie, J.; Gregory, M. The Use of Maturity Models/Grids as a Tool in Assessing Product Development Capability. In Proceedings of the IEEE International Engineering Management Conference 2002, Cambridge, UK, 18–20 August 2002; Volume 1, pp. 244–249. [Google Scholar]
- Vaidyanathan, K.; Howell, G. Construction supply chain maturity model—Conceptual framework. In Proceedings of the IGLC-15, East Lansing, MI, USA, 18–20 July 2007; pp. 170–180. [Google Scholar]
- Zhou, H.; Benton, W.C., Jr.; Schilling, D.A.; Milligan, G.W. Supply chain integration and the SCOR model. J. Bus. Logist. 2011, 32, 332–344. [Google Scholar] [CrossRef]
- Lockamy, A.; McCormack, K. Linking SCOR planning practices to supply chain performance: An exploratory study. Int. J. Oper. Prod. Manag. 2004, 24, 1192–1218. [Google Scholar] [CrossRef]
- De Oliveira, M.P.V.; Ladeira, M.B.; McCormack, K.P. The supply chain process management maturity model–SCPM3. In Supply Chain Management—Pathways for Research and Practice; Önkal, D., Aktas, E., Eds.; Tech: Rijeka, Croatia, 2011; pp. 201–218. [Google Scholar]
- Ellinger, A.; Shin, H.; Northington, W.M.; Adams, F.G.; Hofman, D.; O’Marah, K. The influence of supply chain management competency on customer satisfaction and shareholder value. Supply Chain Manag. Int. J. 2012, 17, 249–262. [Google Scholar] [CrossRef]
- Liu, W.; Wei, W.; Si, C.; Xie, D.; Chen, L. Effect of supply chain strategic collaboration announcements on shareholder value: An empirical investigation from China. Int. J. Oper. Prod. Manag. 2020, 40, 389–414. [Google Scholar] [CrossRef]
- Frederico, G.F.; Garza-Reyes, J.A.; Kumar, A.; Kumar, V. Performance measurement for supply chains in the Industry 4.0 era: A balanced scorecard approach. Int. J. Product. Perform. Manag. 2021, 70, 789–807. [Google Scholar] [CrossRef]
- Souza, R.P.; Guerreiro, R.; Oliveira, M.P.V. Relationship between the maturity of supply chain process management and the organizational life cycle. Bus. Process Manag. J. 2015, 21, 466–481. [Google Scholar] [CrossRef]
- Wang, Z.; Sarkis, J. Investigating the relationship of sustainable supply chain management with corporate financial performance. Int. J. Prod. Perform. Manag. 2013, 62, 871–888. [Google Scholar] [CrossRef]
- Kim, J.; Rhee, J. An empirical study on the impact of critical success factors on the balanced scorecard performance in Korean green supply chain management enterprises. Int. J. Prod. Res. 2012, 50, 2465–2483. [Google Scholar] [CrossRef]
- Geng, R.; Mansouri, S.A.; Aktas, E. The relationship between green supply chain management and performance: A meta-analysis of empirical evidences in Asian emerging economies. Int. J. Prod. Econ. 2017, 183, 245–258. [Google Scholar] [CrossRef]
- Feng, M.; Yu, W.; Wang, X.; Wong, C.Y.; Xu, M.; Xiao, Z. Green supply chain management and financial performance: The mediating roles of operational and environmental performance. Bus. Strat. Environ. 2018, 27, 811–824. [Google Scholar] [CrossRef]
- Chavez, R.; Yu, W.; Feng, M.; Wiengarten, F. The Effect of Customer-Centric Green Supply Chain Management on Operational Performance and Customer Satisfaction. Bus. Strat. Environ. 2016, 25, 205–220. [Google Scholar] [CrossRef]
- Gandhi, A.V.; Shaikh, A.; Sheorey, P.A. Impact of supply chain management practices on firm performance: Empirical evidence from a developing country. Int. J. Retail. Distrib. Manag. 2017, 45, 366–384. [Google Scholar] [CrossRef]
- Goel, R.K.; Saunoris, J.W.; Goel, S.S. Supply chain performance and economic growth: The impact of COVID-19 disruptions. J. Policy Model. 2021, 43, 298–316. [Google Scholar] [CrossRef]
- Qrunfleh, S.; Tarafdar, M. Supply chain information systems strategy: Impacts on supply chain performance and firm performance. Int. J. Prod. Econ. 2014, 147, 340–350. [Google Scholar] [CrossRef]
- Wong, W.P.; Wong, K.Y. Supply chain management, knowledge management capability, and their linkages towards firm performance. Bus. Process. Manag. J. 2011, 17, 940–964. [Google Scholar] [CrossRef]
- Kordestani, A.; Bengtsson, L.; Farhat, F.; Peighambari, K. Supply chain process maturity and financial performance study of Swedish steel SMEs. International Annual EurOMA Conference. 2010. Available online: https://www.diva-portal.org/smash/get/diva2:1012084/FULLTEXT01.pdf (accessed on 21 January 2022).
- Wagner, S.M.; Grosse-Ruyken, P.T.; Erhun, F. The link between supply chain fit and financial performance of the firm. J. Oper. Manag. 2012, 30, 340–353. [Google Scholar] [CrossRef]
- Rao, P.; Holt, D. Do green supply chains lead to competitiveness and economic performance? Int. J. Oper. Prod. Manag. 2005, 25, 898–916. [Google Scholar] [CrossRef]
- Pakurár, M.; Haddad, H.; Popp, J.; Khan, T.; Oláh, J. Supply chain integration, organizational performance and balanced scorecard: An empirical study of the banking sector in Jordan. J. Int. Stud. 2019, 12, 129–146. [Google Scholar] [CrossRef]
- Koufteros, X.A.; Vonderembse, M.A.; Doll, W.J. Competitive capabilities: Measurement and relationships. Proc. Decis. Sci. Inst. 1997, 3, 1067–1068. [Google Scholar]
- Huo, B.; Qi, Y.; Wang, Z.; Zhao, X. The impact of supply chain integration on firm performance: The moderating role of competitive strategy. Supply Chain. Manag. Int. J. 2014, 19, 369–384. [Google Scholar] [CrossRef]
- Christensen, W.J.; Germain, R.N.; Birou, L. Variance vs. average: Supply chain lead-time as a predictor of financial performance. Supply Chain. Manag. Int. J. 2007, 12, 349–357. [Google Scholar] [CrossRef]
- Trisnawati, N.; Pujawan, I.N. Analysis of supply chain performance based on the supply chain management maturity level in manufacturing industry. In Proceedings of the International Conference on Industrial Engineering and Operations Management, Sao Paulo, Brazil, 5–8 April 2021; Available online: http://www.ieomsociety.org/brazil2020/papers/691.pdf (accessed on 20 January 2022).
- Schiele, H. Supply-management maturity, cost savings and purchasing absorptive capacity: Testing the procurement–performance link. J. Purch. Supply Manag. 2007, 13, 274–293. [Google Scholar] [CrossRef]
- Zubairu, N.; Dinwoodie, J.; Govindan, K.; Hunter, L.; Roh, S. Supply chain strategies as drivers of financial performance in liquefied natural gas networks. Supply Chain Manag. Int. J. 2021, 26, 579–591. [Google Scholar] [CrossRef]
- Seuring, S.; Müller, M. From a literature review to a conceptual framework for sustainable supply chain management. J. Clean. Prod. 2008, 16, 1699–1710. [Google Scholar] [CrossRef]
- Hugos, M.H. Essentials of Supply Chain Management; John Wiley & Sons: Hoboken, NJ, USA, 2018. [Google Scholar]
- Adebiyi, S.O.; Adediran, A.S.; Shodiya, A.O.; Olusola, T. Supply Chain Management Practices and Manufacturing Firms Performance: Professionals’ Experience in Nigeria. Econ. Cult. 2021, 18, 28–40. [Google Scholar] [CrossRef]
- Shukla, R.K.; Garg, D.; Agarwal, A. Supply chain coordination competency and firm performance: An empirical study. Int. J. Supply Chain. Manag. 2013, 2, 64–70. [Google Scholar]
- Zhu, Q.; Krikke, H.; Caniëls, M.C. Supply chain integration: Value creation through managing inter-organizational learning. Int. J. Oper. Prod. Manag. 2018, 38, 211–229. [Google Scholar] [CrossRef]
- Afshan, N. The Performance Outcomes of Dimensions of Supply Chain Integration: A Conceptual Framework. Verslas Teor. Prakt. 2013, 14, 323–331. [Google Scholar] [CrossRef]
- Auramo, J.; Kauremaa, J.; Tanskanen, K. Benefits of IT in supply chain management: An explorative study of progressive companies. Int. J. Phys. Distrib. Logist. Manag. 2005, 35, 82–100. [Google Scholar] [CrossRef]
- Asamoah, D.; Nuertey, D.; Agyei-Owusu, B.; Akyeh, J. The effect of supply chain responsiveness on customer development. Int. J. Logist. Manag. 2021, 32, 1190–1213. [Google Scholar] [CrossRef]
- Haque, M.; Islam, R. Impact of supply chain collaboration and knowledge sharing onorganisational outcomes in pharmaceutical industry of Bangladesh. J. Glob. Oper. Strateg. Sourc. 2018, 11, 301–320. [Google Scholar]
- Laari, S.; Töyli, J.; Solakivi, T.; Ojala, L. Firm performance and customer-driven green supply chain management. J. Clean. Prod. 2016, 112, 1960–1970. [Google Scholar] [CrossRef]
- Lai, K.-H.; Wong, C.W.Y. Green logistics management and performance: Some empirical evidence from Chinese manufacturing exporters. Omega 2012, 40, 267–282. [Google Scholar] [CrossRef]
- Vachon, S.; Klassen, R.D. Environmental management and manufacturing performance: The role of collaboration in the supply chain. Int. J. Prod. Econ. 2008, 111, 295–308. [Google Scholar] [CrossRef]
- Solaimani, S.; Bounwman, H. A framework for the alignment of business model and business processes: A generic model for trans-sector innovation. Bus. Process Manag. J. 2012, 18, 655–679. [Google Scholar] [CrossRef]
- Kim, B. Coordinating an innovation in supply chain management. Eur. J. Oper. Res. 2000, 123, 568–584. [Google Scholar] [CrossRef]
- Li, S.; Ragu-Nathan, B.; Ragu-Nathan, T.S.; Rao, S.S. The impact of supply chain management practices on competitive advantage andorganisational performance. Omega 2006, 34, 107–124. [Google Scholar] [CrossRef]
- Yang, J.; Han, Q.; Zhou, J.; Yuan, C. The Influence of Environmental Management Practices and Supply Chain Integration on Technological Innovation Performance—Evidence from China’s Manufacturing Industry. Sustainability 2015, 7, 15342–15361. [Google Scholar] [CrossRef]
- Hong, J.; Liao, Y.; Zhang, Y.; Yu, Z. The effect of supply chain quality management practices and capabilities on operational and innovation performance: Evidence from Chinese manufacturers. Int. J. Prod. Econ. 2019, 212, 227–235. [Google Scholar] [CrossRef]
- Foli, S.; Durst, S.; Temel, S. The link between supply chain risk management and innovation performance in SMEs in turbulent times. J. Entrep. Emerg. Econ. 2022; ahead-of-print. [Google Scholar] [CrossRef]
- Wu, L.; Chuang, C.H. Examining the diffusion of electronic supply chain management with external antecedents and firm performance: A multi-stage analysis. Decis. Support Syst. 2010, 50, 103–115. [Google Scholar] [CrossRef]
- Cheng, J.H.; Yeh, C.H.; Tu, C.W. Trust and knowledge sharing in green supply chains. Supply Chain. Manag. Int. J. 2008, 13, 283–295. [Google Scholar] [CrossRef]
- Hernández-Espallardo, M.; Rodríguez-Orejuela, A.; Sánchez-Pérez, M. Inter-organisational governance, learning and performance in supply chains. Supply Chain. Manag. Int. J. 2010, 15, 101–114. [Google Scholar] [CrossRef]
- Haq, M.Z.U. Supply chain learning andorganisational performance: Evidence from Chinese manufacturing firms. J. Knowl. Manag. 2021, 25, 943–972. [Google Scholar] [CrossRef]
- Kazemkhanlou, H.; Ahadi, H.R. Study of performance measurement practices in supply chain management. In Proceedings of the the 2014 International Conference on Industrial Engineering and Operations Management, Bali, Indonesia, 7–9 January 2014; Available online: http://ieomsociety.org/ieom2014/pdfs/64.pdf (accessed on 20 January 2022).
- Germain, R.; Iyer, K.N.S. The interaction of internal and downstream integration and its association with performance. J. Bus. Logist. 2006, 27, 29–52. [Google Scholar] [CrossRef]
- Kankaew, K.; Yapanto, L.M.; Waramontri, R.; Arief, S.; Hamsir, H.; Sastrawati, N.; Espinoza-Maguiña, M.R. Supply chain management and logistic presentation: Mediation effect of competitive advantage. Uncertain Supply Chain Manag. 2021, 9, 255–264. [Google Scholar] [CrossRef]
- Stank, T.P.; Keller, S.B.; Daugherty, P.J. Supply chain collaboration and logistical service performance. J. Bus. Logist. 2001, 22, 29–48. [Google Scholar] [CrossRef]
- Lee, S.M.; Sung Rha, J.; Choi, D.; Noh, Y. Pressures affecting green supply chain performance. Manag. Decis. 2013, 51, 1753–1768. [Google Scholar] [CrossRef]
- Siagian, H.; Tarigan, Z.; Jie, F. Supply Chain Integration Enables Resilience, Flexibility, and Innovation to Improve Business Performance in COVID-19 Era. Sustainability 2021, 13, 4669. [Google Scholar] [CrossRef]
- Karabag, S.F.; Berggren, C. Antecedents of firm performance in emerging economies: Business groups, strategy, industry structure, and state support. J. Bus. Res. 2014, 67, 2212–2223. [Google Scholar] [CrossRef]
- Huo, B.; Zhao, X.; Zhou, H. The Effects of Competitive Environment on Supply Chain Information Sharing and Performance: An Empirical Study in China. Prod. Oper. Manag. 2014, 23, 552–569. [Google Scholar] [CrossRef]
- Narasimhan, R.; Kim, S.W. Effect of supply chain integration on the relationship between diversification and performance: Evidence from Japanese and Korean firms. J. Oper. Manag. 2002, 20, 303–323. [Google Scholar] [CrossRef]
- Shan, H.; Li, Y.; Shi, J. Influence of Supply Chain Collaborative Innovation on Sustainable Development of Supply Chain: A Study on Chinese Enterprises. Sustainability 2020, 12, 2978. [Google Scholar] [CrossRef]
- Attaran, M. Digital technology enablers and their implications for supply chain management. Supply Chain Forum Int. J. 2020, 21, 158–172. [Google Scholar] [CrossRef]
- Basheer, M.F.; Siam, M.R.A.; Awn, A.M.; Hussan, S.G. Exploring the role of TQM and supply chain practices for firm supply performance in the presence of information technology capabilities and supply chain technology adoption: A case of textile firms in Pakistan. Uncertain Supply Chain Manag. 2019, 7, 275–288. [Google Scholar] [CrossRef]
- Kuei, C.; Madu, C.N.; Lin, C.; Chow, W.S. Developing supply chain strategies based on the survey of supply chain quality and technology management. Int. J. Qual. Reliab. Manag. 2002, 19, 889–901. [Google Scholar] [CrossRef]
- Kuei, C.; Madu, C. Identifying critical success factors for supply chain quality management. Asia Pac. Manag. Rev. 2001, 6, 409–423. [Google Scholar]
- Zhang, X.; van Donk, D.P.; van Der Vaart, T. Does ICT influence supply chain management and performance? Int. J. Oper. Prod. Manag. 2011, 31, 1215–1247. [Google Scholar] [CrossRef]
- Al Kurdi, B.; Alzoubi, H.M.; Akour, I.; Alshurideh, M.T. The effect of blockchain and smart inventory system on supply chain performance: Empirical evidence from retail industry. Uncertain Supply Chain Manag. 2022, 10, 1111–1116. [Google Scholar] [CrossRef]
- Ardito, L.; Petruzzelli, A.M.; Panniello, U.; Garavelli, A.C. Towards Industry 4.0: Mapping digital technologies for supply chain management-marketing integratio. Bus. Process Manag. J. 2019, 25, 323–346. [Google Scholar] [CrossRef]
- Ben-Daya, M.; Hassini, E.; Bahroun, Z. Internet of Things and supply chain management: A literature review. Int. J. Prod. Res. 2019, 57, 4719–4742. [Google Scholar] [CrossRef]
- Hofman, P.S.; Blome, C.; Schleper, M.C.; Subramanian, N. Supply chain collaboration and eco-innovations: An institutional perspective from China. Bus. Strat. Environ. 2020, 29, 2734–2754. [Google Scholar] [CrossRef]
- Zhang, C.; Dhaliwal, J. An investigation of resource-based and institutional theoretic factors in technology adoption for operations and supply chain management. Int. J. Prod. Econ. 2009, 120, 252–269. [Google Scholar] [CrossRef]
- Zhu, Q.; Sarkis, J.; Lai, K.-H. Green supply chain management: Pressures, practices and performance within the Chinese automobile industry. J. Clean. Prod. 2007, 15, 1041–1052. [Google Scholar] [CrossRef]
- Nkwabi, J.M. Supply chain management constraints in Tanzanian small and medium enterprises. Afr. J. Bus. Manag. 2019, 13, 564–570. [Google Scholar]
- Tanco, M.; Jurburg, D.; Escuder, M. Main difficulties hindering supply chain performance: An exploratory analysis at Uruguayan SMEs. Supply Chain Manag. Int. J. 2015, 20, 11–23. [Google Scholar] [CrossRef]
- Munshi, M.M.; Fateh, E.A.; Alam, F.; Khan, K. Assessing Psychometric Properties of Servqual and Evaluation of Students’satisfaction in King Abdulaziz University. Sci. Int. 2018, 30, 497–505. [Google Scholar]
- Hair, J.F.; Risher, J.J.; Sarstedt, M.; Ringle, C.M. When to use and how to report the results of PLS-SEM. Eur. Bus. Rev. 2019, 31, 2–24. [Google Scholar] [CrossRef]
- Jöreskog, K.G. Statistical analysis of sets of congeneric tests. Psychometrika 1971, 36, 109–133. [Google Scholar] [CrossRef]
- Fornell, C.; Larcker, D.F. Structural equation models with unobservable variables and measurement error: Algebra and statistics. J. Mark. Res. 1981, 18, 382–388. [Google Scholar] [CrossRef]
- Kock, N. Common method bias in PLS-PLS-SEM: A full collinearity assessment approach. Int. J. e-Collab. 2015, 11, 1–10. [Google Scholar] [CrossRef]
- Ursachi, G.; Horodnic, I.A.; Zait, A. How Reliable are Measurement Scales? External Factors with Indirect Influence on Reliability Estimators. Procedia Econ. Finance 2015, 20, 679–686. [Google Scholar] [CrossRef]
- Dijkstra, T.K.; Henseler, J. Consistent Partial Least Squares Path Modeling. MIS Q. 2015, 39, 297–316. [Google Scholar] [CrossRef]
- Sin, L.Y.M.; Tse, A.C.B.; Yim, F.H.K. CRM: Conceptualization and scale development. Eur. J. Mark. 2005, 39, 1264–1290. [Google Scholar] [CrossRef]
- Baah, C.; Jin, Z. Sustainable supply chain management andorganisational performance: The intermediary role of competitive advantage. J. Manag. Sustain. 2019, 9, 119–131. [Google Scholar]
- Tan, K.C.; Lyman, S.B.; Wisner, J.D. Supply chain management: A strategic perspective. Int. J. Oper. Prod. Manag. 2002, 22, 614–631. [Google Scholar]
- Mentzer, J.; DeWitt, W.; Keebler, J.; Min, S.; Nix, N.; Smith, C.; Zacharia, Z. Defining supply chain management. J. Bus. Logist. 2001, 22, 1–25. [Google Scholar] [CrossRef]
- Chopra, S.; Meindel, P. Supply Chain Management: Strategy, Planning, and Operation; Pearson Education Limited: Essex, UK, 2008. [Google Scholar]


| Construct | Coefficient of Determination (R2) | Adjusted R2 |
|---|---|---|
| FINANCE | 0.258 | 0.233 |
| CUSTOM | 0.507 | 0.491 |
| INNO_LEARN | 0.532 | 0.516 |
| INT_PROC | 0.472 | 0.454 |
| Construct Items | Loadings | Mean | SDEV | T Statistics | VIF |
|---|---|---|---|---|---|
| FOND | |||||
| FOND1 | 0.644 | 3.84 | 1.145 | 9.247 | 1.268 |
| FOND2 | 0.763 | 4.11 | 1.012 | 13.567 | 1.631 |
| FOND3 | 0.689 | 4.22 | 0.879 | 11.333 | 1.400 |
| FOND4 | 0.745 | 3.83 | 1.157 | 11.658 | 1.578 |
| FOND5 | 0.795 | 4.31 | .836 | 14.275 | 1.677 |
| STRUCT | |||||
| STRUCT1 | 0.817 | 3.71 | 1.228 | 14.963 | 2.396 |
| STRUCT2 | 0.878 | 3.50 | 1.222 | 12.432 | 2.994 |
| STRUCT3 | 0.786 | 3.86 | 1.143 | 13.372 | 2.042 |
| STRUCT4 | 0.750 | 4.14 | 1.063 | 11.707 | 1.869 |
| STRUCT5 | 0.848 | 3.67 | 1.296 | 12.638 | 2.509 |
| VISION | |||||
| VISION1 | 0.763 | 4.44 | 1.034 | 8.555 | 2.132 |
| VISION2 | 0.832 | 4.42 | 0.958 | 13.668 | 2.271 |
| VISION3 | 0.885 | 4.50 | 0.820 | 15.890 | 3.386 |
| VISION4 | 0.845 | 3.66 | 1.347 | 12.116 | 2.936 |
| VISION5 | 0.816 | 3.43 | 1.348 | 11.799 | 2.534 |
| INTEGR | |||||
| INTEGR1 | 0.743 | 4.15 | 0.979 | 13.595 | 1.617 |
| INTEGR2 | 0.794 | 3.91 | 1.053 | 12.980 | 1.880 |
| INTEGR3 | 0.812 | 3.81 | 1.113 | 16.383 | 2.237 |
| INTEGR4 | 0.866 | 3.52 | 1.289 | 18.992 | 3.654 |
| INTEGR5 | 0.855 | 3.16 | 1.274 | 15.795 | 3.160 |
| DYNAM | |||||
| DYNAM1 | 0.600 | 3.99 | 1.070 | 7.835 | 1.310 |
| DYNAM2 | 0.775 | 4.40 | 0.836 | 14.519 | 1.747 |
| DYNAM3 | 0.857 | 4.16 | 0.978 | 17.372 | 2.383 |
| DYNAM4 | 0.896 | 3.91 | 1.105 | 20.183 | 3.378 |
| DYNAM5 | 0.884 | 3.87 | 1.094 | 19.458 | 3.193 |
| Construct Items | Loadings | Mean | SDEV | T Statistics | VIF |
|---|---|---|---|---|---|
| FINANCE | |||||
| FINANC1 | 0.913 | 4.23 | 0.992 | 14.173 | 4.730 |
| FINANC2 | 0.905 | 4.01 | 1.104 | 14.170 | 2.936 |
| FINANC3 | 0.894 | 3.89 | 1.095 | 14.911 | 3.578 |
| FINANC4 | 0.917 | 3.78 | 1.101 | 15.603 | 4.544 |
| CUSTOM | |||||
| CUSTOM1 | 0.881 | 3.89 | 1.022 | 18.420 | 3.401 |
| CUSTOM2 | 0.886 | 4.02 | 1.014 | 17.331 | 3.415 |
| CUSTOM3 | 0.818 | 3.63 | 1.068 | 15.167 | 2.208 |
| CUSTOM4 | 0.836 | 3.82 | 1.113 | 14.946 | 2.756 |
| CUSTOM5 | 0.822 | 4.09 | 0.984 | 12.539 | 2.426 |
| CUSTOM6 | 0.866 | 4.06 | 0.970 | 14.323 | 3.184 |
| INNO_LEARN | |||||
| INNO_LEARN1 | 0.843 | 3.62 | 1.060 | 18.476 | 2.294 |
| INNO_LEARN2 | 0.860 | 3.47 | 1.097 | 17.650 | 2.563 |
| INNO_LEARN3 | 0.823 | 3.05 | 1.245 | 16.879 | 2.127 |
| INNO_LEARN4 | 0.789 | 3.32 | 1.182 | 16.518 | 1.972 |
| INNO_LEARN5 | 0.490 | 4.09 | 1.055 | 5.936 | 1.364 |
| INT_PROC | |||||
| INT_PROC1 | 0.703 | 3.47 | 1.027 | 12.231 | 1.538 |
| INT_PROC2 | 0.889 | 3.76 | 1.074 | 19.717 | 3.172 |
| INT_PROC3 | 0.896 | 3.70 | 1.003 | 18.623 | 3.582 |
| INT_PROC4 | 0.884 | 3.67 | 1.035 | 17.618 | 3.729 |
| INT_PROC5 | 0.863 | 3.60 | 1.093 | 15.540 | 2.677 |
| Construct Items | Loadings | Mean | SDEV | T Statistics | VIF |
|---|---|---|---|---|---|
| TECH_DYN | |||||
| TECH_DYN1 | 0.861 | 4.04 | 1.120 | 13.002 | 2.008 |
| TECH_DYN2 | 0.889 | 3.60 | 1.114 | 14.158 | 2.220 |
| TECH_DYN3 | 0.733 | 4.17 | 0.952 | 7.835 | 1.318 |
| STATE | |||||
| STATE1 | 0.746 | 3.34 | 1.316 | 3.770 | 1.539 |
| STATE2 | 0.671 | 3.52 | 1.237 | 2.321 | 1.501 |
| STATE3 | 0.669 | 1.95 | 1.226 | 2.964 | 1.254 |
| STATE4 | 0.708 | 2.16 | 1.317 | 1.744 | 2.268 |
| STATE5 | 0.733 | 1.87 | 1.026 | 3.339 | 2.200 |
| Construct Items | Dijkstra–Henseler’s rho (ρA) | Jöreskog’s rho (ρc) | Cronbach’s alpha (α) | AVE |
|---|---|---|---|---|
| FOND | 0.782 | 0.850 | 0.778 | 0.532 |
| STRUCT | 0.880 | 0.909 | 0.875 | 0.667 |
| VISION | 0.889 | 0.916 | 0.886 | 0.687 |
| INTEGR | 0.874 | 0.908 | 0.873 | 0.665 |
| DYNAM | 0.881 | 0.903 | 0.863 | 0.656 |
| FINANC | 0.945 | 0.949 | 0.929 | 0.823 |
| CUSTOM | 0.928 | 0.941 | 0.924 | 0.726 |
| INNO_LEARN | 0.858 | 0.878 | 0.824 | 0.598 |
| INT_PROC | 0.902 | 0.928 | 0.902 | 0.723 |
| TECH_DYN | 0.780 | 0.869 | 0.771 | 0.690 |
| STATE | 0.736 | 0.806 | 0.754 | 0.514 |
| Construct | FOND | STRUCT | VISION | INTEGR | DYNAM | FINANCE | CUSTOM | INNO_ LEARN | INT_ PROC | TECH_ DYN | STATE |
|---|---|---|---|---|---|---|---|---|---|---|---|
| FOND | 0.532 | ||||||||||
| STRUCT | 0.518 | 0.667 | |||||||||
| VISION | 0.453 | 0.556 | 0.687 | ||||||||
| INTEGR | 0.483 | 0.551 | 0.550 | 0.665 | |||||||
| DYNAM | 0.459 | 0.477 | 0.550 | 0.622 | 0.656 | ||||||
| FINANCE | 0.114 | 0.076 | 0.086 | 0.106 | 0.131 | 0.823 | |||||
| CUSTOM | 0.335 | 0.257 | 0.207 | 0.272 | 0.387 | 0.370 | 0.726 | ||||
| INNO_LEARN | 0.377 | 0.338 | 0.346 | 0.442 | 0.422 | 0.149 | 0.353 | 0.598 | |||
| INT_PROC | 0.297 | 0.197 | 0.202 | 0.219 | 0.344 | 0.258 | 0.645 | 0.371 | 0.723 | ||
| TECH_DYN | 0.083 | 0.132 | 0.084 | 0.106 | 0.111 | 0.188 | 0.211 | 0.140 | 0.208 | 0.690 | |
| STATE | 0.026 | 0.047 | 0.043 | 0.063 | 0.014 | 0.014 | 0.031 | 0.055 | 0.035 | 0.057 | 0.514 |
| Hypothesis—Effect | Path Coefficient | Standard Error | t-Value | p-Value |
|---|---|---|---|---|
| H1—SCMM -> FINANC | 0.231 | 0.079 | 2.939 | 0.003 *** |
| H2—SCMM -> CUSTOM | 0.509 | 0.072 | 7.052 | 0.000 *** |
| H3—SCMM -> INNO_LEARN | 0.644 | 0.050 | 12.845 | 0.000 *** |
| H4—SCMM -> INT_PROC | 0.460 | 0.068 | 6.730 | 0.000 *** |
| Hypothesis—Effect | Beta | Indirect Effects | Total Effect | Cohen’s f2 |
|---|---|---|---|---|
| H5a—SCMM -> FINANC | 0.231 | 0.126 | 0.357 | 0.060 |
| H5b—SCMM -> CUSTOM | 0.509 | 0.100 | 0.609 | 0.394 |
| H5c—SCMM -> INNO_LEARN | 0.644 | 0.050 | 0.694 | 0.749 |
| H5d—SCMM -> INT_PROC | 0.460 | 0.105 | 0.565 | 0.304 |
| Hypothesis | Input | Outcome | Conclusion |
|---|---|---|---|
| H1 | SCCM | FINANCE | ✓ (+1%) |
| H2 | SCCM | CUSTOM | ✓ (+1%) |
| H3 | SCCM | INNO_LEARN | ✓ (+1%) |
| H4 | SCCM | INT_PROC | ✓ (+1%) |
| H5a | TECH_DYN | FINANCE | ✓ (+1%) |
| H5b | TECH_DYN | CUSTOM | ✓ (+1%) |
| H5c | TECH_DYN | INNO_LEARN | ✓ (+1%) |
| H5d | TECH_DYN | INT_PROC | ✓ (+1%) |
| H6a | STATE | FINANCE | Not supported |
| H6b | STATE | CUSTOM | Not supported |
| H6c | STATE | INNO_LEARN | Not supported |
| H6d | STATE | INT_PROC | Not supported |
Disclaimer/Publisher’s Note: The statements, opinions and data contained in all publications are solely those of the individual author(s) and contributor(s) and not of MDPI and/or the editor(s). MDPI and/or the editor(s) disclaim responsibility for any injury to people or property resulting from any ideas, methods, instructions or products referred to in the content. |
© 2023 by the authors. Licensee MDPI, Basel, Switzerland. This article is an open access article distributed under the terms and conditions of the Creative Commons Attribution (CC BY) license (https://creativecommons.org/licenses/by/4.0/).
Share and Cite
Pejić Bach, M.; Klinčar, A.; Aleksić, A.; Rašić Jelavić, S.; Zeqiri, J. Supply Chain Management Maturity and Business Performance: The Balanced Scorecard Perspective. Appl. Sci. 2023, 13, 2065. https://doi.org/10.3390/app13042065
Pejić Bach M, Klinčar A, Aleksić A, Rašić Jelavić S, Zeqiri J. Supply Chain Management Maturity and Business Performance: The Balanced Scorecard Perspective. Applied Sciences. 2023; 13(4):2065. https://doi.org/10.3390/app13042065
Chicago/Turabian StylePejić Bach, Mirjana, Amir Klinčar, Ana Aleksić, Sanda Rašić Jelavić, and Jusuf Zeqiri. 2023. "Supply Chain Management Maturity and Business Performance: The Balanced Scorecard Perspective" Applied Sciences 13, no. 4: 2065. https://doi.org/10.3390/app13042065
APA StylePejić Bach, M., Klinčar, A., Aleksić, A., Rašić Jelavić, S., & Zeqiri, J. (2023). Supply Chain Management Maturity and Business Performance: The Balanced Scorecard Perspective. Applied Sciences, 13(4), 2065. https://doi.org/10.3390/app13042065