Article

Aminated Covalent Organic Polymers for Anionic Dye Adsorption in Aqueous Systems

1
Department of Environmental Engineering, Seoul National University of Science and Technology, Seoul 01811, Republic of Korea
2
Laboratory of Accelerator and Radioisotopes, Korea Atomic Energy Research Institute, Jeongeup 56212, Republic of Korea
*
Authors to whom correspondence should be addressed.
These authors contributed equally to this work.
Appl. Sci. 2023, 13(4), 2043; https://doi.org/10.3390/app13042043
Submission received: 31 December 2022 / Revised: 30 January 2023 / Accepted: 1 February 2023 / Published: 4 February 2023
(This article belongs to the Section Environmental Sciences)

Abstract

:
Aminated covalent organic polymer (ACOP) was synthesized through a catalyst-free Schiff base reaction involving terephthalaldehyde and melamine, and the prepared ACOP was used for the adsorption of anionic dyes. The prepared ACOP possessed a high specific surface area (582.07 m2/g) with an average pore size of 88.71 Å. Its point of zero charge was determined as pH 8.26. Anionic dye molecules, methyl orange (MO) and orange G (OG), were used to evaluate the dye adsorption efficiency of the prepared ACOP, and it was found that they were adsorbed rapidly on ACOP within 1 min. The maximum adsorption capacities (qm) of the prepared ACOP for MO and OG were 351.9 and 227.9 mg/g, respectively. Furthermore, the results of dye adsorption as a function of the initial pH and presence/absence of cationic dye (methylene blue; MB) revealed that dye adsorption on ACOP proceeded through charge–charge and π–π interactions. The presence of MB along with MO and OG enhanced the dye adsorption capacity because of the synergistic effect of the positively charged quaternized nitrogen atoms in the prepared ACOP. The dye adsorption mechanism was further investigated using Fourier transform infrared (FT-IR) analysis and X-ray photoelectron spectrometry (XPS). The ACOP adsorbent prepared herein using a facile catalyst-free reaction offers rapid adsorption with a high adsorption efficiency over a wide pH range and in the presence of cationic dye. For these reasons, it can be used for environmental remediation, especially in aqueous systems.

1. Introduction

Wastewaters containing dyes that are discharged from textile, paper, food, pharmaceutical, and other chemical manufacturing processes are among the major causes of environmental pollution [1,2]. Annually, approximately 7 × 10⁵ tons of dyes are used in various applications, and about 5% of these dyes are discharged without proper treatment [3,4]. Most dye molecules are visualized at deficient concentrations, and they can interfere with the availability of sunlight underwater, which may affect living organisms in aqueous environments. Furthermore, dye molecules can increase biochemical oxygen demand (BOD), and the molecules themselves may be toxic and carcinogenic [5,6]. To remove these dyes from wastewater, various techniques such as biological treatment, chemical oxidation, ion exchange, and adsorption are utilized [7,8,9,10,11,12]. Among the mentioned techniques, adsorption is widely used for wastewater treatment to remove dye molecules owing to its advantages including low cost, flexibility, design simplicity, profitability, efficiency, and the lack of formation of secondary pollutants [13,14]. Based on these benefits of the adsorption technique, various organic/inorganic adsorbents such as activated carbon, clays, zeolite, polymer-based materials, metal-organic frameworks (MOFs), and covalent organic polymers (COPs) have been studied for removing dyes from water [3,15,16,17,18,19,20,21].
Covalent organic polymers (COPs), or covalent organic frameworks, have recently attracted attention due to their stability, functional tunability, and straightforward synthesis [22,23]. In particular, diverse combinations of COPs created by utilizing deliberately selected building blocks have been investigated for use in energy, biomedical, and environmental applications [24,25,26,27,28]. COP as an adsorbent for water treatment has also been reported. Byun et al. reported the charge-specific size-dependent separation of organic molecules using fluorinated COP [29]. The selective adsorption of cationic dye molecules on disulfide-linked COPs prepared through the polymerization of aliphatic thiols was reported in our recent studies [19,30]. However, because the surfaces of these COPs are negatively charged, the adsorption of anionic dye molecules on them is limited [31]. To overcome this limitation, Schwab et al. prepared a catalyst-free melamine-based aminated covalent polymer (ACOP) through Schiff base chemistry [32]. Schiff base chemistry is a well-known organic synthesis tool for realizing complex molecular architectures through the condensation of carbonyl compounds with primary amines [33]. The powder form of the prepared melamine-based ACOP was expected to be insoluble in aqueous, acidic, and alkaline solutions, and it exhibited high thermal stability. Owing to these advantages, ACOPs have been studied as catalysts [34,35], CO2 capture materials [36], and adsorbents [31,37]. Moreover, ACOPs are known to have positive surface charges owing to the protonation of the amine group under acidic conditions [38]. Because of this feature of ACOPs, they are candidate materials for the selective adsorption of anionic pollutants, and it might be possible to reuse ACOPs by controlling the solution pH [39]. Despite these advantages of ACOPs, they have been used only as support materials for metal catalysts, CO2 capture materials, and heavy metal adsorbents [34,36,40,41].
In this study, an ACOP is prepared through one-pot synthesis by utilizing terephthaladehyde and melamine as monomers without a catalyst. The prepared ACOP is characterized intensively using several characterization techniques, including Fourier transform infrared (FT-IR) spectrometry, scanning electron microscopy (SEM), N2 adsorption-desorption analysis, zeta potentiometry, and X-ray photoelectron spectroscopy (XPS). To evaluate the adsorption of anionic dye molecules on the prepared ACOP, methyl orange (MO) and orange G (OG) are used, and as a cationic dye, methyl blue (MB) is used to investigate selective adsorption on the prepared ACOP. For anionic dye adsorption, the adsorption capacity and efficiency of the ACOP are investigated as functions of initial dye concentration (isotherm) and time (kinetic), and the effects of initial pH and coexisting organics and ions are also evaluated. After anionic dye adsorption, the physicochemical properties and interaction between the ACOP and MO or OG are discussed based on the zeta potentiometry, FT-IR, and XPS results.

2. Experimental Procedure

2.1. Materials

Melamine (C3H6N6; 99%), dimethyl sulfoxide (C2H6OS; 99%), dichloromethane (CH2Cl2; 99.5%), and hydrochloric acid (HCl; 36%) were obtained from Samchun Chemical Co., Ltd. (Seoul, Korea). Tetrahydrofuran (C4H8O; 99.5%), acetone (C3H6O; 99.8%), methyl orange, and sodium hydroxide (NaOH; 98%) were obtained from Daejung Chemicals & Metals Co. Ltd. (Siheung, Korea). Terephthalaldehyde (C6H4(CHO)2; 99%) was provided by Sigma-Aldrich Co., LLC (St. Louis, MO, USA). Methylene blue was obtained from Junsei Chemical Co., Ltd. (Tokyo, Japan). Orange G was purchased from Alfa Aesar (Ward Hill, MA, USA). Deionized (DI) water was prepared in the lab using a Milli-Q® system (Synergy®, Merck, Kenilworth, NJ, USA). The chemical properties of dye molecules used in this study are provided in Table 1.

2.2. ACOP Synthesis

ACOP was synthesized using a modified method described by Schwab et al. (2009) [32]. To prepare the ACOP, 0.0497 mol (3.13 g) of melamine and 0.0746 mol (5.0 g) of terephthalaldehyde were dissolved in dimethyl sulfoxide (310 mL) in a 500 mL three-necked round-bottom flask. The polymerization was performed for 72 h at 180 °C in an N2 atmosphere. Then, the reaction vessel was cooled to room temperature, and the solid–liquid separation was performed via filtration using a Büchner funnel connected to a vacuum pump. The obtained precipitates were washed with acetone, tetrahydrofuran, and dichloromethane, in that order. Finally, the resulting product was dried at room temperature under a vacuum.

2.3. Characterization

FT-IR attenuated total-reflectance (ATR) spectra (Spectrum Two, Perkin Elmer, UK) of the prepared ACOP were recorded in the range of 650–4000 cm−1 by conducting 32 scans at a resolution of 4 cm−1. Electron microscopy images of the prepared ACOP were obtained using a field emission SEM (FE-SEM; SU8010, Hitachi High Technologies Co., Japan). The average zeta potential values as a function of pH were determined using a zeta potentiometer (ELS Z-2000ZS, Otsuka, Japan) in the pH range of 4–10. For this measurement, the prepared ACOP was dispersed in DI water (1 g/L), and the resulting zeta potential values were calculated using the Smoluchowski equation incorporated in the software. The N2 adsorption–desorption isotherms and the specific surface area of the prepared ACOP were obtained using a 3Flex physisorption analyzer (Micromeritics, Norcross, GA, USA). The average pore volume and width were determined using the BJH method. XPS (K-alpha, Thermo Nexsa G2, ThermoFisher Scientific, MA, USA) equipped with a monochromatic Al X-ray source (Al Kα line: 1486 eV) was used to obtain an elemental composition and oxidation state on the surface.

2.4. Adsorption Experiments

2.4.1. Adsorption Kinetic Experiments

Anionic dye adsorption kinetic experiments were conducted using 100 ppm initial MB and MO solutions. Before the adsorption experiments, powdered ACOP was dispersed in DI water at the designed dosages (0.5, 1.0, and 2.0 g/L), and the dispersion was ultrasonicated for 5 min to obtain a homogeneous ACOP suspension. Then, 100 mL of this ACOP suspension and 100 mL of dye solution were mixed in a 250 mL glass beaker under magnetic stirring to obtain a homogenous solution. The supernatant was collected at 1, 5, 15, 30, 60, 120, and 180 min and filtered with a syringe filter (polyethersulfone (PES), 0.45 μm). The concentration of each dye in the supernatant was quantified using a UV-Vis spectrometer (Genesys50, ThermoFisher Scientific, MA, USA) at the maximum wavelengths (λmax) of the dyes, which are 463 nm and 481 nm for MO and OG, respectively.
The intraparticle diffusion kinetic model (Equation (1)) was applied to analyze the kinetic data and underlying adsorption mechanisms [42].
q t = K i d t 1 2 + c
where Kid (mg/g∙min1/2) is the intraparticle rate constant, and c (mg/g) is the thickness of the boundary layer formed in the first interval.

2.4.2. Adsorption Isotherm Experiments

The adsorption isotherm experiments were conducted with various initial dye concentrations of 200, 220, 240, 250, 280, 300, and 350 ppm for MO and 80, 120, 160, 200, 240, 280, 300, 350 ppm for OG. The supernatant was collected after 3 h of shaking in a vertical shaker. The concentration of MO and OG was quantified as described in Section 2.4.1. The obtained isotherm result was fitted using the Langmuir (Equation (2)) [43] and Freundlich (Equation (3)) [44] isotherm models.
q e = q m a L C e 1 + a L C e
q e = K F · C e 1 n
where qe is the quantity of adsorbate adsorbed per unit weight of solid adsorbent, qm is the maximum sorption capacity of the adsorbent (mg/g), Ce is the equilibrium concentration of the adsorbate in solution (mg/L), and aL (L/mg) is the Langmuir affinity constant. KF is the Freundlich constant indicating adsorption capacity, and n is the Freundlich constant related to the favorability of the adsorption process.

2.4.3. Effect of pH on Adsorption of Dye Molecules

To evaluate the effect of the initial pH of the dye solution, the pH of the initial dye solution was adjusted to 4, 6, 8, and 10 by adding HCl and NaOH. Then, 20 mL of the pH-adjusted dye solution (100 ppm) was added to 20 mL of the ACOP suspension (2.0 mg/L), and the resulting mixture was agitated continuously for 24 h using a vertical shaker. Then, the supernatant was collected and quantified, as described in Section 2.4.1.

2.4.4. Adsorption of Anionic Dyes from Mixed-Dye Solutions and Real Water Sample

A mixed-dye solution was prepared with the cationic dye MB to investigate adsorption behavior in mixed-dye solutions. The concentration of each dye (MO, OG, and MB) was set to 100 ppm before the experiments. For single-dye batch adsorption, 20 mL of a single-dye solution (100 ppm) was mixed with 20 mL of the ACOP suspension (2.0 g/L). In the mixed-dye adsorption experiments, 30 mL of a mixed-dye (15 mL of MO + 15 mL of MB and 15 mL of OG + 15 mL of MB) solution was added to 15 mL of the ACOP suspension (3.0 g/L). After 24 h, the supernatant was collected and quantified, as described in Section 2.4.1.
To test the applicability of the method in real water, a test was conducted using tap water. The overall experimental scheme was similar to that of the other batch tests while the solution was prepared in tap water. The water quality of the tap water was assessed in the water quality report published by Seoul Waterworks Authority (2021) [45].

3. Results and Discussion

3.1. Characterization of Prepared ACOP

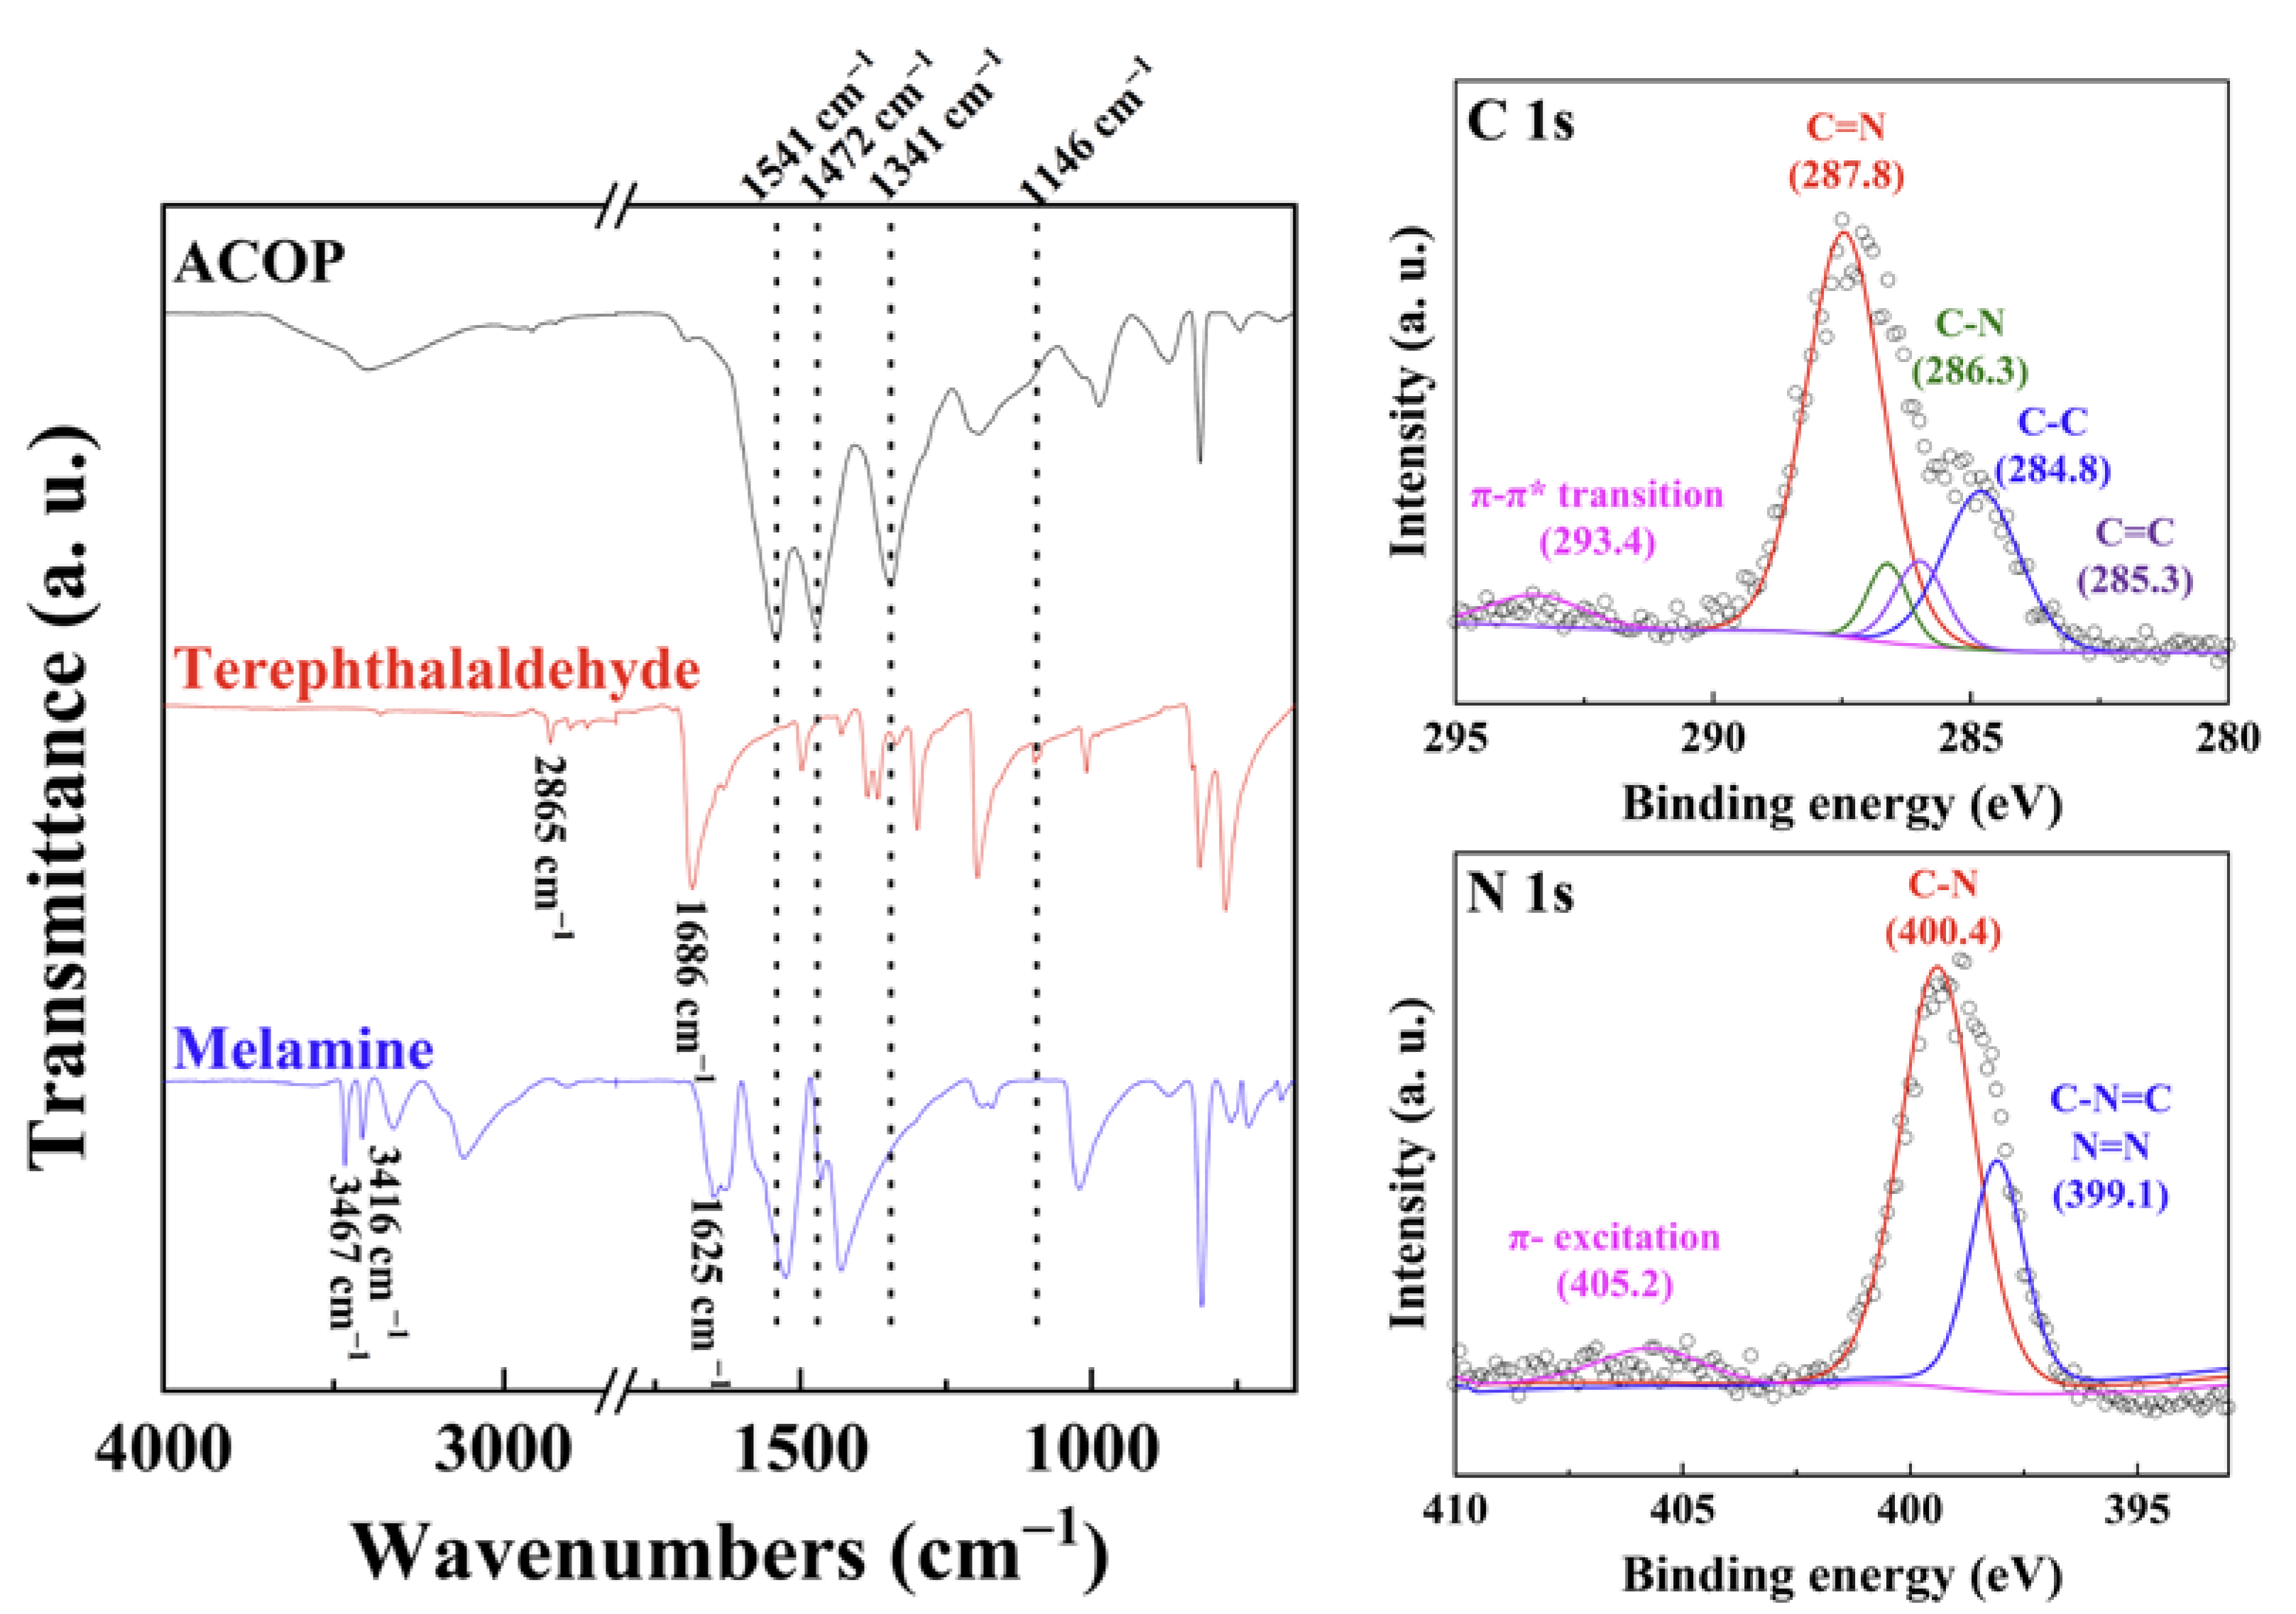
The chemical structure of the prepared ACOP was characterized using FT-IR, XPS, and SEM (Figure 1 and Figure 2). In the FT-IR spectra, the characteristic vibrations attributed to the primary amine from NH2 stretching and deformation vibrations in melamine were observed at 3467, 3416, and 1625 cm−1, respectively [46]. Moreover, the vibrations caused by the carbonyl groups, namely C-H stretching and C=O stretching, in terephthalaldehyde were observed at 2865 and 1686 cm−1, respectively [47]. After ACOP preparation, the aforementioned characteristic vibrations of melamine and terephthalaldehyde disappeared or decreased considerably owing to the Schiff base reaction, which is known to occur between the primary amine group in melamine and the carbonyl group in terephthalaldehyde through dehydration (Scheme 1) [32]. The vibrations on ACOP at 1341, 1541, and 1472 cm−1 are attributed to the C-N symmetric stretching and C=N stretching vibrations in the triazine ring, and this supported the successful polymerization of ACOP [48,49]. Additionally, newly developed vibrations were observed at 3404 and 1146 cm−1 for secondary amine groups such as aminal groups (HN-C-NH) [50].
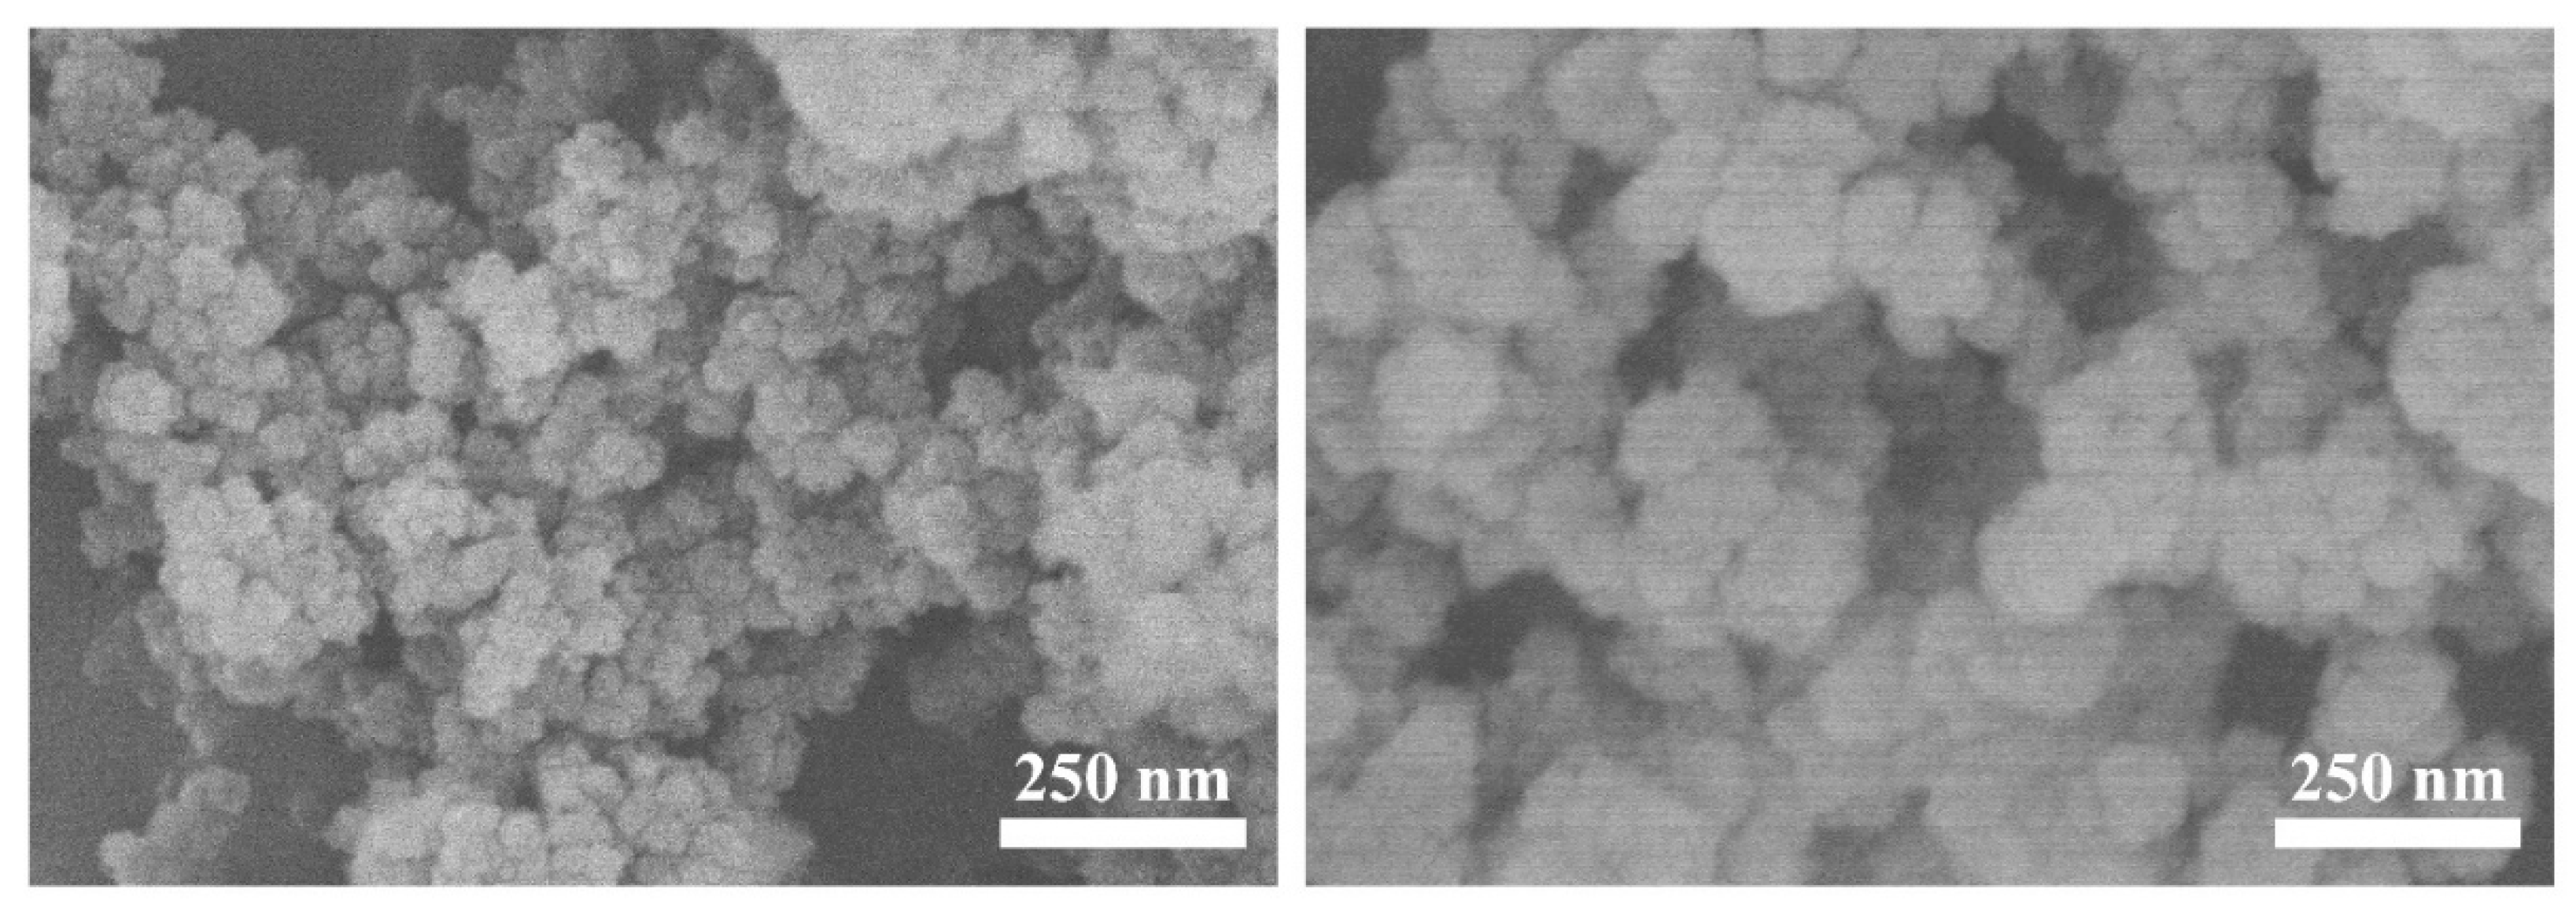
For detailed characterization of the carbon and nitrogen in the prepared ACOP, XPS spectra of the material were obtained. As displayed in Figure 1, the C 1 s spectra of the material were deconvoluted into five peaks. The peaks at 284.8 eV (C-C) and 285.3 eV (C=C) were found to correspond to the carbon atoms of the benzene ring. The peaks at 287.8 eV (C-N) and 293.4 eV (π-π* transition in the triazine ring) were attributed to the triazine ring. The peak at 286.3 eV (C-N) was attributed to the carbon bonded to the electronegative nitrogen atoms in linkages. Taken together, these results confirmed successful ACOP polymerization through a Schiff base reaction between melamine and terephthalaldehyde. Moreover, the deconvoluted N 1 s spectra contained three peaks at 399.1 eV, 400.4 eV, and 405.2 eV, which were attributed to C-N=C in the triazine ring, amine (C-NH-C) moieties, and π excitation in the triazine ring, respectively [31]. In SEM images (Figure 2), tens of nanoscale ACOP particles were found to be aggregated with intraparticle pores, representing the typical morphology of chain-structure polymers [51].
The detail-specific surface area (SSA) and pore structure of the prepared ACOP were evaluated using its N2 adsorption-desorption hysteresis loop (Figure 3). According to this hysteresis loop, the prepared ACOP exhibits the characteristics of a typical type II material, which are either nonporous or microporous [52]. The SSA was determined to be 528.07 m2/g, which is consistent with the results reported in the literature [53]. In addition, the detail pore volume and pore size, calculated using the Barrett–Joyner–Halenda (BJH) method, were 0.41 cm3/g and 88.71 Å, respectively. Based on the results of this pore analysis, the prepared ACOP can be utilized as a size-selective adsorbent.
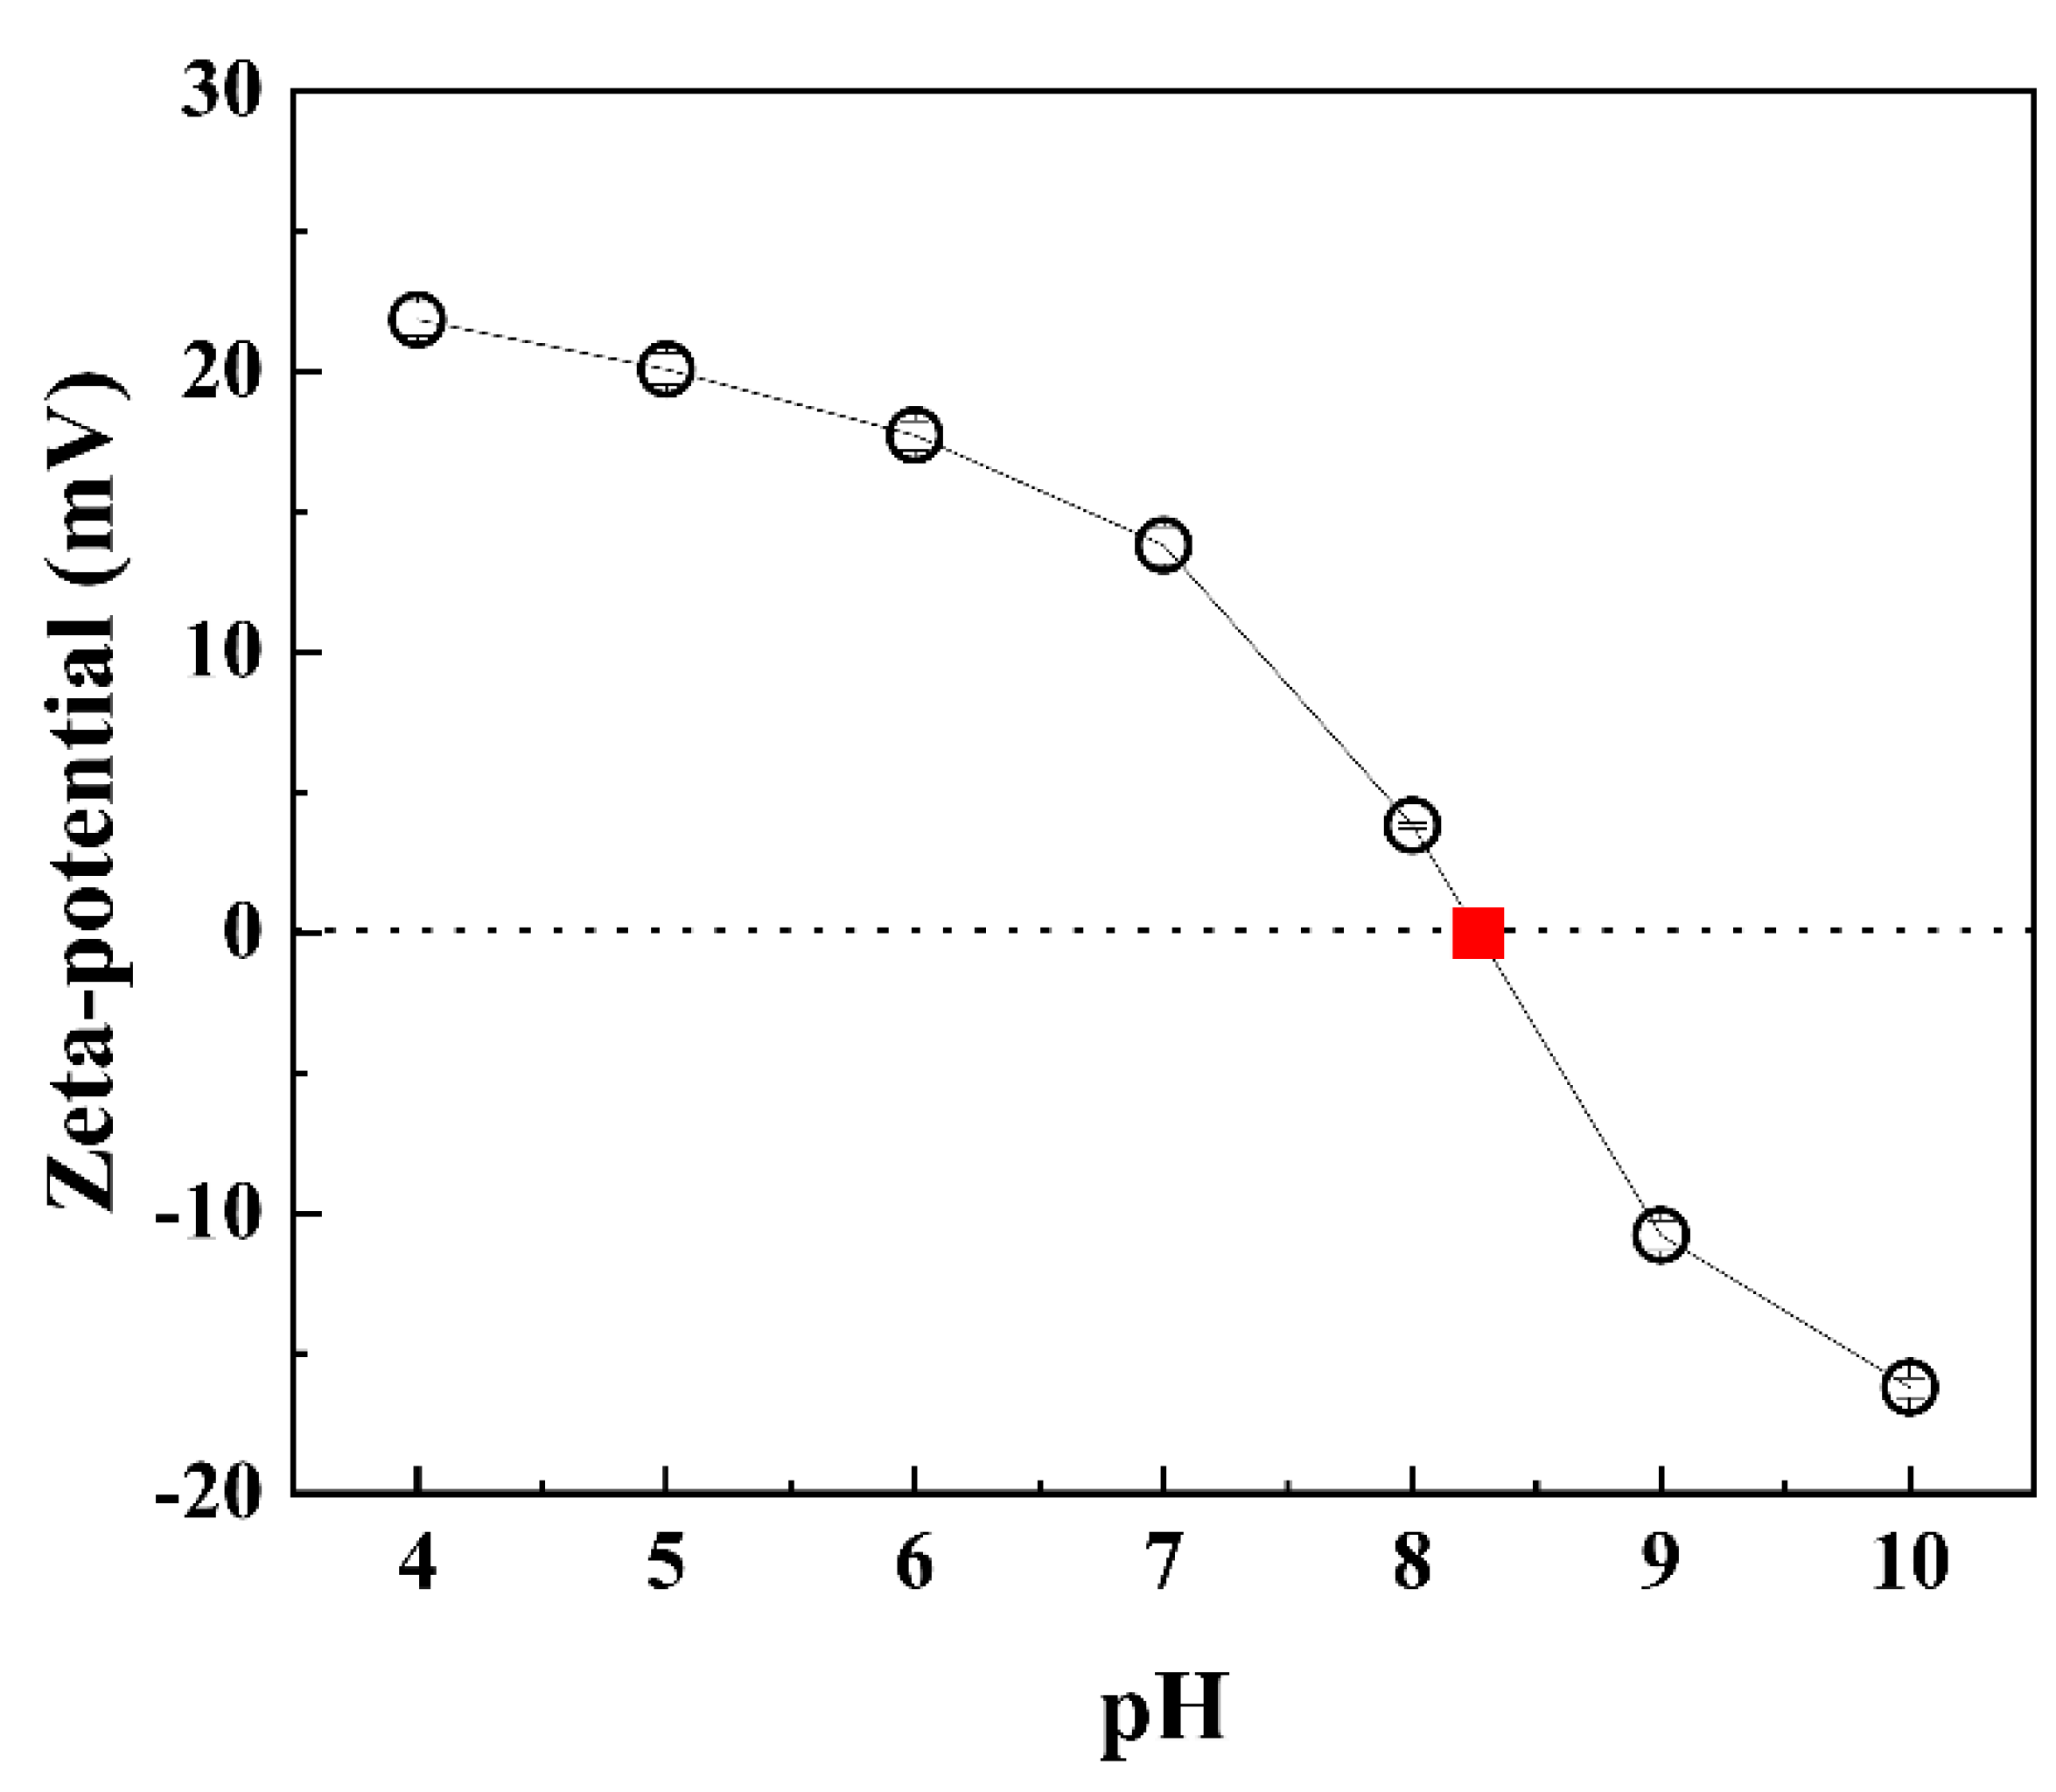
Surface charge is one of the essential factors in the adsorption of charged pollutants on various materials [54,55]. To investigate the surface charge of the prepared ACOP as a function of pH, its zeta potential was recorded in the pH range of 4–10. As shown in Figure 4, the surface charge of the prepared ACOP decreased gradually from +21.85 mV at pH 4 to −16.23 mV at pH 10. Moreover, the point of zero charge (pHpzc) of the ACOP was found to be at pH 8.26; at this point, the ACOP possesses a neutral charge. Below pHpzc, the surface charge of the ACOP was positive, meaning that the amine groups in the ACOP were protonated and promoted to adsorb negatively charged pollutants. Based on the pHpzc, additional experiments were conducted to adjust the pH to 7.00 in order to prevent any positive-to-negative transition in the surface charge of the ACOP.

3.2. Adsorption Kinetics

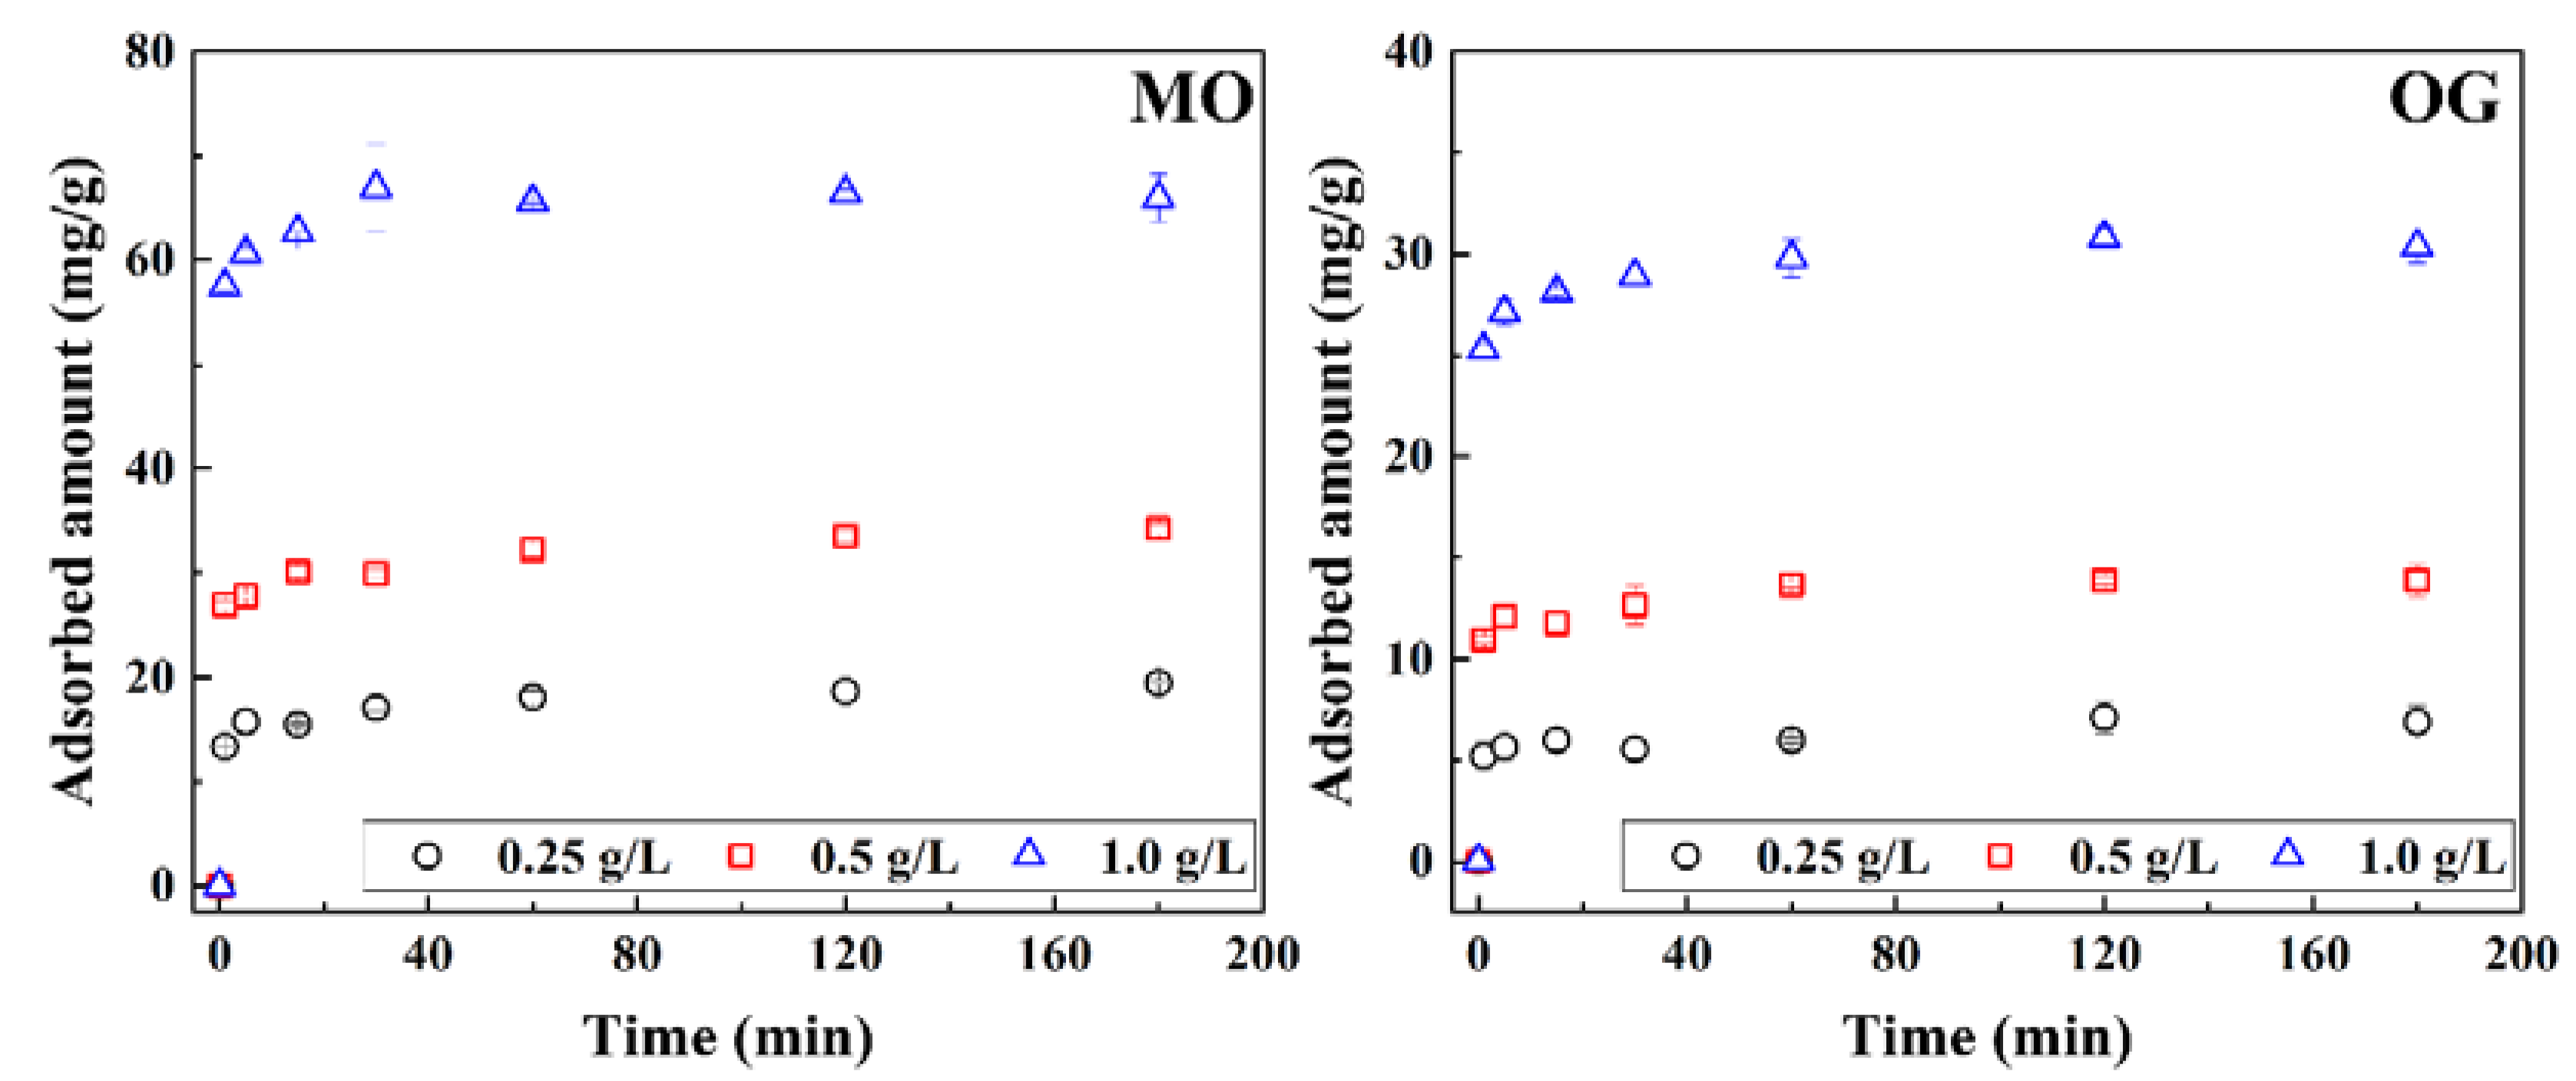
Anionic dye adsorption kinetic experiments were conducted to evaluate the adsorption rate of the prepared ACOP (Figure 5). Three ACOP doses, 0.25, 0.5, and 1.0 g/L, were used in the kinetic adsorption experiments. As displayed in Figure 5, the experimental kinetic results did not fit well with the pseudo-first- and pseudo-second-order kinetics owing to rapid dye adsorption, even in 1 min (approx. 68–86% adsorption capacity after 180 min). The adsorption capacity of the ACOP for MO and OG increased gradually as a function of the dosing amount. The intraparticle diffusion model was applied in order to understand the adsorption mechanism of anionic dye molecules on ACOP. As shown in Figure S1, ACOP tended to follow a single-step adsorption process for MO and OG. This single-step rapid adsorption indicating the adsorption of MO and OG on ACOP was attributed to the high specific area of ACOP and its dispersibility in an aqueous system. These advantages of ACOP make it suitable for adsorbing dye molecules due to the high availability of active adsorption sites on the surface [56]. The intraparticle diffusion rate constant (Ki) increased gradually as the amount of ACOP increased (Table S1). Based on the kinetic results, ACOP tended to rapidly absorb both MO and OG, and the MO showed a higher adsorbed amount than that of OG, owing to hydrophobic interaction. The adsorption efficacy of ACOP for anionic dyes increased in proportion to its dosage, and the adsorption process might have proceeded as a single adsorption step.
After the kinetic experiments, changes in the surface charge of the ACOP were investigated. As displayed in Figure S2, the characteristic positive surface charge of ACOP shifted toward the negative region, and the average zeta potentials of the MO- and OG-adsorbed ACOPs were −29.02 and −25.52 mV, respectively. These results indicated that the adsorption of negatively charged dyes on the ACOP altered the surface charge of ACOP, and this is consistent with the higher adsorption capacity of ACOP for MO than for OG (Figure 5).

3.3. Adsorption Isotherm

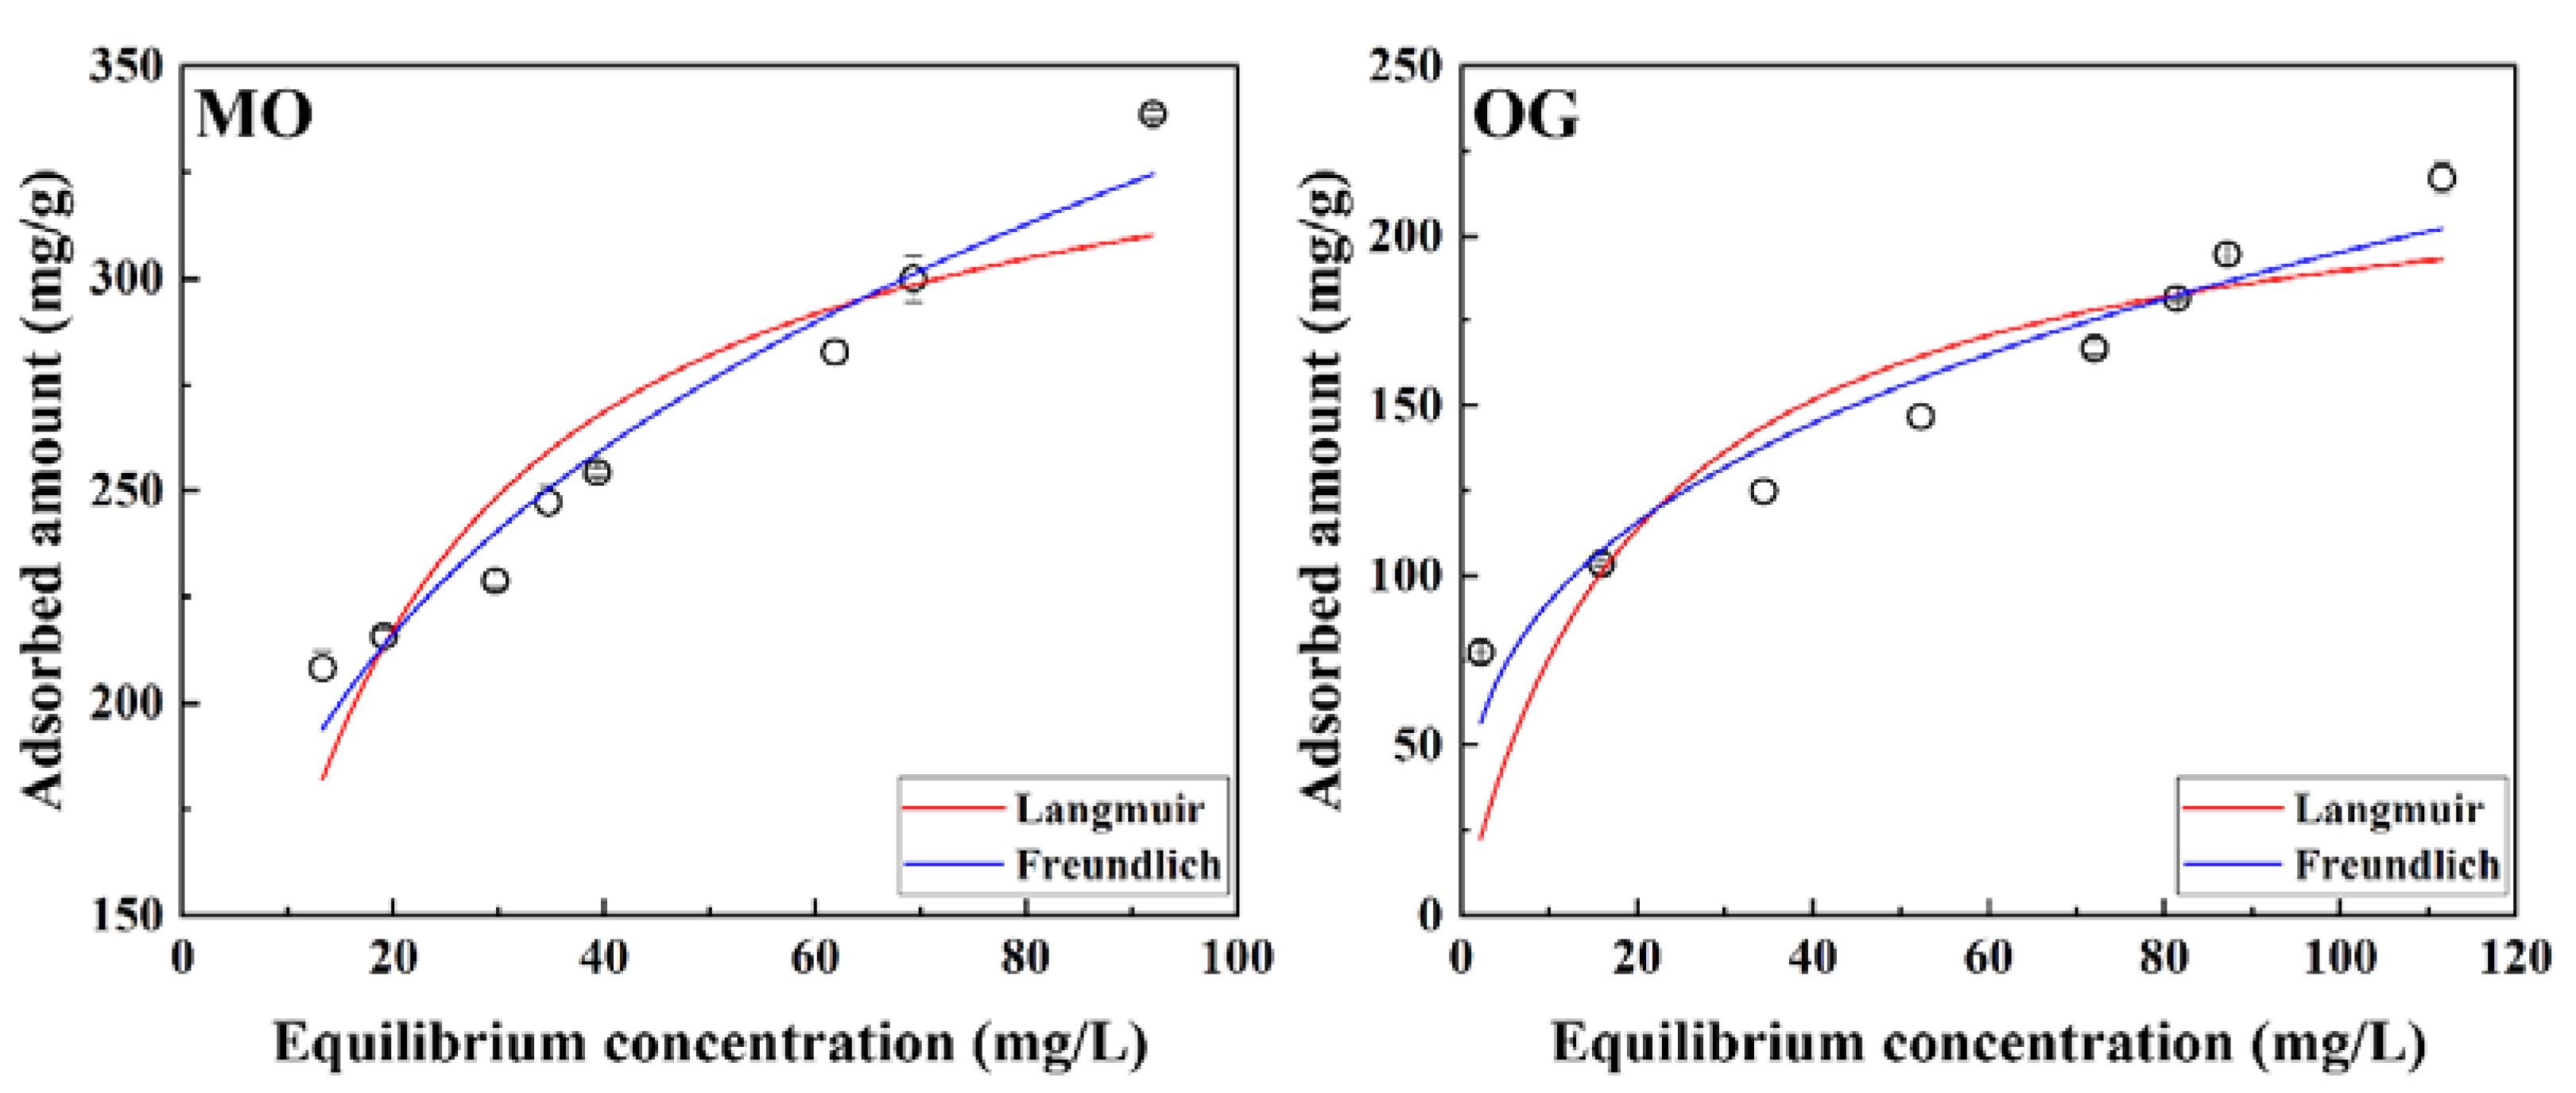
To evaluate the adsorption capacity of the prepared ACOP, anionic dye adsorption was performed as a function of initial dye concentration, and the results were fitted using the Langmuir (Equation (2)) and Freundlich (Equation (3)) isotherm models (Figure 6). As summarized in Table 2, the calculated Langmuir qm values were 351.9 and 227.9 mg/g for MO and OG, respectively. The qm value of ACOP was 1.5 times higher for MO than for OG. The lower adsorption efficiency of OG on ACOP than on MO may be caused by the ionization of OG in water as OG2−, accompanied by the release of two Na+ from two sulfonyl groups (Table 1). The two Na+ ions might interfere with the adsorption of OG on ACOP because of the lower qm value relative to that of MO. Moreover, the hydrophobic methyl groups (−CH3) of MO make it possible to enhance the adsorption efficiency of ACOP more than the hydrophilic groups of OG because of the hydrophobic interaction (π-π interaction), despite the presence of divalent OG in water. Darmograi et al. reported a similar tendency for the adsorption of orange-type dye on MgAl-layered double hydroxide (LDH) [57]. The adsorption of orange-type dyes, such as orange II and OG, which can release Na+ ions in aqueous systems, tends to lower the adsorption capacity compared with the adsorption of MO because of the co-adsorption of Na+ and dye molecules.
Furthermore, the separation factor (RL; dimensionless constant) was calculated using the following equation (Equation (4)) [58].
R L = 1 / 1 + a L C 0
where C0 is the highest initial adsorbate concentration (mg/L), and aL is the Langmuir constant (L/mg). The calculated RL value implies the isotherm, and it can be interpreted as unfavorable (RL > 1), linear (RL = 1), favorable (0 < RL < 1), or irreversible (RL = 0). The RL values of ACOP for MO and OG were determined as 0.0342 and 0.0543, respectively, indicating that the anionic dye adsorption on ACOP was a favorable reaction.
Additionally, the isotherm results were fitted using the Freundlich isotherm model, which represents a heterogeneous adsorption system. The n values, which indicate the presence or absence of favorable adsorption conditions, were determined as 3.753 and 3.072 for MO and OG, respectively. These values indicated that the adsorption of anionic dyes on ACOP was favored. The correlation coefficients (R2) obtained using the Langmuir and Freundlich isotherm models indicated that dye adsorption on the ACOP was interpreted better by the Freundlich isotherm model than the Langmuir isotherm model, which is consistent with previous reports related to multilayer adsorption on adsorbent surfaces [19,59].
The obtained qm value was compared to those obtained in other studies related to the adsorption of MB or OG on various adsorbents (Table 3). The qm values for anionic dyes are in the range of a few tens to a few hundred mg/g, with substantial deviation according to the adsorbent materials. In general, nanosized adsorbents showed superior adsorption performance compared with conventional adsorbent materials. In particular, porous polymers, including COP, COF, and MOF, showed comparably higher adsorption performance than other types of adsorbent materials due to their high surface area and tunable functionality. The prepared ACOP offers a reasonably high maximum adsorption capacity relative to other well-known adsorbents. Even though there are several other materials with higher qm values, our material is still worth reporting on because of its catalyst-free one-pot synthesis as well as charge selective feature. Notably, the adsorption equilibrium was achieved in less than 30 min, as depicted in Figure 5. Therefore, the prepared ACOP has great potential for use as an adsorbent with fast kinetics and large adsorption capacity.

3.4. pH Effect

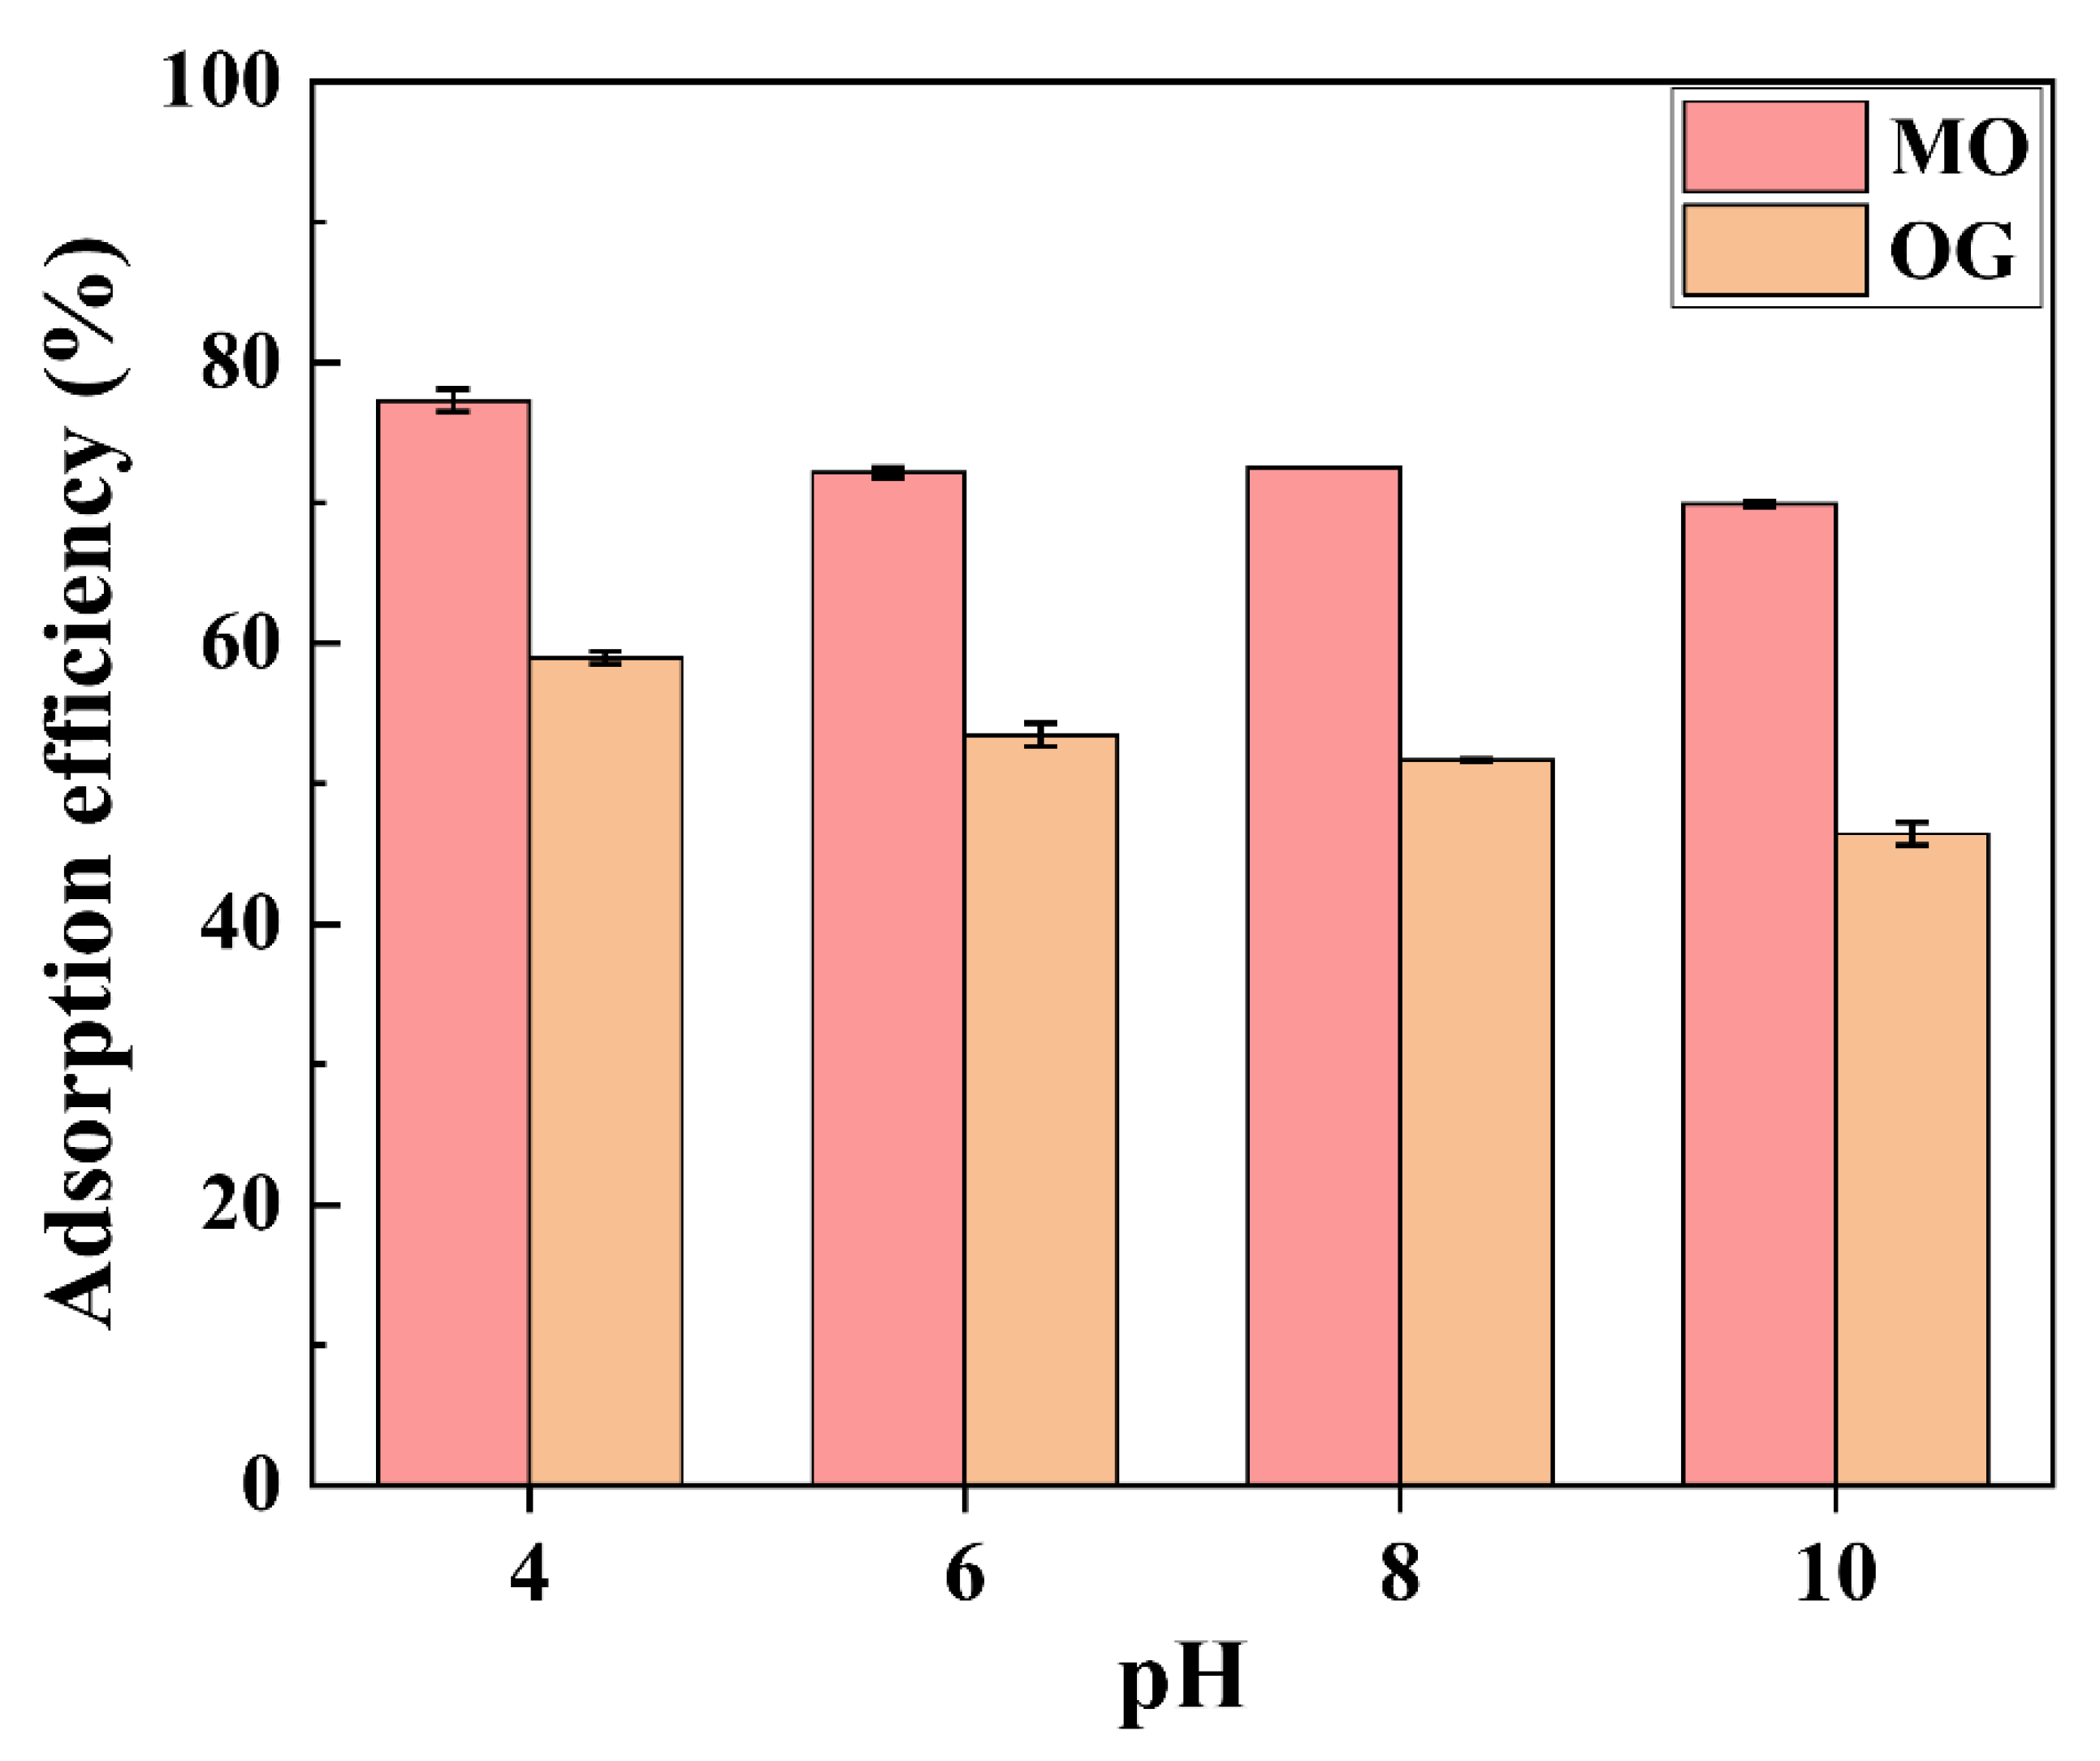
To evaluate the dye adsorption efficiency as a function of initial pH, the initial pH of the dye solution was adjusted to 4, 6, 8, and 10 by adding NaOH and HCl. In the case of MO (Figure 7), the adsorption efficiency of the prepared ACOP decreased gradually (around 10%) from 77.2% (pH 4) to 69.9% (pH 10). In the case of OG, the adsorption efficiency of the prepared ACOP decreased from 58.9% to 46.4% (approximately 22%). The changes in the surface charge of ACOP could be attributed to this decrease in adsorption efficiency at high pH (pH 10). According to the results of zeta potential analysis (Figure 4), the prepared ACOP exhibited a negative surface charge above pHpzc (pH 8.26). Notably, the adsorption efficiency of ACOP for the anionic dyes, MO and OG, was affected by the surface charge of ACOP because of the charge–charge interaction between ACOP and dye molecules. Nonetheless, the ACOP exhibited fairly high adsorption efficiencies of 46–69% at pH 10, even though the adsorbent and the dyes had opposing charges. This result indicates that the adsorption proceeded through charge–charge interaction. In addition, on the basis of the structure of ACOP, π-π interaction between the benzene and triazine rings of the dye molecules and the ACOP, respectively, may have accounted for some of the adsorption. π-π interactions between aromatics can occur over a wide pH range because the π-electrons on the ACOP and the dye molecules are unaffected by pH [70]. Moreover, π-π interactions occur between the electron-deficient surface of the triazine ring in the ACOP and the electron-rich surface of benzene in the anionic dye molecules, which facilitates the adsorption of dye molecules on ACOP even when the surface of ACOP is negatively charged.

3.5. Adsorption Experiments in Mixed-Dye System and Real Water Sample

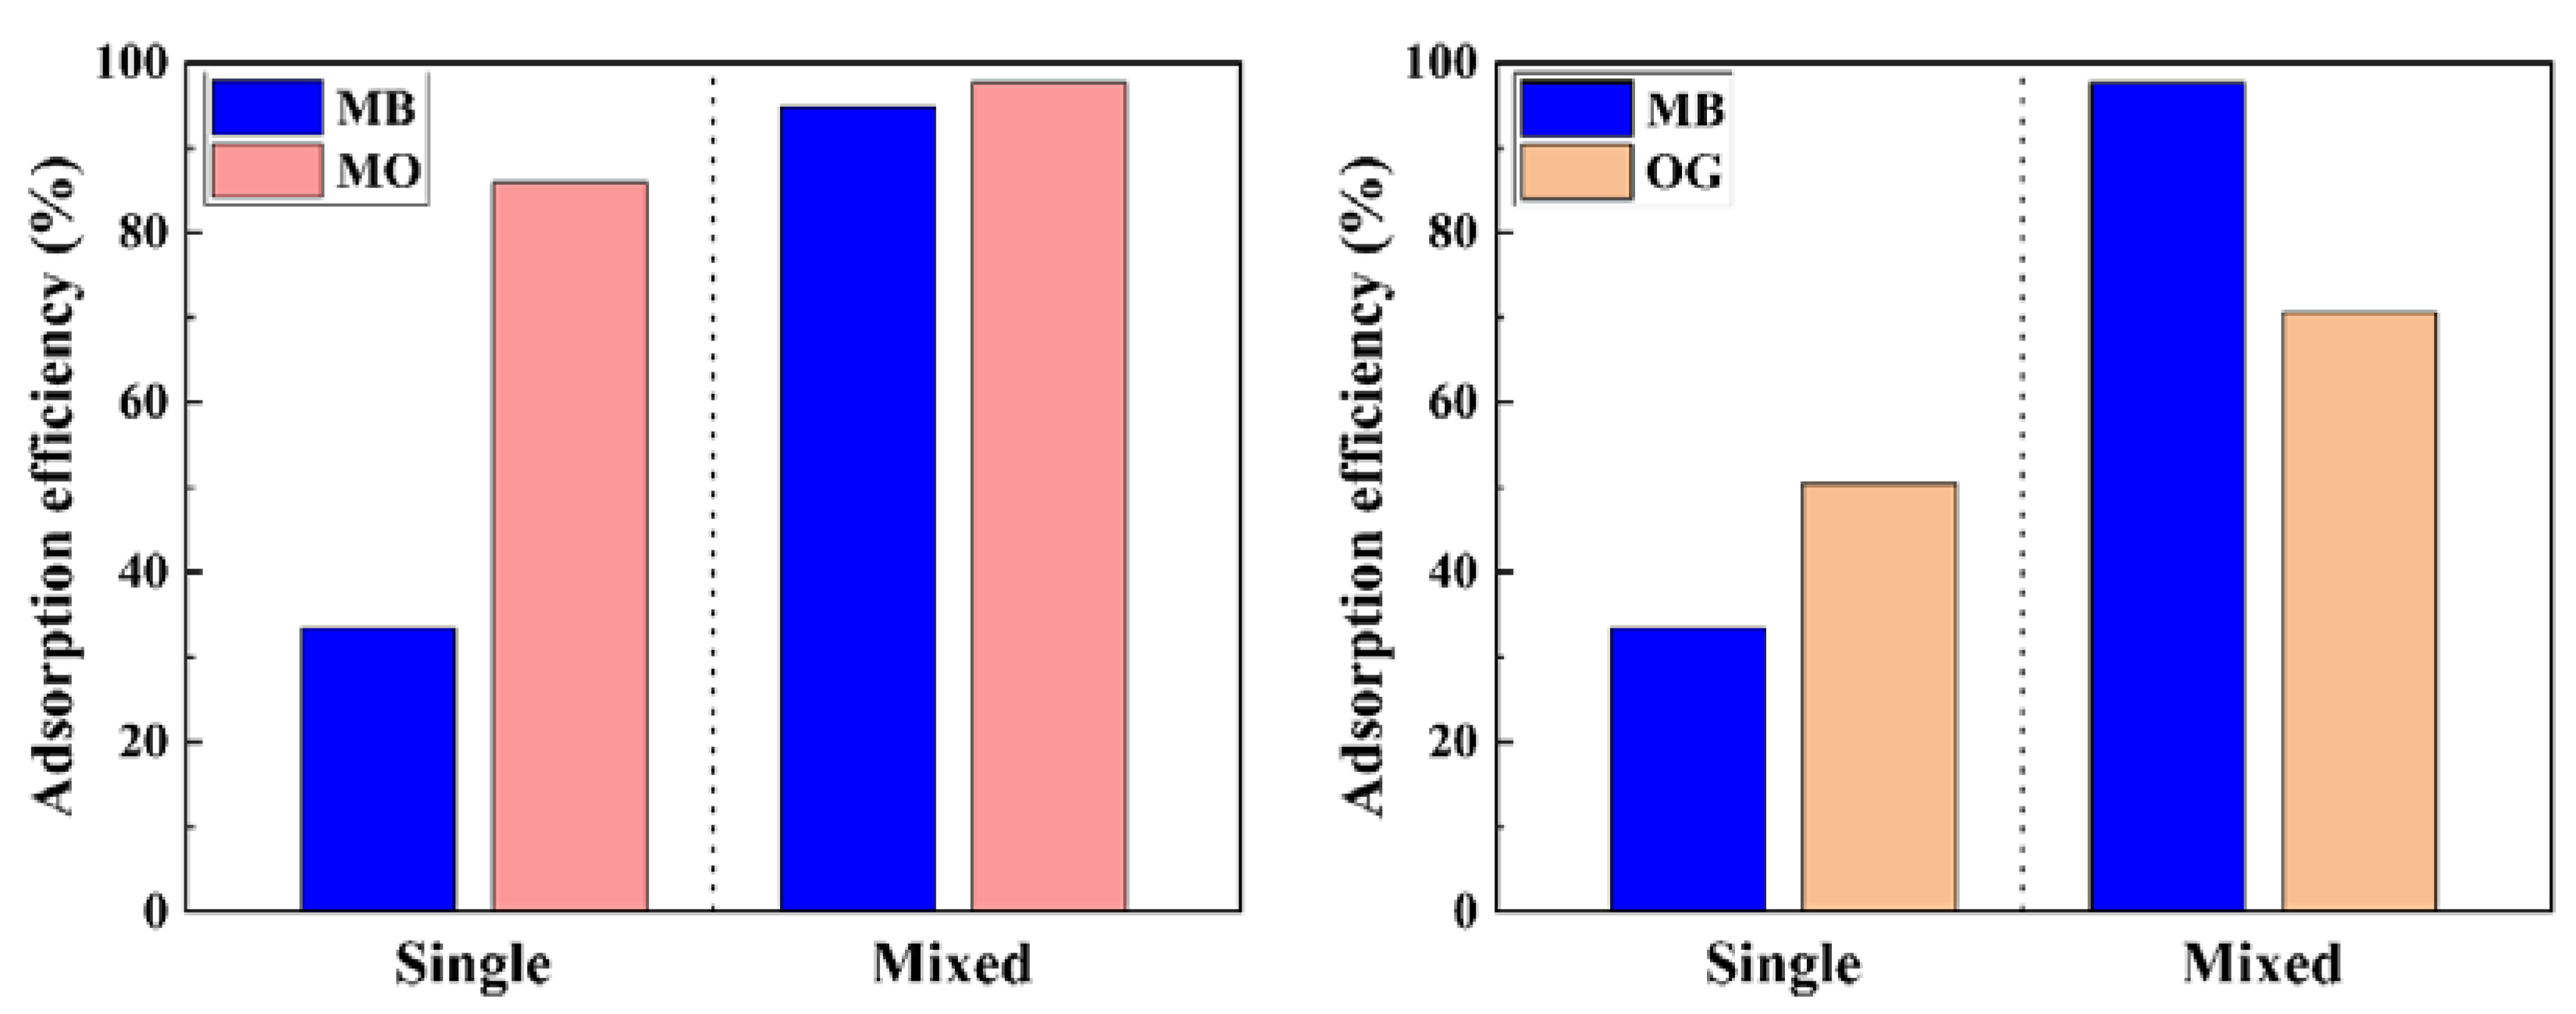
To investigate the selective anionic dye adsorption of ACOP in a mixed-dye system, MB was selected as a cationic dye and mixed with MO (MB + MO) and OG (MB + OG) (Figure 8). In the MB solution, the adsorption efficiency of ACOP was approximately 33.4% despite the negative charge of MB. This result might be ascribed to the ACOP structure comprising two aromatic rings and a central heterocyclic, which facilitates adsorption on ACOP through π-π interactions. The prepared ACOP exhibited enhanced dye adsorption efficiency in the mixed-dye solution, not only for MO and OG but also for MB. When MO was mixed with MB, the adsorption efficiencies of the prepared ACOP were 2.8 times and 1.1 times higher than those in the MB and MO single-dye systems, respectively. Moreover, in the MB + OG system, the adsorption efficiency of the prepared ACOP was 2.9 and 1.4 times higher than it was for MB and OG, respectively. These results indicated that the adsorption of MO and OG on the prepared ACOP did not compete with that of the cationic dye MB; instead, a synergistic effect was observed. According to Shirazi et al., the adsorption efficiency of bentonite for a mixed-dye solution (Basic Violet 16 (BV16) and Reactive Red 195 (RR19)) was higher than that for the individual single-dye systems because the positively charged quaternized nitrogen atoms of BV16 induced a positive surface charge, allowing the RR19 molecules to form ion pairs that influenced the coating or layer-formation process [71]. As mentioned above, the positively charged quaternized nitrogen in MB facilitates the adsorption of anionic dyes (MO and OG).
To evaluate the effect of interference by coexisting ions in water, the adsorption experiment was further conducted in DI and tap water, as shown in Figure S3. According to the report about the tap water quality issued by the Seoul Metropolitan Waterworks in 2021, the tap water included various ions such as Na+, Mg2+, K+, SO42−, and Cl (TDS = 125 mg/L). The removal efficiencies of MO and OG decreased by only around 9% and 16%, respectively. The decrease in removal efficiency was due to the competitive adsorption between dye molecules and coexisting anions towards the active sites.

3.6. Adsorption Mechanism

In the dye adsorption experiments, ACOP exhibited effective anionic dye adsorption efficiency in the presence and absence of cationic dye molecules. The characteristic aromatic rings and the heterocyclic ring of the ACOP facilitated the adsorption of dye molecules, regardless of the surface charge of the ACOP and the dye molecules. To investigate the detailed adsorption mechanism of the prepared ACOP, FT-IR and XPS analyses were conducted (Figure 9, Table 4 and Figure S4). As depicted in Figure S4, the characteristic vibrations of ACOP were preserved, and new vibrations were observed at 2850, 1601, 1115, and 1028 cm−1 for MO and 1031 and 783 cm−1 for OG. These results imply that the dye molecules were successfully adsorbed on the ACOP surface and that the dye adsorption did not affect the structure of the prepared ACOP.
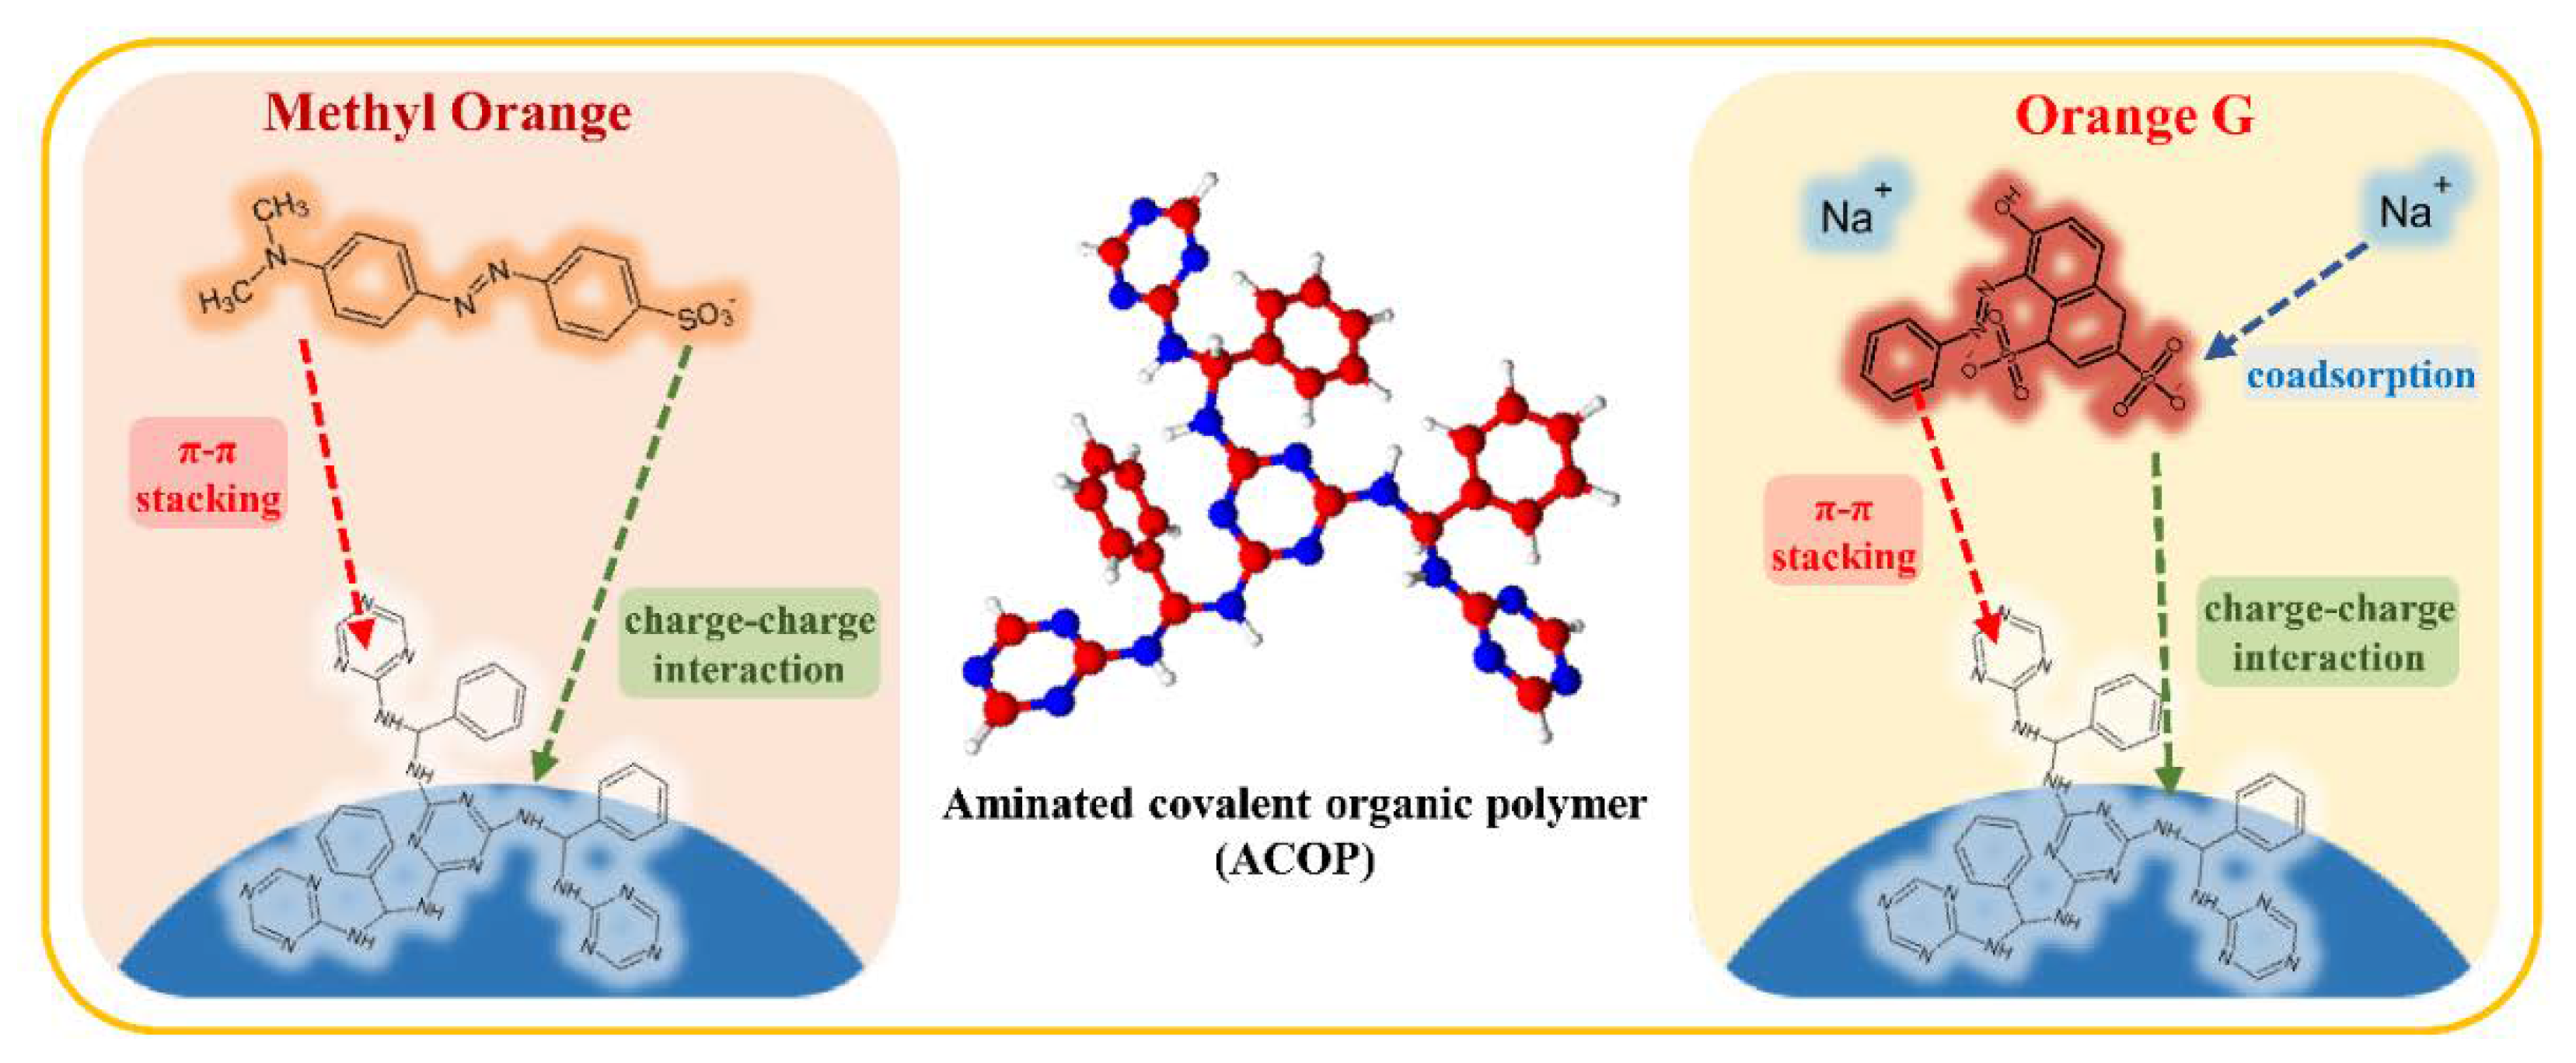
To obtain insights into the interactions between the prepared ACOP and the anionic dye molecules, their C 1 s and N 1 s XPS spectra were recorded and analyzed (Figure 9 and Table 4). The peaks attributed to π-π* transition, C=N, C-N, C=C, and C-C in the C 1 s spectrum were observed in similar regions after dye adsorption. However, the areas of these peaks changed by 2–11.5% after dye adsorption. Specifically, the areas of the peaks attributed to the carbon atoms in the benzene ring and π-π* transition in the triazine ring decreased after dye adsorption, while the areas of the peaks attributed to C=N and C-N increased. These findings could be ascribed to the fact that dye adsorption on the prepared ACOP proceeded through charge–charge interaction by nitrogen atoms, and π-π interaction could be affected by the benzene and triazine rings of ACOP (Figure 10). In the N 1 s spectrum, the areas of the peaks at around 399 eV, which were attributed to C-N=C and N=N, increased by 68–72%. By contrast, the areas of the peaks attributed to π-excitation and C-N decreased from 8.7% to 3.4–3.9% and from 65.1% to 50.7–52.6%, respectively. This result might be attributed to the charge–charge and π-π interactions between the dye molecules and the prepared ACOP.

4. Conclusions

The ACOPs were prepared by means of a catalyst-free Schiff base reaction involving terephthalaldehyde and melamine. The FT-IR spectra, XPS spectra, and N2 adsorption-desorption hysteresis loop indicated that ACOP with a high specific surface area (582.07 m2/g) and average pore size of 88.71 Å was successfully synthesized. Furthermore, the surface charge of the ACOP was shifted from +21.85 mV to −16.23 mV in the pH range of 4–10, and the pHpzc was determined to be pH 8.26. The prepared ACOP exhibited rapid adsorption on MO and OG within 1 min. According to the intraparticle diffusion model, the single-step rapid adsorption of the anionic dyes on ACOP can be attributed to the high specific area and dispersibility of ACOP. According to the Langmuir isotherm model, the maximum adsorption capacities (qm) of ACOP were 351.9 and 227.9 mg/g for MO and OG, respectively; these values are considerably higher than those of other well-known adsorbents. According to the dye adsorption results as a function of pH in the presence/absence of cationic dye (MB), dye adsorption on the prepared ACOP occurred through charge–charge and π-π interactions. Furthermore, the presence of cationic dye enhanced the dye adsorption capacity, owing to the synergistic effect of the positively charged quaternized nitrogen atoms. The FT-IR and XPS spectra of the prepared ACOP after dye adsorption indicated that adsorption occurred through charge–charge and π-π interactions. The outstanding rapid adsorption and high adsorption efficiency of ACOP over a wide pH range and in the presence of cationic dye make it possible to use ACOP for environmental remediation, especially in aqueous systems. Further studies, including recycling tests, applicability to different organic pollutants, and column operation of granulated ACOP will be beneficial to enhance the practical relevance of ACOP in environmental remediation.

Supplementary Materials

The following supporting information can be downloaded at: https://www.mdpi.com/article/10.3390/app13042043/s1, Figure S1: Dye adsorption kinetics fitted using the intraparticle diffusion model, Table S1: Intraparticle diffusion model parameters of ACOP for MO and OG, Figure S2: Zeta-potential distribution graphs of ACOP after MO and OG adsorption, Figure S3: The influence of coexisting ions of MO and OG adsorption by ACOP, Figure S4: FT-IR spectra of dye molecules, ACOP, and ACOP after dye adsorption.

Author Contributions

Conceptualization, T.-H.K. and Y.H.; methodology, J.P. and S.K.; validation, T.-H.K. and Y.P.; formal analysis, J.P. and S.K.; investigation, J.P. and S.K.; resources, Y.H.; data curation, T.-H.K., Y.P. and S.K.; writing—original draft preparation, J.P., S.K. and T.-H.K.; writing—review and editing, T.-H.K., Y.P. and Y.H.; visualization, J.P.; supervision, T.-H.K. and Y.H.; project administration, Y.H.; funding acquisition, Y.H. All authors have read and agreed to the published version of the manuscript.

Funding

This study was financially supported by Seoul National University of Science and Technology.

Data Availability Statement

The data presented in this study are available on request from the corresponding author.

Conflicts of Interest

The authors declare no conflict of interest.

References

  1. Dashtian, K.; Porhemat, S.; Rezvani, A.R.; Ghaedi, M.; Sabzehmeidani, M.M. Adsorption of semisoft pollutants onto Bi2S3/Ag2S-AC under the influence of ultrasonic waves as external filed. J. Ind. Eng. Chem. 2018, 60, 390–400. [Google Scholar] [CrossRef]
  2. Tuzen, M.; Sarı, A.; Saleh, T.A. Response surface optimization, kinetic and thermodynamic studies for effective removal of rhodamine B by magnetic AC/CeO2 nanocomposite. J. Environ. Manag. 2018, 206, 170–177. [Google Scholar] [CrossRef] [PubMed]
  3. Afshari, M.; Dinari, M.; Moradi, H.; Noori, Z. Polyaniline/sulfonated-covalent organic polymer nanocomposite: Structural and dye adsorption properties. Polym. Adv. Technol. 2020, 31, 2433–2442. [Google Scholar] [CrossRef]
  4. Pearce, C.I.; Lloyd, J.R.; Guthrie, J.T. The removal of colour from textile wastewater using whole bacterial cells: A review. Dyes Pigment. 2003, 58, 179–196. [Google Scholar] [CrossRef]
  5. Gupta, V.K.; Kumar, R.; Nayak, A.; Saleh, T.A.; Barakat, M.A. Adsorptive removal of dyes from aqueous solution onto carbon nanotubes: A review. Adv. Colloid Interface Sci. 2013, 193–194, 24–34. [Google Scholar] [CrossRef]
  6. Jejurkar, V.P.; Yashwantrao, G.; Saha, S. Tröger’s base functionalized recyclable porous covalent organic polymer (COP) for dye adsorption from water. New, J. Chem. 2020, 44, 12331–12342. [Google Scholar] [CrossRef]
  7. Türgay, O.; Ersöz, G.; Atalay, S.; Forss, J.; Welander, U. The treatment of azo dyes found in textile industry wastewater by anaerobic biological method and chemical oxidation. Sep. Purif. Technol. 2011, 79, 26–33. [Google Scholar] [CrossRef]
  8. Hassan, M.M.; Carr, C.M. A critical review on recent advancements of the removal of reactive dyes from dyehouse effluent by ion-exchange adsorbents. Chemosphere 2018, 209, 201–219. [Google Scholar] [CrossRef] [PubMed]
  9. Saruchi; Kumar, V.; Kaith, B.S.; Jindal, R. Synthesis of hybrid ion exchanger for Rhodamine B dye removal: Equilibrium, kinetic and thermodynamic studies. Ind. Eng. Chem. Res. 2016, 55, 10492–10499. [Google Scholar] [CrossRef]
  10. Paul, J.; Kadam, A.A.; Govindwar, S.P.; Kumar, P.; Varshney, L. An insight into the influence of low dose irradiation pretreatment on the microbial decolouration and degradation of Reactive Red-120 dye. Chemosphere 2013, 90, 1348–1358. [Google Scholar] [CrossRef] [PubMed]
  11. Njoku, V.O.; Foo, K.Y.; Asif, M.; Hameed, B.H. Preparation of activated carbons from rambutan (Nephelium lappaceum) peel by microwave-induced KOH activation for acid yellow 17 dye adsorption. Chem. Eng. J. 2014, 250, 198–204. [Google Scholar] [CrossRef]
  12. Gupta, V.K.; Gupta, B.; Rastogi, A.; Agarwal, S.; Nayak, A. A comparative investigation on adsorption performances of mesoporous activated carbon prepared from waste rubber tire and activated carbon for a hazardous azo dye—Acid Blue 113. J. Hazard. Mater. 2011, 186, 891–901. [Google Scholar] [CrossRef] [PubMed]
  13. Kyzas, G.Z.; Lazaridis, N.K.; Mitropoulos, A.C. Removal of dyes from aqueous solutions with untreated coffee residues as potential low-cost adsorbents: Equilibrium, reuse and thermodynamic approach. Chem. Eng. J. 2012, 189–190, 148–159. [Google Scholar] [CrossRef]
  14. Ho, Y.S.; McKay, G. Sorption of dyes and copper ions onto biosorbents. Process. Biochem. 2003, 38, 1047–1061. [Google Scholar] [CrossRef]
  15. Arulkumar, M.; Sathishkumar, P.; Palvannan, T. Optimization of Orange G dye adsorption by activated carbon of Thespesia populnea pods using response surface methodology. J. Hazard. Mater. 2011, 186, 827–834. [Google Scholar] [CrossRef]
  16. Kausar, A.; Iqbal, M.; Javed, A.; Aftab, K.; Nazli, Z.-i.-H.; Bhatti, H.N.; Nouren, S. Dyes adsorption using clay and modified clay: A review. J. Mol. Liq. 2018, 256, 395–407. [Google Scholar] [CrossRef]
  17. Brião, G.V.; Jahn, S.L.; Foletto, E.L.; Dotto, G.L. Highly efficient and reusable mesoporous zeolite synthetized from a biopolymer for cationic dyes adsorption. Colloid Surf. A-Physicochem. Eng. Asp. 2018, 556, 43–50. [Google Scholar] [CrossRef]
  18. Mohamed, M.G.; EL-Mahdy, A.F.M.; Meng, T.-S.; Samy, M.M.; Kuo, S.-W. Multifunctional hypercrosslinked porous organic polymers based on tetraphenylethene and triphenylamine derivatives for high-performance dye adsorption and supercapacitor. Polymers 2020, 12, 2426. [Google Scholar] [CrossRef]
  19. Kim, S.; Tang, K.; Kim, T.-H.; Hwang, Y. Selective removal of cationic organic pollutants using disulfide-linked polymer. Sep. Purif. Technol. 2022, 288, 120522. [Google Scholar] [CrossRef]
  20. Zhong, Y.; Chen, C.; Liu, S.; Lu, C.; Liu, D.; Pan, Y.; Sakiyama, H.; Muddassir, M.; Liu, J. A new magnetic adsorbent of eggshell-zeolitic imidazolate framework for highly efficient removal of norfloxacin. Dalton Trans. 2021, 50, 18016–18026. [Google Scholar] [CrossRef]
  21. Chernomorova, M.A.; Myakinina, M.S.; Zhinzhilo, V.A.; Uflyand, I.E. Analytical Determination of Cephalosporin Antibiotics Using Coordination Polymer Based on Cobalt Terephthalate as a Sorbent. Polymers 2023, 15, 548. [Google Scholar] [CrossRef]
  22. Puthiaraj, P.; Lee, Y.-R.; Zhang, S.; Ahn, W.-S. Triazine-based covalent organic polymers: Design, synthesis and applications in heterogeneous catalysis. J. Mater. Chem. A 2016, 4, 16288–16311. [Google Scholar] [CrossRef]
  23. Xiang, Z.; Cao, D.; Dai, L. Well-defined two dimensional covalent organic polymers: Rational design, controlled syntheses, and potential applications. Polym. Chem. 2015, 6, 1896–1911. [Google Scholar] [CrossRef]
  24. Peng, P.; Zhou, Z.; Guo, J.; Xiang, Z. Well-defined 2D covalent organic polymers for energy electrocatalysis. ACS Energy Lett. 2017, 2, 1308–1314. [Google Scholar] [CrossRef]
  25. Bhunia, S.; Deo, K.A.; Gaharwar, A.K. 2D covalent organic frameworks for biomedical applications. Adv. Funct. Mater. 2020, 30, 2002046. [Google Scholar] [CrossRef]
  26. Wang, J.; Zhuang, S. Covalent organic frameworks (COFs) for environmental applications. Coord. Chem. Rev. 2019, 400, 213046. [Google Scholar] [CrossRef]
  27. Song, W.; Zhang, M.; Huang, X.; Chen, B.; Ding, Y.; Zhang, Y.; Yu, D.G.; Kim, I. Smart l-borneol-loaded hierarchical hollow polymer nanospheres with antipollution and antibacterial capabilities. Mater. Today Chem. 2022, 26, 101252. [Google Scholar] [CrossRef]
  28. Tang, Y.; Varyambath, A.; Ding, Y.; Chen, B.; Huang, X.; Zhang, Y.; Yu, D.-g.; Kim, I.; Song, W. Porous organic polymers for drug delivery: Hierarchical pore structures, variable morphologies, and biological properties. Biomater. Sci. 2022, 10, 5369–5390. [Google Scholar] [CrossRef]
  29. Byun, J.; Patel, H.A.; Thirion, D.; Yavuz, C.T. Charge-specific size-dependent separation of water-soluble organic molecules by fluorinated nanoporous networks. Nat. Commun. 2016, 7, 13377. [Google Scholar] [CrossRef]
  30. Ko, D.; Lee, J.S.; Patel, H.A.; Jakobsen, M.H.; Hwang, Y.; Yavuz, C.T.; Hansen, H.C.B.; Andersen, H.R. Selective removal of heavy metal ions by disulfide linked polymer networks. J. Hazard. Mater. 2017, 332, 140–148. [Google Scholar] [CrossRef] [Green Version]
  31. Kong, K.; Cheng, B.; Liang, J.; Guo, Y.; Wang, R. The aminated covalent organic polymers for reversible removal of concurrent perfluorooctane sulfonate and dichromate. Chem. Eng. J. 2022, 446, 137343. [Google Scholar] [CrossRef]
  32. Schwab, M.G.; Fassbender, B.; Spiess, H.W.; Thomas, A.; Feng, X.; Müllen, K. Catalyst-free preparation of melamine-based microporous polymer networks through Schiff Base chemistry. J. Am. Chem. Soc. 2009, 131, 7216–7217. [Google Scholar] [CrossRef]
  33. Borisova, N.E.; Reshetova, M.D.; Ustynyuk, Y.A. Metal-free methods in the synthesis of Macrocyclic Schiff Bases. Chemical Reviews 2007, 107, 46–79. [Google Scholar] [CrossRef] [PubMed]
  34. Rezaei, F.; Dinari, M. Cu nanoparticles embedded in the porous organic polymer as highly effective catalysts for nitroaromatics reduction. Microporous Mesoporous Mater. 2021, 325, 111339. [Google Scholar] [CrossRef]
  35. Rezaei, F.; Dinari, M. Novel covalent organic polymer-supported Ag nanoparticles as a catalyst for nitroaromatics reduction. Colloid Surf. A-Physicochem. Eng. Asp. 2021, 618, 126441. [Google Scholar] [CrossRef]
  36. Zou, L.; Sun, Y.; Che, S.; Yang, X.; Wang, X.; Bosch, M.; Wang, Q.; Li, H.; Smith, M.; Yuan, S.; et al. Porous organic polymers for post-combustion carbon capture. Adv. Mater. 2017, 29, 1700229. [Google Scholar] [CrossRef] [PubMed]
  37. Guo, L.; Jia, S.; Diercks, C.S.; Yang, X.; Alshmimri, S.A.; Yaghi, O.M. Amidation, esterification, and thioesterification of a carboxyl-functionalized covalent organic framework. Angew. Chem.-Int. Edit. 2020, 59, 2023–2027. [Google Scholar] [CrossRef]
  38. Jiao, S.; Deng, L.; Zhang, X.; Zhang, Y.; Liu, K.; Li, S.; Wang, L.; Ma, D. Evaluation of an ionic porous organic polymer for water remediation. ACS Appl. Mater. Interfaces 2021, 13, 39404–39413. [Google Scholar] [CrossRef]
  39. Liu, X.; Pang, H.; Liu, X.; Li, Q.; Zhang, N.; Mao, L.; Qiu, M.; Hu, B.; Yang, H.; Wang, X. Orderly porous covalent organic frameworks-based materials: Superior adsorbents for pollutants removal from aqueous solutions. Innovation 2021, 2, 100076. [Google Scholar] [CrossRef]
  40. Lv, H.; Sa, R.; Li, P.; Yuan, D.; Wang, X.; Wang, R. Metalloporphyrin-based covalent organic frameworks composed of the electron donor-acceptor dyads for visible-light-driven selective CO2 reduction. Sci. China Chem. 2020, 63, 1289–1294. [Google Scholar] [CrossRef]
  41. Sun, Q.; Aguila, B.; Earl, L.D.; Abney, C.W.; Wojtas, L.; Thallapally, P.K.; Ma, S. Covalent organic frameworks as a decorating platform for utilization and affinity enhancement of chelating sites for radionuclide sequestration. Adv. Mater. 2018, 30, 1705479. [Google Scholar] [CrossRef] [PubMed]
  42. Weber, W.J.; Morris, J.C. Kinetics of adsorption on carbon from solution. J. Sanit. Eng. Div. 1963, 89, 31–59. [Google Scholar] [CrossRef]
  43. Langmuir, I. The adsorption of gases on plane surfaces of glass, mica and platinum. J. Am. Chem. Soc. 1918, 40, 1361–1403. [Google Scholar] [CrossRef]
  44. Freundlich, H. Über die adsorption in lösungen. Z. Für Phy. Chem. 1907, 57, 385–470. [Google Scholar] [CrossRef]
  45. Seoul Waterworks Authority. Report on Arisu Water Quality; Seoul Waterworks Authority: Seoul, Republic of Korea, 2021. [Google Scholar]
  46. Mircescu, N.E.; Oltean, M.; Chiş, V.; Leopold, N. FTIR, FT-Raman, SERS and DFT study on melamine. Vib. Spectrosc. 2012, 62, 165–171. [Google Scholar] [CrossRef]
  47. Shaygan, S.; Pasdar, H.; Foroughifar, N.; Davallo, M.; Motiee, F. Cobalt (II) complexes with Schiff Base ligands derived from terephthalaldehyde and ortho-substituted anilines: Synthesis, characterization and antibacterial activity. Appl. Sci. 2018, 8, 385. [Google Scholar] [CrossRef]
  48. Abbasi, A.; Gharib, M.; Najafi, M.; Janczak, J. Room temperature synthesis of a Zn(II) metal-organic coordination polymer for dye removal. J. Solid State Chem. 2016, 235, 12–17. [Google Scholar] [CrossRef]
  49. Kumar, S.; Lim, S.M.; Ramasamy, K.; Vasudevan, M.; Shah, S.A.A.; Narasimhan, B. Bis-pyrimidine acetamides: Design, synthesis and biological evaluation. Chem. Cent. J. 2017, 11, 80. [Google Scholar] [CrossRef]
  50. Qu, F.; Yan, H.; Li, K.; You, J.; Han, W. A covalent organic framework–MnO2 nanosheet system for determination of glutathione. J. Mater. Sci. 2020, 55, 10022–10034. [Google Scholar] [CrossRef]
  51. Yang, Q.; Yu, H.; He, Y.; Liu, Z.; Qin, C.; Liu, B.; Li, Y. Porous three-component hybrid hydrogen-bonded covalent organic polymers: Design, synthesis and ciprofloxacin adsorption. Eur. Polym. J. 2020, 123, 109445. [Google Scholar] [CrossRef]
  52. Thommes, M.; Kaneko, K.; Neimark, A.V.; Olivier, J.P.; Rodriguez-Reinoso, F.; Rouquerol, J.; Sing, K.S.W. Physisorption of gases, with special reference to the evaluation of surface area and pore size distribution (IUPAC Technical Report). Pure Appl. Chem. 2015, 87, 1051–1069. [Google Scholar] [CrossRef]
  53. Samarasinghe, S.A.S.C.; Chuah, C.Y.; Li, W.; Sethunga, G.S.M.D.P.; Wang, R.; Bae, T.-H. Incorporation of CoIII acetylacetonate and SNW-1 nanoparticles to tailor O2/N2 separation performance of mixed-matrix membrane. Sep. Purif. Technol. 2019, 223, 133–141. [Google Scholar] [CrossRef]
  54. Yan, H.; Yang, H.; Li, A.; Cheng, R. pH-tunable surface charge of chitosan/graphene oxide composite adsorbent for efficient removal of multiple pollutants from water. Chem. Eng. J. 2016, 284, 1397–1405. [Google Scholar] [CrossRef]
  55. Abdollahi, N.; Akbar Razavi, S.A.; Morsali, A.; Hu, M.-L. High capacity Hg(II) and Pb(II) removal using MOF-based nanocomposite: Cooperative effects of pore functionalization and surface-charge modulation. J. Hazard. Mater. 2020, 387, 121667. [Google Scholar] [CrossRef]
  56. Maneechakr, P.; Karnjanakom, S. Environmental surface chemistries and adsorption behaviors of metal cations (Fe3+, Fe2+, Ca2+ and Zn2+) on manganese dioxide-modified green biochar. RSC Adv. 2019, 9, 24074–24086. [Google Scholar] [CrossRef] [PubMed]
  57. Darmograi, G.; Prelot, B.; Layrac, G.; Tichit, D.; Martin-Gassin, G.; Salles, F.; Zajac, J. Study of adsorption and intercalation of Orange-type dyes into Mg–Al layered double hydroxide. J. Phys. Chem. C 2015, 119, 23388–23397. [Google Scholar] [CrossRef]
  58. Hameed, B.H.; Salman, J.M.; Ahmad, A.L. Adsorption isotherm and kinetic modeling of 2,4-D pesticide on activated carbon derived from date stones. J. Hazard. Mater. 2009, 163, 121–126. [Google Scholar] [CrossRef] [PubMed]
  59. Ren, X.; Shi, Y.; Zheng, H.; Zhang, Y.; Zuo, Q. A novel covalent organic polymer with hierarchical pore structure for rapid and selective trace Hg(II) removal from drinking water. Sep. Purif. Technol. 2022, 285, 120306. [Google Scholar] [CrossRef]
  60. Yao, Y.; Bing, H.; Feifei, X.; Xiaofeng, C. Equilibrium and kinetic studies of methyl orange adsorption on multiwalled carbon nanotubes. Chem. Eng. J. 2011, 170, 82–89. [Google Scholar] [CrossRef]
  61. Chen, S.; Zhang, J.; Zhang, C.; Yue, Q.; Li, Y.; Li, C. Equilibrium and kinetic studies of methyl orange and methyl violet adsorption on activated carbon derived from Phragmites australis. Desalination 2010, 252, 149–156. [Google Scholar] [CrossRef]
  62. Ni, Z.-M.; Xia, S.-J.; Wang, L.-G.; Xing, F.-F.; Pan, G.-X. Treatment of methyl orange by calcined layered double hydroxides in aqueous solution: Adsorption property and kinetic studies. J. Colloid Interface Sci. 2007, 316, 284–291. [Google Scholar] [CrossRef] [PubMed]
  63. Xu, S.-X.; Yao, Z.-Q.; Zhang, Y.-H. A covalent organic framework exhibiting amphiphilic selective adsorption toward ionic organic dyes tuned by pH value. Eur. Polym. J. 2020, 133, 109764. [Google Scholar] [CrossRef]
  64. Wang, S.; Meng, X.; Luo, H.; Yao, L.; Song, X.; Liang, Z. Post-synthetic modification of conjugated microporous polymer with imidazolium for highly efficient anionic dyes removal from water. Sep. Purif. Technol. 2022, 284, 120245. [Google Scholar] [CrossRef]
  65. Liu, B.; Liu, M.; Xie, Z.; Li, Y.; Zhang, A. Performance of defective Zr-MOFs for the adsorption of anionic dyes. J. Mater. Sci. 2022, 57, 5438–5455. [Google Scholar] [CrossRef]
  66. Benselka-Hadj Abdelkader, N.; Bentouami, A.; Derriche, Z.; Bettahar, N.; de Ménorval, L.C. Synthesis and characterization of Mg–Fe layer double hydroxides and its application on adsorption of Orange G from aqueous solution. Chem. Eng. J. 2011, 169, 231–238. [Google Scholar] [CrossRef]
  67. Zhang, L.; Cheng, Z.; Guo, X.; Jiang, X.; Liu, R. Process optimization, kinetics and equilibrium of orange G and acid orange 7 adsorptions onto chitosan/surfactant. J. Mol. Liq. 2014, 197, 353–367. [Google Scholar] [CrossRef]
  68. Wang, T.; Zhao, P.; Lu, N.; Chen, H.; Zhang, C.; Hou, X. Facile fabrication of Fe3O4/MIL-101(Cr) for effective removal of acid red 1 and orange G from aqueous solution. Chem. Eng. J. 2016, 295, 403–413. [Google Scholar] [CrossRef]
  69. Hsini, A.; Essekri, A.; Aarab, N.; Laabd, M.; Ait Addi, A.; Lakhmiri, R.; Albourine, A. Elaboration of novel polyaniline@Almond shell biocomposite for effective removal of hexavalent chromium ions and Orange G dye from aqueous solutions. Environ. Sci. Pollut. Res. 2020, 27, 15245–15258. [Google Scholar] [CrossRef]
  70. Ahmed, I.; Lee, H.J.; Jhung, S.H. Covalent-organic polymer-derived carbons: An effective adsorbent to remove sulfonamide antibiotics from water. Chem. Eng. J. 2022, 437, 135386. [Google Scholar] [CrossRef]
  71. Khalilzadeh Shirazi, E.; Metzger, J.W.; Fischer, K.; Hassani, A.H. Removal of textile dyes from single and binary component systems by Persian bentonite and a mixed adsorbent of bentonite/charred dolomite. Colloid Surf. A-Physicochem. Eng. Asp. 2020, 598, 124807. [Google Scholar] [CrossRef]
Scheme 1. Schematic reaction of aminated COP synthesis (ACOP).
Applsci 13 02043 sch001
Figure 1. FT-IR spectra of terephthalaldehyde, melamine, and ACOP (left). XPS spectra on C 1 s (right top) and N 1 s (right bottom) of ACOP.
Applsci 13 02043 g001
Figure 2. SEM images of prepared ACOP.
Applsci 13 02043 g002
Figure 3. N2 adsorption-desorption hysteresis loop of the prepared ACOP.
Applsci 13 02043 g003
Figure 4. Point of zero charge (PZC) of the prepared ACOP.
Applsci 13 02043 g004
Figure 5. Dye adsorption experiment results of MO and OG on ACOP as a function of contact time and amount of adsorbent (initial dye concentration: 100 mg/L, initial adsorbent concentration: 0.25–1.0 g/L, and contact time: 180 min).
Applsci 13 02043 g005
Figure 6. Adsorption isotherms of MO and OG fitted using the Langmuir (red line) and Freundlich (blue line) isotherm models (initial MO concentration: 200–350 mg/L, initial OG concentration: 80–350 mg/L, initial adsorbent concentration: 2.0 g/L, and contact time: 180 min).
Applsci 13 02043 g006
Figure 7. Anionic dye adsorption efficiency of ACOP as a function of initial pH (initial dye concentration: 100 mg/L, initial adsorbent concentration: 2.0 g/L, initial pH: 4, 6, 8, and 10, and contact time: 1440 min).
Applsci 13 02043 g007
Figure 8. Adsorption efficiency of ACOP in mixed-dye system (MB+MO and MB+CV) (initial dye concentration: 100 mg/L, mixed-dye system: 1:1 v/v%, initial adsorbent concentration: 2.0 g/L, and contact time: 1440 min).
Applsci 13 02043 g008
Figure 9. XPS spectra in the C 1 s and N 1 s regions of ACOP after MO and OG adsorption.
Applsci 13 02043 g009
Figure 10. Schematic illustration of suggested interaction between ACOP and dye molecules.
Applsci 13 02043 g010
Table 1. Chemical properties of dye molecules.
Chemical
Name
Chemical
Formula
Molecular
Weight
(g/mol)
pKa
(25 °C)
log KowChemical Structure
Anionic dyeMethyl OrangeC14H14N3NaO3S327.334.3−0.66Applsci 13 02043 i001
Orange GC16H10N2Na2O7S2452.3811.5 (−OH)
1.0 (−SO3H)
−4.56Applsci 13 02043 i002
Cationic dyeMethylene BlueC16H18ClN3S319.853.80.75Applsci 13 02043 i003
Table 2. Detailed parameters obtained from the adsorption isotherms fitted using Langmuir and Freundlich isotherm models.
ModelsLangmuirFreundlich
Parameterqm (mg/g)aL (L/mg)R2KFnR2
MO351.90.08060.834197.343.7530.9510
OG227.90.04980.717043.593.0720.9293
Table 3. Summarized maximum adsorption capacities (qm) of various dyes on different adsorbents.
AdsorbentDyeDosing
(g/L)
Initial Concentration
(mg/L)
Contact Time
(min)
qm
(mg/g)
Ref.
Carbon nanotubesMethyl orange0.32018035.4–64.7[60]
Activated carbon0.525–75350238.1[61]
ZnAl-LDO0.5100120200.0[62]
Benzodiimidazole-COF1.0-160256[63]
CMP-Im0.25100–600720588[64]
MOF-8080.2-240540[65]
ACOP1.0180–350180351.9This study
MgFe-LDOOrange G1.050–8001440378.8[66]
Activated clay0.2400300128.6[67]
Fe3O4/MIL-101(Cr)0.640–80120200.0[68]
MOF-8080.2-240197[65]
PANI@AS biocomposites0.510–500120191.0[69]
ACOP1.080–350180227.9This study
Table 4. C 1 s and N 1 s peak information obtained from XPS spectra of the prepared ACOP before and after dye adsorption.
ACOPC 1 sN 1 s
π-π* transitionC=NC-NC=CC-Cπ-excitationC-NC-N=C
N=N
Peak position
(eV)
293.4287.8286.3285.3284.8405.2400.4399.1
Area(%)5.4158.125.957.93.22.588.6565.0926.26
ACOP-MOC 1 sN 1 s
π-π* transitionC=NC-NC=CC-Cπ-excitationC-NC-N=C
N=N
Peak position
(eV)
292.5287.8286.3285.3284.8405.2400.4399.1
Area
(%)
2.7759.2717.403.6116.953.9050.7445.36
ACOP-OGC 1 sN 1 s
π-π* transitionC=NC-NC=CC-Cπ-excitationC-NC-N=C
N=N
Peak position
(eV)
293.4287.8286.2285.4284.8405.0399.4398.4
Area
(%)
2.0167.909.432.5418.123.4152.5944.01
Disclaimer/Publisher’s Note: The statements, opinions and data contained in all publications are solely those of the individual author(s) and contributor(s) and not of MDPI and/or the editor(s). MDPI and/or the editor(s) disclaim responsibility for any injury to people or property resulting from any ideas, methods, instructions or products referred to in the content.