Article

Blind People: Clothing Category Classification and Stain Detection Using Transfer Learning

1
Algoritmi Research Centre/LASI, University of Minho, 4800-058 Guimarães, Portugal
2
2Ai, School of Technology, Polytechnic Institute of Cávado and Ave, 4750-810 Barcelos, Portugal
3
INL—International Nanotechnology Laboratory, 4715-330 Braga, Portugal
*
Authors to whom correspondence should be addressed.
Appl. Sci. 2023, 13(3), 1925; https://doi.org/10.3390/app13031925
Submission received: 22 December 2022 / Revised: 19 January 2023 / Accepted: 31 January 2023 / Published: 2 February 2023
(This article belongs to the Section Mechanical Engineering)

Abstract

:
The ways in which people dress, as well as the styles that they prefer for different contexts and occasions, are part of their identity. Every day, blind people face limitations in identifying and inspecting their garments, and dressing can be a difficult and stressful task. Taking advantage of the great technological advancements, it becomes of the utmost importance to minimize, as much as possible, the limitations of a blind person when choosing garments. Hence, this work aimed at categorizing and detecting the presence of stains on garments, using artificial intelligence algorithms. In our approach, transfer learning was used for category classification, where a benchmark was performed between convolutional neural networks (CNNs), with the best model achieving an F1 score of 91%. Stain detection was performed through the fine tuning of a deep learning object detector, i.e., the mask R (region-based)-CNN. This approach is also analyzed and discussed, as it allowed us to achieve better results than those available in the literature.

1. Introduction

Vision is one of the senses that dominates our lives. It allows us to form perceptions of the surrounding world and give meaning to objects, concepts, ideas, and tastes [1]. Therefore, any type of visual loss can have a great impact on our daily routines, significantly affecting even the simplest tasks in our day-to-day habits. Vision loss can be sudden and severe, or the result of a gradual deterioration, where objects at great distances become increasingly difficult to see. Therefore, the wording “vision impairment” encompasses all conditions in which vision deficiency exists [2]. The individual who is born with the sense of sight and later loses it stores visual memories and can remember images, lights, and colors. This particularity is of the highest importance for re-adaptation. On the other hand, those who are born without the capacity of seeing can never form or possess visual memories. For both cases, clothing represents a demanding challenge.
Recently, there has been an increasing focus on assistive technology for people with visual impairments and blindness, aiming at improving mobility, navigation, and object recognition [3,4,5]. Despite the high technology already available, some gaps remain, particularly in the area of aesthetics and image.
The ways in which we dress and the styles that we prefer for different occasions are part of our identity [6]. Blind people do not have this sense, and dressing can be a difficult and stressful task. Taking advantage of the unprecedented technological advancements of recent years, it becomes essential to minimize the key limitations of a blind person when it comes to managing garments. Not knowing the colors, the types of patterns, or even the state of garments makes dressing a daily challenge. Moreover, it is important to keep in mind that blind people are more likely to have stains on their clothes, as they face more challenges in handling objects and performing simple tasks, such as eating, cleaning and painting surfaces, and leaning against dirty surfaces, among others. In these situations, most of the time, when we involuntarily drop something on our clothes that causes a stain, we immediately attempt to clean it, as we know that the longer we take to clean it, the greater the difficulty in removing the stain later—something that might happen more often with blind people.
Despite the already available cutting-edge technology and smart devices, some aspects of aesthetics and image still remain barely explored. This was the fundamental issue behind the motivation for this work—namely, how to enable blind people to feel equally satisfied with what they wear, functional, and without needing help. The scope of this research follows the previous work of the authors [7,8,9,10], as, through image processing techniques, it is possible to help blind people to choose their clothing and to manage their wardrobes.
In short, this work mainly contributes to the field with (i) the listing of relevant techniques used in image recognition for the identification of clothing items and for the detection of stains on garments; (ii) an annotated dataset of clothing stains, which could be later increased by new research; and (iii) a benchmark between different deep learning networks. The outcomes of this work are also foreseen to be implemented in a mobile application already identified as a preferred choice in a survey conducted with all departments of the Association of the Blind and Amblyopes of Portugal (ACAPO) [11].
Following the model approach already identified by the authors [12], the scope of the research presented here is focused on the algorithm for clothing category classification and stain detection. Alongside this, a mobile application and a mechatronic system, i.e., an automatic wardrobe, will complement all presented algorithms and methodology [13]. Taking advantage of the partnership with ACAPO and with the Association of Support for the Visually Impaired of Braga (AADVDB), the developed work was validated and opportunities for future improvements were identified. In the five upcoming sections, related work is described (Section 2), the methodology is explained (Section 3), experiments are described (Section 4) and the main conclusions and future work are finally presented (Section 5).

2. Related Work

In the last few years, deep learning techniques have arisen as a great method to solve problems in computer vision, such as image classification, object detection, face recognition and language processing, where convolutional neural networks (CNNs) play an imperative role [14].
The convolutional neural networks (CNNs) have exhibited excellent results and advances in image recognition since 2012 (CNNs) [15,16], when AlexNet [17] was introduced in the ImageNet Large Scale Visual Recognition Challenge (ILSVRC) [18,19]. The ImageNet competition consists of evaluating several algorithms for large-scale object detection and image classification, allowing researchers to compare detection across a variety of object classes. In recent years, several CNNs have been presented, such as VGG [20], GoogLeNet [21], SqueezeNet [22], Inception [23], ResNet [24], ShuffleNet [25], MobileNet [26,27], EfficientNet [28] and RegNet [29], among others, using these networks for different image classification problems.
In line with this premise, some researchers turned to the fashion world, making use of the more recent advances in computer vision to explore diverse areas such as fashion detection, fashion analysis and fashion recommendations, achieving promising results [30]. Based on the scope of the conducted research, only fashion classification is covered in this work. A quick literature survey allowed the identification of several works that have attempted to handle the classification of fashion images. Most of the authors evaluate their models based on top k accuracy regarding clothing attribute recognition, normally with top 3 and top 5 scores, which means that the correct label is among the top k predicted labels.
The research of Chen et al. [31] presented a network for describing people based on fine-grained clothing attributes, with an accuracy of 48.32%. Similarly, Liu et al. [32] introduced FashionNet, which learns clothing features by jointly predicting clothing attributes and landmarks. Predicted landmarks are used to pool or gate the learned feature maps. The authors reported a top 3 classification accuracy score of 93.01% and a top 5 score of 97.01%. Another method to detect fashion items in a given image using deep convolutional neural networks (CNN), with a mean Average Precision (mAP) of 31.1%, was performed by Hara et al. [33]. Likewise, Corbière et al. [34] proposed another method based on weakly supervised learning for classifying e-commerce products, presenting a top 3 category accuracy score of 86.30% and a top 5 accuracy score of 92.80%. Later, Wang et al. [35] proposed a fashion network to address fashion landmark detection and category classification with the introduction of intermediate attention layers for a better enhancement in clothing features, category classification and attribute estimation. In their work, accuracy scores of 90.99% and 95.75% were reported for top 3 and top 5, respectively. In another study by Li et al. [36], the authors presented a two-stream convolutional neural with one branch dedicated to landmark detection and the other one to category and attribute classification, allowing the model to learn the correlations among multiple tasks and consequently achieve improvements in the results. Accuracy scores of 93.01% and 97.01% for top 3 and top 5 were reported, respectively. A novel fashion classification model proposed by Cho et al. [37] improves the performance by taking into account the hierarchical dependences between class labels, reaching accuracy of 91.24% and 95.68% in top 3 and top 5, respectively. A multitask deep learning architecture was then proposed by Lu et al. [38] that groups similar tasks and promotes the creation of separated branches for unrelated tasks, with accuracy results of 83.24% and 90.39% for top 3 and top 5, respectively. Seo and Shin [39] proposed a Hierarchical Convolutional Neural Network (H-CNN) for fashion apparel classification. The authors demonstrated that hierarchical image classification could minimize the model losses and improve the accuracy, with a result of 93.3%. The research of Fengzi et al. [40] applied transfer learning using pertained models for automatically labeling uploaded photos in the e-commerce industry. The authors reported an accuracy value of 88.65%. Additionally, a condition convolutional neural network (CNN) was proposed by Kolisnik, Hogan and Zulkernine [41], based on branching convolutional neural networks. The proposed branching can predict the hierarchical labels of an image and the last label predicted in the hierarchy is reported with accuracy of 91.0%.
Table 1 summarizes the aforementioned works, including the used datasets.
Regarding the specific topic of stain detection, to the best of our knowledge, there are no relevant works available in the literature. Nonetheless, stain detection is an important sub-topic of defect detection in clothing and in the textile field; hence, considering a broader approach, i.e., defect detection in clothing and in the textile industry, some research works could be considered for comparative purposes.
C. Li et al. [42] recently developed a survey based on fabric defect detection in textile manufacturing, where learning-based algorithms (machine learning and deep learning) have been the most popular methods in recent years. The deep learning-based object detector is divided into one-stage detectors and two-stage detectors. One-stage detectors such as You Look Once (YOLO) [43] and the Single Shot Detector (SSD) [44] are faster but less accurate when compared with two-stage detectors, such as Faster R-CNN[45] and Mask R-CNN (region-based convolutional neural network) [46]. On the other hand, two-stage detectors are more accurate, but also slower. Thus, choosing an adequate algorithm is necessary for the envisioned application. Therefore, in the first stage, a more accurate detector was considered instead of a real-time need, since the detection of stains is affected by different sizes, aspects, and locations on clothes.
In sum, it is visible that there has been great effort to build efficient methods for fashion category classification. Moreover, the aforementioned works (Table 1) did not focus on developing systems to aid visually impaired people, and there is yet no solution capable of covering all the difficulties experienced by a blind person, namely an automatic system for clothing type identification and stain detection.

3. Methodology

In the pursuit of clothing type image classification and stain detection, a fundamental question arose: how can artificial intelligence enable the identification and inspection of clothing for blind people? The methodology implemented in this work aimed at answering this challenging question, and the dataset, deep learning techniques and evaluation metrics of the proposed solution are presented in the following sections.

3.1. Clothing Type Category Classification Methods

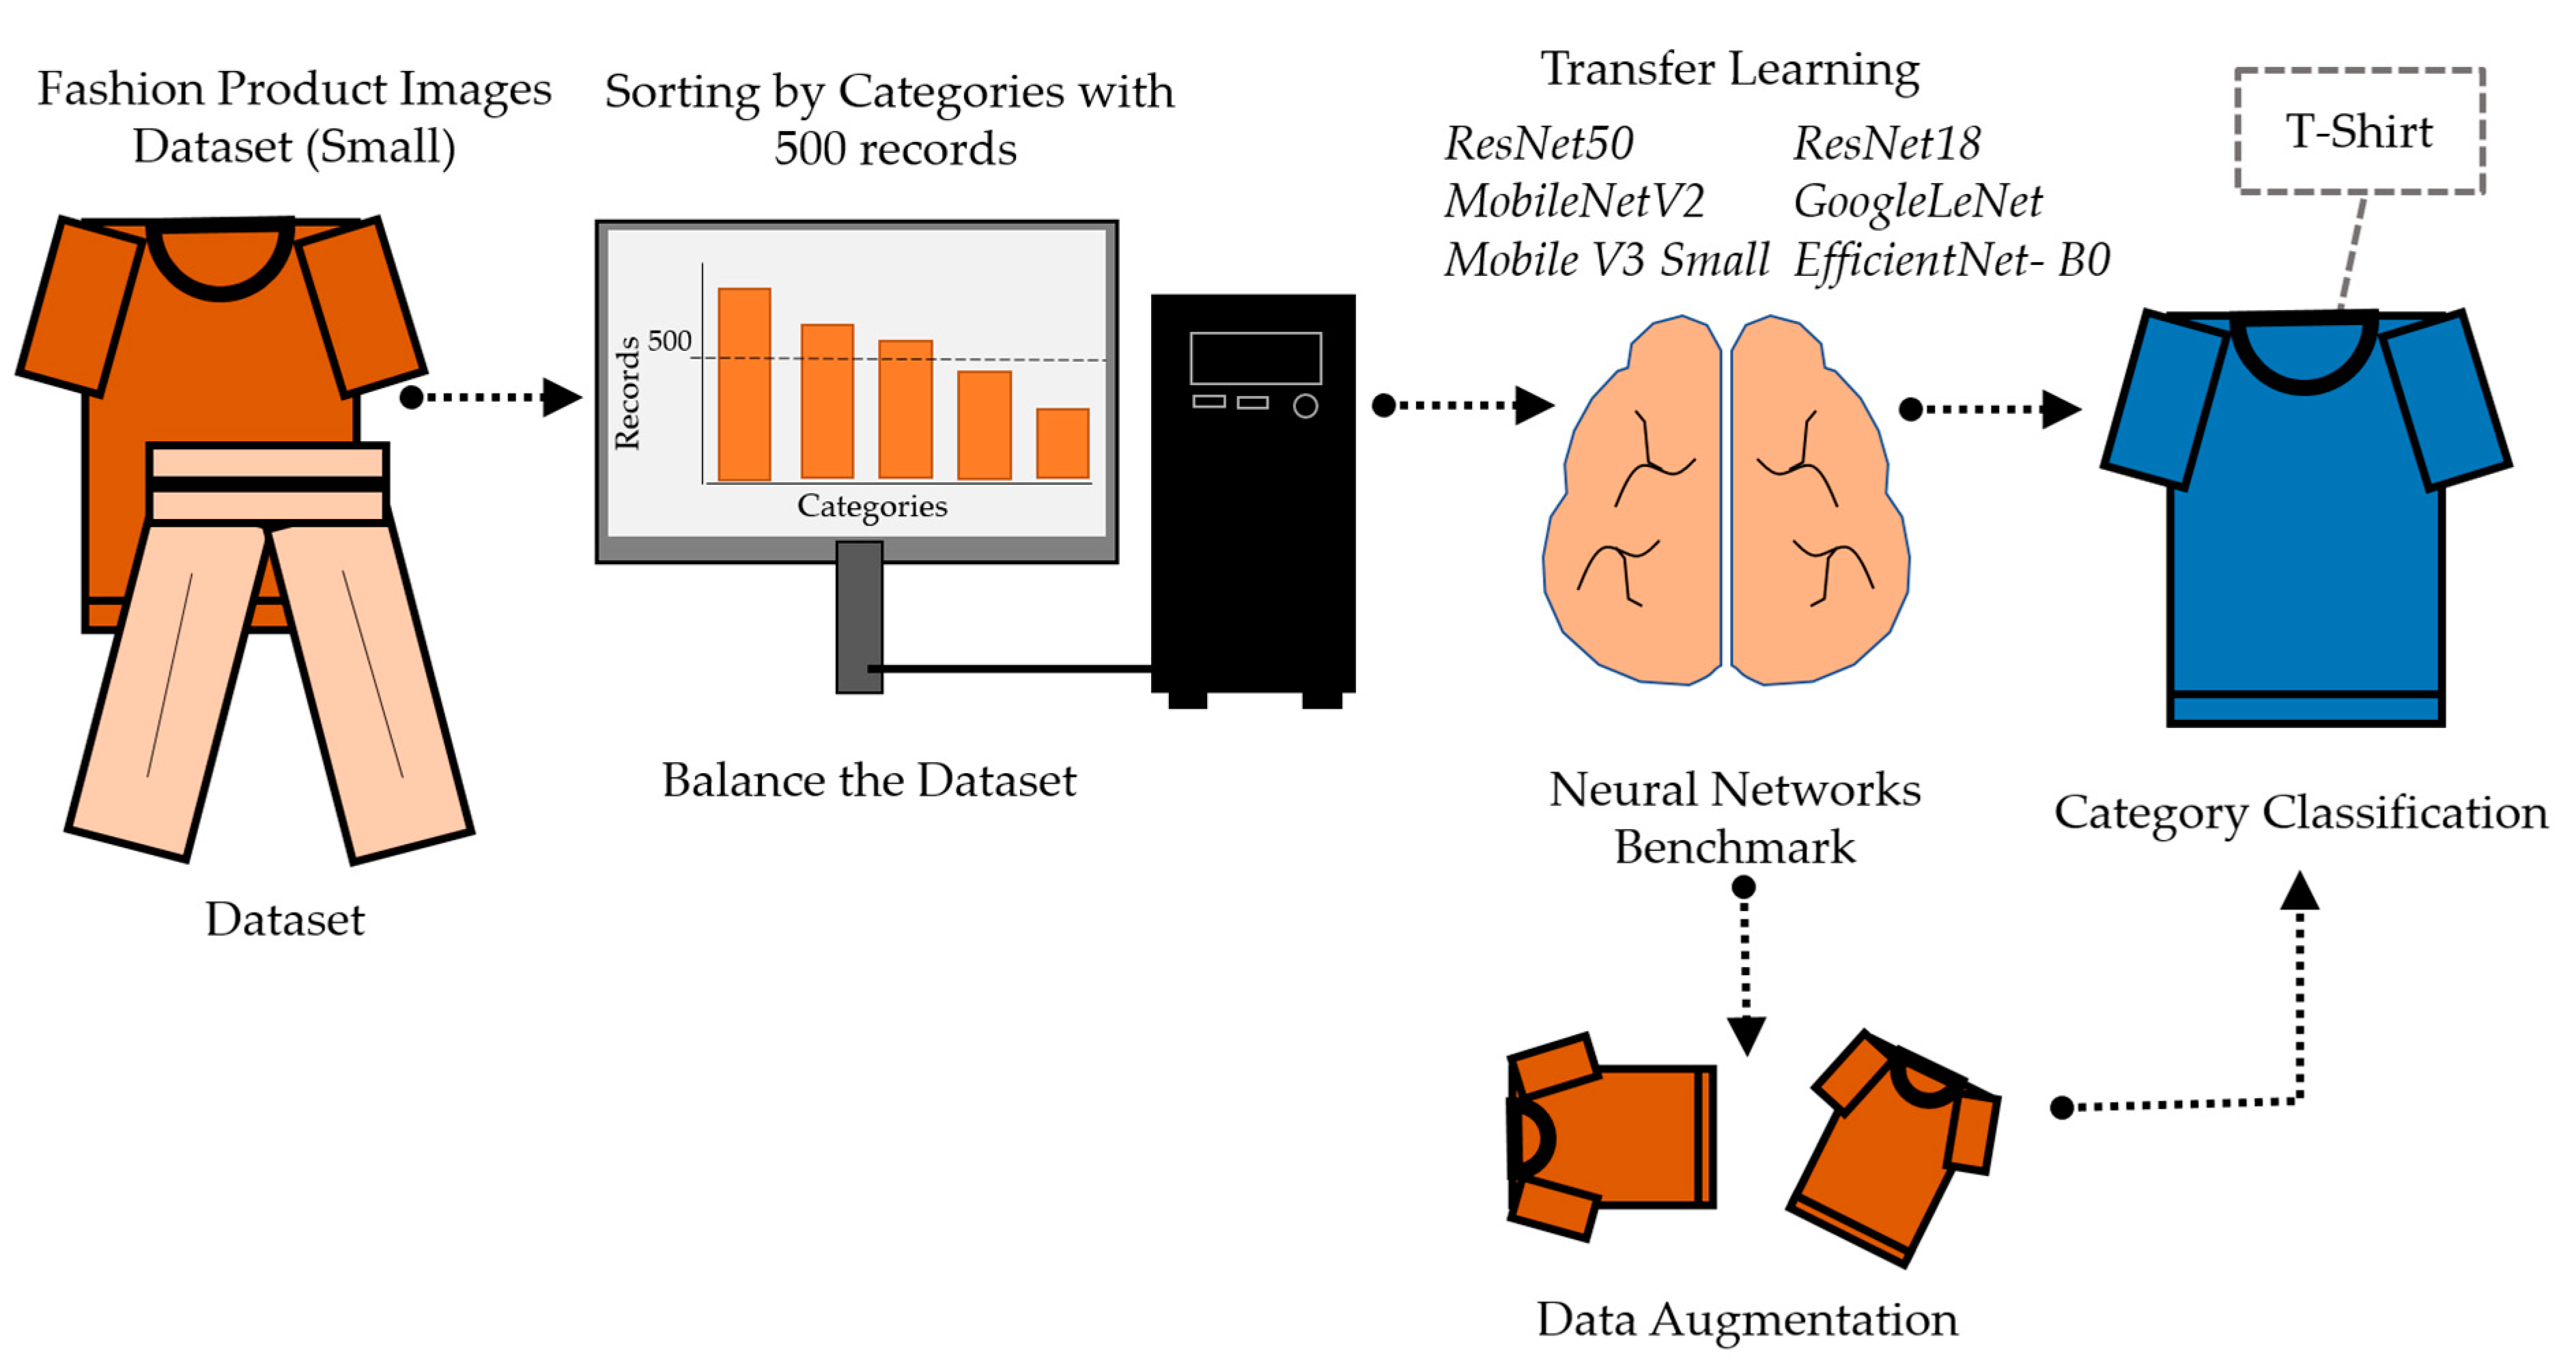
The clothing category classification is based on a public dataset. Prior to being submitted to a benchmark between several networks, the dataset is sorted and balanced for the same number of records. Then, utilizing data augmentation allows one to observe its influence on the results. This workflow is illustrated in Figure 1.
Detailed descriptions of each step of the workflow are provided in the following subsections.

3.1.1. Dataset

As previously mentioned, at an early stage, the goal was to identify the dataset that could fit the project needs. All images taken by blind people are placed in a controlled environment and with one item of clothing at a time [13].
The previous work carried out by the authors [12] allowed us to understand that more data are needed for training and to obtain more accurate results. Nevertheless, the results obtained with a fine-tuning process have shown that this could be a good approach for a small quantity of data. In this sense, a research survey was performed to look for available datasets; see Table 2.
Based on the characteristics of each dataset, it was decided to use the Fashion Product Images Dataset, namely the low-resolution version, as illustrated in Figure 1. It provides different attributes that meet the project’s current and further needs, such as category, color, and season of wear, among others. In addition, annotations with bounding boxes or clothing landmarks are avoided (since they do not fall within the scope of this work) and allow us to feed the dataset with more images without time-consuming annotations. However, despite the number of annotated features included in the dataset, it presents unbalanced data between article types, which were assumed as “categories” in this study. Figure 2 illustrates the clothes categories whose distribution had 500 records, i.e., each entry of the xx axis represents a specific category for which, at least, 500 images were considered.
To ensure a fair comparison between categories and to avoid imbalanced data, from the initial complete range, exactly 500 records were considered for each category depicted in Figure 1. An example of an item from each category is illustrated in Figure 3.

3.1.2. Transfer Learning for Clothing Type Classification

The main objective of image classification is to classify the image by assigning it to a specific label. It involves the extraction of features from the images.
CNNs have been used for different image classification problems. Most of them have a small quantity of data and training these networks carries a high computational cost and is a time-consuming task. With this premise, transfer learning appears as an interesting solution, where a pre-trained network is retrained with another dataset, allowing one to train a network faster than training from scratch. Transfer learning could be used in two different approaches, feature extraction and fine-tuning. Regarding the first one, the head of the network, the fully connected layer (FC), is replaced, and it only retrains this part. Moreover, all the weights of the convolutional layers of the network are frozen. On the other hand, in the second approach, the head of the network is replaced, and a new head can be built, which is similar to feature extraction. However, it differs from the first one as the weights of the convolution neural network can be unfrozen and the entire network can be retrained.
In this work, six implementations of convolutional neural networks were made, specifically those that, to the best of our knowledge, have never been used before in the Fashion Product Images Dataset. The choice of the implementation was based on the different depths and parameters; notwithstanding, all implementations had with the same resolution—see Table 3. Overall, this study used the following networks: RestNet-18, ResNet-50, MobileNetV2, GoogLeNet, Mobilenet V3 (small) and EfficientNet-B0. A comparative analysis of the results obtained with these networks was also carried out.

3.1.3. Evaluation Metrics

As already explained in Section 2, most authors evaluate their models with top 3 and top 5 scores, meaning that the correct label is among the top k predicted labels. Nevertheless, the top 1 score is required in this work due to the practical application in sight, which translates to the fact that the predicted class with the highest probability is the same as the target value.
As a result, it is necessary to use the following metrics.
  • Accuracy (acc), i.e., the relation of correctly predicted observations to the total observations:
acc = TP + TN TP + FP + FN + TN ,
  • Precision (P), i.e., the relation of correctly predicted positive observations to the total predicted positive observations:
P = TP TP + FP
  • Recall (R), i.e., the relation of correctly predicted positive observations to the observations in the actual class:
R = TP TP + FN
  • F1 score, i.e., the weighted average of precision and recall:
F 1 Score = 2   P R P + R
where TP, FP and FN represent, respectively, the number of true positives (TP), false positives (FP) and false negatives (FN).

3.2. Stain Detection Methods

The stain detection process involves the creation of a dataset and its annotation. A neural network is then applied to the dataset, using fine-tuning, for stain detection. Figure 4 depicts the entire workflow process.
The following subsections provide descriptions of each step of the workflow.

3.2.1. Dataset

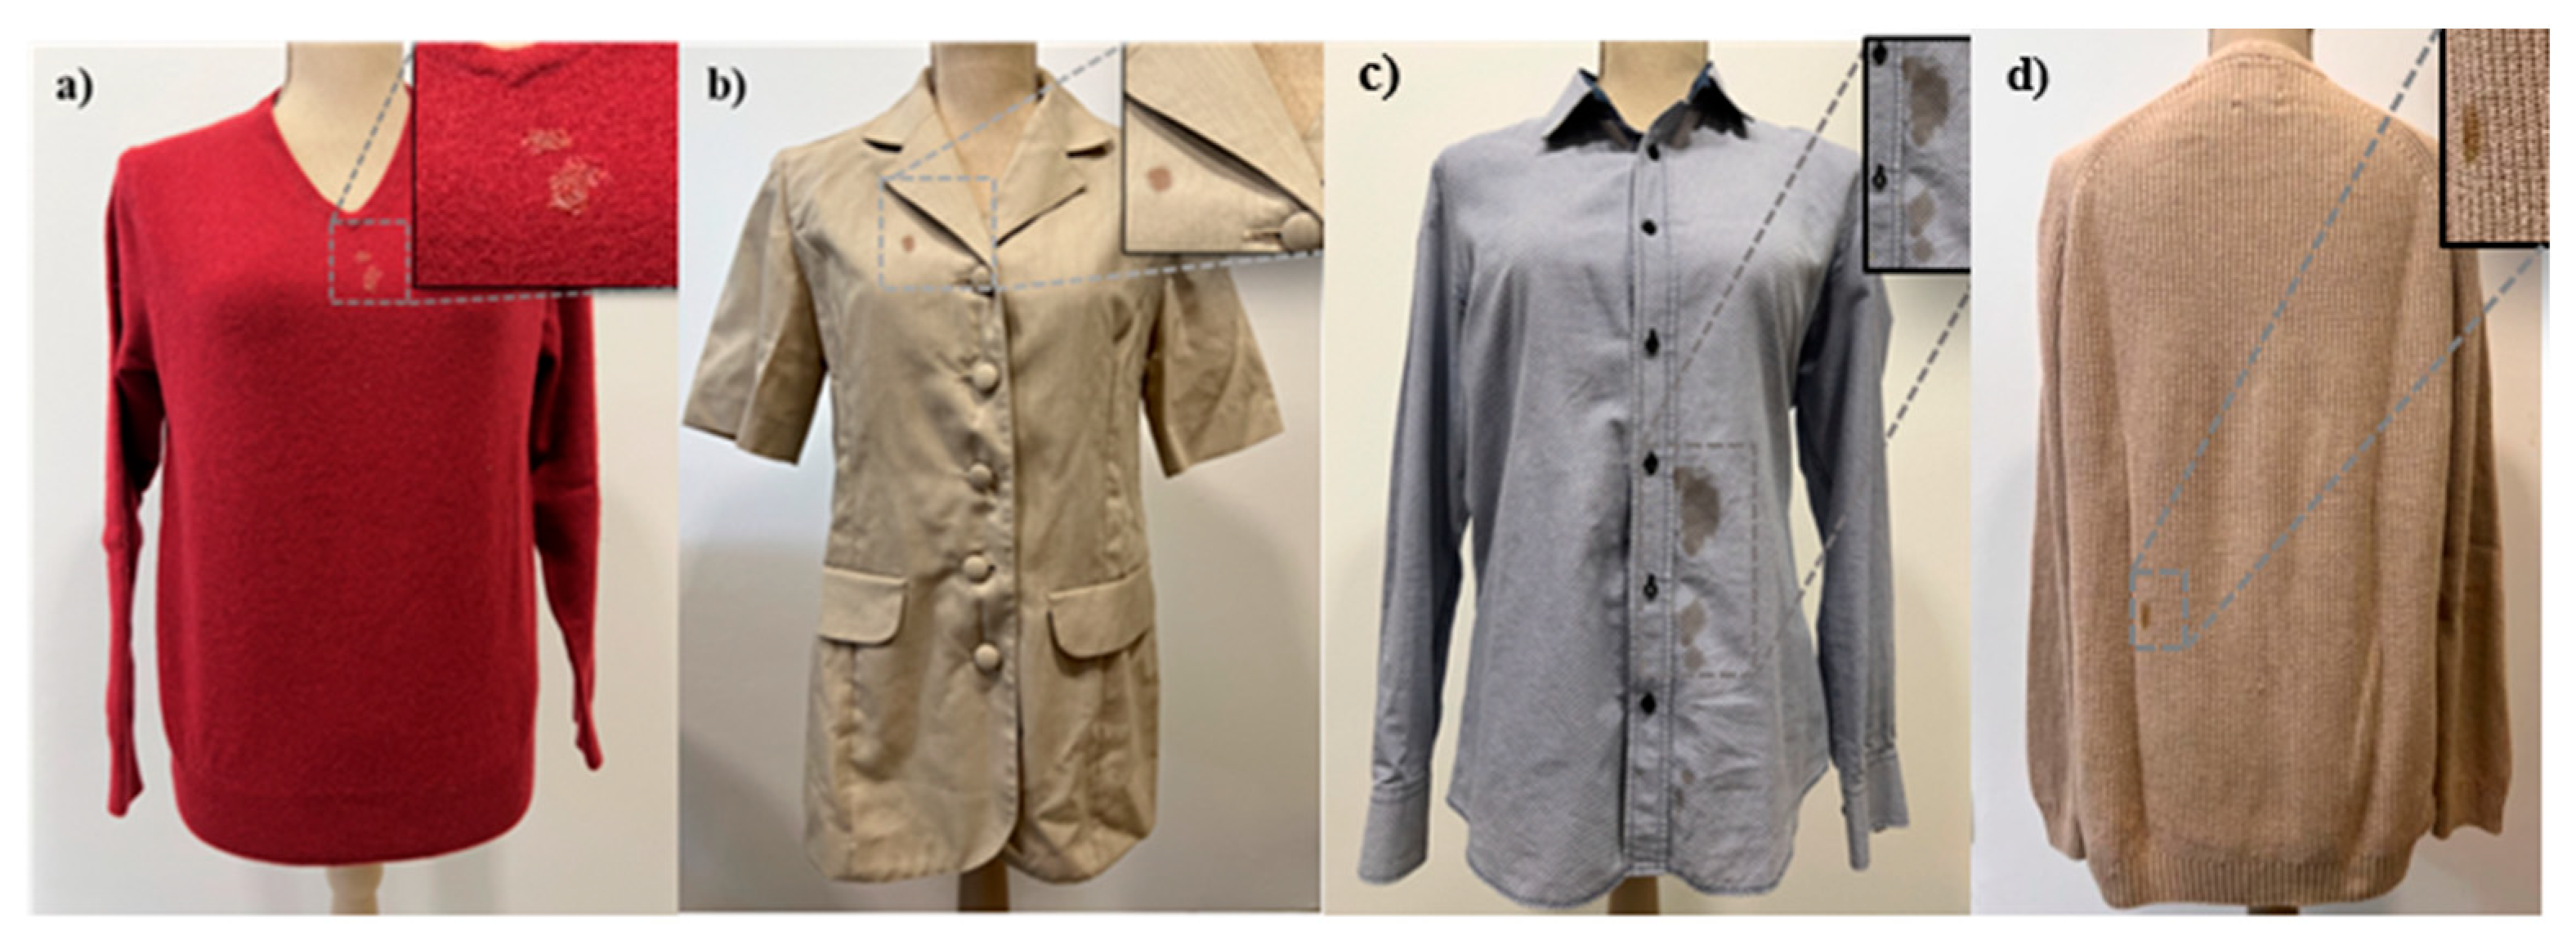
To the best of our knowledge, there is no public dataset on clothes with stains available. Therefore, a new dataset with ca. 104 images was built and named the “stains dataset”; it was then divided into a training set and a validation set. The training dataset comprised 80% of the images, while the remaining 20% served as an evaluation set to determine the model’s accuracy. Each article of clothing could have multiple stains dispersed across different parts of the garment, resulting in a total of ca. 300 stains. The images used in the “stains dataset” were collected from personal wardrobes, where coffee and wine stains were applied on clothes, as depicted in Figure 5.
An automatic wardrobe is currently being developed to allow the clothes to be placed in standardized positions, with which blind people can take photographs under the same controlled conditions [13].

3.2.2. Transfer Learning for Stain Detection

Regarding stain detection, using deep learning, the segmentation and classification heads of Mask R-CNN were trained through Detectron2, a Pytorch-based modular object detection tool. Detectron2 has shown better results on benchmarks compared to other Mask R-CNN implementations. Mask R-CNN is an extension of Faster R-CNN, since it is enhanced with the introduction of instance segmentation.
Despite garments having two types of stains, the annotation process was done with only one class, i.e., a stain. In order to use transfer learning, the weights file mask_rcnn_R_50_FPN_3x with ResNet50 was used as a backbone.

3.2.3. Evaluation Metrics

An evaluation of the proposed methodology was conducted based on the average precision (AP). The AP was measured using an IoU threshold of 0.50 and 0.75, as expressed in Equation (5):
IoU = Area   of   Overlap Area   of   Union
with respect to the previous IoUs, precision and recall can be calculated by means of Equations (2) and (3), respectively, by calculating the number of true positives (TP), false positives (FP) and false negatives (FN).
Finally, a precision–recall curve (PR) for the object class is generated, and the area under the curve represents the average precision (AP) of the model.

4. Experiments and Results

This section presents the results of the experiments conducted for the classification of category types and stain detection.

4.1. Clothing Type Category Classification

A total of three experiments were initially conducted using the Fashion Product Images Dataset. The two first experiments were based on fine-tuning, while the third experiment relied on feature extraction. In order to perform a comparison between all networks, the training and validation parameters were unchanged. Table 4 describes the hyper-parameters.
The epochs were the only change between networks due to their architecture and targeting the best performance. The cross-entropy loss (Equation (6)) allowed us to measure how well a classification model performed, providing a probability value between 0 and 1:
L CE = i = 1 n t i log ( p i ) ,   for   n   classes ,  
where ti is the truth label and pi is the Softmax probability for ith class.
These networks were implemented using the Pytorch library and trained using an NVIDIA A100 running Ubuntu 20.04.2 LTS.
Table 5 reports the fine-tuning results using pre-trained neural networks.
During the fine-tuning process, the entire network is trained, meaning that all the layers’ weights are trainable. However, the weights of batch normalization—a network layer inserted between hidden layers—are set to non-trainable to prevent the network from learning new batch normalization parameters, i.e., beta and gamma [51]. These batch statistics are likely to differ greatly if the fine-tuning examples differ from those in the original training dataset. As a result of the small size of the fine-tuning dataset, it is not always desirable to re-learn these parameters during fine-tuning. The results presented in Table 5 reveal that GoogLeNet had the highest validation accuracy, of 90.7%, with almost all networks presenting close validation accuracy values. Only MobileNet V3 presented a notably lower accuracy value, i.e., 88.3%.
In addition, in the fine-tuning process, the depth between the same architectures (ResNet-18 and ResNet-50) for this dataset was not relevant, achieving approximately the same results, with 90.4% and 90.3% validation accuracy values, respectively. Moreover, the increase in the depth leads to more time consumption, and the number of epochs needed to achieve approximately the same results is equal. The depth between networks, as well as the parameters, does not show any correlation with the accuracy of them.
The inference time was then evaluated for each network. For this, the synchronization time between the CPU and GPU was considered and 400 iterations of GPU warm-up were implemented. Table 6 summarizes the average time and the standard deviation for 400 inferences of the same image, and for each network.
The results presented in Table 6 indicate that ResNet-18 allows us to achieve the best inference time. Moreover, these results allow us to infer that the inference time does not depend either on the number of parameters or on different network architectures. Furthermore, the standard deviation appears to be correlated with the inference time, as it increases with the inference time.
In the second experiment, data augmentation was introduced, namely random horizontal flip and random rotation, which normally leads to improvements in the model. The obtained results are described in Table 7.
Based on the results in Table 7, it can be concluded that amongst data augmentation, the random horizontal flips feature effectively contributed to the improvement in the model’s performance. As in the first experiment, GoogleLeNet allowed us to obtain the best accuracy value (91.1%) and MobileNet V3 (small) resulted in the lowest accuracy value (89.3%). Finally, augmented data with random rotation resulted in poor performance. Following this, the precision, recall and F1 score obtained for the GoogLeNet network are presented in Table 8. Complementarily, Figure 6 depicts the confusion matrix of the model with the best result based on the performance measurements (GoogLeNet). The confusion matrix allows the visualization of the performance of the classification model.
Independently of the good performance of the model, it is worth noting that there are some misclassifications between similar clothing articles, such as casual shoes and sport shoes, heels and flats, and t-shirts and tops (Figure 6).
The third experiment employed transfer learning via feature extraction, where the weights of all layers are frozen, except the output layer. The obtained results show that the loss of the network is ca. 90 %, and it is therefore not viable.
Thus, the results show that using a pre-trained network, the fine-tuned GoogLeNet with augmented data, with proper hyper-parameters, effectively outperforms the work proposed by Fengzi et al. [40]. Comparatively, the obtained results can be explained by the fine-tuning of all network layers, leveraging the pre-trained weights of all architectures and replacing only the last layer, which differs from Fengzi et al. [40], where new head layers were added. Moreover, in this study, the various augmentations were tested in order to assess their contribution, with rotation having the greatest impact on the reduced performance, and the horizontal flip having the greatest impact on the increased performance. Contrarily, Fengzi et al. [40] combined all augmentations during the training process.
The accuracy of this study is similar to that obtained by Kolisnik, Hogan and Zulkernine [41], although the number of classes considered is not mentioned.

4.2. Stain Detection

At this stage of the work, the Detectron2 library was used with the implementation of Mask R-CNN for stain detection. The hyper-parameters are stated in Table 9.
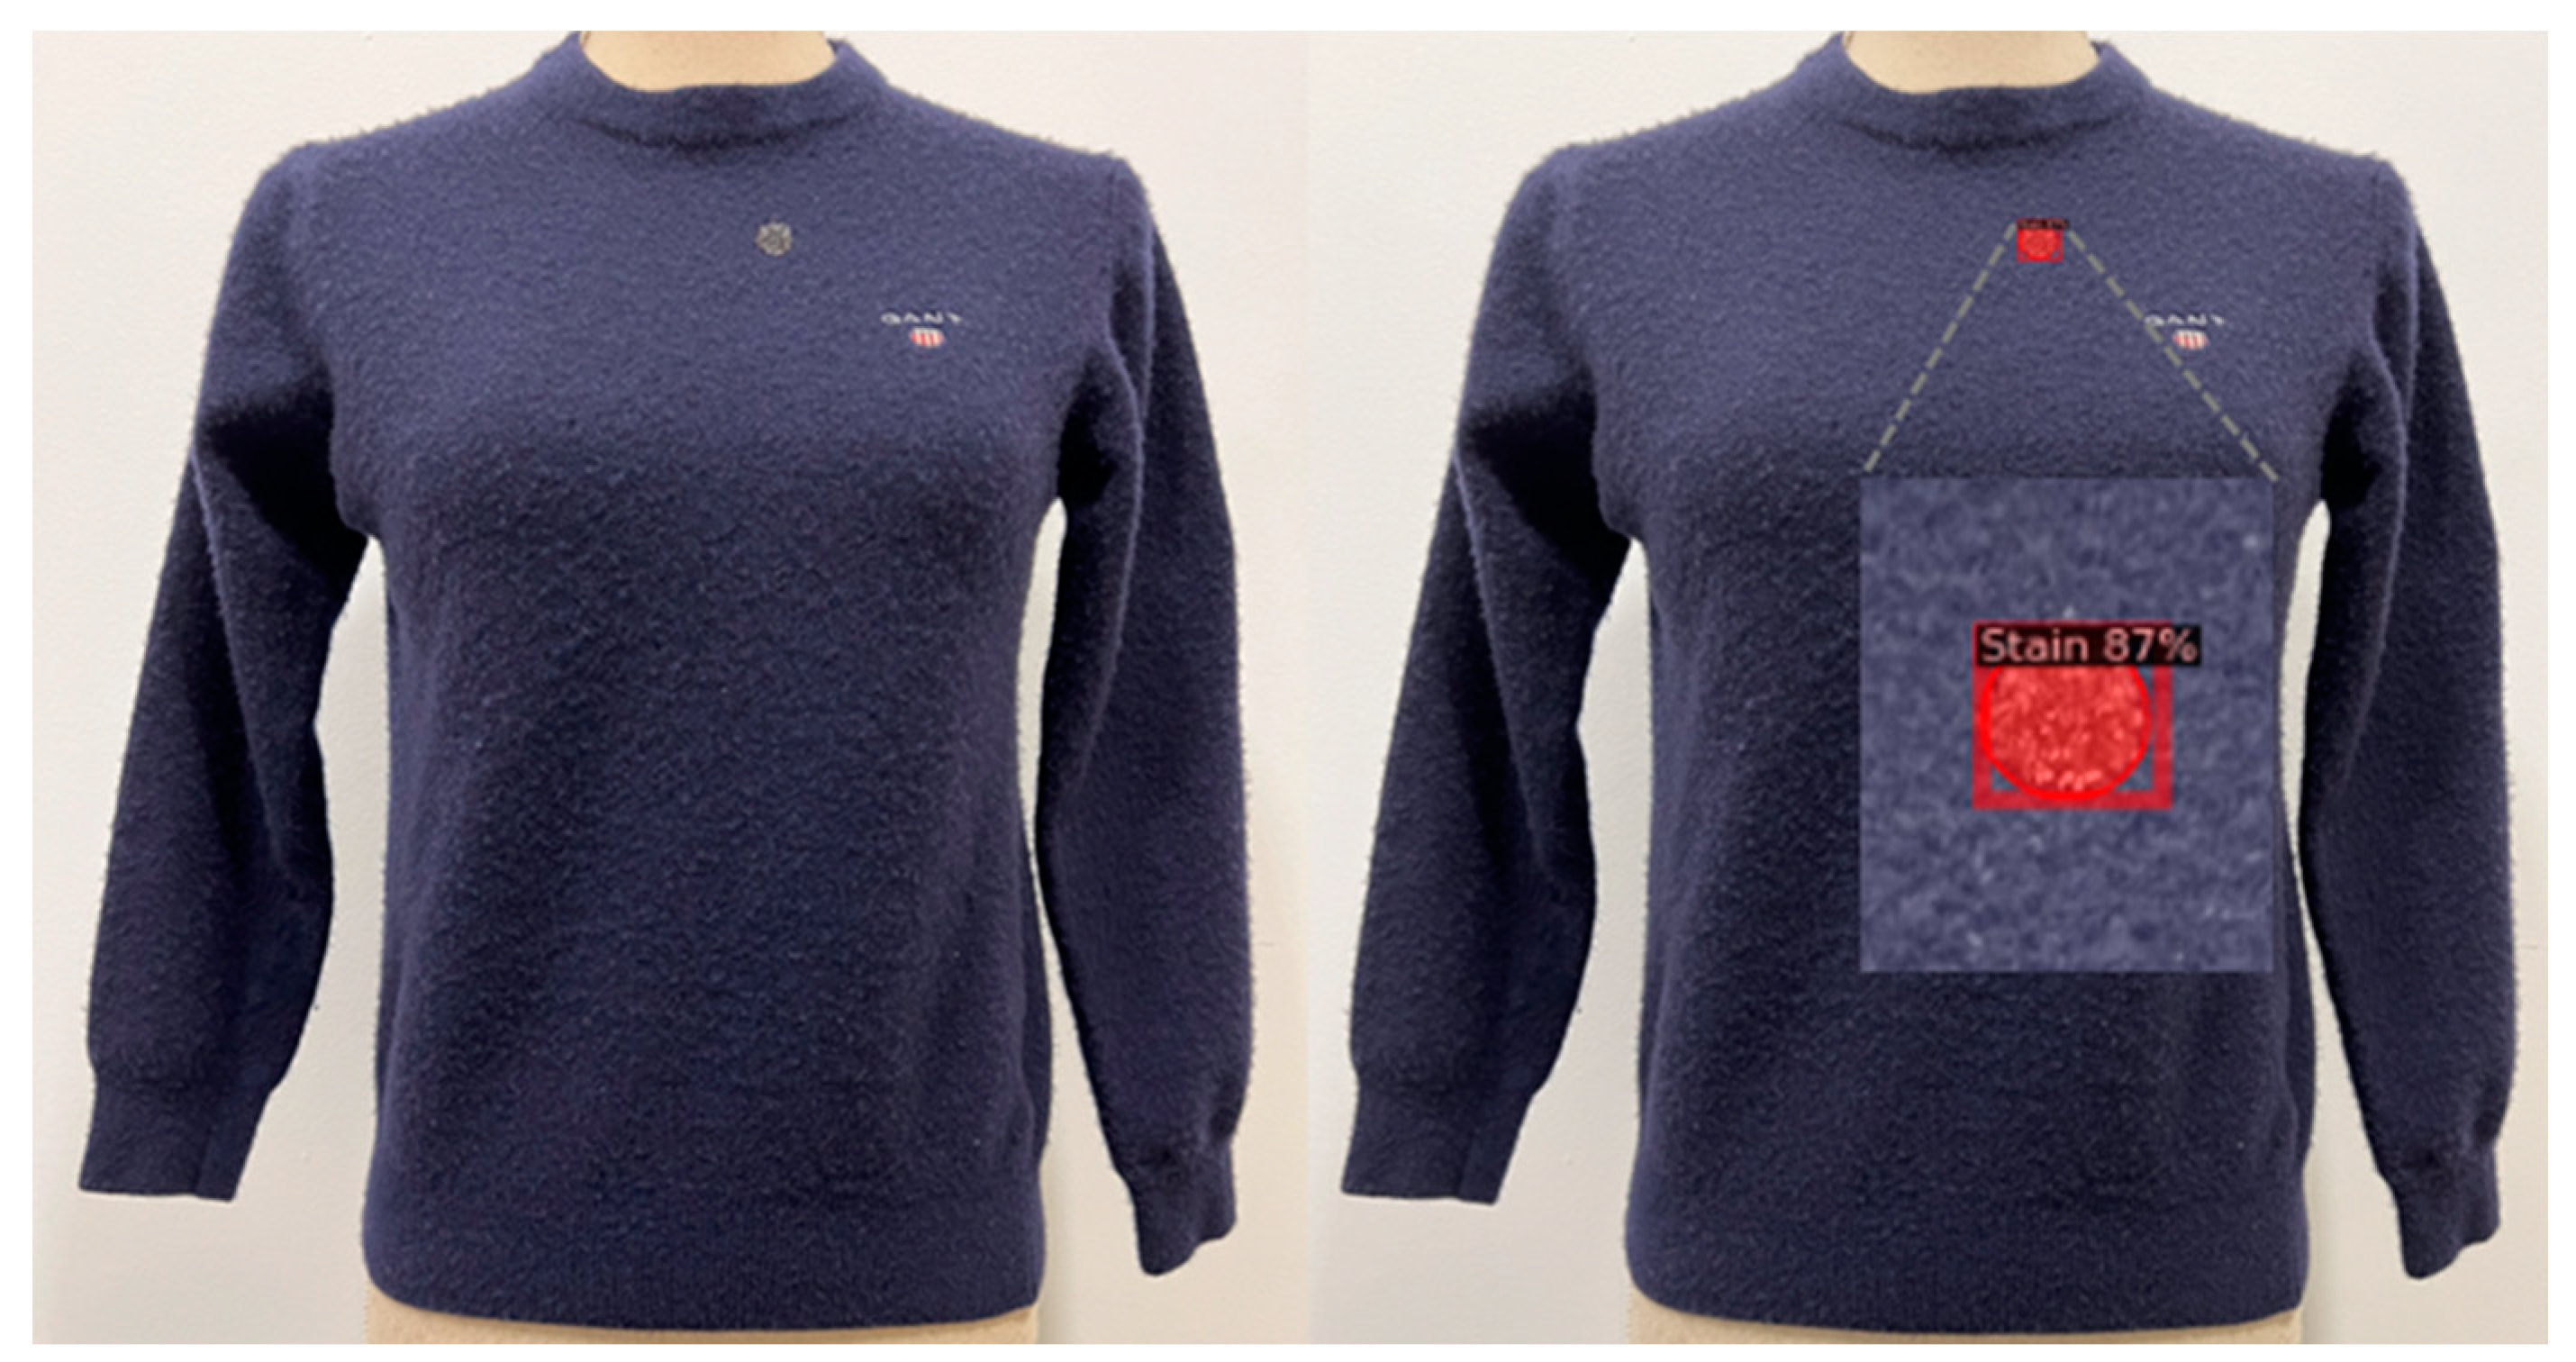
As briefly discussed, this network has advantages over Faster R-CNN as a result of the addition of pixel-level segmentation, i.e., labeling every pixel that belongs to the detected object. This benefit is easily perceptible in Figure 7, which shows an example of stain detection, where the bounding box around the stain is visible, as well as its pixel level.
An experiment was conducted that addressed only the detection of stains, rather than the distinction between them. The main results of the network performance and model losses from Mask R-CNN are presented in Table 10 and Table 11, respectively.
Through the COCO evaluator, it is possible to verify that despite the small quantity of data, the presented results are promising, especially regarding the AP at IoU = 0.50 of 0.857 (Table 10). The highest verified loss was 0.240 (Table 11), indicating a more challenging task related to the segmentation of the stain.
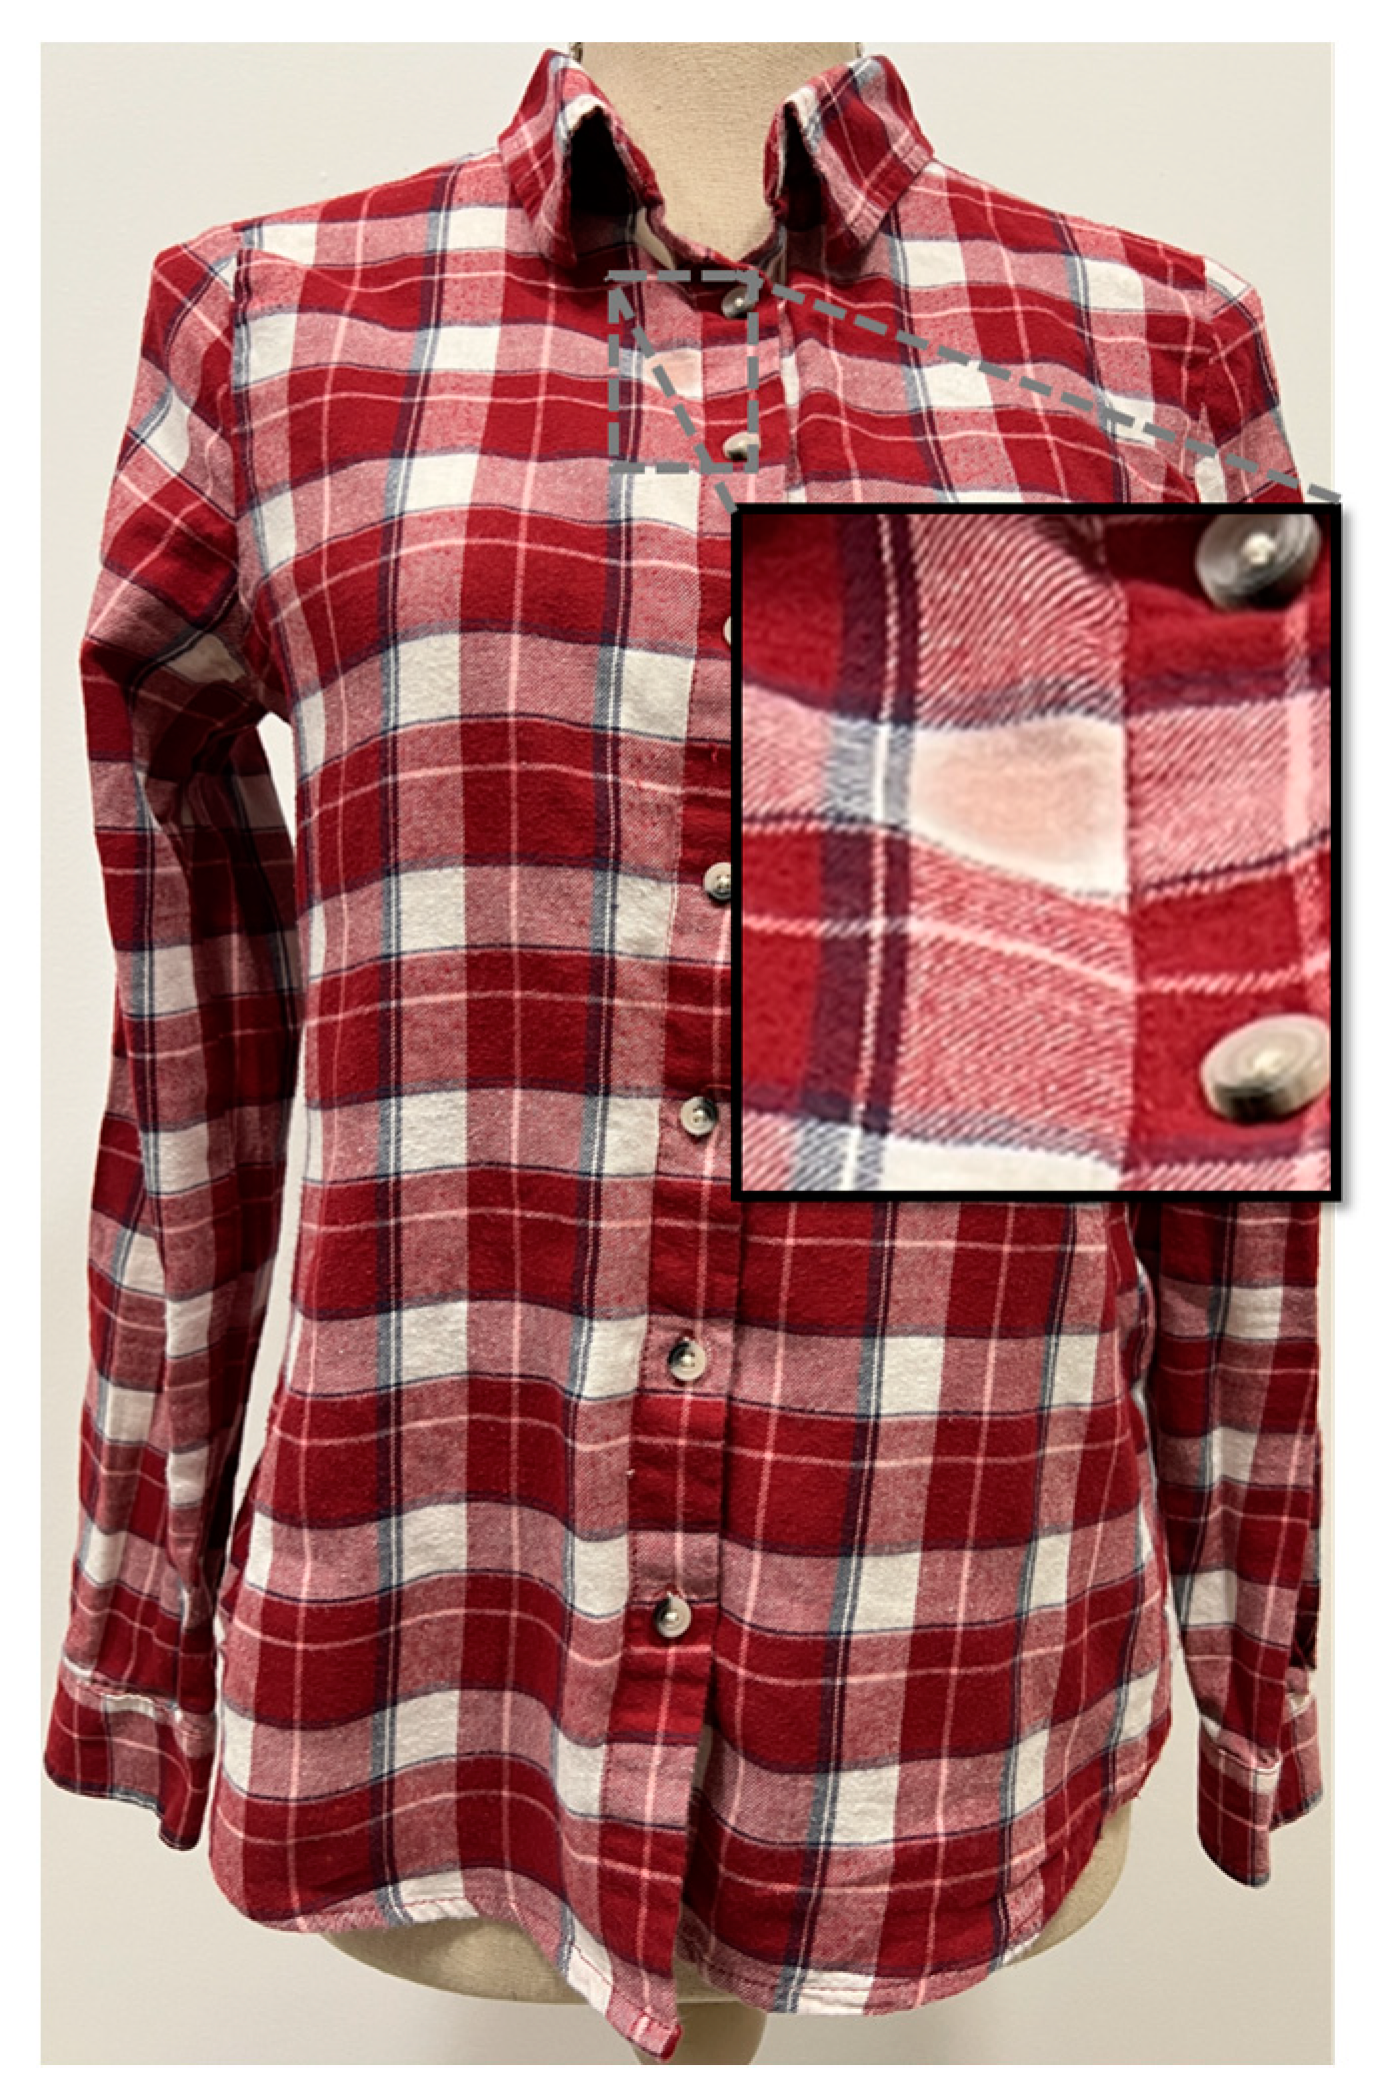
The evaluation of the model allowed us to conclude that the misclassifications were mainly related to the detection of brand logos in the clothing and the low contrast between the stain and the clothing color, as shown in Figure 8.

5. Conclusions

Blind people experience challenging difficulties regarding clothing and style on a daily basis, something that is often essential to an individual’s identity. Especially regarding stain detection in clothing, blind people need supporting tools to help them to identify when a clothing item has a stain, as cleanliness is often important for a person to feel comfortable and secure in their appearance. Such difficulties are often overcome with the help of family or friends, or others with great organizational capacity. However, for a blind person to feel self-confident in their clothing, the use of technology becomes imperative, namely the use of neural networks.
In this study, an analysis of clothing type identification and stain detection for blind people is presented. Through the transfer learning benchmark results, a deep learning model was demonstrated to be able to identify the clothing type category with up to a 91% F1 score, representing an improvement in comparison to the literature. Augmented data were proven to potentially improve even further the obtained results. Nevertheless, more tests should be performed in order to identify which type of augmented data fits better the model considered in this work.
A pioneering method to detect stains from a given clothing image was also presented based on a dataset comprising clothing with wine and coffee stains. This dataset was built to demonstrate that the proposed deep learning algorithm could accurately detect and locate stains on clothing autonomously. The results were promising and are expected to improve when a larger dataset is used.
This work was somehow limited by the fact that clothing type recognition was based on clothing worn by models, which can lead to an unwanted loss in the model and to categories that are not necessary due their redundancy. On the other hand, the stains dataset can be improved with more data and with the optimization of the number of categories considered for clothing type detection. Additionally, the development of a mobile application and its subsequent validation with the blind community can be performed, allowing these results to be integrated into an automatic wardrobe.
Nevertheless, the overall concept behind this work was fully demonstrated, as a system that can significantly improve the daily lives of blind people was developed and tested, allowing them to automatically recognize clothing and identify stains.
Author Contributions

Conceptualization, D.R., F.S., E.O. and V.C.; methodology, D.R., F.S. and V.C.; software, D.R.; validation, D.R., F.S. and V.C.; formal analysis, D.R., F.S. and V.C.; investigation, D.R., F.S. and V.C.; resources, F.S., E.O. and V.C.; data curation, D.R.; writing—original draft preparation, D.R.; writing—review and editing, D.R. and V.C.; visualization, D.R. and V.C.; supervision, F.S., E.O. and V.C.; project administration, F.S. and V.C.; funding acquisition, F.S. and V.C. All authors have read and agreed to the published version of the manuscript.

Funding

This work has been supported by national funds through FCT—Fundação para a Ciência e Tecnologia within the Projects Scope: UIDB/00319/2020, UIDB/05549/2020 and UIDP/05549/2020.

Institutional Review Board Statement

Not applicable.

Informed Consent Statement

Not applicable.

Data Availability Statement

Not applicable.

Acknowledgments

This work had the support of the Association of the Blind and Amblyopes of Portugal (ACAPO) and the Association of Support for the Visually Impaired of Braga (AADVDB). Their considerations were essential in obtaining key insights into a viable solution for the blind community.

Conflicts of Interest

The authors declare no conflict of interest. The funders had no role in the design of the study; in the collection, analyses, or interpretation of data; in the writing of the manuscript; or in the decision to publish the results.

References

  1. Wade, N.J.; Swanston, M. Visual Perception, 3rd ed.; Psychology Press: London, UK, 2013; pp. 1–322. [Google Scholar] [CrossRef]
  2. GBD 2019 Blindness and Vision Impairment Collaborators. Causes of blindness and vision impairment in 2020 and trends over 30 years, and prevalence of avoidable blindness in relation to VISION 2020: The Right to Sight: An analysis for the Global Burden of Disease Study. Lancet. Glob. Health 2021, 9, e144–e160. [Google Scholar] [CrossRef] [PubMed]
  3. Bhowmick, A.; Hazarika, S.M. An insight into assistive technology for the visually impaired and blind people: State-of-the-art and future trends. J. Multimodal User Interfaces 2017, 11, 149–172. [Google Scholar] [CrossRef]
  4. Messaoudi, M.D.; Menelas, B.-A.J.; Mcheick, H. Review of Navigation Assistive Tools and Technologies for the Visually Impaired. Sensors 2022, 22, 7888. [Google Scholar] [CrossRef]
  5. Elmannai, W.; Elleithy, K. Sensor-based assistive devices for visually-impaired people: Current status, challenges, and future directions. Sensors 2017, 17, 565. [Google Scholar] [CrossRef] [PubMed]
  6. Johnson, K.; Lennon, S.J.; Rudd, N. Dress, body and self: Research in the social psychology of dress. Fash. Text. 2014, 1, 20. [Google Scholar] [CrossRef]
  7. Rocha, D.; Carvalho, V.; Oliveira, E.; Goncalves, J.; Azevedo, F. MyEyes-automatic combination system of clothing parts to blind people: First insights. In Proceedings of the 2017 IEEE 5th International Conference on Serious Games and Applications for Health (SeGAH), Perth, Australia, 2–4 April 2017; pp. 1–5. [Google Scholar]
  8. Rocha, D.; Carvalho, V.; Oliveira, E. MyEyes—Automatic Combination System of Clothing Parts to Blind People: Prototype Validation. In Proceedings of the SENSORDEVICES’ 2017 Conference, Rome, Italy, 10–14 September 2017. [Google Scholar]
  9. Rocha, D.; Carvalho, V.; Gonçalves, J.; Azevedo, F.; Oliveira, E. Development of an Automatic Combination System of Clothing Parts for Blind People: MyEyes. Sens. Transducers 2017, 219, 26–33. [Google Scholar]
  10. Rocha, D.; Carvalho, V.; Soares, F.; Oliveira, E. Extracting Clothing Features for Blind People Using Image Processing and Machine Learning Techniques: First Insights BT—VipIMAGE 2019; Tavares, J.M.R.S., Natal Jorge, R.M., Eds.; Springer International Publishing: Cham, Switzerland, 2019; pp. 411–418. [Google Scholar]
  11. Rocha, D.; Carvalho, V.; Soares, F.; Oliveira, E.; Leão, C.P. Understand the Importance of Garments’ Identification and Combination to Blind People. In Proceedings of the Human Interaction, Emerging Technologies and Future Systems V, Paris, France, 27–29 August 2021; Ahram, T., Taiar, R., Eds.; Springer International Publishing: Cham, Switzerland, 2022; pp. 74–81. [Google Scholar]
  12. Rocha, D.; Carvalho, V.; Soares, F.; Oliveira, E. A model approach for an automatic clothing combination system for blind people. In Design, Learning, and Innovation; Springer International Publishing: Cham, Switzerland, 2020. [Google Scholar]
  13. Rocha, D.; Carvalho, V.; Soares, F.; Oliveira, E. Design of a Smart Mechatronic System to Combine Garments for Blind People: First Insights. In IoT Technologies for HealthCare, Proceedings of the 8th EAI International Conference, HealthyIoT 2021, Virtual Event, 24–26 November 2021; Garcia, N.M., Pires, I.M., Goleva, R., Eds.; Springer International Publishing: Cham, Switzerland, 2020; pp. 52–63. [Google Scholar]
  14. Voulodimos, A.; Doulamis, N.; Doulamis, A.; Protopapadakis, E. Deep Learning for Computer Vision: A Brief Review. Comput. Intell. Neurosci. 2018, 2018, 7068349. [Google Scholar] [CrossRef]
  15. Bhatt, D.; Patel, C.; Talsania, H.; Patel, J.; Vaghela, R.; Pandya, S.; Modi, K.; Ghayvat, H. CNN Variants for Computer Vision: History, Architecture, Application, Challenges and Future Scope. Electronics 2021, 10, 2470. [Google Scholar] [CrossRef]
  16. Patel, C.; Bhatt, D.; Sharma, U.; Patel, R.; Pandya, S.; Modi, K.; Cholli, N.; Patel, A.; Bhatt, U.; Khan, M.A.; et al. DBGC: Dimension-Based Generic Convolution Block for Object Recognition. Sensors 2022, 22, 1780. [Google Scholar] [CrossRef]
  17. Krizhevsky, A.; Sutskever, I.; Hinton, G.E. ImageNet Classification with Deep Convolutional Neural Networks. In Proceedings of the Advances in Neural Information Processing Systems, Lake Tahoe, NV, USA, 3–8 December 2012; Pereira, F., Burges, C.J.C., Bottou, L., Weinberger, K.Q., Eds.; Curran Associates, Inc.: Red Hook, NY, USA, 2012; Volume 25. [Google Scholar]
  18. ImageNet Large Scale Visual Recognition Competition (ILSVRC). Available online: http://www.image-net.org/challenges/LSVRC/ (accessed on 13 July 2020).
  19. Deng, J.; Dong, W.; Socher, R.; Li, L.-J.; Li, K.; Fei-Fei, L. ImageNet: A large-scale hierarchical image database. In Proceedings of the 2009 IEEE Conference on Computer Vision and Pattern Recognition, Miami, FL, USA, 20–25 June 2009; pp. 248–255. [Google Scholar]
  20. Simonyan, K.; Zisserman, A. Very deep convolutional networks for large-scale image recognition. In Proceedings of the 3rd International Conference on Learning Representations, ICLR 2015—Conference Track Proceedings, San Diego, CA, USA, 7–9 May 2015. [Google Scholar]
  21. Szegedy, C.; Liu, W.; Jia, Y.; Sermanet, P.; Reed, S.; Anguelov, D.; Erhan, D.; Vanhoucke, V.; Rabinovich, A. Going Deeper with Convolutions. arXiv 2014, arXiv:1409.4842. [Google Scholar]
  22. Iandola, F.N.; Han, S.; Moskewicz, M.W.; Ashraf, K.; Dally, W.J.; Keutzer, K. SqueezeNet: AlexNet-level accuracy with 50x fewer parameters and. arXiv 2016, arXiv:1602.07360. [Google Scholar]
  23. Szegedy, C.; Vanhoucke, V.; Ioffe, S.; Shlens, J.; Wojna, Z. Rethinking the Inception Architecture for Computer Vision. arXiv 2015, arXiv:1512.00567. [Google Scholar]
  24. He, K.; Zhang, X.; Ren, S.; Sun, J. Deep Residual Learning for Image Recognition. arXiv 2015, arXiv:1512.03385. [Google Scholar]
  25. Ma, N.; Zhang, X.; Zheng, H.-T.; Sun, J. ShuffleNet V2: Practical Guidelines for Efficient CNN Architecture Design. arXiv 2018, arXiv:1807.11164. [Google Scholar]
  26. Sandler, M.; Howard, A.; Zhu, M.; Zhmoginov, A.; Chen, L.-C. MobileNetV2: Inverted Residuals and Linear Bottlenecks. arXiv 2018, arXiv:1801.04381. [Google Scholar]
  27. Howard, A.; Sandler, M.; Chu, G.; Chen, L.-C.; Chen, B.; Tan, M.; Wang, W.; Zhu, Y.; Pang, R.; Vasudevan, V.; et al. Searching for MobileNetV3. arXiv 2019, arXiv:1905.02244. [Google Scholar]
  28. Tan, M.; Le, Q.V. EfficientNet: Rethinking Model Scaling for Convolutional Neural Networks. arXiv 2019, arXiv:1905.11946. [Google Scholar]
  29. Radosavovic, I.; Kosaraju, R.P.; Girshick, R.; He, K.; Dollár, P. Designing Network Design Spaces. arXiv 2020, arXiv:2003.13678. [Google Scholar]
  30. Cheng, W.-H.; Song, S.; Chen, C.-Y.; Hidayati, S.C.; Liu, J. Fashion meets computer vision: A survey. ACM Comput. Surv. 2021, 54, 72. [Google Scholar] [CrossRef]
  31. Chen, Q.; Huang, J.; Feris, R.; Brown, L.M.; Dong, J.; Yan, S. Deep domain adaptation for describing people based on fine-grained clothing attributes. In Proceedings of the 2015 IEEE Conference on Computer Vision and Pattern Recognition (CVPR), Boston, MA, USA, 7–12 June 2015; pp. 5315–5324. [Google Scholar]
  32. Liu, Z.; Luo, P.; Qiu, S.; Wang, X.; Tang, X. DeepFashion: Powering Robust Clothes Recognition and Retrieval with Rich Annotations. In Proceedings of the 2016 IEEE Conference on Computer Vision and Pattern Recognition (CVPR), Las Vegas, NV, USA, 27–30 June 2016; pp. 1096–1104. [Google Scholar] [CrossRef]
  33. Hara, K.; Jagadeesh, V.; Piramuthu, R. Fashion Apparel Detection: The Role of Deep Convolutional Neural Network and Pose-dependent Priors. arXiv 2014, arXiv:1411.5319. [Google Scholar]
  34. Corbière, C.; Ben-Younes, H.; Ramé, A.; Ollion, C. Leveraging Weakly Annotated Data for Fashion Image Retrieval and Label Prediction. In Proceedings of the 2017 IEEE International Conference on Computer Vision Workshops (ICCVW), Venice, Italy, 22–29 October 2017. [Google Scholar] [CrossRef]
  35. Wang, W.; Xu, Y.; Shen, J.; Zhu, S.-C. Attentive Fashion Grammar Network for Fashion Landmark Detection and Clothing Category Classification. In Proceedings of the Proceedings of the IEEE Computer Society Conference on Computer Vision and Pattern Recognition, Salt Lake City, UT, USA, 18–23 June 2018; pp. 4271–4280.
  36. Li, P.; Li, Y.; Jiang, X.; Zhen, X. Two-Stream Multi-Task Network for Fashion Recognition. arXiv 2019, arXiv:1901.10172. [Google Scholar]
  37. Cho, H.; Ahn, C.; Yoo, K.M.; Seol, J.; Lee, S. Leveraging Class Hierarchy in Fashion Classification. In Proceedings of the 2019 IEEE/CVF International Conference on Computer Vision Workshop (ICCVW), Seoul, Republic of Korea, 27–28 October 2019; pp. 3197–3200. [Google Scholar]
  38. Lu, Y.; Kumar, A.; Zhai, S.; Cheng, Y.; Javidi, T.; Feris, R. Fully-adaptive Feature Sharing in Multi-Task Networks with Applications in Person Attribute Classification. arXiv 2016, arXiv:1611.05377. [Google Scholar]
  39. Seo, Y.; Shin, K.-S. Hierarchical convolutional neural networks for fashion image classification. Expert Syst. Appl. 2019, 116, 328–339. [Google Scholar] [CrossRef]
  40. Fengzi, L.; Kant, S.; Araki, S.; Bangera, S.; Shukla, S. Neural Networks for Fashion Image Classification and Visual Search. arXiv 2020, arXiv:2005.08170. [Google Scholar] [CrossRef]
  41. Kolisnik, B.; Hogan, I.; Zulkernine, F. Condition-CNN: A hierarchical multi-label fashion image classification model. Expert Syst. Appl. 2021, 182, 115195. [Google Scholar] [CrossRef]
  42. Li, C.; Li, J.; Li, Y.; He, L.; Fu, X.; Chen, J. Fabric Defect Detection in Textile Manufacturing: A Survey of the State of the Art. Secur. Commun. Netw. 2021, 2021, 9948808. [Google Scholar] [CrossRef]
  43. Redmon, J.; Divvala, S.; Girshick, R.; Farhadi, A. You Only Look Once: Unified, Real-Time Object Detection. arXiv 2015, arXiv:1506.02640. [Google Scholar]
  44. Liu, W.; Anguelov, D.; Erhan, D.; Szegedy, C.; Reed, S.; Fu, C.-Y.; Berg, A.C. SSD: Single Shot MultiBox Detector. In Computer Vision—ECCV 2016; Springer: Cham, Switzerland, 2015. [Google Scholar] [CrossRef]
  45. Ren, S.; He, K.; Girshick, R.; Sun, J. Faster R-CNN: Towards Real-Time Object Detection with Region Proposal Networks. arXiv 2015, arXiv:1506.01497. [Google Scholar] [CrossRef] [Green Version]
  46. He, K.; Gkioxari, G.; Dollár, P.; Girshick, R. Mask R-CNN. arXiv 2017, arXiv:1703.06870. [Google Scholar]
  47. Liu, Z.; Yan, S.; Luo, P.; Wang, X.; Tang, X. Fashion Landmark Detection in the Wild. arXiv 2016, arXiv:1608.03049. [Google Scholar]
  48. Xiao, H.; Rasul, K.; Vollgraf, R. Fashion-MNIST: A Novel Image Dataset for Benchmarking Machine Learning Algorithms. arXiv 2017, arXiv:1708.07747. [Google Scholar]
  49. Ge, Y.; Zhang, R.; Wu, L.; Wang, X.; Tang, X.; Luo, P. A Versatile Benchmark for Detection, Pose Estimation, Segmentation and Re-Identification of Clothing Images. In Proceedings of the IEEE/CVF Conference on Computer Vision and Pattern Recognition (CVPR), Long Beach, CA, USA, 15–20 June 2019. [Google Scholar]
  50. Fashion Product Images Dataset|Kaggle. Available online: https://www.kaggle.com/paramaggarwal/fashion-product-images-dataset (accessed on 28 December 2021).
  51. Ioffe, S.; Szegedy, C. Batch Normalization: Accelerating Deep Network Training by Reducing Internal Covariate Shift. arXiv 2015, arXiv:1502.03167. [Google Scholar]
Figure 1. Workflow methodology for the classification of clothing categories.
Applsci 13 01925 g001
Figure 2. Distribution of the number of records for each article type/category (Fashion Product Images Dataset).
Applsci 13 01925 g002
Figure 3. Sample images from the Fashion Product Images Dataset.
Applsci 13 01925 g003
Figure 4. Workflow methodology for stain detection.
Applsci 13 01925 g004
Figure 5. Sample images from stains dataset: (a) coffee stain; (b) wine stain; (c) multiple stains; (d) stain on the back.
Applsci 13 01925 g005
Figure 6. Confusion matrix from classification.
Applsci 13 01925 g006
Figure 7. Stain detection with the corresponding class label, bounding box and pixel-level identification.
Applsci 13 01925 g007
Figure 8. Example of a clothing item with misclassification.
Applsci 13 01925 g008
Table 1. Literature overview on fashion image classification works (adapted from [41]).
AuthorDatasetYearAccuracy
Chen et al. [31]Street-data2015Top 1: 48.31%
Liu et al. [32]DeepFashion2016Top 3: 82.58%
Hara et al. [33]Fashionista2016mAP: 31.1%
Lu et al. [38]DeepFashion2016Top 3: 83.24%
Corbière et al. [34] DeepFashion2017Top 3: 86.30%
Wang et al. [35]DeepFashion-C2018Top 3: 90.99%
Li et al. [36]DeepFashion-C2019Top 3: 93.01%
Cho et al. [37]DeepFashion2019Top 3: 91.24%
Seo and Shin. [39]Fashion-MINIST2019Top 1: 93.33%
Fengzi et al. [40]Fashion Product Images2020Top 1: 88.65% 1
Kolisnik, Hogan and Zulkernine [41]Fashion Product Images2021Top 1: 91.0% 1
1 Results only reported for fashion classification accuracy.
Table 2. Summary of available datasets for fashion category classification (adapted from [30]).
DatasetYear# of PhotosDescription
DeepFashion-C [32]2016289,222Annotated with clothing bounding box, pose variation type, landmark visibility, clothing type, category, and attributes.
Fashion Landmark Dataset [47]2016123,016Annotated with clothing type, pose variation type, landmark visibility, clothing bounding box and human body joint.
FashionMinist [48]201970,000Grayscale image dataset associated with a label from 10 classes.
DeepFashion2 [49]2019491,000A versatile benchmark of four tasks including clothes detection, pose estimation, segmentation, and retrieval.
Fashion Product Images [50]201944,400Annotated with gender, master category, subcategory, article type, base color, season, year, usage and product description.
Table 3. Main characteristics of pre-trained models.
CNNParameters (Millions)Image Size (Pixels)
ResNet 5025.6224 × 224
ResNet1811.7224 × 224
MobileNetV266224 × 224
GoogLeNet7224 × 224
MobileNet V3 Small67.66224 × 224
EfficientNet-B05.3224 × 224
Table 4. Hyper-parameters of model experiments.
ParametersValue
OptimizerSGD
Momentum0.9
Leaning rate0.001
Batch size16
Table 5. Test performance results.
NetworkTrain AccuracyValidation AccuracyTrain LossValidation LossEpochsTime (s)
ResNet-500.9460.9030.1590.2964153.72
ResNet-180.9390.9040.1830.2794111.66
MobileNet V20.9170.8980.2330.2904139.04
GoogLeNet0.9400.9070.1890.2797266.20
MobileNet V3 (small)0.9170.8830.2340.3277241.66
EfficientNet-B00.9270.9000.2100.29512539.59
Table 6. Inference time by network architecture.
NetworkTime (ms)Standard Deviation
ResNet 500.01260.251
ResNet180.00810.162
MobileNetV20.01170.235
GoogLeNet0.01690.338
MobileNet V3 Small0.01200.239
EfficientNet-B00.01970.394
Table 7. Test performance results with augmented data.
NetworkTrain AccuracyValidation AccuracyTrain LossValidation LossEpochsTime (s)
With Random Horizontal Flip
ResNet-500.9580.9060.1120.3076262.63
ResNet-180.9500.9070.1460.2756162.28
MobileNet V20.9270.9100.2010.2716228.77
GoogLeNet0.9410.9110.1710.27210356.57
MobileNet V3 (small)0.9110.8930.2510.3207223.88
EfficientNet-B00.9210.9030.2230.27613542.21
With Random Rotation (90)
ResNet-500.9340.8870.1870.32311364.47
ResNet-180.9140.8870.2380.33910272.93
MobileNet V20.9110.8870.2450.33412464.70
GoogLeNet0.9080.8940.2690.30614509.61
MobileNet V3 (small)0.8960.8800.2810.37915481.10
EfficientNet-B00.8960.8800.2950.32118804.20
With Random Horizontal Flip and with Random Rotation (90)
ResNet-500.9470.8870.1480.32815508.69
ResNet-180.9040.8850.2600.33111306.74
MobileNet V20.9080.8840.2550.33413539.59
GoogLeNet0.9030.8830.2590.32517608.41
MobileNet V3 (small)0.8990.8800.2710.36917533.98
EfficientNet-B00.9080.8910.2540.304251041.29
Table 8. Classification report of the GoogLeNet network.
NetworkPrecisionRecallF1 ScoreSupport
Backpacks0.990.960.98110
Belts1.001.001.00102
Briefs1.000.990.9996
Casual Shoes0.810.750.78102
Flats0.710.610.66107
Flip Flops0.880.940.91124
Formal Shoes0.980.940.96104
Handbags0.950.920.9491
Heels0.660.770.7197
Jeans0.990.900.95115
Kurtas0.930.950.94101
Perfume and Body Mist1.000.990.9990
Sandals0.860.830.84105
Shirts0.910.940.9296
Shorts0.980.990.9896
Socks0.970.990.9890
Sports Shoes0.810.860.8390
Sunglasses1.001.001.0096
Tops0.830.880.85105
Trousers0.880.980.9288
T-Shirts0.930.830.8890
Wallets0.950.970.96107
Watches0.980.990.9897
Accuracy 0.912299
Macro avg0.910.910.912299
Weighted avg0.910.910.912299
Table 9. Hyper-parameters for fine-tuned Mask R-CNN.
ParametersValue
Iterations360
Leaning rate0.001
Batch size1
Table 10. Results from Common Objects in Context (COCO) evaluator.
NetworkAPAP at IoU = 0.50AP at IoU = 0.75
Bounding Box0.5490.8570.672
Segmentation0.5400.8580.674
Table 11. Summary of model losses.
Total LossLoss ClassificationLoss Box RegressionLoss Mask
0.4800.0530.1540.240
Disclaimer/Publisher’s Note: The statements, opinions and data contained in all publications are solely those of the individual author(s) and contributor(s) and not of MDPI and/or the editor(s). MDPI and/or the editor(s) disclaim responsibility for any injury to people or property resulting from any ideas, methods, instructions or products referred to in the content.