Abstract
One type of seepage water that is difficult to plug by grouting is the water exuding through the pores of sandstone in deep underground engineering. Aiming at this problem, this paper collected deep-mine sandstone samples from the Southwest Shandong coalfield, studied the sandstone pore structure and its influential factors by casting thin slices, scanning electron microscopy, mercury intrusion and physical property tests, and selected five representative permeability classification indicators: permeability, porosity, average pore throat radius, comprehensive diagenetic coefficient and sorting coefficient. According to these five indicators, the pore permeability of all the sandstone samples was divided into four subcategories (I1, I2, II1, and II2) from the perspective of grouting. I1 has medium pores and medium pore throats that can be filled with ultrafine cement-based slurries; I2 has medium-small pores and fine pore throats; II1 has medium-small pores and fine pore throats or small pores and microthroats; both I2 and II1 can be filled with chemical slurries; and II2 has micropores and microthroats that cannot be grouted. This case study provides a reference for the classification and evaluation of the pore permeability of sandstone for grouting and lays a foundation for classified permeation grouting and subsequent pore-expanding permeation grouting.
1. Introduction
In the 21st century, due to a large number of deep underground engineering projects, such as deep coal mining, deep tunnel construction and deep nuclear waste storage [1,2,3,4], the impacts of groundwater seepage through pores on these projects cannot be ignored [5]. For example, most of the strata that are crossed by deep mining shafts are sedimentary sandstones with abundant water and developed pores [6,7,8,9,10]. Years of experience in grouting sandstone aquifers to plug water seepage in deep mining shafts have shown that even when cementing and chemical grouting are carried out in the rock mass behind the wall and the main water inflow channels (fractures) in the rock mass are effectively blocked, residual water can still seep through sandstone pores in the shaft wall. This seepage cannot be ignored because the total water leakage exceeds the upper limit of the accepted specification (≤10 m3/h, see the relevant Code for acceptable shaft sinking and drifting for coal mines in China GB 50213-2010) [11]. The difficulty of grouting sandstone pores has become a bottleneck that restricts the rapid excavation and normal handover of shafts [12].
Unlike fracture seepage, the underground water that seeps from sandstone pores has no visible seepage outlet, so it manifests as “large-area sweating” rather than “local spraying”. A small area of “sweating” in shallow shafts generally produces a small seepage discharge, so the prevention and control of sandstone pore water in shallow shafts is often ignored. However, deep mine shafts in sandstones have two remarkable characteristics—a large water seepage area and a high pore water pressure on the shaft wall—resulting in a high degree of pore seepage discharge compared with shallow shafts.
Because the pore seepage channels of sandstone are generally narrow and structurally complex, they are difficult to grout. The traditional prevention and control methods for fracture water are not ideal for pore water. For example, the freezing method is not ideal for the deep parts of mining shafts, and ground pregrouting technology generally involves clay cement slurry, which is mainly suitable for fractured strata but unsatisfactory for pore water in cemented sandstone. At present, there is no ideal method for preventing pore water seepage in sandstone, and research on sandstone permeation grouting is limited; only a few scholars have carried out laboratory porous seepage experiments with porous materials similar to rocks [13].
According to past engineering practice [14,15,16,17,18], the main technical problems involved with the use of permeation grouting to plug seepage water from sandstone pores include two aspects: groutability and reduced permeability. Groutability is the primary problem to be solved and mainly depends on the sandstone pore structure. Therefore, by analyzing various types of data, such as casting thin slice observations, scanning electron microscopy (SEM) results and mercury injection capillary pressure (MICP) test results, the sandstone pore structure and its influential factors were studied in this paper to establish an effective classification and evaluation method of the pore permeability for sandstone grouting and to explore a classified permeation grouting method. An overview of the flow of this study is shown in Figure A1 of Appendix A. First, taking the three most widely distributed layers of sandstone aquifers in the Southwest Shandong coalfield as experimental samples, four appropriate experimental methods for studying sandstone pore structure and permeability are selected, which are widely used in petroleum fields. Next, based on the analysis of the experimental results, the pore structure of sandstone is determined, various influencing factors of sandstone permeability are analyzed, and the key evaluation indicators of sandstone permeability are selected. Then, according to the five selected key classification indicators, the pore permeability of all the deep sandstone samples is classified and quantitatively evaluated from the perspective of grouting. Grouting recommendations are proposed, and future research directions are discussed.
2. Materials and Methods
2.1. Sample Collection
All the deep-mine sandstone samples in this paper were collected from typical sections in the deep coal mines of the Southwest Shandong coalfield. Horizons of some of the samples are shown in Figure 1 and Figure 2.
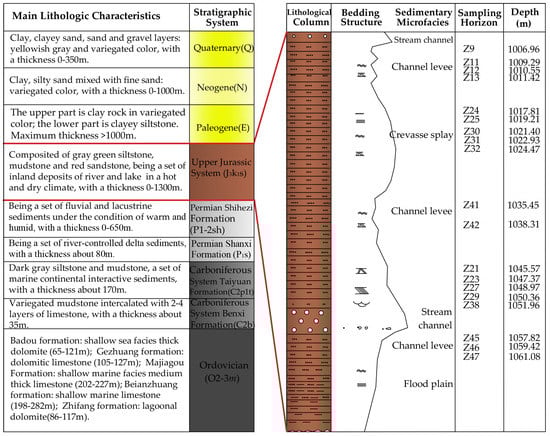
Figure 1.
The sampling horizons and depths of the Jurassic sandstone collected from the Anju coal mine of the Southwest Shandong coalfield: The colored column on the left shows the overall stratigraphic structure of the Southwest Shandong coalfield; The orange column on the right shows the stratigraphic texture of the Jurassic System (J3k1s) in detail.
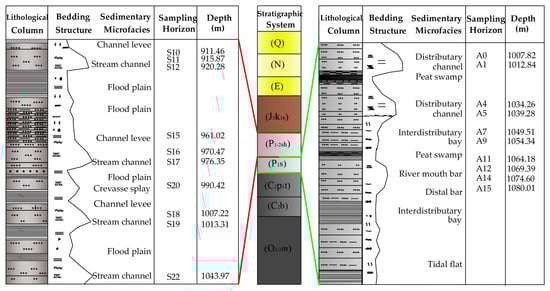
Figure 2.
The sampling horizons and depths of the Permian Shihezi (P1–2sh) and Shanxi Formation (P1s) sandstone collected from the Anju coal mine of the Southwest Shandong coalfield: The gray column on the left shows the stratigraphic texture of P1–2sh in detail; The gray column on the right shows the stratigraphic texture of P1s in detail; The colored column in the middle shows the overall stratigraphic structure of the Southwest Shandong coalfield.
The strata in the Southwest Shandong coalfield are part of the West Shandong stratigraphic subprovince, which is part of the North China stratigraphic province. From oldest to most recent, Ordovician (O2–3m), Carboniferous (C2p1t and C2b), Permian (P1–2sh and P1s), Jurassic (J3k1s), Paleogene (E), Neogene (N) and Quaternary (Q) rocks exist, as shown in Figure 1 and Figure 2. The three most widely distributed layers of sandstone aquifers are the Permian Shanxi Formation sandstone (P1s), Permian Shihezi Formation sandstone (P1–2sh) and Jurassic sandstone (J3k1s), which have an important impact on coal mining in the Southwest Shandong coalfield [6,8]. In this study, more than 800 m of drilling cores from the 28 wells of the Anju, Tangkou, Xiezhuang, Huafeng and Longyun coal mines were logged and approximately 310 core samples (length 50–300 mm, diameter 50 mm) were collected (see Appendix B for more detailed information about stratigraphic texture and sampling horizon).
2.2. Experimental Methods
According to the scheme of this study (Figure A1), the experimental work was carried out as follows. All of the samples were transported to the laboratory without disturbance; the samples were sealed to retain moisture, held under pressure, and divided into four groups (Figure 3).
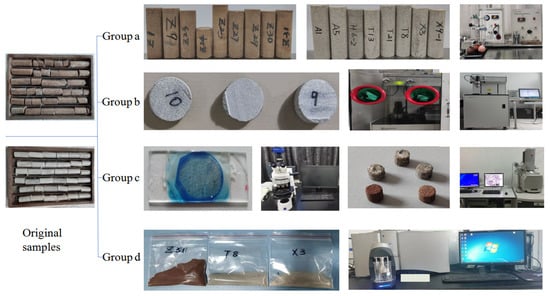
Figure 3.
The original samples were divided into four groups to carry out various laboratory tests: (a) Standard plunger rock samples with a diameter of 25.4 mm and heights of 25.4–50.8 mm made by nondestructive wire cutting for porosity and permeability tests. (b) Samples with a height of 7.0–12.0 mm and diameter of 25.4 mm for mercury injection testing. (c) Casting thin slices for Zeiss Imaging-2M polarizing microscope observation; Samples with a height of 6.0 mm and diameter of 4.0 mm for SEM observation. (d) Samples by crushing, grinding, removing cement with hydrochloric acid and drying for grain size analysis.
The first group was used to test the porosity and permeability with STY-2 gas permeability and porosity meters according to the specifications of the Core Analysis Method [19] and the Measurement Method for Rock Pore Volume Compressibility [20]; the second group was used to test the pore throat size of sandstone with an MAP 9500 mercury porosimeter; the third group was used to observe the composition and texture of the grains and pore structure of the sandstone with a Zeiss Imaging-2M polarizing microscope and Nova Nano 450 SEM; and the fourth group was used to analyze the grain size of sandstone with a Mastersizer 3000E laser grain size analyzer (see Appendix C for clearer pictures of the experimental devices and samples).
3. Results and Analysis
Large amounts of data concerning the lithological and physical properties of deep-mine sandstone, such as the shape and size of the sandstone particles, the shape and size of the pores and pore throats, the porosity and permeability, and the shape of the mercury pressure curve, were obtained by the four groups of experiments for all samples, as shown in Appendix D Table A1, Table A2, Table A3 and Table A4. The following description of pore structure and its influencing factors is based on the statistical analysis of the above experimental data and a large number of existing sedimentary petrology theories and research results.
3.1. Pore Structure
3.1.1. Pore Types
According to the occurrence, the pore types of all the deep-mine sandstone samples collected from the Southwest Shandong coalfield can be divided into four categories: intergranular pores, intragranular pores, intercrystalline pores and microcracks.
Intergranular pores are an important pore type that affects the grouting of deep-mine sandstone, and they can be divided into two subcategories—primary pores and secondary pores—according to their genesis. Both subcategories of intergranular pores can be further divided into two subcategories according to their occurrence and origin. The types and contents of intergranular pores in the three layers of sandstone are shown in Table 1, and the types and appearance probabilities of the intergranular pores in the three layers of sandstone are shown in Figure 4. The pores and pore throats of some samples are shown in Figure 5.

Table 1.
Types and contents of intergranular pores in three layers of sandstone *.
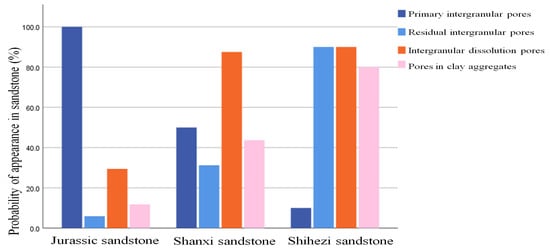
Figure 4.
Types and appearance probabilities of intergranular pores in three layers of sandstone (%).
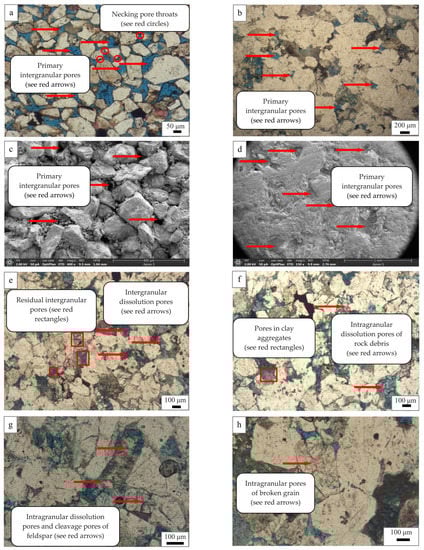
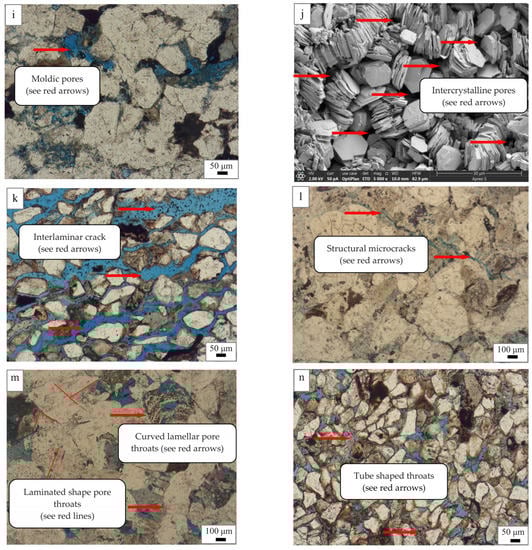
Figure 5.
The types of pores and pore throats in the deep-mine sandstone: (a) Jurassic sandstone, plane polarized light (PPL). (b) Permian sandstone, PPL. (c) Jurassic sandstone, SEM. (d) Permian sandstone, SEM. (e) Permian sandstones, PPL. (f) Permian sandstone, PPL. (g) Permian sandstone, PPL. (h) Permian sandstone, PPL. (i) Permian sandstone, PPL. (j) Permian sandstone, SEM. (k) Jurassic sandstone, PPL. (l) Permian sandstone, PPL. (m) Permian sandstone, PPL. (n) Jurassic sandstone, PPL.
The primary intergranular pores (Figure 5a,c) in the Jurassic sandstone are the most important pore type that affect the grouting performance; they are largely preserved, with a 100% probability of appearance, as shown in the dark blue bar in Figure 4, and comprise 2.5–9.0% of the sandstone visual area, as shown in the bold dark blue numbers in Table 1. The other types of intergranular pores in the Jurassic sandstone are rare, with only a 5.9–29.4% probability of appearance, and they comprise less than 0.5% of the sandstone visual area. In contrast, the primary intergranular pores (Figure 5b,d) have a much lower content in the Permian sandstone than in Jurassic sandstone; these pores have only a 10–50% probability of appearing in Permian sandstone, comprise 0.1–3.5% of the sandstone visual area, and have a large deviation in size. The other types of intergranular pores, including residual intergranular pores, intergranular dissolution pores and pores in clay aggregates (Figure 5e,f), are relatively well developed in the Permian sandstone; these pores have a 31.2–90% probability of appearance, as shown in Figure 4, and they comprise 0.1–2.0% of the sandstone visual area, as shown in Table 1. Therefore, the large difference in the content of primary intergranular pores between the Jurassic sandstone and Permian sandstone shows that the diagenetic modification of pore structure in the Permian sandstone is much stronger than that in the Jurassic sandstone, which results in the porosity and permeability of the Permian sandstone being much lower than those of the Jurassic sandstone.
The intragranular pores are more developed in the Permian sandstone than in the Jurassic sandstone, as shown in Table 2. The most developed intragranular pores in the three layers of sandstone are intragranular dissolution pores of feldspar (Figure 5g), followed by intragranular dissolution pores of rock debris (Figure 5f) and cleavage pores (Figure 5g). Only a small number of moldic pores (Figure 5i) and pores in broken grains (Figure 5h) were found.
Table 2.
Types, appearance probabilities and contents of intragranular pores in three layers of sandstone *.
The intercrystalline pores (Figure 5j) formed during diagenesis and are chiefly associated with diagenetic clay minerals; these pores are mostly found in the intercrystalline areas of calcareous cement and authigenic clay cement in the three layers of sandstone; they are generally micropores with diameters less than 0.5 µm and can be identified only under SEM. Because they are too small to grout, they are not the main object of this study.
The microcracks include interlaminar cracks (Figure 5k) caused by sedimentation and structural microcracks (Figure 5l) caused by tectonism. Along the microcrack direction, the permeability of the sandstone would be improved significantly due to good pore connectivity [21,22,23]. However, because microcracks are very rare in all of the sandstone samples in this study, they are not part of the main object of this study.
3.1.2. Pore Throat Types
The main types of pore throats in the three layers of sandstone are necking pore throats, laminated shape pore throats, curved lamellar pore throats and tube-shaped throats, among which necking pore throats (Figure 5a) are found mainly in Jurassic sandstone. Laminated shape pore throats and curved lamellar pore throats (Figure 5m) occur in Permian sandstone, and tube-shaped throats (Figure 5n) are mostly found in sandstones with high contents of clay aggregates and developed micropores.
3.1.3. Sizes of Pores and Pore Throats
The pore size was measured based on the visual diameter of the pores in the casting thin slices and SEM observations, as shown in Table 3. Because the velocity of mercury injection depends mainly on the pore throat sizes, the pore and pore throat sizes measured by the mercury injection tests mainly indicate the pore throat sizes of sandstone [14,16,17,18], as shown in Table 3.
Table 3.
Sizes of pores and pore throats in deep-mine sandstone.
To date, the classification and nomenclature of the size grading of pores and pore throats in different branches of science vary due to differences in the object and purpose of research [24,25,26,27,28,29]. Based on the characteristics of the pores and pore throats of deep-mine sandstones in the study area and in reference to Li Daopin’s classification of the sizes of pores and pore throats, which is a commonly used classification scheme in China for low- to ultralow-permeability sandstone [28], the size grading of pores and pore throats was classified and named from the perspective of grouting, as shown in Table 4. A comparison of the data in Table 3 and Table 4 shows that the main distribution range of pore sizes in the Jurassic sandstone changes from small to medium grades, and the average pore throat radii change from small to medium. The main distribution range of pore sizes in the Shihezi Formation and Shanxi Formation changes from micro to medium grades, the average pore throat radii are mostly of the micro grade, and only a few are small grade.
Table 4.
Classification standard of the sizes of pores and pore throats in deep-mine sandstones.
3.1.4. Pore Connectivity and Permeability
To summarize the previous three sections (Section 3.1.1, Section 3.1.2 and Section 3.1.3): primary intergranular pores are common in the Jurassic sandstone (Figure 5a,c); the pores have a 100% probability of appearance in sandstone and comprise 2.5–9.0% of the visual area of sandstone. The Jurassic sandstone is dominated by necking pore throats and has average pore throat radii of 0.74–4.93 µm; thus, this sandstone has a high connectivity, porosity and permeability (Figure 6a,b), and the correlation between porosity and permeability is strong (Figure 6c). In general, the Jurassic sandstone is a medium- to low-permeability sandstone.
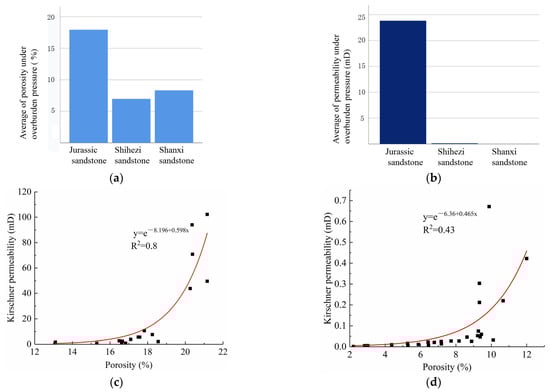
Figure 6.
The comparisons and correlations of porosity and permeability: (a) The porosity comparisons of the three layers of sandstone. (b) Permeability comparisons of the three layers of sandstone. (c) The correlation between porosity and permeability in the Jurassic sandstone. (d) The correlation between porosity and permeability in the Permian sandstone.
However, the Permian sandstone, including the Shihezi and Shanxi Formations, has irregular pore shapes and large pore size differences. The primary intergranular pores in the Permian sandstone are much lower in number (Figure 5b,d), have a 10–50% probability of appearance in sandstone, comprise 0.1–3.5% of the visual area of sandstone, and have a large deviation in size; these are some of the reasons for the low porosity and permeability of Permian sandstone (Figure 6a,b). The pore throats in the Permian sandstone are small and fine, with average throat radii of 0.04–0.62 µm; laminated shape pore throats and curved lamellar pore throats are the main shapes, which is another reason for the poor pore connectivity and low permeability. This is similar to the pore throat characteristics of the Lower Cretaceous Quantou Formation sandstone [30]. An increase in the three types of pores, including intergranular dissolution pores, intragranular dissolution pores and intercrystalline pores, can improve the porosity of sandstone, but most of these pores are dead-end pores (Figure 5e–j), which have a limited contribution to the pore connectivity of the Permian sandstone, so the correlation between porosity and permeability is poor (Figure 6d). Generally, the Permian sandstone is a low- to ultralow-permeability sandstone, with the pore structure characterization of tight sandstones [31,32].
3.2. Factors Influencing the Pore Structure
A large number of research results have indicated that sandstone, as a sedimentary rock, has pore structure characteristics that are the result of the joint action of three factors: sedimentation, diagenesis and tectonism. Therefore, this paper analyzes these three factors independently.
3.2.1. Sedimentation
Table 5 summarizes the statistics of the main compositional and textural properties of all the sandstone samples. All the Jurassic sandstone samples are well-sorted fine-grained sandstone, and their grain size frequency curve has a single peak and nearly normal distribution (Figure 7a). In contrast, the Permian sandstone samples are heterogranular and are a moderately to well-sorted sandstone, and their grain size frequency curve has a multipeak and nonconcentrated distribution (Figure 7b).
Table 5.
The compositional and textural properties of the three layers of sandstone.
Figure 7.
The distribution curves of the frequency and cumulative frequency of grain sizes: (a) The Jurassic sandstone has a single peak and nearly normal distribution in the grain size frequency curve (sample Z23). (b) The Permian Shanxi sandstone has a multipeak and nonconcentrated distribution in the grain size frequency curve (sample X9).
Recent studies have shown that the grain size, sorting, shape, and matrix content determine the initial pore space among the sand grains, i.e., the intergranular pore volume of the sediment [33,34,35]. Researchers have performed a considerable amount of research on this topic. Graton and Fraser [36] studied the relationships among the grain size, sorting and accumulation modes of grains, and their study results show that the porosity of sand depends on the sorting coefficient but is independent of grain size. Beard and Weyl [37] and Scherer [38] established a statistical formula that encompasses porosity and the sorting coefficient, as shown in Equation (1). Many researchers [39,40] have used the formula to estimate the initial porosity of sandstone in a diagenetic study. In this paper, the initial porosity of deep-mine sandstone in the study area was estimated based on the formula given by Scherer (Equation (1)).
where Φo is the initial porosity and So is the Trask sorting coefficient.
The result of the calculation is illustrated in Figure 8. Figure 8a shows that the original porosities of sandstone in the Shanxi and Shihezi Formations are similar but lower than those of the Jurassic sandstone, which is related to the good sorting and low matrix content in the Jurassic sandstone and shows that sedimentation directly controls the development of the original pore structure of sandstone. Figure 8b–d shows that the permeability has a moderately positive correlation with the content of grains (diameters greater than 0.125 mm) and a moderately negative correlation with the sorting coefficient and the matrix content, which indicates that sedimentation has an obvious influence on the permeability of sandstone; however, it is not the only influential factor because the R2 value fitted by the three curves is not very high.
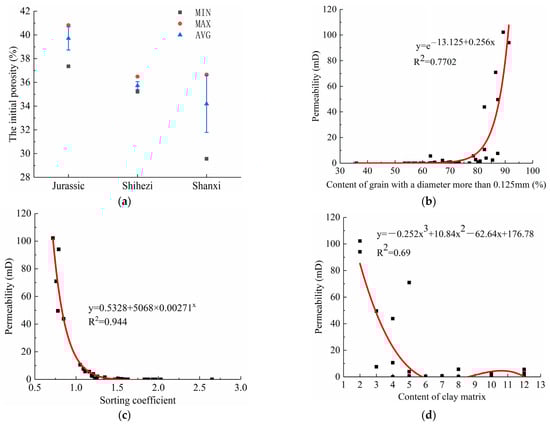
Figure 8.
The effects of sedimentation on the pore structure and permeability of the deep-mine sandstone: (a) Initial porosity comparisons of the three layers of sandstone. (b) Correlation between the permeability and the content of grains larger than 0.125 mm. (c) The correlation between the permeability and sorting coefficient. (d) The correlation between the permeability and clay matrix contents.
In summary, sedimentation is an innate factor affecting the sandstone pore structure and permeability, and the influence of the sorting coefficient, which is the most important sedimentation indicator, has been consistently recognized by many researchers.
3.2.2. Diagenesis
A large number of casting thin slice observations in this study indicate that the main diagenesis types are compaction, cementation and dissolution (Figure 5). Current studies show that the strength of diagenesis can be characterized quantitatively by three diagenesis indicators: the visual compaction rate, visual cementation rate and visual dissolution rate. The three diagenesis indicators are calculated from the casting thin slice observation data following established formulas [35,39,41,42,43,44], as shown in Figure 9.
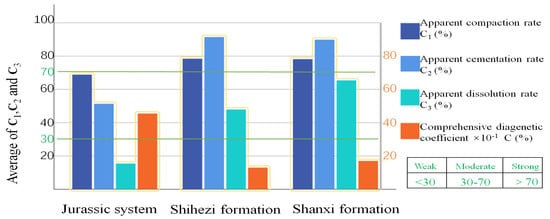
Figure 9.
The main diagenesis indicators of the three layers of deep-mine sandstone.
According to the classification standard of the visual compaction rate, visual cementation rate and visual dissolution rate used by most scholars [43,45], as shown in Figure 9 (green letters), the Jurassic sandstone has a moderate degree of compaction, a moderate degree of cementation and a weak degree of dissolution, while the Permian Shihezi and Shanxi Formation sandstones have a strong degree of compaction, a strong degree of cementation and a moderate degree of dissolution (Figure 9). These results indicate that the pore structure of the Permian sandstone has been modified more heavily by compaction, cementation and dissolution compared to that of the Jurassic sandstone.
Because the visual compaction rate, visual cementation rate and visual dissolution rate represent only one aspect of diagenetic intensity, many scholars have introduced the concept of a comprehensive diagenetic coefficient to characterize diagenetic intensity [35,43,44], as shown in Equation (2).
where C is the comprehensive diagenetic coefficient, Փ is the porosity, C1 is the visual compaction rate, C2 is the visual cementation rate, and Փm is the microporosity rate.
The effective porosity, compaction strength and cement strength are integrated in Equation (2) to quantitatively characterize the diagenetic intensity. Therefore, the comprehensive diagenetic coefficient can fully and quantitatively reflect the intensity of various diagenetic processes experienced by the sandstone, and the larger the value of the comprehensive diagenetic coefficient, the lower the degree of diagenesis.
As shown in Figure 9 (orange bars), the comprehensive diagenetic coefficient of the Shihezi Formation sandstone is close to that of the Shanxi Formation sandstone but far smaller than that of the Jurassic sandstone. In other words, the three layers of deep-mine sandstone in the Southwest Shandong coalfield can be clearly divided into two categories by the comprehensive diagenetic coefficient: category I is the Jurassic sandstone and category II is the Permian sandstone.
3.2.3. Tectonism
Past investigations have shown that sedimentation, diagenesis and tectonism are generally the important factors influencing the physical properties of sandstone [35,46,47,48,49]. However, considering the fact that all plunger samples used in this paper are small in size and have no fractures, the tectonic influence on the pore structure of these samples can be basically ignored.
4. Discussion
4.1. Classification and Quantitative Evaluation of Pore Permeability
4.1.1. Determination of Classification and Evaluation Parameters
Permeability can comprehensively indicate the penetration capacity of the sandstone pore structure. From the perspective of grouting, ideally, permeability is used as the only classification indicator. However, permeability is a three-dimensional parameter with characteristics of anisotropy [21,22,23], and its value is easily affected by sampling location, the sampling horizon, preservation methods, test methods, test conditions and many other factors, so this paper chooses a multi-indicator comprehensive evaluation method to classify and evaluate the sandstone pore structure.
As noted in Section 3.2 (“Factors Influencing the Pore Structure”), sedimentation and diagenesis are two main factors influencing the formation of the pore structure. The former is an innate factor that determines the pore structure formation; the latter is an acquired factor that affects the pore structure evolution. Thus, the representative indicators of sedimentation and diagenesis should be included in the classification evaluation system. Second, porosity can comprehensively indicate the storage capacity of the sandstone pore structure, and it should also be included in the classification evaluation system. Third, the mercury intrusion experiment is highly comparable to the grouting experiment, and the average pore throat radius could reflect the feasibility of grouting and possible type of grouting. Therefore, this paper selects the porosity, average pore throat radius, comprehensive diagenetic coefficient and sorting coefficient as the representative indicators of comprehensiveness, similar experiments, diagenesis and sedimentation, respectively. Finally, a comprehensive evaluation system of the pore structure based on permeability is formed by adding the crucial indicator permeability that can directly reflect the difficulty of grouting.
4.1.2. Category Classification
As noted in Section 3.1 and Section 3.2 (“Pore Structure” and “Factors Influencing the Pore Structure”), according to the five indicators, namely, permeability, porosity, average pore throat radius, comprehensive diagenetic coefficient and sorting coefficient (PPACS), the deep-mine sandstone pore structure in the Southwest Shandong coalfield can be easily divided into two categories (Table 6). Category I is the Jurassic sandstone, which is a medium–low-permeability sandstone. Category II is the Permian sandstone, which is a low–ultralow-permeability tight sandstone.
Table 6.
Classification of the pore structure category of the deep-mine sandstone.
4.1.3. Subcategory Classification
Further data analysis on sandstone in categories I and II reveals that intracategory sandstone still has large differences with respect to the five classification indicators (PPACS). For example, the variation range of the intracategory permeability of category I sandstone is 0.70–102.17 mD, which indicates that the pore structure of these sandstones is still quite different. To accurately grout sandstone pores based on sandstone permeability classification, both the intercategory and intracategory differences should be fully taken into account; thus, it is necessary to further divide the two sandstone categories into more subcategories. Here, the cluster analysis method is introduced into this paper to classify pore structure subcategories.
For category I, first, the sample database is established based on the data of grain size analysis, casting thin slice observations, mercury injection tests, and porosity and permeability tests of all Jurassic sandstone samples, and second, K-means cluster analysis is carried out on all samples based on the five indicator variables (PPACS). Category I is divided into two subcategories (I1 and I2). The cluster analysis results are shown in Table 7.
Table 7.
Final cluster center and cluster range of subcategories I1 and I2.
For category II, the same method is applied to the Permian sandstone samples. The K-means cluster analysis results are shown in Table 8.
Table 8.
Final cluster center and cluster range of subcategories II1 and II2.
4.1.4. Comprehensive Classification and Quantitative Evaluation
Summarizing the classification results of the above categories and subcategories in this section, the comprehensive classification and evaluation of the deep-mine sandstone pore structure in the Southwest Shandong coalfield is as follows (Table 9 and Appendix D Table A5, Table A6 and Table A7).
Table 9.
Comprehensive classification of the pore structure of the deep-mine sandstone.
Subcategory I1 Jurassic sandstone was originally deposited in a stream channel environment and has the characteristics of very good sorting and low clay content. By undergoing moderate compaction and moderate cementation, this sandstone became a weakly consolidated sandstone with medium pores and pore throats; it has the highest primary intergranular pore content (>7%), contains mainly necking pore throats and has a better pore connectivity (Figure 10a and Figure 11a). The sandstone has the largest porosity and the highest permeability. The shapes of the capillary pressure curves show coarse skewness and well-sorted pore throats, and the sandstone has the largest average pore throat radius, the smallest threshold pressure and the smallest pressure at 50% mercury saturation (Figure 12a).
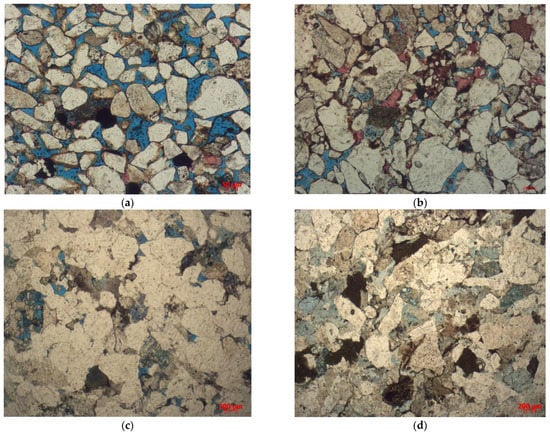
Figure 10.
Comparisons of pores, pore throats and pore connectivities among the four subcategories of sandstone in casting thin slices under a polarizing microscope (note that the deep blue colors are mostly intergranular pores, the light blue colors are mostly intragranular pores and micropores). (a) Subcategory I1 sandstone (Z23). (b) Subcategory I2 sandstone (Z11). (c) Subcategory II1 sandstone (X9). (d) Subcategory II2 sandstone (T13).
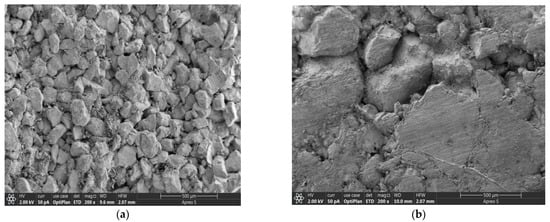
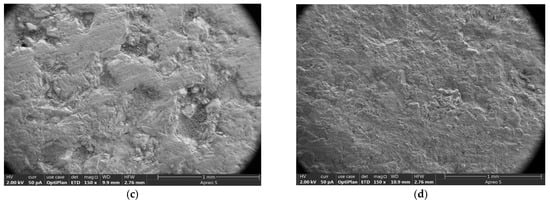
Figure 11.
Comparison of pores, pore throats and pore connectivities among the four subcategories of sandstone under SEM (note that the images (a–d) correspond to the images a–d in Figure 10, respectively). (a) Subcategory I1 sandstone (Z23). (b) Subcategory I2 sandstone (Z11). (c) Subcategory II1 sandstone (X9). (d) Subcategory II2 sandstone (T13).
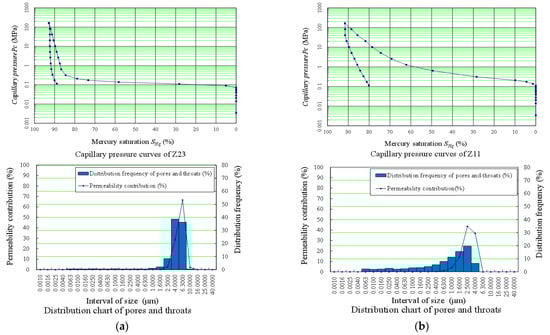
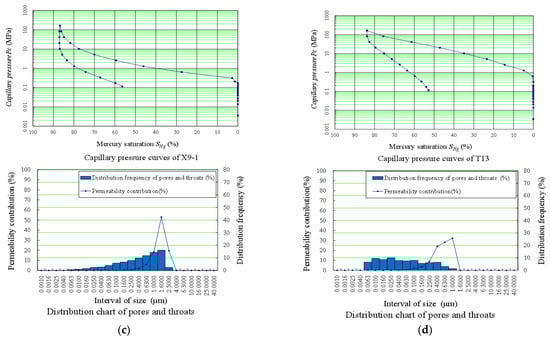
Figure 12.
Comparison of the capillary pressure curves of four subcategories of sandstone, showing the differences in the pores, pore throats and their permeability contributions among the four subcategories of sandstone: (a) Subcategory I1 sandstone shows a lower left distribution, well-sorted pore throats, coarse throat peaks at 4 to 6 µm, and a higher peak; nearly all of the pore throats contribute to the permeability. (b) Subcategory I2 sandstone shows a slight lower left distribution, well- to moderately sorted pore throats, coarse throat peaks at 1.6 to 4 µm, and a high peak; most of the pore throats contribute to the permeability. (c) Subcategory II1 sandstone shows a slight upper right distribution, moderately to poorly sorted pore throats, coarse throat peaks at 1 to 1.6 µm, and a moderate to low peak; approximately half of the pore throats contribute to the permeability, but with large differences. (d) Subcategory II2 sandstone shows an upper right distribution, poorly sorted pore throats, coarse throat peaks at 0.0063–0.1 µm, and a lower peak; minute amounts of pore throats contribute to the permeability.
Subcategory I2 Jurassic sandstone was originally deposited in a crevasse splay or channel levee environment; it has the characteristics of good sorting and a low clay content. By undergoing moderate compaction and cementation, it became a weakly consolidated sandstone with medium-small pores and fine pore throats; this sandstone has a high primary intergranular pore content (2–7%), contains mainly necking pore throats and secondary laminated shape pore throats, and has a good pore connectivity (Figure 10b and Figure 11b). It has a high porosity and high permeability. The shapes of the capillary pressure curves show slight coarse skewness and well- to moderately sorted pore throats, and the sandstone has a large average pore throat radius, low threshold pressure and low pressure at 50% mercury saturation (Figure 12b).
Subcategory II1 Permian Shihezi and Shanxi Formation sandstones were originally deposited in stream channel or delta distributary channel environments; they have the characteristics of good sorting and a high clay content. By undergoing strong compaction and strong cementation, these sandstones became a tight sandstone with medium-small pores and fine pore throats or small pores and microthroats; these sandstones have irregularly shaped pores and large differences in pore sizes and thus a large variability in the distributions of primary intergranular pores (0.5–2%) and laminated shape and curved lamellar pore throats; this results in a poor pore connectivity (Figure 10c and Figure 11c). They have a low porosity and low permeability. The shapes of the capillary pressure curves show slight fine skewness and moderately to poorly sorted pore throats; these sandstones have a large deviation in the distribution of the average pore throat radius, high threshold pressure and high pressure at 50% mercury saturation (Figure 12c).
Subcategory II2 Permian Shihezi and Shanxi Formation sandstones were originally deposited in channel levees, crevasse splays and delta interdistributary bay environments, and they have the characteristics of moderate to poor sorting and the highest clay content. By undergoing strong compaction and strong cementation, they became tight sandstones with micropores and microthroats; these sandstones have few primary intergranular pores (<0.5%), mainly tube-shaped throats, and the poorest connectivity of pores (Figure 10d and Figure 11d). They have the smallest porosity content and the lowest permeability. The shapes of the capillary pressure curves show fine skewness and poorly sorted pore throats; these sandstones have the smallest average pore throat radii, the largest threshold pressures and the largest pressures at 50% mercury saturation (Figure 12d).
4.2. Grouting Recommendations for Different Sandstone Subcategories
The principles of the mercury injection and grouting tests are very similar. Thus, this paper evaluates grouting difficulty and proposes grouting suggestions by evaluating the mercury injection test parameters of the different subcategories of sandstone in Table 10.
Table 10.
Parameters and recommendations for different sandstone subcategories.
As shown in Table 10, among the results of all the subcategories, the primary intergranular pore content of subcategory I1 sandstone is more than 7%, the pore structure is well connected, the threshold pressure and the pressure at 50% mercury saturation are the smallest, and the average pore throat radius is the largest. Considering that the minimum average radius of ultrafine cement particles on the market is less than 1 μm and the average pore throat radius of subcategory I1 sandstone is greater than 3 μm (making it more than three times the average radius of microfine cement particles), according to practical experience of related grouting engineering work [50,51], a microfine cement slurry could penetrate through the pore throats of subcategory I1 sandstone. Therefore, the suspension slurry approach is recommended for grouting in subcategory I1 sandstone. The average pore throat radii of subcategory I2 sandstone are 0.738–3.623 μm, namely, generally less than three times the radii of microfine cement particles. Consequently, suspension slurry grouting is quite difficult, so chemical grouting is generally recommended for subcategory I2 sandstone. However, if the primary intergranular pores are quite well developed locally in subcategory I2 sandstone and the average pore throat radius is greater than 3 µm, it is possible to use suspension slurry grouting for subcategory I2 sandstone. Subcategory II1 sandstone has a small intergranular pore content, poor pore connectivity, a high threshold pressure and pressure at 50% mercury saturation, and an average pore throat radius that is smaller than the minimum radius of suspension slurry particles; thus, chemical grouting is recommended. Moreover, if the average pore throat radius of subcategory II1 sandstone is too small locally, it is necessary to expand the pore cavity before chemical grouting. Subcategory II2 sandstone contains few intergranular pores and mainly contains micropores and various intragranular pores, and it has the highest threshold pressure and the smallest average pore throat radius (generally smaller than 0.1 µm). Chemical grouts have difficulty penetrating such a structure, so chemical grouting cannot be carried out.
4.3. Application of Classified Grouting in Engineering
In many deep coal mines in China, one type of seepage water that is difficult to plug by grouting is the water exuding through the pores of sandstone in deep-mine shafts. At present, there are few experimental and theoretical studies on the pore structure and permeability mechanism of sandstone, which leads to the randomness of grouting parameters and grouting effects and seriously affects the acceptance and long-term stability of the shaft. Based on the study of sandstone pore structure and its influencing factors of permeability, this paper presents a new method for the classification and evaluation of sandstone pore permeability from the perspective of grouting, which is helpful to correctly select grouting methods and grouting parameters and improve the grouting effect.
For instance, in the Southwest Shandong coalfield, the three most widely distributed layers of sandstone aquifers are the Permian Shanxi Formation sandstone (P1s), Permian Shihezi Formation sandstone (P1–2sh) and Jurassic sandstone (J3k1s), which are often seen in the shafts and roadways of deep coal mines and have an important impact on coal mining. Therefore, the classified grouting method was first applied in deep coal mines such as the Tangkou, Longyun, and Anju coal mines in the Southwest Shandong Coalfield. For example, in the process of plugging the pore water seepage of Jurassic sandstone and Shanxi Formation sandstone in the main and air shaft of the Tangkou Coal Mine and the pore seepage of the Shihezi Formation sandstone in the shaft bottom of the Longyun Coal Mine, engineers take samples of sandstone to determine the type of sandstone based on its permeability and plan the appropriate grouting scheme. Suspension slurry grouting is mainly used for the subcategory I1 sandstone and chemical grouting is used for subcategory I2 sandstone and subcategory II1 sandstone. Different types of sandstone are plugged with different types of slurries and grouting parameters, which have received good grouting results: increased groutability, greatly reduced permeability after grouting and good economic benefits.
4.4. Exploration of a New Pore-Expanding Permeation Grouting Technique in Future Research
Compared with fractures, sandstone pores have more complex structures and poorer connectivity, which results in great difficulties in pore permeation grouting. To solve this problem, this paper proposes to develop a new pore-expanding permeation grouting technique in future research. Its basic idea is to apply pore water pressure in the pores before grouting to expand the sandstone pores within the elastic limit to increase the connectivity of pores and improve the groutability of sandstone pores.
The operation method is as follows: first, to observe the seepage, diffusion and expansion mechanism of water and slurry in the sandstone pores by triaxial stress permeation testing and numerical simulation experimentation; second, to establish a mechanical model of pore-expanding grouting by stress–strain analysis; and finally, to identify the grouting process and grouting parameters for effectively plugging the pore water of deep-mine sandstone.
The research results will provide an important theoretical basis for pore expansion grouting in deep-mine sandstone and have important application value in many deep underground engineering projects.
5. Summary and Conclusions
Based on a variety of testing methods, this study studied the pore structure and permeability influencing factors of a large number of sandstone samples, and finally selected the five most representative permeability classification indicators to guide classified grouting. Based on this, the permeability of the three layers of sandstone aquifer that are the most widely distributed in the Southwest Shandong coalfield was classified and evaluated in detail, and suggestions for classified grouting were put forward. The main conclusions of this study are summarized as follows:
- Primary intergranular pores are common in the Jurassic sandstone (100% probability of appearance in the sandstone) and comprise 2.5–9.0% of the sandstone visual area. The Jurassic sandstone is dominated by necking pore throats (average pore throat radii of 0.74–4.93 µm); thus, the sandstone has good connectivity, high porosity and permeability and a good correlation between porosity and permeability. In general, the Jurassic sandstone is a medium- to low-permeability sandstone.
- The primary intergranular pores in the Permian sandstone are much lower in number (10–50% probability of appearance in the sandstone), comprise 0.1–3.5% of the sandstone visual area, and have a large deviation in their distribution. These pore features are an important reason for the low porosity and permeability of the Permian sandstone. The pore throats in the Permian sandstone are small and fine (average pore throat radii of 0.04–0.62 µm) and feature laminated shapes and curved lamellar shapes. These pore throat features are another reason for the poor pore connectivity and low permeability. Therefore, the Permian sandstone is a tight sandstone with a low to ultralow permeability.
- The direct factor affecting the permeability and groutability of sandstone is the pore structure of sandstone, and the main factors affecting the pore structure of sandstone are sedimentation and diagenesis. Sedimentation is an initial factor affecting the pore structure of deep-mine sandstone in the Southwest Shandong coalfield, and a comparative analysis of sandstone composition, structure and other characteristic indicators shows that the sorting coefficient is the most critical evaluation indicator reflecting the influence of sedimentation in this rock. Diagenesis is a later but more important factor affecting the pore structure of deep-mine sandstone in the Southwest Shandong coalfield. Differences in the comprehensive diagenetic coefficient of two of the studied categories of sandstone are highly consistent with the differences in their pore structure and physical properties, which indicates that diagenesis has the most important impact on the pore structure and that the comprehensive diagenesis coefficient is the best evaluation indicator reflecting the intensity of diagenesis.
- According to the five representative evaluation indicators, namely, permeability, porosity, average pore throat radius, comprehensive diagenetic coefficient and sorting coefficient, and using the multi-indicator comprehensive evaluation method based on permeability, the pore structure of deep-mine sandstone in the Southwest Shandong coalfield is divided into four subcategories (I1, I2, II1, and II2) belonging to two categories (I and II); of these subcategories, I1 has medium pores and pore throats that are suitable for grouting with microfine cement based slurry; I2 has medium-small pores and fine pore throats; II1 has medium-small pores and fine pore throats or small pores and microthroats; both I2 and II1 are suitable for grouting with chemical slurry; and II2 has micropores and microthroats that are unable to be grouted.
- Unlike fractures, sandstone pores have a complex structure and poor connectivity, which results in a large evaluation error by a single permeability indicator and great difficulties in pore permeation grouting. This paper presents a comprehensive classification method for the evaluation of sandstone pore permeability from the perspective of grouting, which is helpful for selecting the grouting method and parameters correctly and improving the grouting effect. The results of the present study can theoretically inform the exploration of a new pore-expanding permeation grouting technique in future research.
Author Contributions
Y.L.: conceptualization, methodology, writing—original draft, project administration. W.Q.: methodology, formal analysis, review and editing, supervision. X.Y.: formal analysis, writing—review and editing. Y.W.: validation, data curation. X.L. resources, investigation, software. S.Z.: investigation, funding acquisition. All authors have read and agreed to the published version of the manuscript.
Funding
The research reported in this manuscript was financially supported by the National Natural Science Foundation of China (Grant Nos. 51774192 and 51704183) and Natural Science Foundation of Shandong Province (Grant No. ZR2022QE134).
Institutional Review Board Statement
Not applicable.
Informed Consent Statement
Not applicable.
Data Availability Statement
Data sharing not applicable.
Acknowledgments
We thank the Anju Coal Industry Co., Ltd., Tangkou Coal Industry Co., Ltd., Xiezhuang Coal Industry Co., Ltd., Huafeng Coal Industry Co., Ltd. and Longyun Coal Industry Co., Ltd. for their providing samples and data access. The authors would also like to thank the anonymous reviewers for their comments that help improve the manuscript.
Conflicts of Interest
The authors declare that there is no conflict of interest regarding the publication of this paper.
Appendix A. Structural Logistics Scheme of This Study

Figure A1.
A general overview of the flow of this study.
Appendix B. Stratigraphic Texture and Sampling Horizon

Figure A2.
A brief strata list of the Southwest Shandong coalfield.

Figure A3.
The sampling horizon and depth of the Jurassic sandstone in borehole J3-1 of No. 6 mining area of the Anju coal mine, the Southwest Shandong coalfield, China.

Figure A4.
The sampling horizon and depth of the Shihezi Formation sandstone in borehole X12 of the Xinhe mining area of the Longyun coal mine, the Southwest Shandong coalfield, China.

Figure A5.
The sampling horizon and depth of the Shanxi Formation sandstone at No. 8 mining area of the Anju coal mine, the Southwest Shandong coalfield, China.

Figure A6.
The sampling horizon and depth of the Shanxi Formation sandstone at No. 12 mining area of the Tangkou coal mine, the Southwest Shandong coalfield, China.

Appendix C. Experimental Devices and Samples


Figure A8.
The experimental devices used in the present research. (a) STY-2 gas permeability and porosity meters. (b) Mastersizer 3000E laser grain size analyzer. (c) MAP 9500 mercury porosimeter (overall photo). (d) MAP 9500 mercury porosimeter (photo enlarged locally). (e) Zeiss Imaging-2M polarizing microscope. (f) Nova Nano 450 scanning electron microscopy.


Figure A9.
Some original samples and processed samples. (a) Original samples of the Jurassic sandstone collected from the borehole J3-1 of the Anju coal mine, with a diameter of 50 mm. (b) Original samples of the Shanxi Formation sandstone collected from the No. 12 mining area of the Tangkou coal mine, with a diameter of 50 mm. (c) Standard plunger rock samples of Jurassic sandstone with a diameter of 25.4 mm and heights of 25.4–50.8 mm, for porosity and permeability tests (From Anju coal mine). (d) Standard plunger rock samples of Shihezi Formation sandstone with a diameter of 25.4 mm and heights of 25.4–50.8 mm, for porosity and permeability tests (From Longyun coal mine). (e) Standard plunger rock samples of Shanxi Formation sandstone with a diameter of 25.4 mm and heights of 25.4–50.8 mm, for porosity and permeability tests (From Tangkou coal mine). (f) Standard plunger rock samples of Shanxi Formation sandstone with a diameter of 25.4 mm and heights of 25.4–50.8 mm, for porosity and permeability tests (From Anju coal mine).
Appendix D. Attachment of Table A1, Table A2, Table A3, Table A4, Table A5, Table A6 and Table A7
Table A1.
The five indicators (PPACS) for the classification and evaluation of deep-mine sand-stone.
Table A1.
The five indicators (PPACS) for the classification and evaluation of deep-mine sand-stone.
| Sample No. | K (mD) | Փ (%) | Rave (µm) | C (%) | So (%) |
|---|---|---|---|---|---|
| Z1 | 102.1700 | 21.16 | 4.568 | 7.69 | 0.72 |
| Z23 | 94.0540 | 20.36 | 4.93 | 6.17 | 0.79 |
| Z38 | 70.9000 | 20.38 | 3.814 | 5.23 | 0.76 |
| Z29 | 49.6370 | 21.16 | 4.116 | 5.19 | 0.78 |
| Z27 | 43.8370 | 20.26 | 3.797 | 4.57 | 0.85 |
| Z24 | 10.6520 | 17.82 | 3.623 | 6.12 | 1.05 |
| Z31 | 7.6076 | 18.25 | 2.517 | 4.83 | 1.09 |
| Z12 | 5.6690 | 17.50 | 1.128 | 3.65 | 1.11 |
| Z9 | 5.5626 | 17.58 | 2.324 | 3.90 | 1.16 |
| Z30 | 3.9094 | 17.10 | 1.642 | 4.47 | 1.21 |
| Z25 | 2.7078 | 16.49 | 1.531 | 4.68 | 1.19 |
| Z32 | 2.3820 | 16.66 | 1.423 | 2.87 | 1.20 |
| Z46 | 2.1500 | 18.56 | 1.321 | 3.09 | 1.26 |
| Z11 | 1.6010 | 13.10 | 1.296 | 3.38 | 1.35 |
| Z41 | 0.8980 | 16.83 | 0.789 | 2.85 | 1.25 |
| Z42 | 0.7270 | 16.62 | 0.756 | 3.69 | 1.25 |
| Z13 | 0.7020 | 15.30 | 0.738 | 5.11 | 1.23 |
| X9-1 | 0.6713 | 9.88 | 0.622 | 1.67 | 1.51 |
| A0 | 0.4220 | 12.00 | 0.588 | 2.23 | 1.55 |
| X3 | 0.3033 | 9.33 | 0.424 | 1.79 | 1.53 |
| A4 | 0.2197 | 10.67 | 0.344 | 1.73 | 1.52 |
| A1 | 0.2117 | 9.33 | 0.4 | 2.16 | 1.56 |
| T8 | 0.0751 | 9.27 | 0.331 | 1.74 | 1.53 |
| S12 | 0.0594 | 9.44 | 0.175 | 1.78 | 1.60 |
| S18 | 0.0527 | 9.23 | 0.167 | 1.96 | 1.56 |
| S22 | 0.0474 | 9.37 | 0.153 | 1.63 | 1.52 |
| A5 | 0.0462 | 8.63 | 0.342 | 1.64 | 1.63 |
| S16 | 0.0323 | 10.11 | 0.151 | 1.63 | 1.53 |
| S10 | 0.0277 | 8.18 | 0.149 | 1.58 | 1.57 |
| S11 | 0.0276 | 7.73 | 0.146 | 1.60 | 1.56 |
| S17 | 0.0259 | 8.89 | 0.143 | 1.92 | 1.47 |
| S19 | 0.0255 | 7.17 | 0.139 | 1.83 | 1.54 |
| S15 | 0.0220 | 6.43 | 0.137 | 1.58 | 1.85 |
| S20 | 0.0208 | 6.78 | 0.129 | 1.46 | 1.86 |
| T4 | 0.0162 | 5.27 | 0.128 | 0.33 | 2.65 |
| T3 | 0.0135 | 7.18 | 0.095 | 0.70 | 2.03 |
| T13 | 0.0110 | 5.88 | 0.104 | 1.52 | 1.88 |
| T2 | 0.0096 | 4.37 | 0.102 | 0.48 | 1.96 |
| T21 | 0.0070 | 6.45 | 0.078 | 1.37 | 1.83 |
| A9 | 0.0051 | 3.02 | 0.044 | 1.38 | 1.83 |
| A7 | 0.0049 | 2.84 | 0.049 | 1.31 | 1.97 |
| H11 | 0.0037 | 5.29 | 0.051 | 0.41 | 1.93 |
| H6-2 | 0.0010 | 2.21 | 0.048 | 0.40 | 1.96 |
K—Permeability under a net effective pressure (mD); Փ—Porosity under a net effective pressure (%); Rave—Average pore throat radius (µm); C—Comprehensive diagenetic coefficient (%); So—Sorting coefficient (%).
Table A2.
Some character parameters of mercury injection capillary pressure (MICP) test.
Table A2.
Some character parameters of mercury injection capillary pressure (MICP) test.
| Sample No. | Pd (MPa) | Rmax (µm) | P50 (MPa) | R50 (µm) | α (%) | CV (%) | Rave (µm) |
|---|---|---|---|---|---|---|---|
| Z1 | 0.11 | 6.682 | 0.131 | 5.601 | 0.684 | 0.247 | 4.568 |
| Z23 | 0.089 | 8.258 | 0.13 | 5.644 | 0.597 | 0.174 | 4.93 |
| Z38 | 0.11 | 6.682 | 0.157 | 4.673 | 0.571 | 0.6 | 3.814 |
| Z29 | 0.072 | 10.208 | 0.176 | 4.183 | 0.403 | 0.550 | 4.116 |
| Z27 | 0.11 | 6.682 | 0.11 | 6.682 | 0.568 | 0.684 | 3.797 |
| Z24 | 0.089 | 8.258 | 0.177 | 4.155 | 0.439 | 0.589 | 3.623 |
| Z31 | 0.089 | 8.258 | 0.258 | 2.849 | 0.305 | 0.958 | 2.517 |
| Z12 | 0.207 | 3.551 | 0.207 | 3.551 | 0.318 | 2.097 | 1.128 |
| Z9 | 0.089 | 8.258 | 0.463 | 1.587 | 0.281 | 1.331 | 2.324 |
| Z30 | 0.119 | 5.643 | 0.399 | 1.457 | 0.271 | 1.321 | 1.642 |
| Z25 | 0.121 | 5.573 | 0.423 | 1.209 | 0.433 | 1.465 | 1.531 |
| Z32 | 0.203 | 5.496 | 0.498 | 1.196 | 0.321 | 1.945 | 1.423 |
| Z46 | 0.212 | 5.339 | 0.604 | 1.128 | 0.239 | 1.854 | 1.321 |
| Z11 | 0.138 | 5.326 | 0.659 | 1.115 | 0.243 | 1.708 | 1.296 |
| Z41 | 0.224 | 3.093 | 0.668 | 1.102 | 0.334 | 2.342 | 0.789 |
| Z42 | 0.310 | 2.387 | 0.679 | 1.090 | 0.323 | 2.324 | 0.756 |
| Z13 | 0.312 | 2.356 | 0.687 | 1.070 | 0.313 | 2.226 | 0.738 |
| X9-1 | 0.207 | 3.551 | 1.646 | 0.446 | 0.175 | 2.486 | 0.622 |
| A0 | 0.312 | 2.356 | 1.621 | 0.453 | 0.249 | 2.651 | 0.588 |
| X3 | 0.312 | 2.356 | 1.823 | 0.403 | 0.18 | 3.592 | 0.424 |
| A4 | 0.63 | 1.167 | 2.409 | 0.305 | 0.295 | 4.621 | 0.344 |
| A1 | 0.311 | 2.363 | 2.382 | 0.309 | 0.169 | 4.847 | 0.4 |
| T8 | 0.312 | 2.356 | 4.826 | 0.152 | 0.14 | 6.874 | 0.331 |
| S12 | 0.63 | 1.167 | 5.097 | 0.144 | 0.15 | 9.929 | 0.175 |
| S18 | 0.65 | 1.154 | 5.125 | 0.14 | 0.14 | 8.254 | 0.167 |
| S22 | 0.67 | 1.142 | 5.254 | 0.138 | 0.16 | 7.145 | 0.153 |
| A5 | 0.312 | 2.356 | 5.232 | 0.14 | 0.145 | 6.622 | 0.342 |
| S16 | 0.69 | 1.137 | 5.367 | 0.136 | 0.17 | 9.235 | 0.151 |
| S10 | 0.71 | 1.124 | 5.482 | 0.132 | 0.15 | 6.278 | 0.149 |
| S11 | 0.73 | 1.113 | 5.542 | 0.129 | 0.21 | 6.986 | 0.146 |
| S17 | 0.75 | 1.104 | 5.632 | 0.126 | 0.15 | 9.942 | 0.143 |
| S19 | 0.77 | 1.097 | 5.764 | 0.121 | 0.18 | 9.956 | 0.139 |
| S15 | 0.78 | 1.053 | 5.843 | 0.111 | 0.19 | 9.924 | 0.137 |
| S20 | 0.79 | 1.121 | 5.976 | 0.102 | 0.24 | 9.053 | 0.129 |
| T4 | 0.312 | 2.356 | 15.558 | 0.047 | 0.054 | 15.525 | 0.128 |
| T3 | 1.268 | 0.58 | 9.756 | 0.075 | 0.165 | 16.675 | 0.095 |
| T13 | 0.63 | 1.167 | 24.621 | 0.03 | 0.089 | 18.382 | 0.104 |
| T2 | 1.268 | 0.58 | 8.851 | 0.083 | 0.177 | 13.42 | 0.102 |
| T21 | 1.268 | 0.58 | 15.087 | 0.049 | 0.135 | 18.514 | 0.078 |
| A9 | 2.55 | 0.288 | 27.197 | 0.027 | 0.152 | 30.134 | 0.044 |
| A7 | 1.268 | 0.58 | 33.861 | 0.022 | 0.084 | 31.533 | 0.049 |
| H11 | 1.268 | 0.58 | 27.23 | 0.025 | 0.094 | 29.35 | 0.051 |
| H6-2 | 1.268 | 0.58 | 63.111 | 0.012 | 0.083 | 34.228 | 0.048 |
Pd—Capillary pressure of mercury entering sandstone sample at the beginning (MPa); Rmax—The pore throat radius corresponding to the pressure Pd (µm); P50—Capillary pressure corresponding to 50% mercury saturation (MPa); R50—The pore throat radius corresponding to the pressure P50 (µm); α—Uniformity coefficient (%); CV—Coefficient of variation (%); Rave—Average pore throat radius (µm).
Table A3.
The initial porosity and four diagenesis indicators of deep-mine sandstone.
Table A3.
The initial porosity and four diagenesis indicators of deep-mine sandstone.
| Sample No. | Φo (%) | C1 (%) | C2 (%) | C3 (%) | C (%) |
|---|---|---|---|---|---|
| Z1 | 40.1537 | 57.66 | 47.06 | 17.32 | 7.69 |
| Z23 | 40.8230 | 55.91 | 55.56 | 19.98 | 6.17 |
| Z38 | 40.1699 | 63.90 | 55.17 | 17.54 | 5.23 |
| Z29 | 40.3168 | 65.28 | 35.71 | 23.87 | 5.19 |
| Z27 | 39.9933 | 62.49 | 53.33 | 12.42 | 4.57 |
| Z24 | 40.1537 | 65.13 | 42.86 | 10.55 | 6.12 |
| Z31 | 40.6514 | 68.02 | 38.46 | 6.35 | 4.83 |
| Z12 | 39.7113 | 48.38 | 68.29 | 18.32 | 3.65 |
| Z9 | 37.6253 | 75.55 | 32.61 | 7.53 | 3.90 |
| Z30 | 40.1537 | 63.89 | 55.17 | 12.89 | 4.47 |
| Z25 | 40.1537 | 75.10 | 50.00 | 15.24 | 4.68 |
| Z32 | 40.6514 | 79.09 | 70.59 | 8.17 | 2.87 |
| Z46 | 39.1135 | 87.22 | 40.00 | 8.31 | 3.09 |
| Z11 | 37.3493 | 58.50 | 70.97 | 19.45 | 3.38 |
| Z41 | 39.2007 | 88.52 | 44.44 | 26.46 | 2.85 |
| Z42 | 39.2154 | 88.52 | 44.44 | 7.11 | 3.69 |
| Z13 | 39.5582 | 66.88 | 68.70 | 31.04 | 5.11 |
| X9-1 | 33.5619 | 64.25 | 83.33 | 42.37 | 1.67 |
| A0 | 32.6476 | 66.31 | 81.82 | 91.01 | 2.23 |
| X3 | 32.7753 | 67.96 | 85.71 | 49.87 | 1.79 |
| A4 | 34.2240 | 83.93 | 90.91 | 39.12 | 1.73 |
| A1 | 36.6514 | 79.09 | 58.82 | 41.87 | 2.16 |
| T8 | 33.4237 | 73.07 | 77.78 | 35.42 | 1.74 |
| S12 | 35.2225 | 75.87 | 94.12 | 105.20 | 1.78 |
| S18 | 35.5895 | 74.71 | 88.89 | 64.40 | 1.96 |
| S22 | 35.9758 | 81.93 | 92.31 | 72.18 | 1.63 |
| A5 | 34.9591 | 84.27 | 90.91 | 25.07 | 1.64 |
| S16 | 35.8773 | 83.28 | 83.33 | 57.33 | 1.63 |
| S10 | 35.4960 | 76.90 | 97.56 | 17.91 | 1.58 |
| S11 | 35.5895 | 76.68 | 96.39 | 27.62 | 1.60 |
| S17 | 36.4882 | 82.19 | 92.31 | 80.65 | 1.92 |
| S19 | 35.7801 | 79.04 | 93.33 | 81.86 | 1.83 |
| S15 | 35.6842 | 74.78 | 77.78 | 90.63 | 1.58 |
| S20 | 35.5895 | 76.12 | 82.35 | 56.45 | 1.46 |
| T4 | 29.5613 | 72.94 | 100.00 | 58.82 | 0.33 |
| T3 | 32.2131 | 71.75 | 98.90 | 23.12 | 0.70 |
| T13 | 33.0909 | 87.91 | 100.00 | 37.36 | 1.52 |
| T2 | 32.6056 | 71.48 | 96.77 | 86.21 | 0.48 |
| T21 | 34.9591 | 91.42 | 100.00 | 30.40 | 1.37 |
| A9 | 34.9505 | 85.69 | 100.00 | 14.76 | 1.38 |
| A7 | 35.5053 | 71.27 | 98.04 | 12.45 | 1.31 |
| H11 | 35.8773 | 91.64 | 100.00 | 98.21 | 0.41 |
| H6-2 | 36.0756 | 91.68 | 100.00 | 80.81 | 0.40 |
Φo—Initial porosity (%); C1—Visual compaction rate (%); C2—Visual cementation rate (%); C3—Visual dissolution rate (%); C—Comprehensive diagenetic coefficient (%).
Table A4.
The content of clay matrix, the sorting coefficients and grain sizes of deep-mine sand-stone.
Table A4.
The content of clay matrix, the sorting coefficients and grain sizes of deep-mine sand-stone.
| Sample No. | So (%) | D1 (%) | D2 (%) | D3 (%) | D4 (%) | Clay Matrix (%) |
|---|---|---|---|---|---|---|
| Z1 | 0.68 | 10.32 | 89.31 | 10.70 | 8.16 | 2.00 |
| Z23 | 0.79 | 4.11 | 91.35 | 8.66 | 7.26 | 2.00 |
| Z38 | 0.76 | 8.53 | 86.56 | 13.34 | 9.29 | 5.00 |
| Z29 | 0.78 | 7.50 | 87.37 | 12.64 | 9.06 | 3.00 |
| Z27 | 0.85 | 6.59 | 82.44 | 17.55 | 12.31 | 4.00 |
| Z24 | 0.95 | 5.01 | 82.47 | 17.53 | 11.59 | 4.00 |
| Z31 | 1.06 | 2.26 | 87.31 | 12.70 | 8.88 | 3.00 |
| Z12 | 1.11 | 8.27 | 78.46 | 21.33 | 13.62 | 8.00 |
| Z9 | 1.16 | 11.65 | 62.86 | 36.81 | 25.09 | 12.00 |
| Z30 | 1.21 | 3.90 | 83.09 | 16.91 | 9.48 | 5.00 |
| Z25 | 1.19 | 1.99 | 79.30 | 20.70 | 11.75 | 12.00 |
| Z32 | 1.20 | 1.58 | 85.41 | 14.60 | 8.97 | 12.00 |
| Z46 | 1.26 | 1.572 | 67.222 | 32.78 | 21.74 | 10.00 |
| Z11 | 1.35 | 29.59 | 80.87 | 18.84 | 11.64 | 12.00 |
| Z41 | 1.25 | 4.40 | 70.13 | 29.81 | 20.00 | 10.00 |
| Z42 | 1.25 | 3.48 | 69.46 | 30.55 | 19.85 | 10.00 |
| Z13 | 1.23 | 10.31 | 80.13 | 19.84 | 11.76 | 7.00 |
| X9-1 | 1.81 | 32.80 | 64.38 | 35.06 | 25.65 | 5.00 |
| A0 | 1.95 | 44.72 | 71.84 | 27.23 | 19.95 | 6.00 |
| X3 | 1.93 | 39.88 | 68.94 | 30.22 | 21.76 | 6.00 |
| A4 | 1.72 | 29.15 | 63.10 | 36.35 | 26.45 | 8.00 |
| A1 | 1.66 | 27.34 | 67.74 | 32.07 | 21.94 | 8.00 |
| T8 | 1.83 | 49.17 | 77.04 | 22.21 | 15.39 | 10.00 |
| S12 | 1.60 | 32.37 | 70.28 | 29.43 | 19.88 | 8.00 |
| S18 | 1.56 | 30.29 | 70.34 | 29.36 | 19.43 | 8.00 |
| S22 | 1.52 | 17.90 | 60.42 | 39.40 | 26.93 | 12.00 |
| A5 | 1.63 | 31.79 | 69.70 | 29.82 | 20.18 | 10.00 |
| S16 | 1.53 | 26.00 | 68.51 | 31.45 | 21.17 | 10.00 |
| S10 | 1.57 | 32.29 | 72.42 | 27.40 | 17.57 | 5.00 |
| S11 | 1.56 | 28.82 | 69.01 | 30.48 | 20.91 | 8.00 |
| S17 | 1.47 | 27.46 | 73.26 | 26.65 | 17.11 | 10.00 |
| S19 | 1.54 | 31.74 | 72.75 | 27.24 | 17.19 | 10.00 |
| S15 | 1.85 | 27.15 | 67.59 | 32.31 | 21.18 | 5.00 |
| S20 | 1.86 | 30.73 | 71.99 | 27.71 | 17.57 | 12.00 |
| T4 | 2.65 | 28.68 | 64.27 | 35.72 | 25.17 | 5.00 |
| T3 | 2.03 | 31.66 | 55.15 | 44.05 | 33.96 | 5.00 |
| T13 | 1.88 | 27.47 | 53.50 | 45.71 | 35.06 | 6.00 |
| T2 | 1.96 | 31.86 | 57.54 | 41.61 | 30.93 | 5.00 |
| T21 | 1.83 | 0.00 | 35.99 | 64.02 | 52.64 | 12.00 |
| A9 | 1.83 | 25.84 | 62.43 | 36.99 | 26.13 | 8.00 |
| A7 | 1.97 | 20.73 | 59.133 | 40.87 | 28.77 | 4.00 |
| H11 | 1.93 | 19.12 | 56.62 | 42.92 | 29.85 | 12.00 |
| H6-2 | 1.96 | 12.76 | 54.82 | 45.16 | 32.61 | 10.00 |
So—Sorting coefficient (%); D1-The content of grains larger than 0.25 mm (%); D2—The content of grains larger than 0.125 mm (%); D3—The content of grains smaller than 0.0625 mm (%); D4—The content of grains smaller than 0.0312 mm (%).
Table A5.
Lithological characteristics of different sandstone subcategories.
Table A5.
Lithological characteristics of different sandstone subcategories.
| Subcategories | Main Lithological Characteristics |
|---|---|
| I1 | Mainly a medium to fine sandstone, very well sorted, with an interparticle space filling rate of 47–67%; the filling materials are siliceous and calcareous cement and clay matrix; most particle contacts are point contacts, with a few line contacts. |
| I2 | Mainly a fine sandstone, well sorted, with an interparticle space filling rate of 50–88%; the filling materials are siliceous and calcareous cement and clay matrix; most particle contacts are point contacts, with a few line contacts. |
| II1 | Heterogranular sandstone composed of medium and fine sandstone, moderately sorted, with an interparticle space filling rate of 88–98%; the filling materials are siliceous cement, a little calcareous cement and clay matrix; most particle contacts are line contacts, with a few point contacts. |
| II2 | Heterogranular sandstone composed of fine silt sandstone, poorly sorted, with an interparticle space filling rate of 86–100%; the filling materials are siliceous cement, a little calcareous cement and clay matrix; all particle contacts are line contacts and convex–concave contacts. |
Table A6.
Pore types and pore connectivity of different sandstone subcategories.
Table A6.
Pore types and pore connectivity of different sandstone subcategories.
| Subcategories | Main Type of Pore and Its Interconnection |
|---|---|
| I1 | The primary intergranular pores are most common, followed by the intragranular dissolution pores of feldspar; very good connectivity. |
| I2 | The primary intergranular pores are most common, followed by the intragranular dissolution pores of feldspar, with a few residual intergranular pores; good connectivity. |
| II1 | Large reduction in primary intergranular pores and a large distribution deviation; residual intergranular pores, intergranular dissolution pores and intragranular dissolution pores are common; bad connectivity. |
| II2 | Mainly micropores, with a few primary intergranular pores and intergranular dissolution pores but many intragranular pores; very bad connectivity. |
Table A7.
Characteristics of the capillary pressure curve of different sandstone subcategories.
Table A7.
Characteristics of the capillary pressure curve of different sandstone subcategories.
| Subcategories | Characteristics |
|---|---|
| I1 | Lower left distribution, skewed to coarse pore throats; very centralized pore throat distribution; few fine pore throats with diameters smaller than 1.6 µm, peak of coarse pore throats with diameters of 4 to 6 µm has a higher peak; nearly all of the pores throats contribute to permeability. |
| I2 | Slightly lower left distribution, slightly skewed to coarse pore throats; centralized pore throat distribution, with few fine pore throats with diameters smaller than 1.0 µm; peak of coarse pore throats with diameters of 1 to 4 µm has a higher peak; most pores and pore throats contribute to permeability. |
| II1 | Slightly upper right distribution, slightly skewed to fine pore throats; discrete pore throat distribution, with few fine pore throats with diameters smaller than 0.063 µm; peak of coarse pore throats with diameters of 0.63 µm has a low peak; about half of these pore throats contribute to permeability, but there is a considerable variability. |
| II2 | Upper right distribution, skewed to fine pore throats; very discrete pore throat distribution, with few coarse pore throats with diameters larger than 0.40 µm; peak of coarse pore throats with diameters of 0.1 µm with a lower peak; very few pores throats contribute to permeability. |
References
- Ranjith, P.; Zhao, J.; Ju, M.G.; De Silva, R.; Rathnaweera, T.; Bandara, A. Opportunities and Challenges in Deep Mining: A Brief Review. Engineering 2017, 3, 546–551. [Google Scholar] [CrossRef]
- Muller, R.A.; Finsterle, S.; Grimsich, J.; Baltzer, R.; Muller, E.A.; Rector, J.W.; Payer, J.; Apps, J. Disposal of High-Level Nuclear Waste in Deep Horizontal Drillholes. Energies 2019, 12, 2052. [Google Scholar] [CrossRef]
- Ma, D.; Duan, H.Y.; Li, X.B.; Li, Z.H.; Zhou, Z.L.; Li, T.B. Effects of seepage-induced erosion on nonlinear hydraulic properties of broken red sandstones. Tunn. Undergr. Space Technol. 2019, 91, 102993. [Google Scholar] [CrossRef]
- Zhang, X.H.; Wang, X.W.; Xu, Y.S. Groundwater environment and related potential engineering disasters of deep underground space in Shanghai. Bull. Eng. Geol. Environ. 2022, 81, 203. [Google Scholar] [CrossRef]
- Wang, H.L.; Xu, W.Y.; Jia, C.J.; Cai, M.; Meng, Q.X. Experimental Research on Permeability Evolution with Microcrack Development in Sandstone under Different Fluid Pressures. J. Geotech. Geoenviron. Eng. 2016, 142, 04016014. [Google Scholar] [CrossRef]
- Wei, Y.C.; Jia, Z.K.; Cao, D.Y.; Yu, C. Development Trend of the Coal Bed Exploration Type Division. Adv. Comput. Environ. Sci. 2012, 142, 9–15. [Google Scholar]
- Peng, T.; Zhang, H.C.; Shen, S.H.; Ren, Z.Q. Comprehensive Evaluation and Analysis of Water-Inrush Source in Wolonghu Coal Mine. Adv. Mat. Res. 2014, 1025–1026, 926–929. [Google Scholar] [CrossRef]
- Yin, H.Y.; Shi, Y.L.; Niu, H.G.; Xie, D.L.; Wei, J.C.; Lefticariu, L.; Xu, S.X. A GIS-based model of potential groundwater yield zonation for a sandstone aquifer in the Juye Coalfield, Shangdong, China. J. Hydrol. 2018, 557, 434–447. [Google Scholar] [CrossRef]
- Zhang, H.M.; Wu, J.W.; Wang, G.T.; Shen, S.H.; Xu, G.L. Combination of GIS and AHP methods to predict water abundance of sandstone aquifer in coal seam roof. J. Eng. Sci. Technol. Rev. 2018, 11, 48–53. [Google Scholar]
- Wang, S.J.; Feng, J.; Hou, E.K.; Huang, K.J.; Xu, W.F.; Duan, H.J. Microscopic pore structure types of sandstone and its effects on aquifer water abundance: Taking in Ningtiaota coal mine as an example. J. China Coal Soc. 2020, 45, 3236–3244. [Google Scholar]
- China National Standard. Code for Acceptance of Shaft Sinking and Drifting of Coal Mine of China, GB 50213-2010; China Planning Press: Beijing, China, 2010. [Google Scholar]
- Qiao, W.G.; Meng, Q.B.; Lin, D.G. Grouting and water sealing plan and its application to main shaft of Tangkou coal mine. Coal Sci. Technol. 2010, 38, 19–21. [Google Scholar]
- Qian, Z.W.; Jiang, Z.Q.; Guan, Y.Z. Study on the Processes of Water and Grout Seepage in Porous Media Using Resistivity Method. Geotech. Test. J. 2019, 42, 1359–1369. [Google Scholar] [CrossRef]
- Kenyon, W.E.; Howard, J.J.; Sezginer, A. Pore Size Distribution and NMR in Microporous Cherty Sandstones. Presented at the SPWLA 30th Annual Logging Symposium, Denver, CO, USA, 11–14 June 1989. [Google Scholar]
- Schwarz, L.G.; Krizek, R.J. Evolving Morphology of Early Age Microfine Cement Grout. In Advances in Grouting and Ground Modification; ASCE: Reston, VA, USA, 2000; Volume 104. [Google Scholar]
- Fleury, M.; Santerre, Y.; Vincent, B. Carbonate Rock Typing from NMR Relaxation Measurements. Presented at the 48th Annual Logging Symposium, Austin, TX, USA, 3–6 June 2007. [Google Scholar]
- Valori, A.; Ali, F.; AlZoukani, A.; Taherian, R. NMR Measurements for Pore Size Mapping at Fine Scale. In Proceedings of the International Petroleum Technology Conference, Doha, Qatar, 19–22 January 2014. [Google Scholar]
- Fiorelli, G.L.; Winter, A.; Koroishi, E.T. Characterization of Coquinas and Dolomites Integrating Electrical Resistivity, Nuclear Magnetic Resonance (NMR) and Porosimetry by Mercury Intrusion (MICP). In Proceedings of the SPE Reservoir Characterisation and Simulation Conference and Exhibition, Abu Dhabi, United Arab Emirates, 14–16 September 2015. [Google Scholar]
- Standardization Administration of China. Core Analysis Method: GB/T29172-2012; Petroleum Industry Press: Beijing, China, 2012. [Google Scholar]
- China Petroleum and Natural Gas Industries Standard. Measurement Method for Rock Pore Volume Compressibility, SY/T 5815-2016; Petroleum Industry Press: Beijing, China, 2010. [Google Scholar]
- Ma, Y.; Pan, Z.J.; Zhong, N.N.; Connell, L.D.; Down, D.I.; Lin, W.L.; Zhang, Y. Experimental study of anisotropic gas permeability and its relationship with fracture structure of Longmaxi Shales, Sichuan Basin, China. Fuel 2016, 180, 106–115. [Google Scholar] [CrossRef]
- Gehne, S.; Benson, P.M. Permeability and permeability anisotropy in Crab Orchard sandstone: Experimental insights into spatio-temporal effects. Tectonophysics 2017, 712, 589–599. [Google Scholar] [CrossRef]
- Liu, C.; Yin, G.Z.; Li, M.H.; Deng, B.Z.; Song, Z.L.; Liu, Y.B.; Yin, S.Y. Shale permeability model considering bedding effect under true triaxial stress conditions. J. Nat. Gas Sci. Eng. 2019, 68, 102908. [Google Scholar] [CrossRef]
- Everett, D.H. Manual of symbols and terminology for physicochemical quantities and units, appendix II: Definitions, terminology and symbols in colloid and surface chemistry. Pure Appl. Chem. 1972, 31, 577–638. [Google Scholar] [CrossRef]
- Hodot, B.B. Coal and Gas Outburst (Chinese Translation); China Industry Press: Beijing, China, 1996; pp. 27–30. [Google Scholar]
- Xiong, J.; Liu, X.; Liang, L. Experimental study on the pore structure characteristics of the Upper Ordovician Wufeng Formation shale in the southwest portion of the Sichuan Basin, China. J. Nat. Gas Sci. Eng. 2015, 22, 530–539. [Google Scholar] [CrossRef]
- Yan, Q.; Li, Y.L.; Zhang, Y.F. Grading evaluation of pore throats in a tight sandstone reservoir: A case study of the Gao 3 section reservoir in the Qijia area of the Songliao Basin. Arab. J. Geosci. 2019, 12, 661. [Google Scholar] [CrossRef]
- Yin, D.Y.; Wang, D.Q.; Zhou, Y.Z.; Zhang, C.L. Pore Structure Characteristics of Ultra-Low Permeability Reservoirs. Nat. Resour. Res. 2020, 30, 451–462. [Google Scholar] [CrossRef]
- Lu, S.F.; Li, J.Q.; Xiao, D.S.; Xue, H.T.; Zhang, P.F.; Li, J.J.; Chen, F.W.; Huang, W.B.; Wang, M.; Li, W.H.; et al. Research Progress of Microscopic Pore—Throat Classification and Grading Evaluation of Shale Reservoirs: A Minireview. Energy Fuels 2022, 36, 4677–4690. [Google Scholar] [CrossRef]
- Xi, K.L.; Cao, Y.C.; Beyene, G.H.; Zhu, R.K.; Jens, J.; Knut, B.; Zhang, X.X.; Helge, H. How does the pore-throat size control the reservoir quality and oiliness of tight sandstones? The case of the Lower Cretaceous Quantou Formation in the southern Songliao Basin, China. Mar. Pet. Geol. 2016, 76, 1–15. [Google Scholar] [CrossRef]
- Nelson, P.H. Pore-throat sizes in sandstones, tight sandstones, and shales. AAPG Bull. 2009, 93, 329–340. [Google Scholar] [CrossRef]
- Lai, J.; Wang, G.W.; Wang, Z.Y.; Chen, J.; Pang, X.J.; Wang, S.C.; Zhou, Z.L.; He, Z.B.; Qin, Z.Q.; Fan, X.Q. A review on pore structure characterization in tight sandstones. Earth Sci. Rev. 2018, 177, 436–457. [Google Scholar] [CrossRef]
- Islam, M.A. Diagenesis and reservoir quality of Bhuban sandstones (Neogene), Titas Gas Field, Bengal Basin, Bangladesh. J. Asian Earth Sci. 2009, 35, 89–100. [Google Scholar] [CrossRef]
- Ajdukiewicz, J.M.; Lander, R.H. Sandstone reservoir quality prediction: The state of the art. AAPG Bull. 2010, 94, 1083–1091. [Google Scholar] [CrossRef]
- Lai, J.; Wang, G.W.; Chai, Y.; Ran, Y.; Zhang, X.T. Depositional and Diagenetic Controls on Pore Structure of Tight Gas Sandstone Reservoirs: Evidence from Lower Cretaceous Bashijiqike Formation in Kelasu Thrust Belts, Kuqa Depression in Tarim Basin of West China. Resour. Geol. 2014, 65, 55–75. [Google Scholar] [CrossRef]
- Graton, L.C.; Fraser, H.J. Systematic packing of spheres—With particular relation to porosity and permeability. J. Geol. 1935, 43, 785–909. [Google Scholar] [CrossRef]
- Beard, D.; Weyl, P. Influence of texture on porosity and permeability of unconsolidated sand. AAPG Bull. 1973, 57, 349–369. [Google Scholar]
- Scherer, M. Parameters influencing porosity in sandstones: A model for sandstone porosity prediction. AAPG Bull. 1987, 71, 485–491. [Google Scholar] [CrossRef]
- Zhang, J.; Qin, L.; Zhang, Z. Depositional facies, diagenesis and their impact on the reservoir quality of Silurian sandstones from Tazhong area in central Tarim basin, Western China. J. Asian Earth Sci. 2008, 33, 42–60. [Google Scholar] [CrossRef]
- Xi, K.L.; Cao, Y.C.; Wang, Y.Z.; Beyene, G.H.; Zhang, X.X.; Zhang, J.H.; Jin, J.H. Diagenesis and porosity-permeability evolution of low permeability reservoirs: A case study of Jurassic Sangonghe Formation in Block 1, central Junggar Basin, NW China. Pet. Explor. Dev. 2015, 42, 475–485. [Google Scholar] [CrossRef]
- Lundegard, P.D. Sandstones porosity loss—A big picture view of the importance of compaction. J. Sediment. Res. 1992, 62, 250–260. [Google Scholar] [CrossRef]
- Ozkan, A.; Cumella, S.P.; Milliken, K.L.; Laubach, S.E. Prediction of lithofacies and reservoir quality using well logs, Late Cretaceous Williams Fork Formation, Mamm Creek field, Piceance Basin, Colorado. AAPG Bull. 2011, 95, 1699–1724. [Google Scholar] [CrossRef]
- Lai, J.; Wang, G.W.; Wang, S.N.; Zheng, Y.Q.; Wu, H.; Zhang, Y.C. Research status and advances in the diagenetic facies of clastic reservoirs. Adv. Earth. Sci. 2013, 28, 39–50. [Google Scholar]
- Zhu, P.; Dong, Y.; Chen, M.; Li, Z.; Han, B.; Wang, J.; Cui, Y. Quantitative evaluation of pore structure from mineralogical and diagenetic information extracted from well logs in tight sandstone reservoirs. J. Nat. Gas Sci. Eng. 2020, 80, 103376. [Google Scholar] [CrossRef]
- Yuan, J.; Yuan, L.R.; Yang, X.J.; Li, C.T. Diagenetic evolution modes of the deep formation of Jiyang Sub-basin, Paleogene. Acta Sedimentol. Sin. 2012, 30, 46–63. [Google Scholar]
- Ramm, M. Reservoir quality and its relationship to facies and provenance in Middle to Upper Jurassic sequences, northeastern North Sea. Clay Miner. 2000, 35, 77–94. [Google Scholar] [CrossRef]
- Schmid, S.; Worden, R.H.; Fisher, Q. Diagenesis and reservoir quality of the Sherwood Sandstone (Triassic), Corrib Field, Slyne Basin, West of Ireland. Mar. Pet. Geol. 2004, 21, 299–315. [Google Scholar] [CrossRef]
- Taylor, T.R.; Giles, M.R.; Hathon, L.A.; Diggs, T.N.; Braunsdorf, N.R.; Birbiglia, G.V.; Kittridge, M.G.; Macaulay, C.I.; Espejo, I.S. Sandstone diagenesis and reservoir quality prediction: Models, myths, and reality. AAPG Bull. 2010, 94, 1093–1132. [Google Scholar] [CrossRef]
- Cook, J.E.; Goodwin, L.B.; Boutt, D.F. Systematic diagenetic changes in the grain-scale morphology and permeability of a quartz-cemented quartz arenite. AAPG Bull. 2011, 95, 1067–1088. [Google Scholar] [CrossRef]
- Axelsson, M.; Gustafson, G.; Fransson, A. Stop mechanism for cementitious grouts at different water-to-cement ratios. Tunn. Undergr. Space Technol. 2008, 71, 485–491. [Google Scholar] [CrossRef]
- Mollamahmutoglu, M.; Yilmaz, Y. Engineering Properties of Medium-to-Fine Sands Injected with Microfine Cement Grout. Mar. Georesour. Geotechnol. 2011, 29, 95–109. [Google Scholar] [CrossRef]
Disclaimer/Publisher’s Note: The statements, opinions and data contained in all publications are solely those of the individual author(s) and contributor(s) and not of MDPI and/or the editor(s). MDPI and/or the editor(s) disclaim responsibility for any injury to people or property resulting from any ideas, methods, instructions or products referred to in the content. |
© 2023 by the authors. Licensee MDPI, Basel, Switzerland. This article is an open access article distributed under the terms and conditions of the Creative Commons Attribution (CC BY) license (https://creativecommons.org/licenses/by/4.0/).