Article

Design of a Moisture Content Detection System for Yinghong No. 9 Tea Leaves Based on Machine Vision

1
Automotive Institute, Guangdong Mechanical & Electronical College of Technology, Guangzhou 510550, China
2
College of Engineering, South China Agricultural University, Guangzhou 510640, China
3
Guangdong Academy of Agricultural Sciences, Guangzhou 510640, China
4
Tea Research Institute, Guangdong Academy of Agricultural Sciences/Guangdong Provincial Key Laboratory of Tea Plant Resources Innovation & Utilization, Guangzhou 510640, China
*
Author to whom correspondence should be addressed.
Appl. Sci. 2023, 13(3), 1806; https://doi.org/10.3390/app13031806
Submission received: 13 December 2022 / Revised: 3 January 2023 / Accepted: 29 January 2023 / Published: 31 January 2023

Abstract

:
The moisture content of Yinghong No. 9 tea leaves is an important indicator for their processing. The traditional method used to detect the moisture content of tea leaves is not suitable for large-scale production. To improve the efficiency of tea processing, a moisture content detection system for Yinghong No. 9 tea leaves based on machine vision was developed, and the relationship between the moisture content and the fresh tea leaves was researched. Firstly, nine color features and five texture features of the tea leaves images were extracted, and two different tea leaves databases were constructed based on linear discriminant analysis (LDA) and principal component analysis (PCA). Secondly, two models of moisture prediction for fresh tea leaves were built using a backpropagation (BP) neural network, which were then optimized by particle swarm optimization (PSO) and a genetic algorithm (GA), respectively. After, the two preprocessing methods and the two optimization algorithms were cross-combined to optimize the models for moisture content prediction. Finally, the models above were filtered using segmental analysis for the segmental moisture content prediction. It was verified by experiments that the coefficient of determination (R2) of the combined model of PCA-GA-BP and PCA-PSO-BP was 94.1073%, the RMSE was 1.1490%, and the MAE was 0.9982%. The results of this paper can help in the instantaneous detection of the moisture content of fresh tea leaves during processing, improving the production efficiency of Yinghong No. 9 tea.

1. Introduction

Yinghong No. 9 is a popular and representative cultivar in Guangdong Province, located in southern China, and it has a high yield and high economic benefits [1]. Withering is an important process in the production of Yinghong No. 9 tea, and the moisture content is an important indicator of the withering process. Polysaccharides, amino acids, and soluble sugars, as the factors that can determine the quality of the finished tea, are significantly affected by an increase in the withering time. Thus, the moisture content plays an important role in the formation of the quality of Yinghong No. 9 [2].
In recent years, in order to solve the problems of inefficiency in large-scale production brought by traditional methods for detecting the moisture content of tea leaves, scholars in China and abroad have used nondestructive testing technology to conduct research on tea testing. Zhang et al. used near-infrared spectroscopy to predict the moisture content of Yinghong No. 9, which had a higher accuracy and prediction accuracy, with an R2c of 0.9410, RMSEC of 0.2404, R2cv of 0.9171, RMSECV of 0.2851, R2p of 0.9513, and RMSEP of 0.2236 [3]. Mizukami et al. studied the relationship between the electronic properties of tea leaves and the moisture content, and they used capacitance and impedance to predict the moisture content of the tea leaves [4]. Wei et al. used hyperspectral technology to classify and predict whether it was the front or the back of the tea leaves. The prediction accuracy of the front of the tea leaves was 0.951, and the prediction accuracy of the back was 0.918 [5].
However, whether it is near-infrared spectroscopy, hyperspectral technology, or chemical determination methods, the detection cost is relatively high, the efficiency is low, and they are only suitable for laboratories; moreover, it will be difficult to deploy them in production. With the rapid development of computers, machine vision technology has received widespread attention again. Machine vision involves many cutting-edge fields, such as artificial intelligence, image processing, and pattern recognition. The low-cost and high-efficiency performance of machine vision makes it widely used in the field of agriculture [6]. Therefore, this technology has also begun to be applied in the field of tea leaves detection. Laddi et al. researched the role of illumination in the discrimination of tea samples based on the textural features of tea granules, which showed that the best discrimination was obtained with darkfield illumination, with a variance of 96%, whereas brightfield illumination showed low discrimination, with only an 83% variance [7]. Wei et al. used multispectral and depth images to establish the regression model of tea moisture content, which showed that the prediction accuracies of the front and back of the tea leaves were 0.77 and 0.68, respectively [8]. Zhang et al. designed an automatic tea-category identification (TCI) system to identify green, oolong, and black teas, which used a 3 CCD digital camera [9]. Liang et al. used the NDT (nondestructive testing) method to detect the moisture content of stacked leaves through linear PLS (partial least squares) and nonlinear SVM (support vector machine) [10]. An et al. applied deep learning methods to predict the moisture content rapidly and nondestructively in withered leaves, and the results showed that deep learning methods can better characterize the correlation between the images and the moisture than traditional linear PLS and nonlinear SVR algorithms [11].
However, most of these research objects are single, fresh leaves or finished tea, and there is no research on the moisture content of stacked tea leaves of Yinghong No. 9. At present, the neural network method for moisture content prediction has become very common, among which the backpropagation (BP) neural network shows good performance in dealing with nonlinear problems [12,13]. However, the BP neural network easily falls into the local optimal value. Improper assignments will lead to a decline in the prediction accuracy of the model during initialization. Sun et al. established the BP-ANN model to monitor the relationship between the drying parameters and the state of moisture under different microwave vacuum drying conditions for different typical fruits and vegetables [14]. Meerasri et al. studied and investigated the effects of edible coating and drying temperature on the properties of dehydrated pineapple cubes through artificial neural networks (ANNs) and multiple linear regression (MLR) [15]. When there are too many neurons in the input layer, the parameters of the model will increase, and the prediction speed will decrease. Therefore, we designed a moisture content detection system for the stacking of Yinghong No. 9 tea leaves based on machine vision. The color–texture method was used to extract the image features of Yinghong No. 9 tea leaves. Two different Yinghong No. 9 tea leaves databases were constructed based on linear discriminant analysis (LDA) and principal component analysis (PCA). The BP neural network model was optimized using particle swarm optimization (PSO) and a genetic algorithm (GA). We analyzed the predicted effect of the segmental moisture content to establish the best model and to realize the moisture content detection of stacked Yinghong No. 9 tea leaves, providing a reference for the nondestructive testing of Yinghong No. 9 tea leaves online.

2. The Overall Design of the Moisture Content Detection System for Yinghong No. 9 Tea Leaves

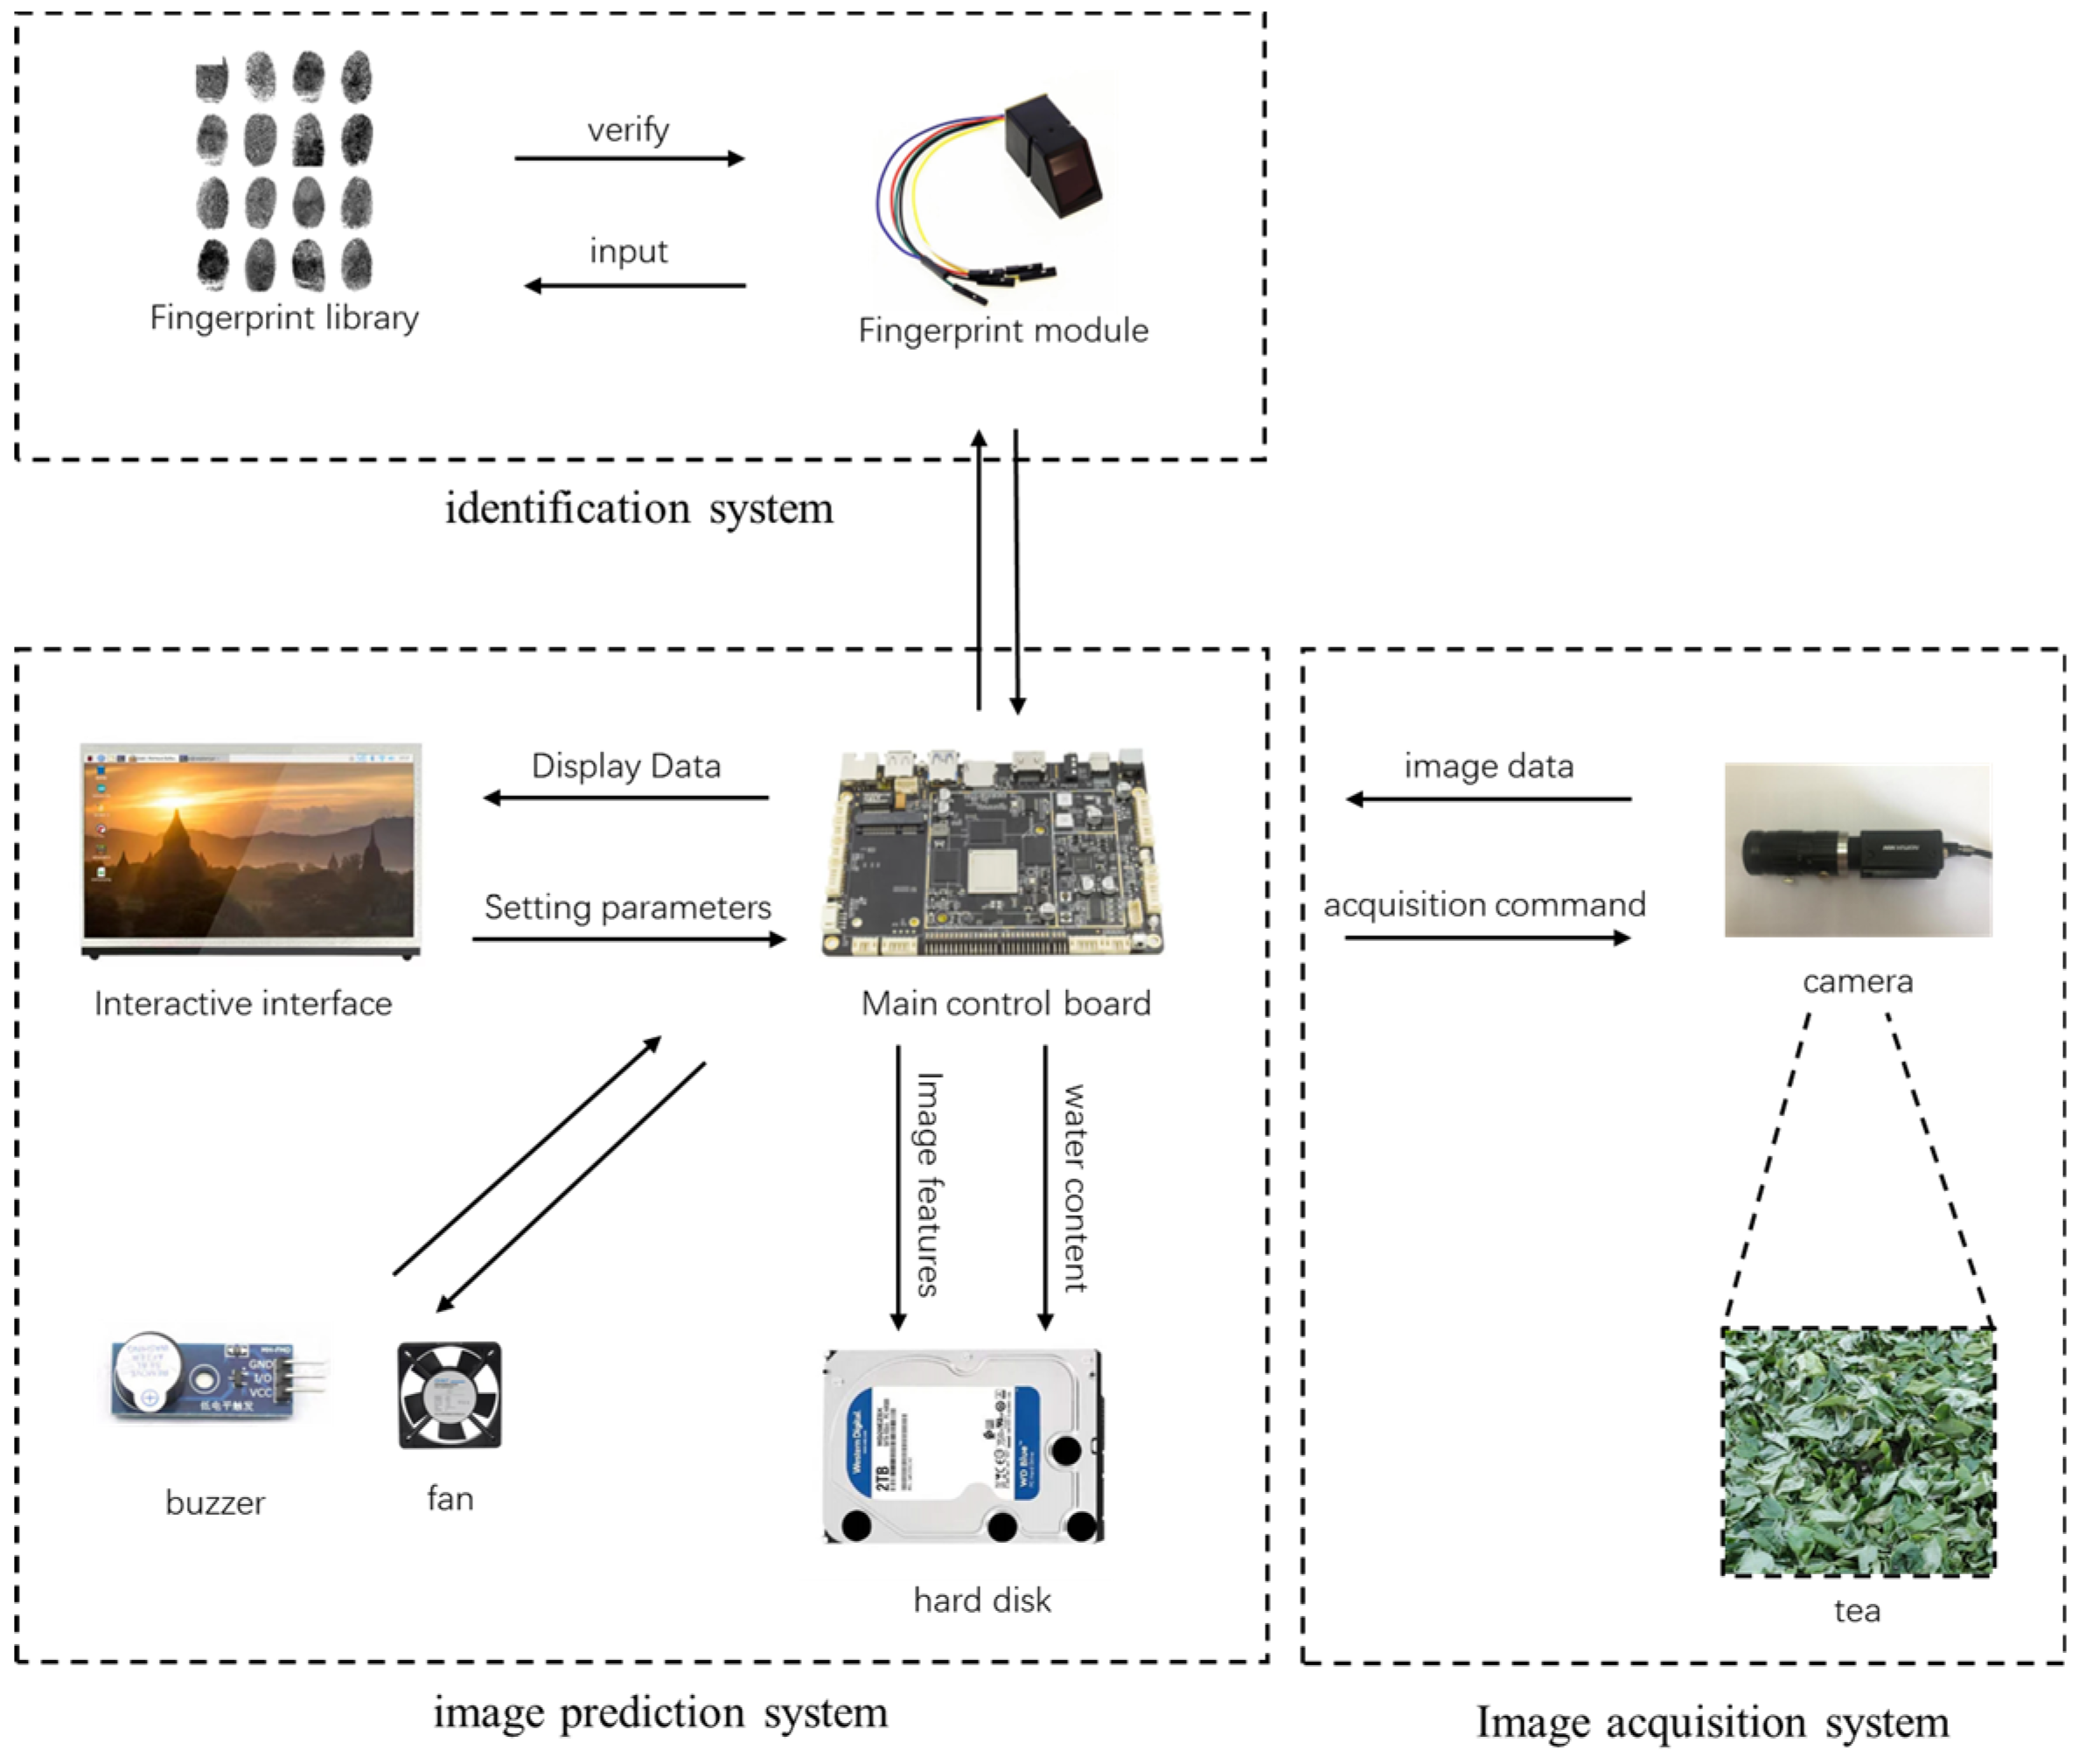
The composition of the moisture content detection system for Yinghong No. 9 tea leaves based on machine vision is shown in Figure 1, which was composed of an image acquisition system, an image prediction system, and an identity recognition system.
The identity recognition system uses fingerprint recognition to identify the operator by calling the fingerprint database. The fingerprint information can also be entered into the fingerprint database. After passing through the identity recognition system, the device parameters can be changed.
The image acquisition system collects the image of the tea leaves through the camera and judges whether there are Yinghong No. 9 tea leaves in the image through the color feature distinction. When there are Yinghong No. 9 tea leaves in the image, the fan will be started, the LED light will be turned on, and the system will wait for the acquisition command. The color indicator in the color feature can strengthen the color feature of the target object. In order to distinguish whether there are Yinghong No. 9 tea leaves, the ExG, via Equations (1)–(3), is used to analyze the image of the Yinghong No. 9 tea leaves [16]. In the case of a given threshold, t g , the presence of Yinghong No. 9 tea leaves is determined when the ExG is greater than t g .
E x G ( x , y ) = 2 G ( x , y ) R ( x , y ) B ( x , y )
Pg = i = 1 w j = 1 h g ( x , y ) w h
g ( x , y ) = 1 ( E x G ( x , y ) t g ) 0 E x G ( x , y ) < t g
Here, R G B is the three channels of the image, ( x , y ) is the position of the pixel, w is the width of the image, and h is the height of the image.
Firstly, in the image prediction system, the threshold value of the moisture content and the interval time of the image prediction can be set after the timer is started. Secondly, when a specific duration of time is reached, a collection command is issued to the image acquisition system, and the camera sends the tea leaves image data through the serial port to the main control chip. After that, the main control chip preprocesses the image data, organizes it into multidimensional data, and inputs it into the model for prediction. Finally, the prediction result is displayed on the display screen, and the buzzer is activated to give an alarm when the predicted moisture content reaches the threshold value of moisture content.

3. System Software and Hardware Design

3.1. Hardware Design

The structure of the Yinghong No. 9 tea leaves moisture content detection system is shown in Figure 2. The Yinghong No. 9 tea leaves moisture content detection system is mainly composed of a dark room and a control room, as shown in Figure 2a,b, respectively. The touch screen, buzzer, fingerprint recognition module, hard disk, and main processor were installed in the control room. The main processor used was a Ruixin 64-bit six-core SoC RK3399 with GPU graphics acceleration, which is suitable for machine vision tasks. The length, width, and height of the control room were 400 × 180 × 280 mm. In order to keep the control room fixed on the workbench, a buckle was installed under the control room to prevent slipping.
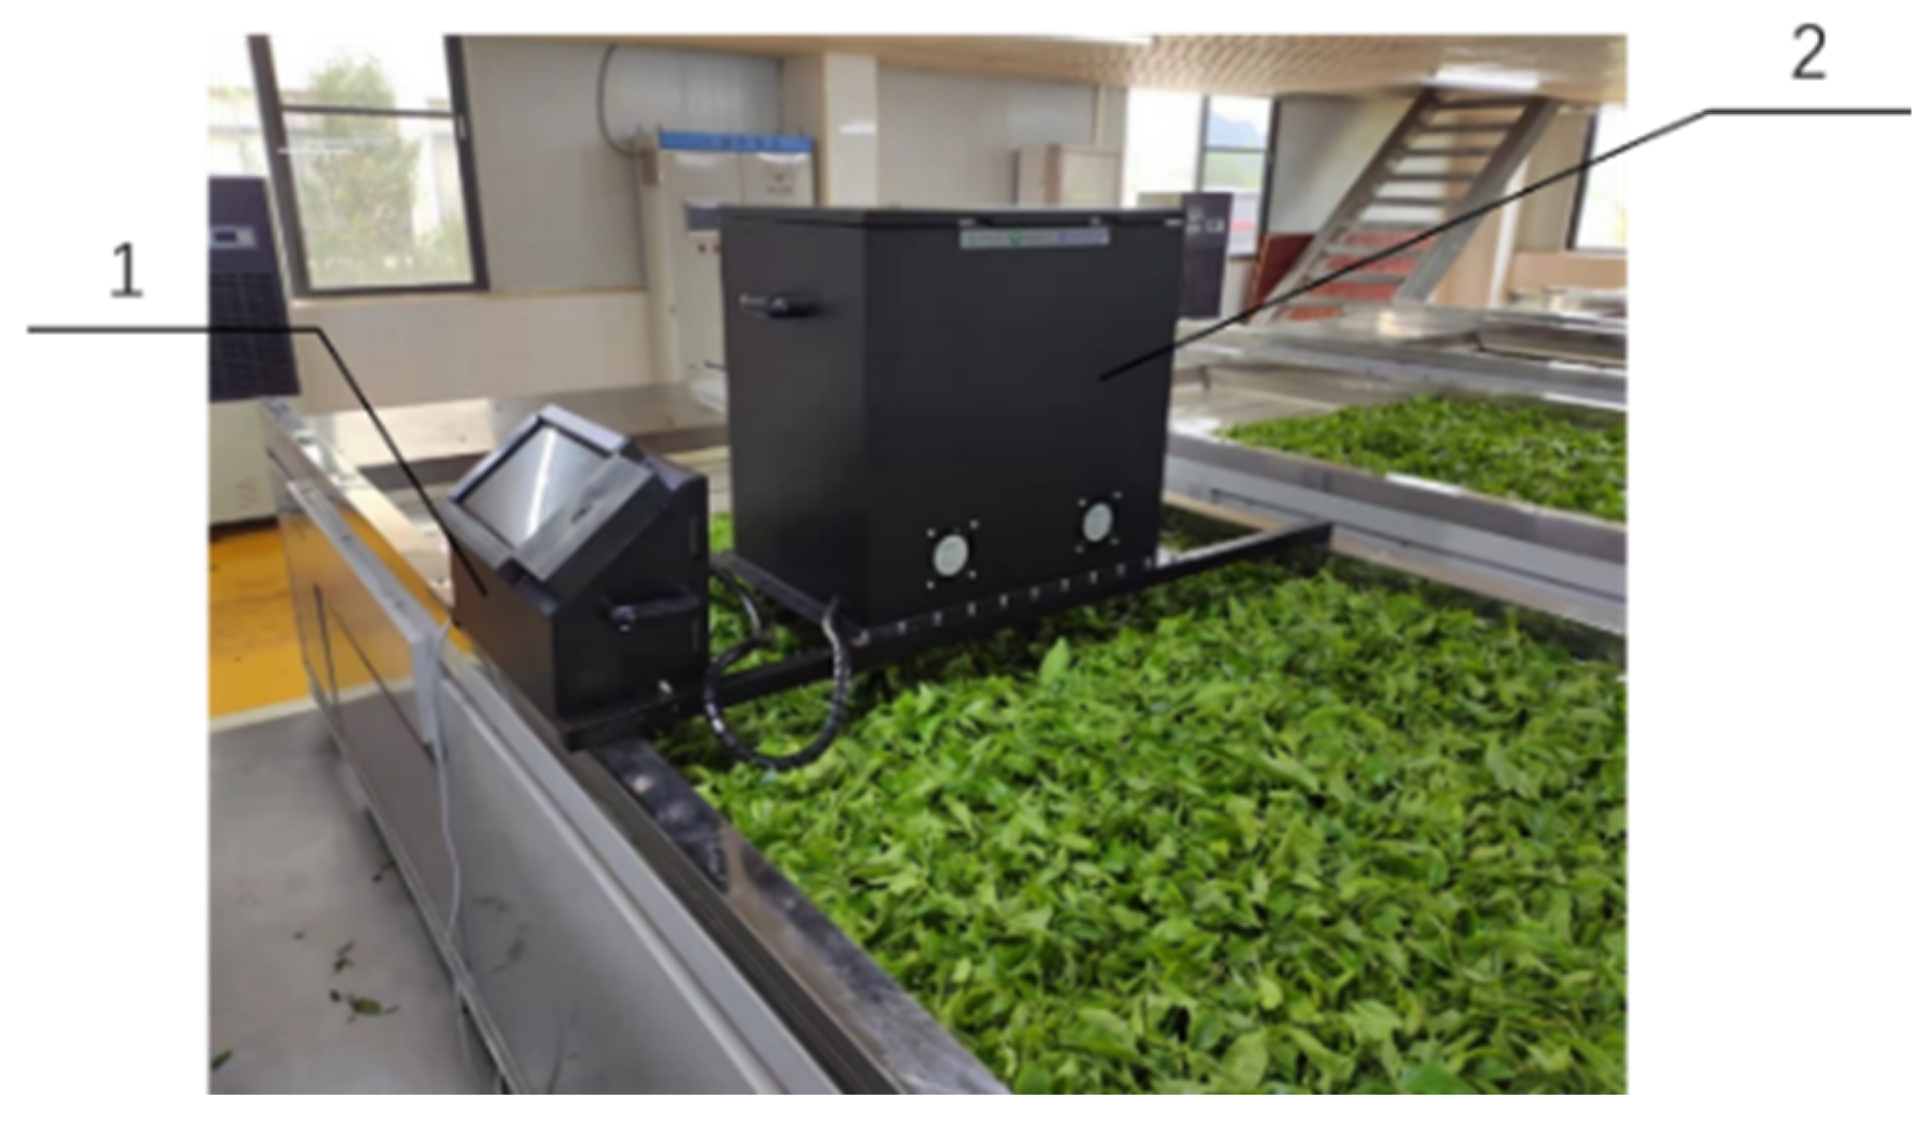
Cameras, fans, and an LED were installed in the dark room. The camera used was a Hikvision MV-CE200-10UC, the specifications of which are shown in Table 1. The lens used was a 12 MP FA lens, of the model MVL-KF228M-2MP, and the specifications are shown in Table 2. Since the distance between the camera and the bottom of the device was 358 mm, the field of view of the image of the Yinghong No.9 tea leaves was 381 × 286 mm. Therefore, the length, width, and height of the darkroom were designed to be 547 × 372 × 531 mm. The test prototype is shown in Figure 3.

3.2. Software Design

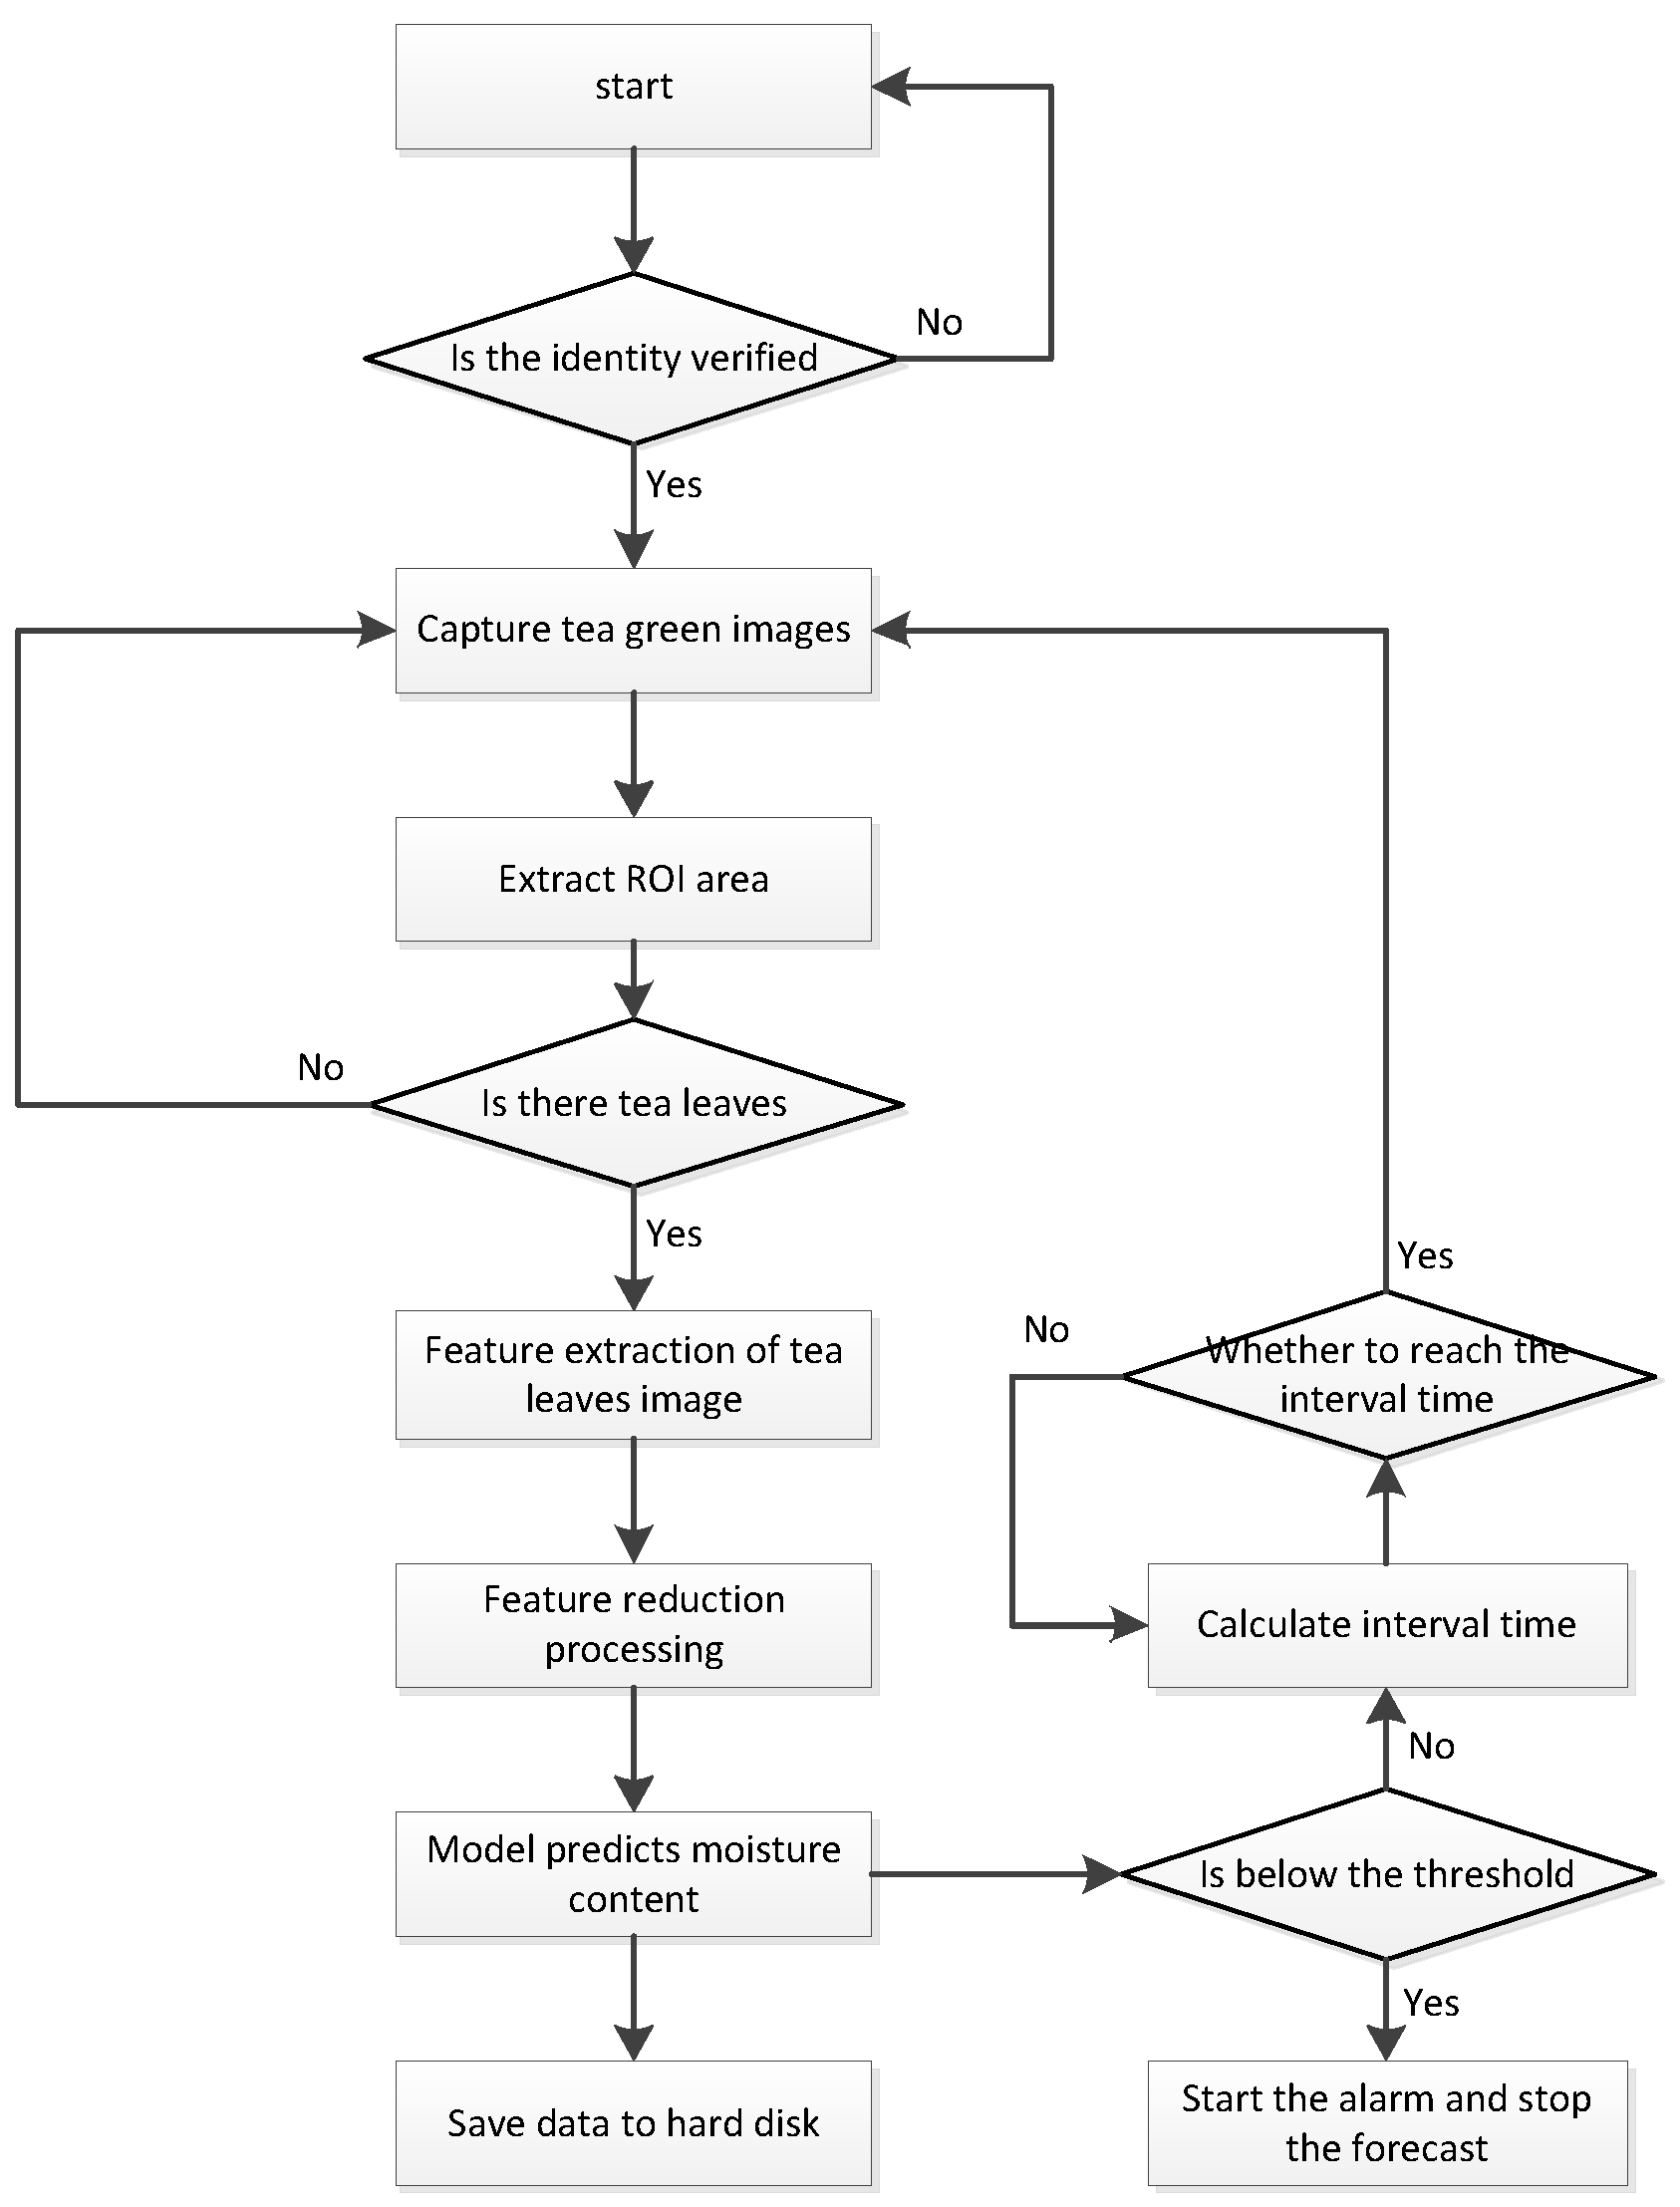
The software was written with the QT5 compiler and programmed using C++ and Python. A flow chart of the moisture content detection system of Yinghong No. 9 tea is shown in Figure 4. First, the image of the Yinghong No. 9 tea leaves is collected after the operator is identified by reading the information of the fingerprint module. After the image is captured, the program will crop the ROI area and determine the presence or absence of the tea leaves according to the range of the super green indicator value. If Yinghong No. 9 tea leaves are directly under the camera, the image will be preprocessed; otherwise, it will continue to collect images. Finally, the preprocessed data are input into the model to obtain the predicted value of the moisture content, and the moisture content and image features are stored on the hard disk and displayed. When the predicted value of the moisture content is lower than the preset threshold, it will signal an alarm and stop the prediction of the moisture content; otherwise, it will check whether the timer reaches the interval time, and, if so, the timer will be cleared, and the image acquisition will start again.

4. Image Acquisition Method and Information Processing of Yinghong No. 9 Tea Leaves

4.1. Materials and Methods

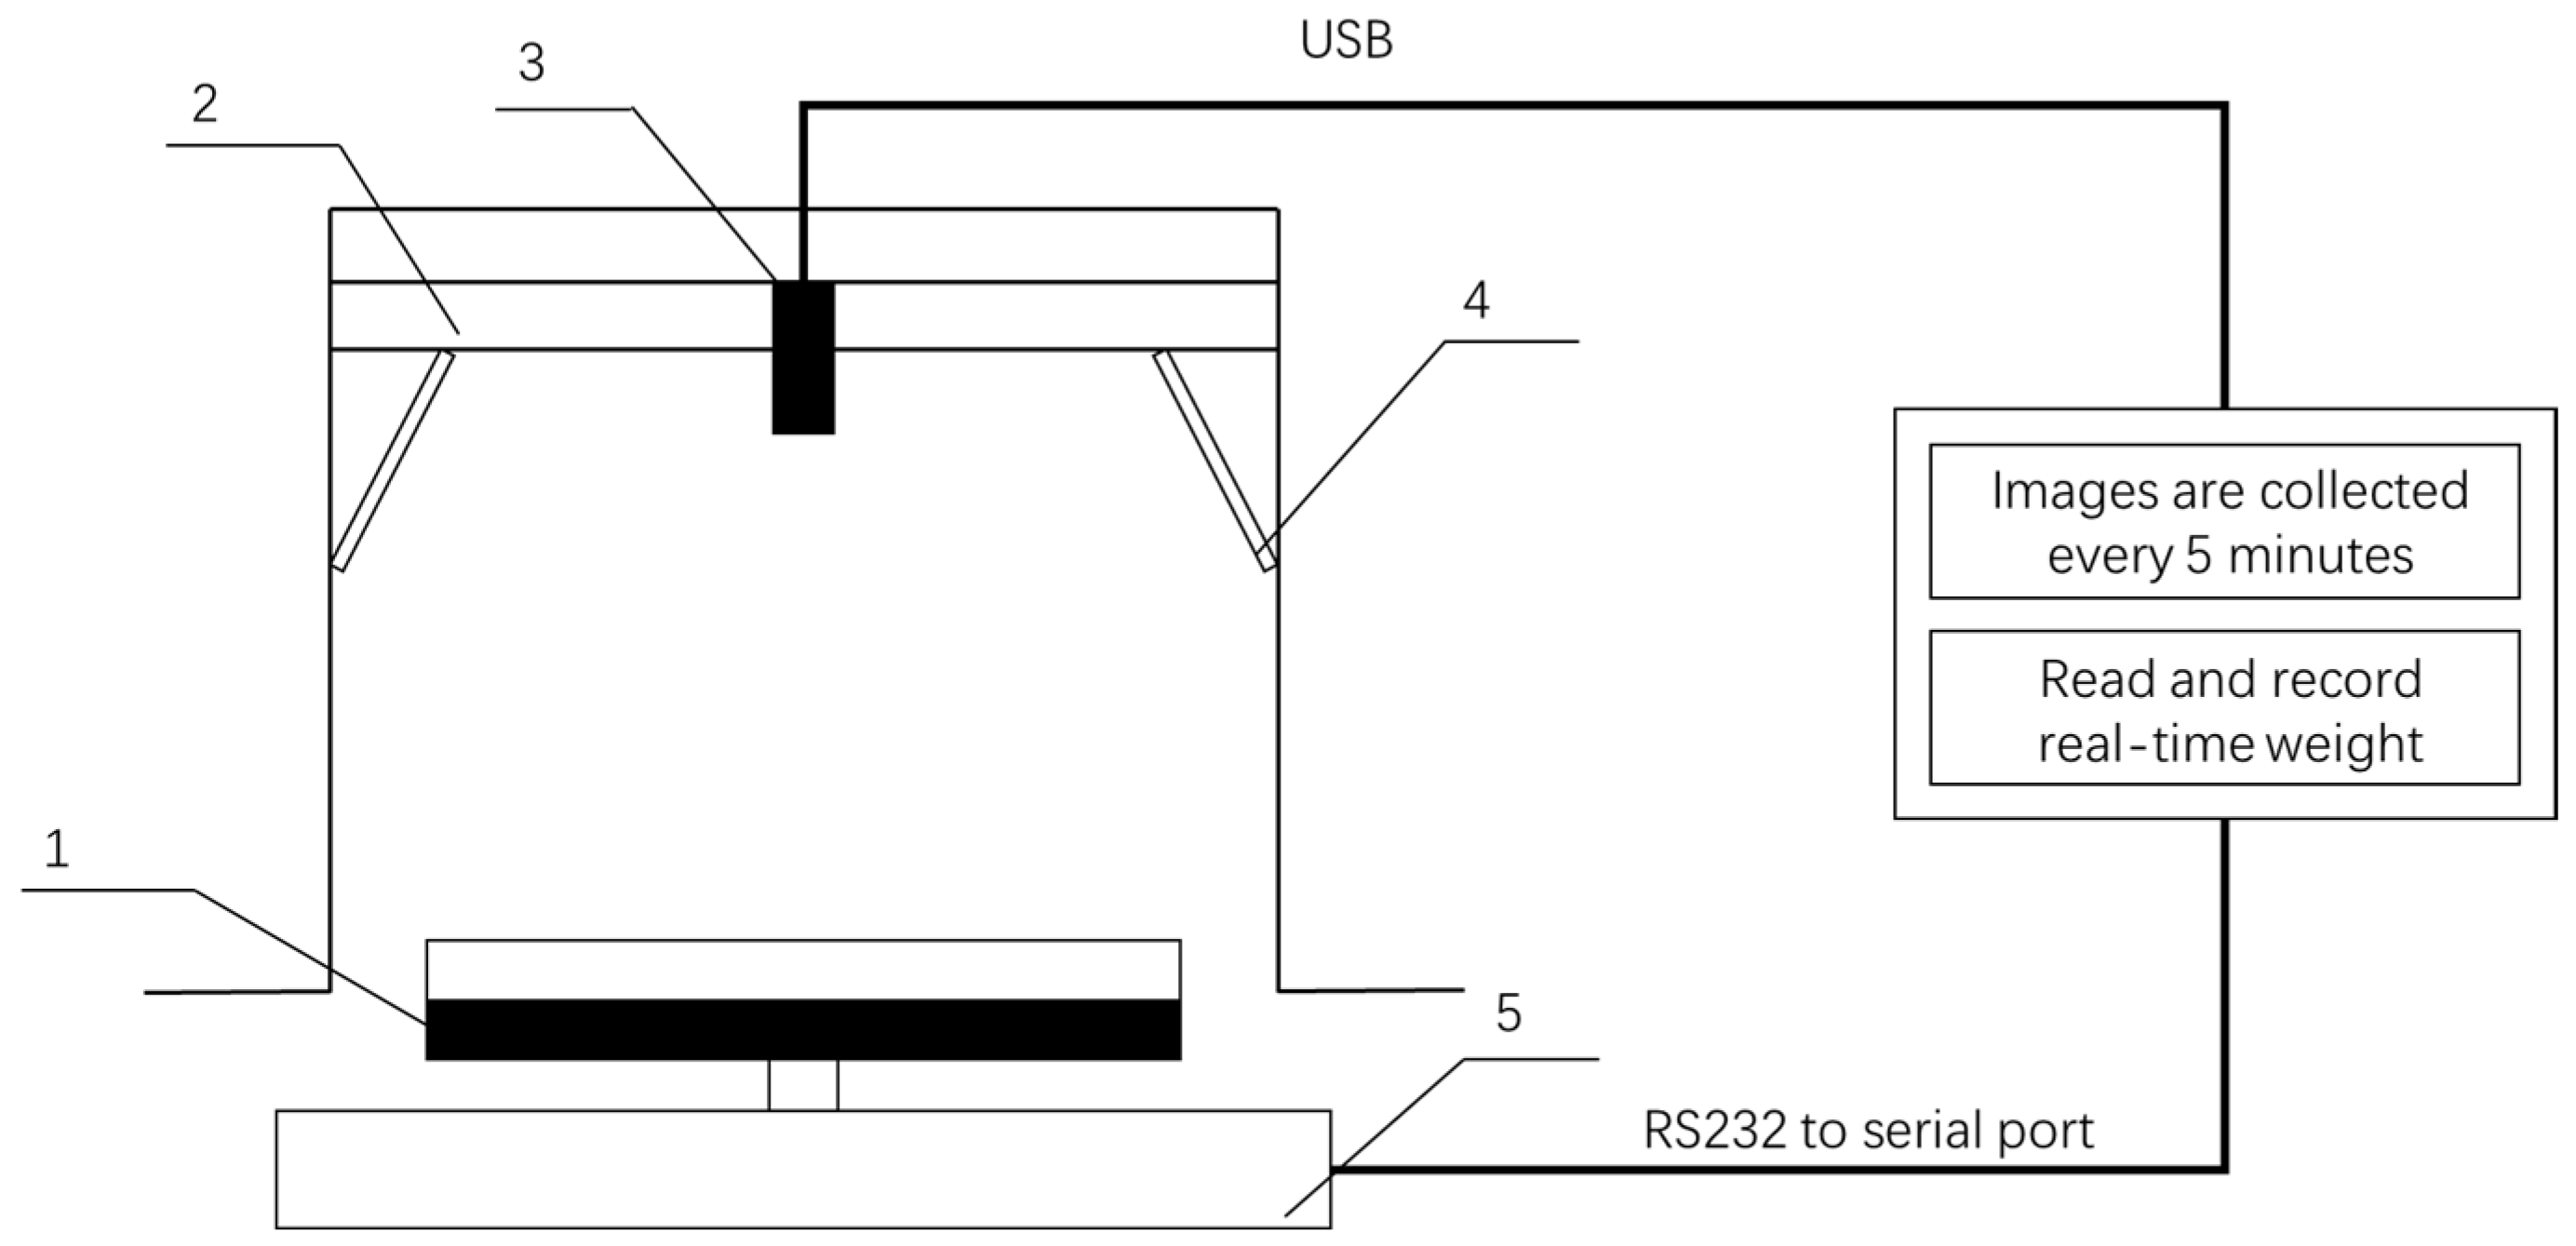
Taking the Yinghong No. 9 tea leaves moisture content detection device as the test platform, its composition is shown in Figure 5. The platform consisted of a dark room, a control room, and an electronic scale of the model Leqi CN-LQC30001 (Kunshan City, Jiangsu Province, China, Youkeweit Electronic Technology Co., Ltd.), with an accuracy of 0.01 g. The dark box and control room are described in detail in Section 3.
The test material was Yinghong No. 9 tea leaves, which were collected from the tea garden of Guangdong Yingjiu Manor Green Industry Development Co., Ltd., on November 6th and shipped back to South China Agricultural University. In order to ensure the quality of the tea leaves, the tea leaves harvested in the tea garden were placed in a fresh-keeping box, and approximately 5 kg of the wilted or damaged tea leaves was removed from the fresh-keeping box. The remaining tea leaves were divided into seven samples, each sample approximately 600 g, and the specific experimental steps were as follows:
Step 1: Place the electronic scale on the test bench for leveling.
Step 2: Place the iron frame on the electronic scale and perform a zero adjustment. After reading that the electronic scale is stable, click “tare”.
Step 3: Place and spread the tea leaves evenly on the iron plate until the electronic scale shows approximately 600 g.
Step 4: Fix the dark box above the tea leaves sample to ensure that the dark box does not contact the electronic scale and the iron plate and adjust the camera focus until the image is clear.
Step 5: Set the control room to collect the weight of the tea leaves and an image of the tea leaves every 5 min.
Step 6: After 10 h of moisture content loss, take out the tea leaves and put them into an aluminum box.
Step 7: Preheat the electric thermostatic drying oven to 102 degrees, and then put the aluminum box into the electric thermostatic drying oven. After 4 h, take it out, weigh it, and record the data. Then, put the aluminum box into the electric thermostatic drying oven for 1 h, and weigh it until the aluminum box reaches a constant weight state. Finally, calculate the dry weight of the tea leaves.
In each experiment, 120 groups of tea leaves images and tea leaves weights were collected, and a total of 840 groups of tea leaves images and tea leaves weights were obtained. For a certain time, t, referring to the GB/T 8304-2013 standard in Chinese to measure the moisture content of the tea leaves, the moisture content of the tea leaves was calculated using Equation (4). From the calculation, it was shown that the moisture content of the tea leaves dropped from 78.48% to 53.14%, and the average moisture content decreased by 0.09% every 5 min, which enriched the labeling range of the tea leaves images. The obtained images and moisture contents were divided into the training set and the test set at a ratio of 4:1.
W ( t ) = G 1 ( t ) G 2 G 1 ( t ) G 3 × 100 %
Here, G1(t) is the weight of the fresh tea leaves at time t, G2 is the dry tea leaves weight, G3 is the aluminum box weight, and W(t) is the moisture content of the tea leaves at time t.

4.2. Image Preprocessing

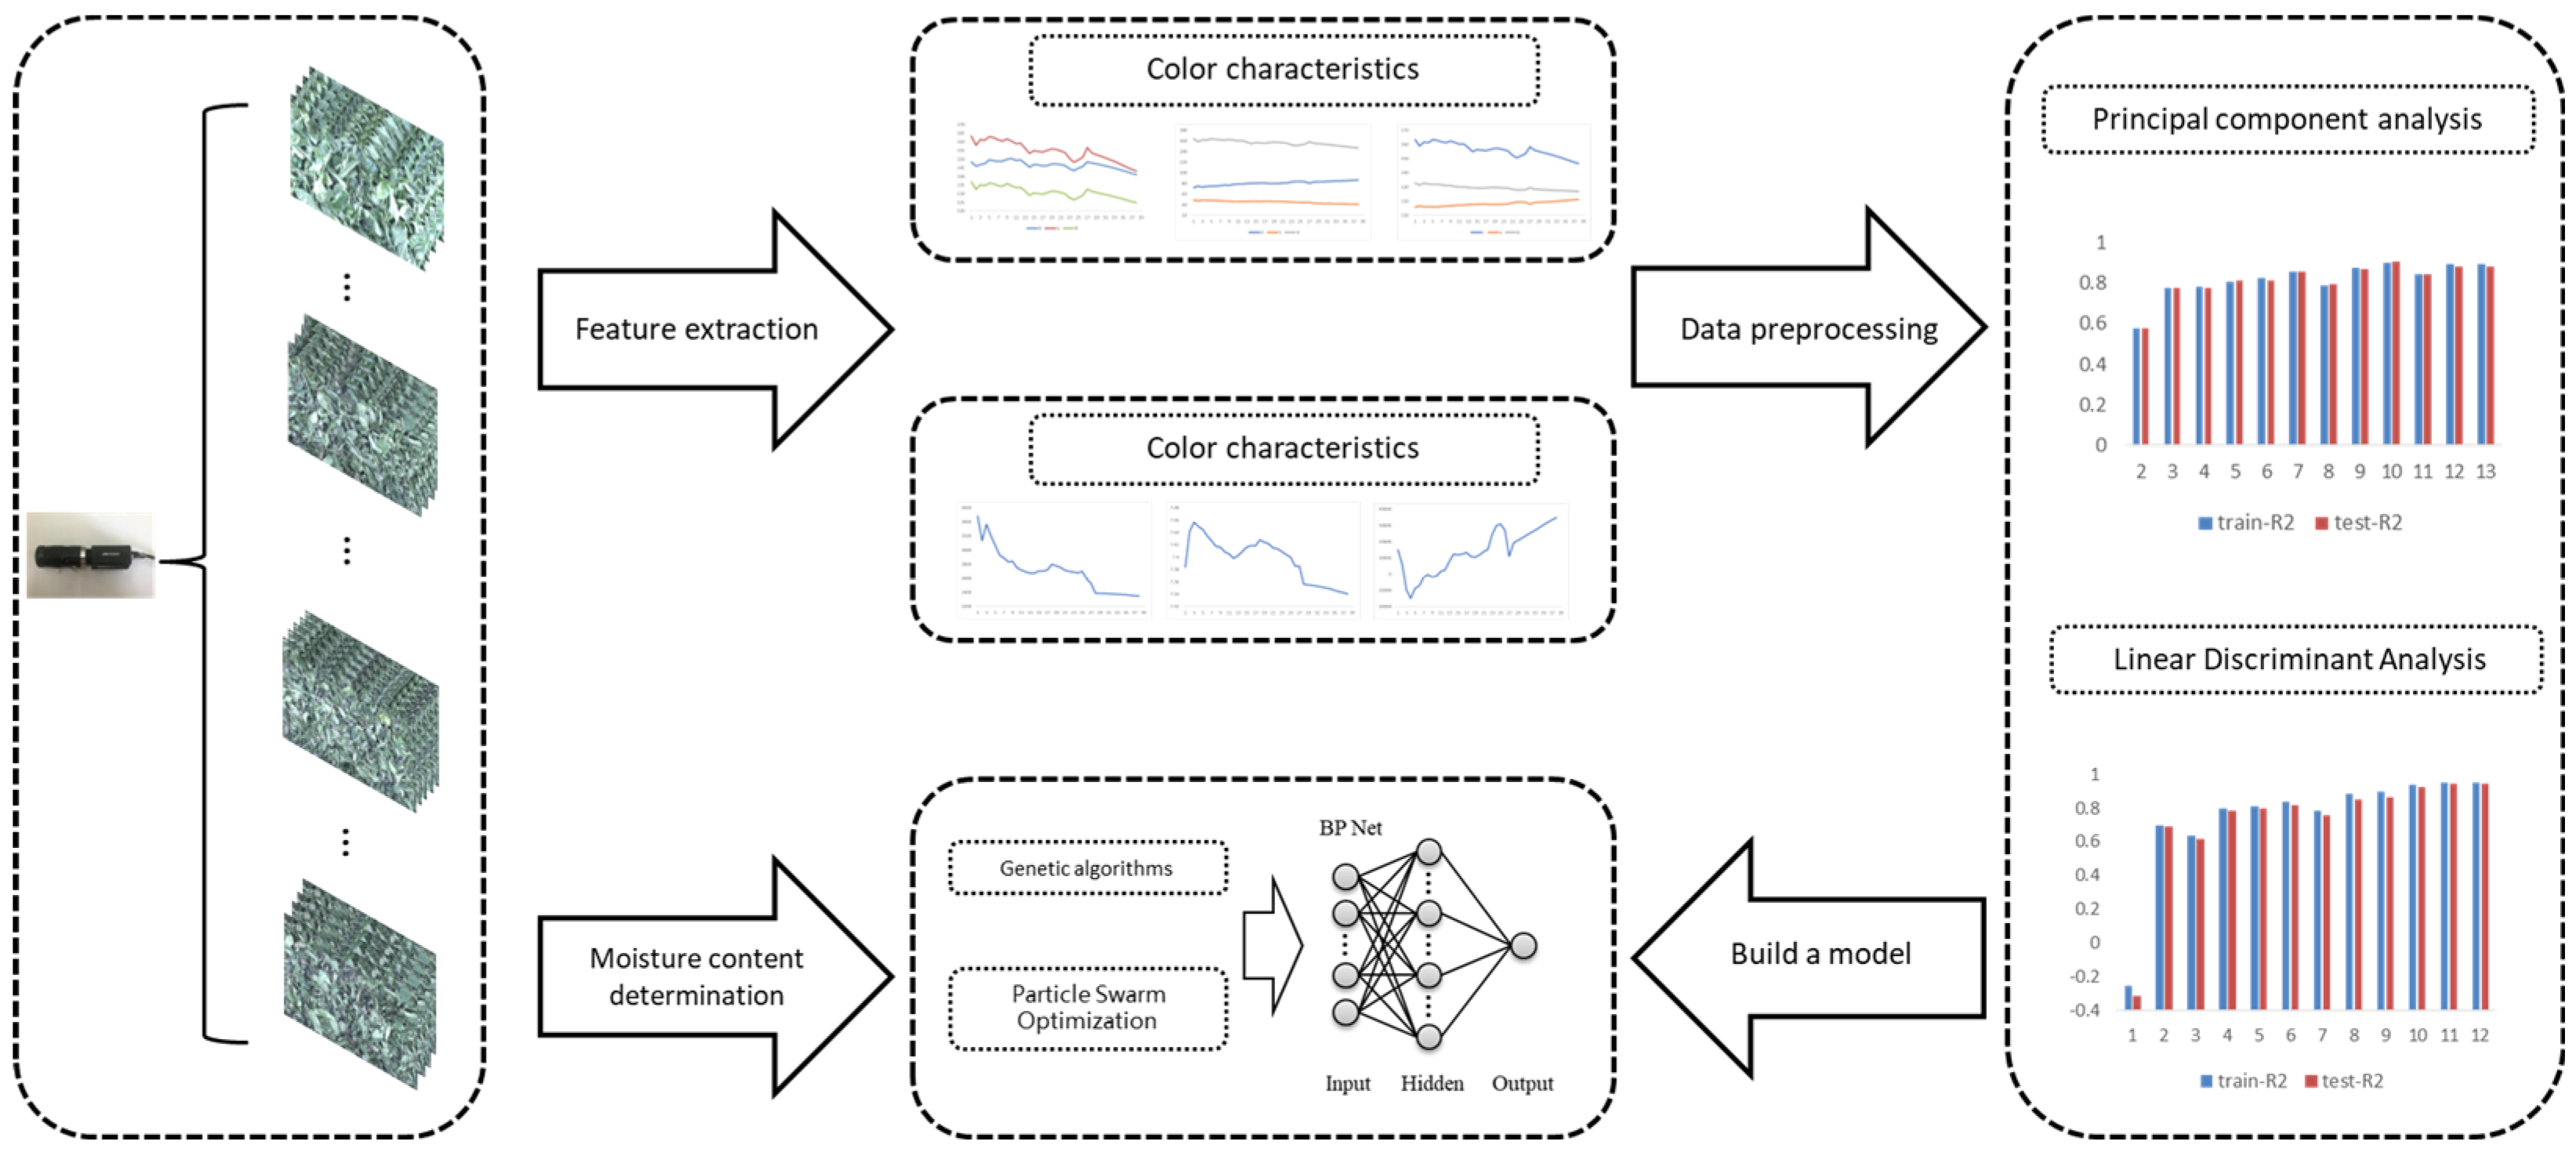
Image preprocessing was divided into feature extraction and data standardization. In this paper, the characteristic information of the tea leaves was extracted from the two aspects of color and texture, and the Z-score standardization method was used to standardize the data, which can make the mean value that is characteristic of the tea leaves 0 and the standard deviation 1 [17].
In terms of the color information, the collected tea leaves images were converted to RGB, LAB, and HSV color spaces for analysis. The RGB color mode is a color standard in the industry, which obtains various colors by changing the three color channels of red, green, and blue and superimposing them on each other; HSV is a color space created by Smith in 1978 based on the intuitive characteristics of colors, where H represents the hue of the color, S represents the saturation, and V represents the brightness; LAB is a color space formulated by CIE, which is insensitive to light noise and offsets the deficiencies of the RGB color space, where L is the pixel brightness, A represents the degree of red to green, and B represents a range from yellow to blue [18].
The texture information was extracted based on the gray-level co-occurrence matrix (CCM). We used m (mean), u2 (second-order moment), u3 (third-order moment), U (consistency), and e (entropy) to describe the texture information of the tea leaves [19]. The mean value describes the roughness of the tea leaves texture; the u2 and u3 describe the variance of the tea leaves’ pixels and reflect the local gray correlation of the tea leaves’ surface; the U refers to the uniformity of the tea leaves’ pixel distribution; and the entropy value describes the chaotic degree of the tea leaves image information and reflects the randomness of the pixels.
After extracting and standardizing the color features of the tea leaves images with different moisture contents, as shown in Figure 6a, as the moisture content of the tea leaves decreases, the color feature parameters change significantly, and the three values of RGB show a downward trend, resulting in a decrease in the overall brightness of the tea leaves images. The V and L parameters representing the brightness decrease, and the saturation, S, decreases. In Figure 6a, H and a gradually increased, while b gradually decreased, which means that the green component in the tea leaves image was decreasing, and the blue component was increasing. After the texture features were standardized, as shown in Figure 6b, the e first increased and then decreased, and the u2 first decreased and then increased. This shows that the tea leaves had a clear texture and large differences in the early stage of the moisture content reduction. In the later stage, the tea leaves surface was relatively uniform and smooth, and an overall decline in the m and U was indicated. The u3 first decreased and then increased, the skewness of the tea leaves color increased, and the overall color depth increased.

4.3. Dimensionality Reduction

The standardized feature information was subjected to dimensionality reduction in two different ways: Principal component analysis (PCA) and linear discriminant analysis (LDA); two different databases were constructed [20]. The PCA used orthogonal changes to linearly change the relevant variables in the dataset and finally projected a series of unrelated variables that are called principal components. A small number of principal components can not only represent the vast majority of the dataset but also reduce the dimensionality of the data [21].
On the other hand, the LDA, first proposed by Fisher, on the binary classification problem relied on the average value in the dimensionality reduction process. The main idea was to minimize the data of the same category and expand the data of different categories, compare with the PCA unsupervised learning method [22].

4.4. Model Accuracy Evaluation Index

For this paper, we selected the root mean square error (RMSE), the mean absolute error (MAE), and the coefficient of determination (R2) to evaluate the accuracy of the model, as shown in Equations (5)–(7). When the RMSE and MAE are smaller, the error between the predicted value of the model and the actual value is smaller. R2 primarily shows the degree of correlation between the predicted value and the actual value, and the higher the correlation, the higher the prediction accuracy of the model [23].
R M S E = 1 m i = 1 m ( y ^ ( i ) y ( i ) ) 2
M A E = 1 m i = 1 m y ^ ( i ) y ( i )
R 2 = 1 i = 1 m ( y ^ ( i ) y ( i ) ) 2 i = 1 m ( y ¯ ( i ) y ( i ) ) 2
Here, y ^ ( i ) is the model predicted sample moisture content, y ( i ) is the true moisture content of the sample, m is the number of samples, and y ¯ ( i ) is the sample mean.

5. Construction of the Moisture Content Detection Model of Yinghong No. 9 Tea Leaves

The process of building the moisture content detection model for Yinghong No. 9 tea leaves is shown in Figure 7. After extracting the color and texture features of the Yinghong No. 9 tea leaves image, standardization and dimension reduction were carried out, and the dimensionality-reduced data were input into the BP neural network. The weights of the BP neural network were optimized using the optimization algorithm.

5.1. Improve the Neural Network Models

5.1.1. BP Neural Network

The calculation process for the BP is essentially the process of forward propagation and backpropagation. From a mathematical point of view, the three-layer neural network structure can be represented as the input layer, hidden layer, and output layer, which can fit any curve. The number of input neurons in this paper was determined by the input feature dimension, and the number of output neurons was determined by the moisture content. The number of neurons in the hidden layer determined the accuracy and complexity of the model. Too many neurons would cause the number of parameters to increase exponentially and reduce the computational efficiency of the model. Too few neurons would lead to poor model convergence and reduce the model’s performance. Referring to Kolmogorov’s theorem to determine the number of neurons using Equation (8) [24]:
n = 0.43 k + 0.12 + 2.54 k + 0.77 + 0.35 + 0.51
where k is the number of neurons and n is the number of dimensions entered (the neurons of the input layer).
The activation function adopted the Relu function, which can greatly speed up the training of the network, and then the gradient descent was used to update the weight parameters.

5.1.2. Genetic Algorithms and Particle Swarm Optimization

The BP neural network optimization algorithm adopted the genetic algorithm (GA) and particle swarm optimization (PSO), both of which were to make up for the deficiency of the BP neural network global search. The GA encoded the weights of the BP neural network as the initial population and calculated the fitness of the individual by setting the loss function to eliminate the individuals with poor performance [25]. The difference between the PSO and GA is that PSO is based on a bird flock search and adopts a strategy from the global to the local. During the initialization, each particle had a fitness value given by the fitness function and obtained an initial velocity. In the process of iteration, the particle’s velocity was adjusted according to its position and velocity. With the concentration of particles, the search range was from the global to the local to obtain the optimal value [26].

6. Results

6.1. Model Prediction and Evaluation

Two preprocessing methods and two optimization algorithms were cross-combined to build nine models, the epoch of the neural network was set to 300, and the batch size was 32. The training results are shown in Table 3. It can be seen from Table 3 that the effect of using the GA to optimize the neural network was better without any preprocessing method. When PCA and LDA were used for the data dimensionality reduction, the accuracy of the neural network model using the PSO algorithm improved instead. Comparing the two preprocessing methods, the robustness of the database constructed by PCA was higher. Compared with LDA, the R2 of the PCA was higher by 1.77%, the RMSE was reduced by 0.59%, and the MAE was reduced by 0.31%. When the PCA is compared with no preprocessing method, the R2 was higher by 4.36%, the RMSE decreased by 1.366%, and the MAE decreased by 0.39%.
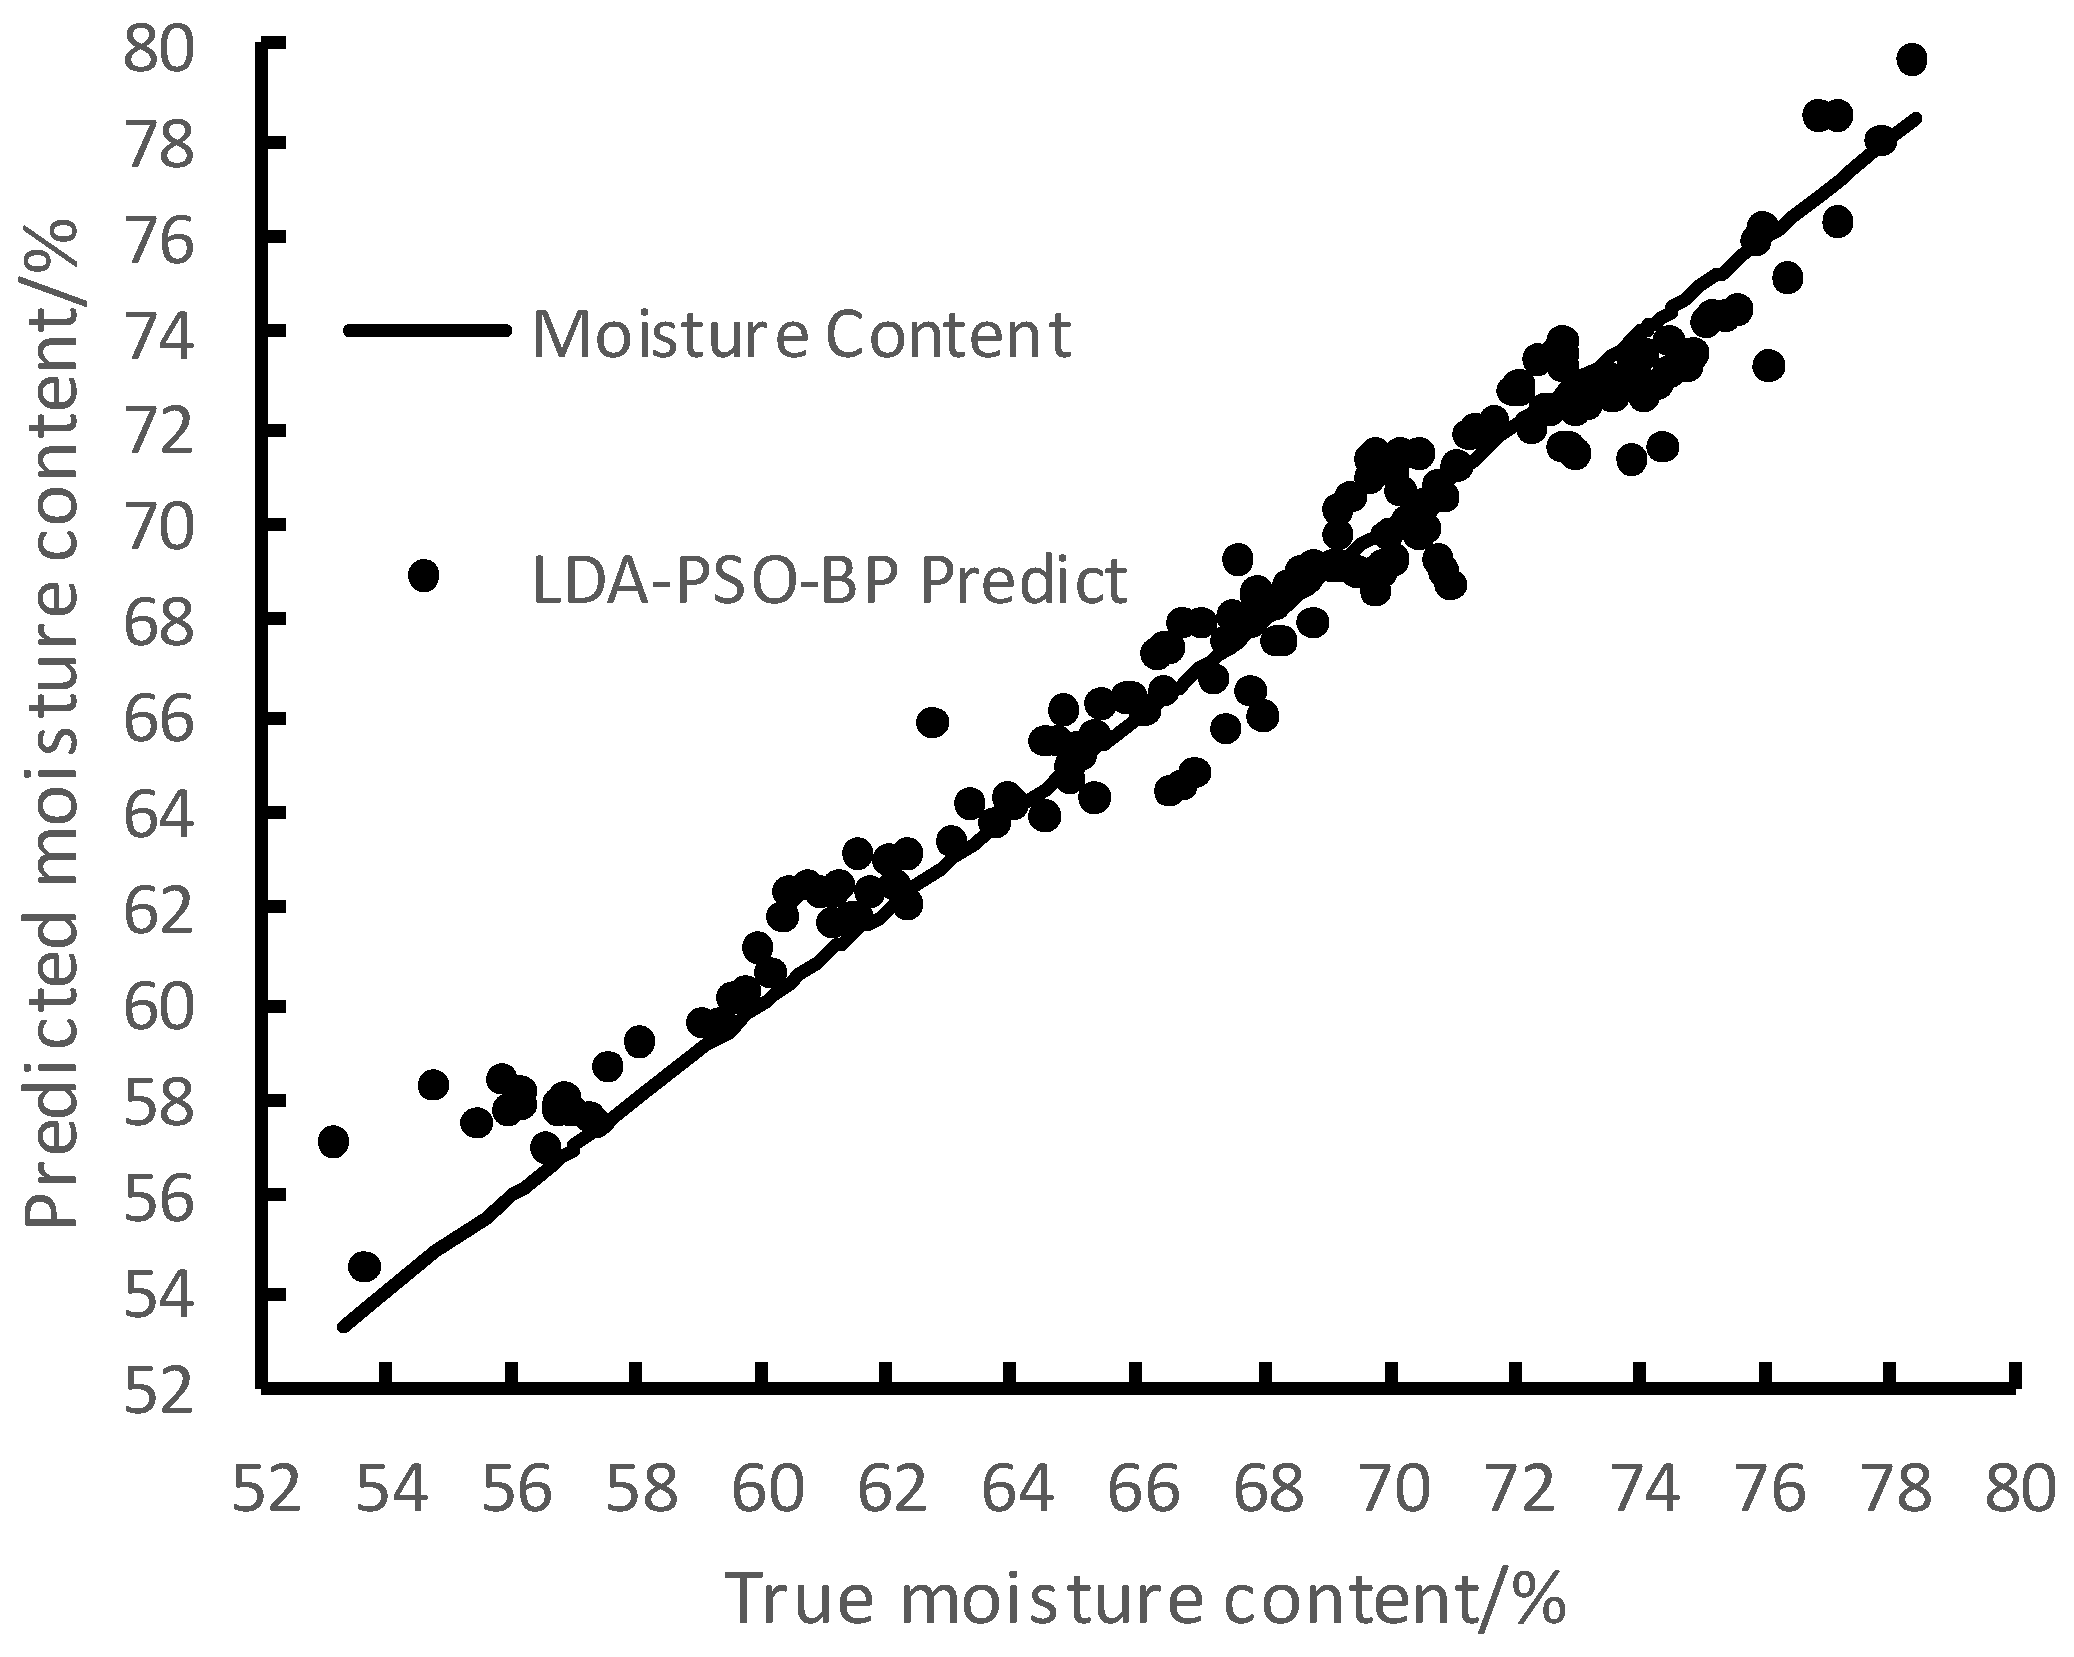
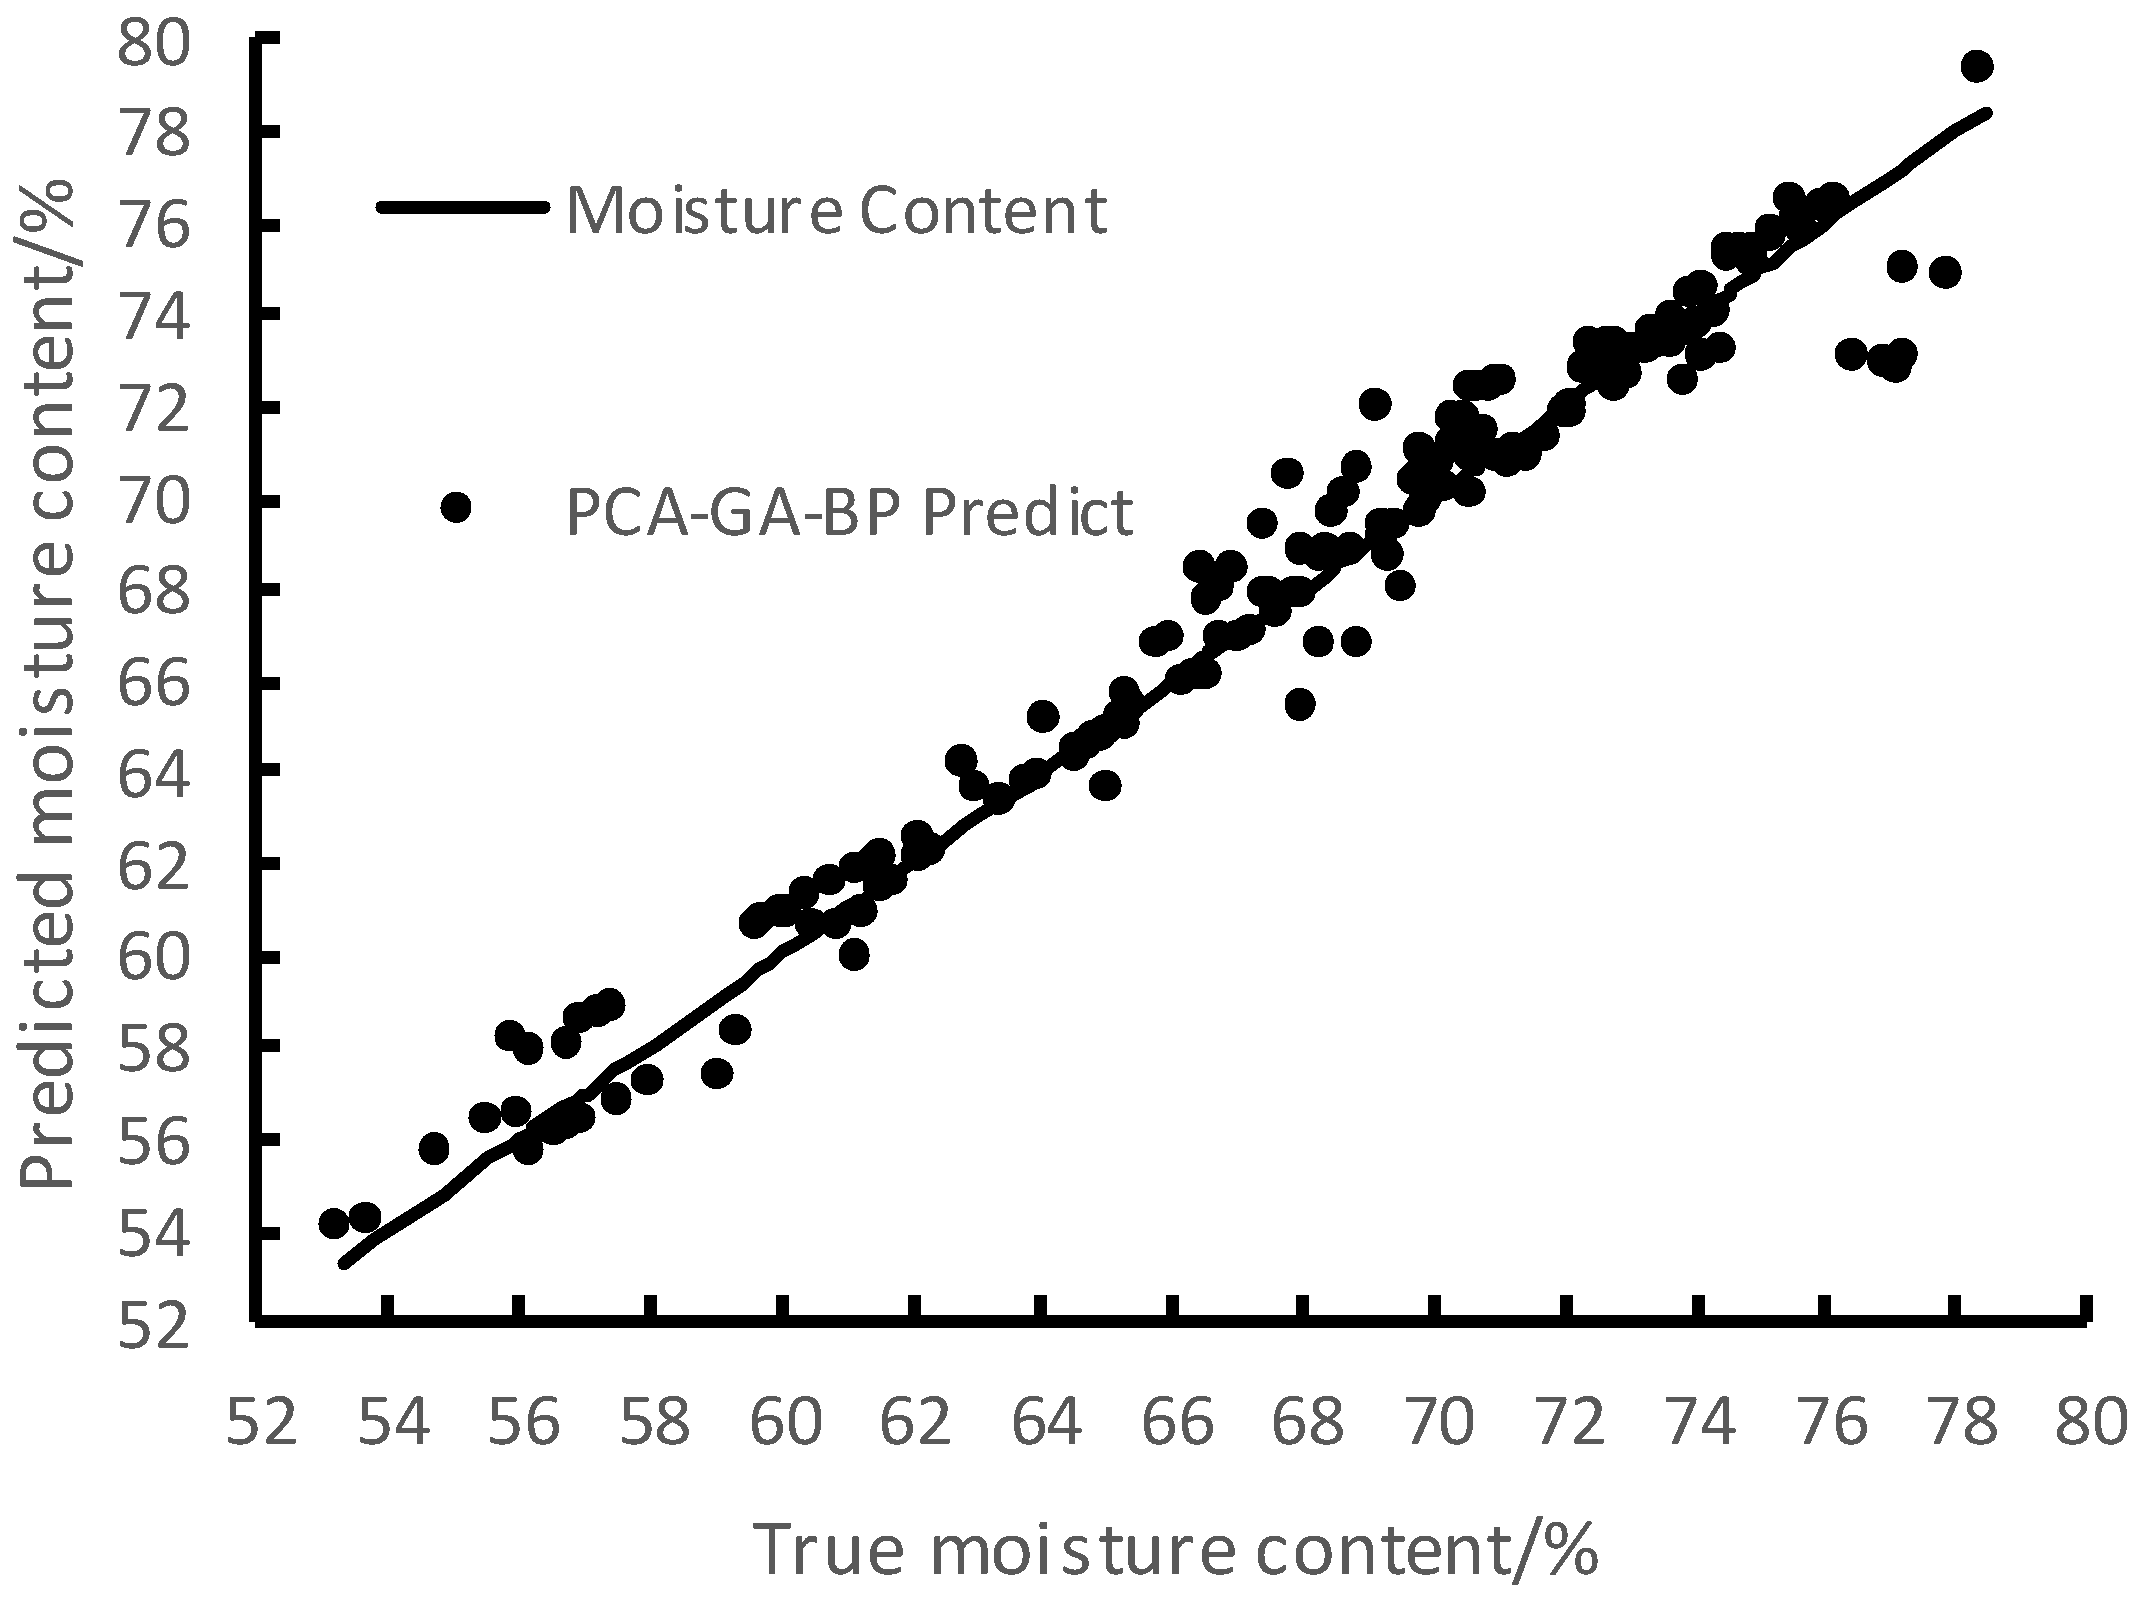
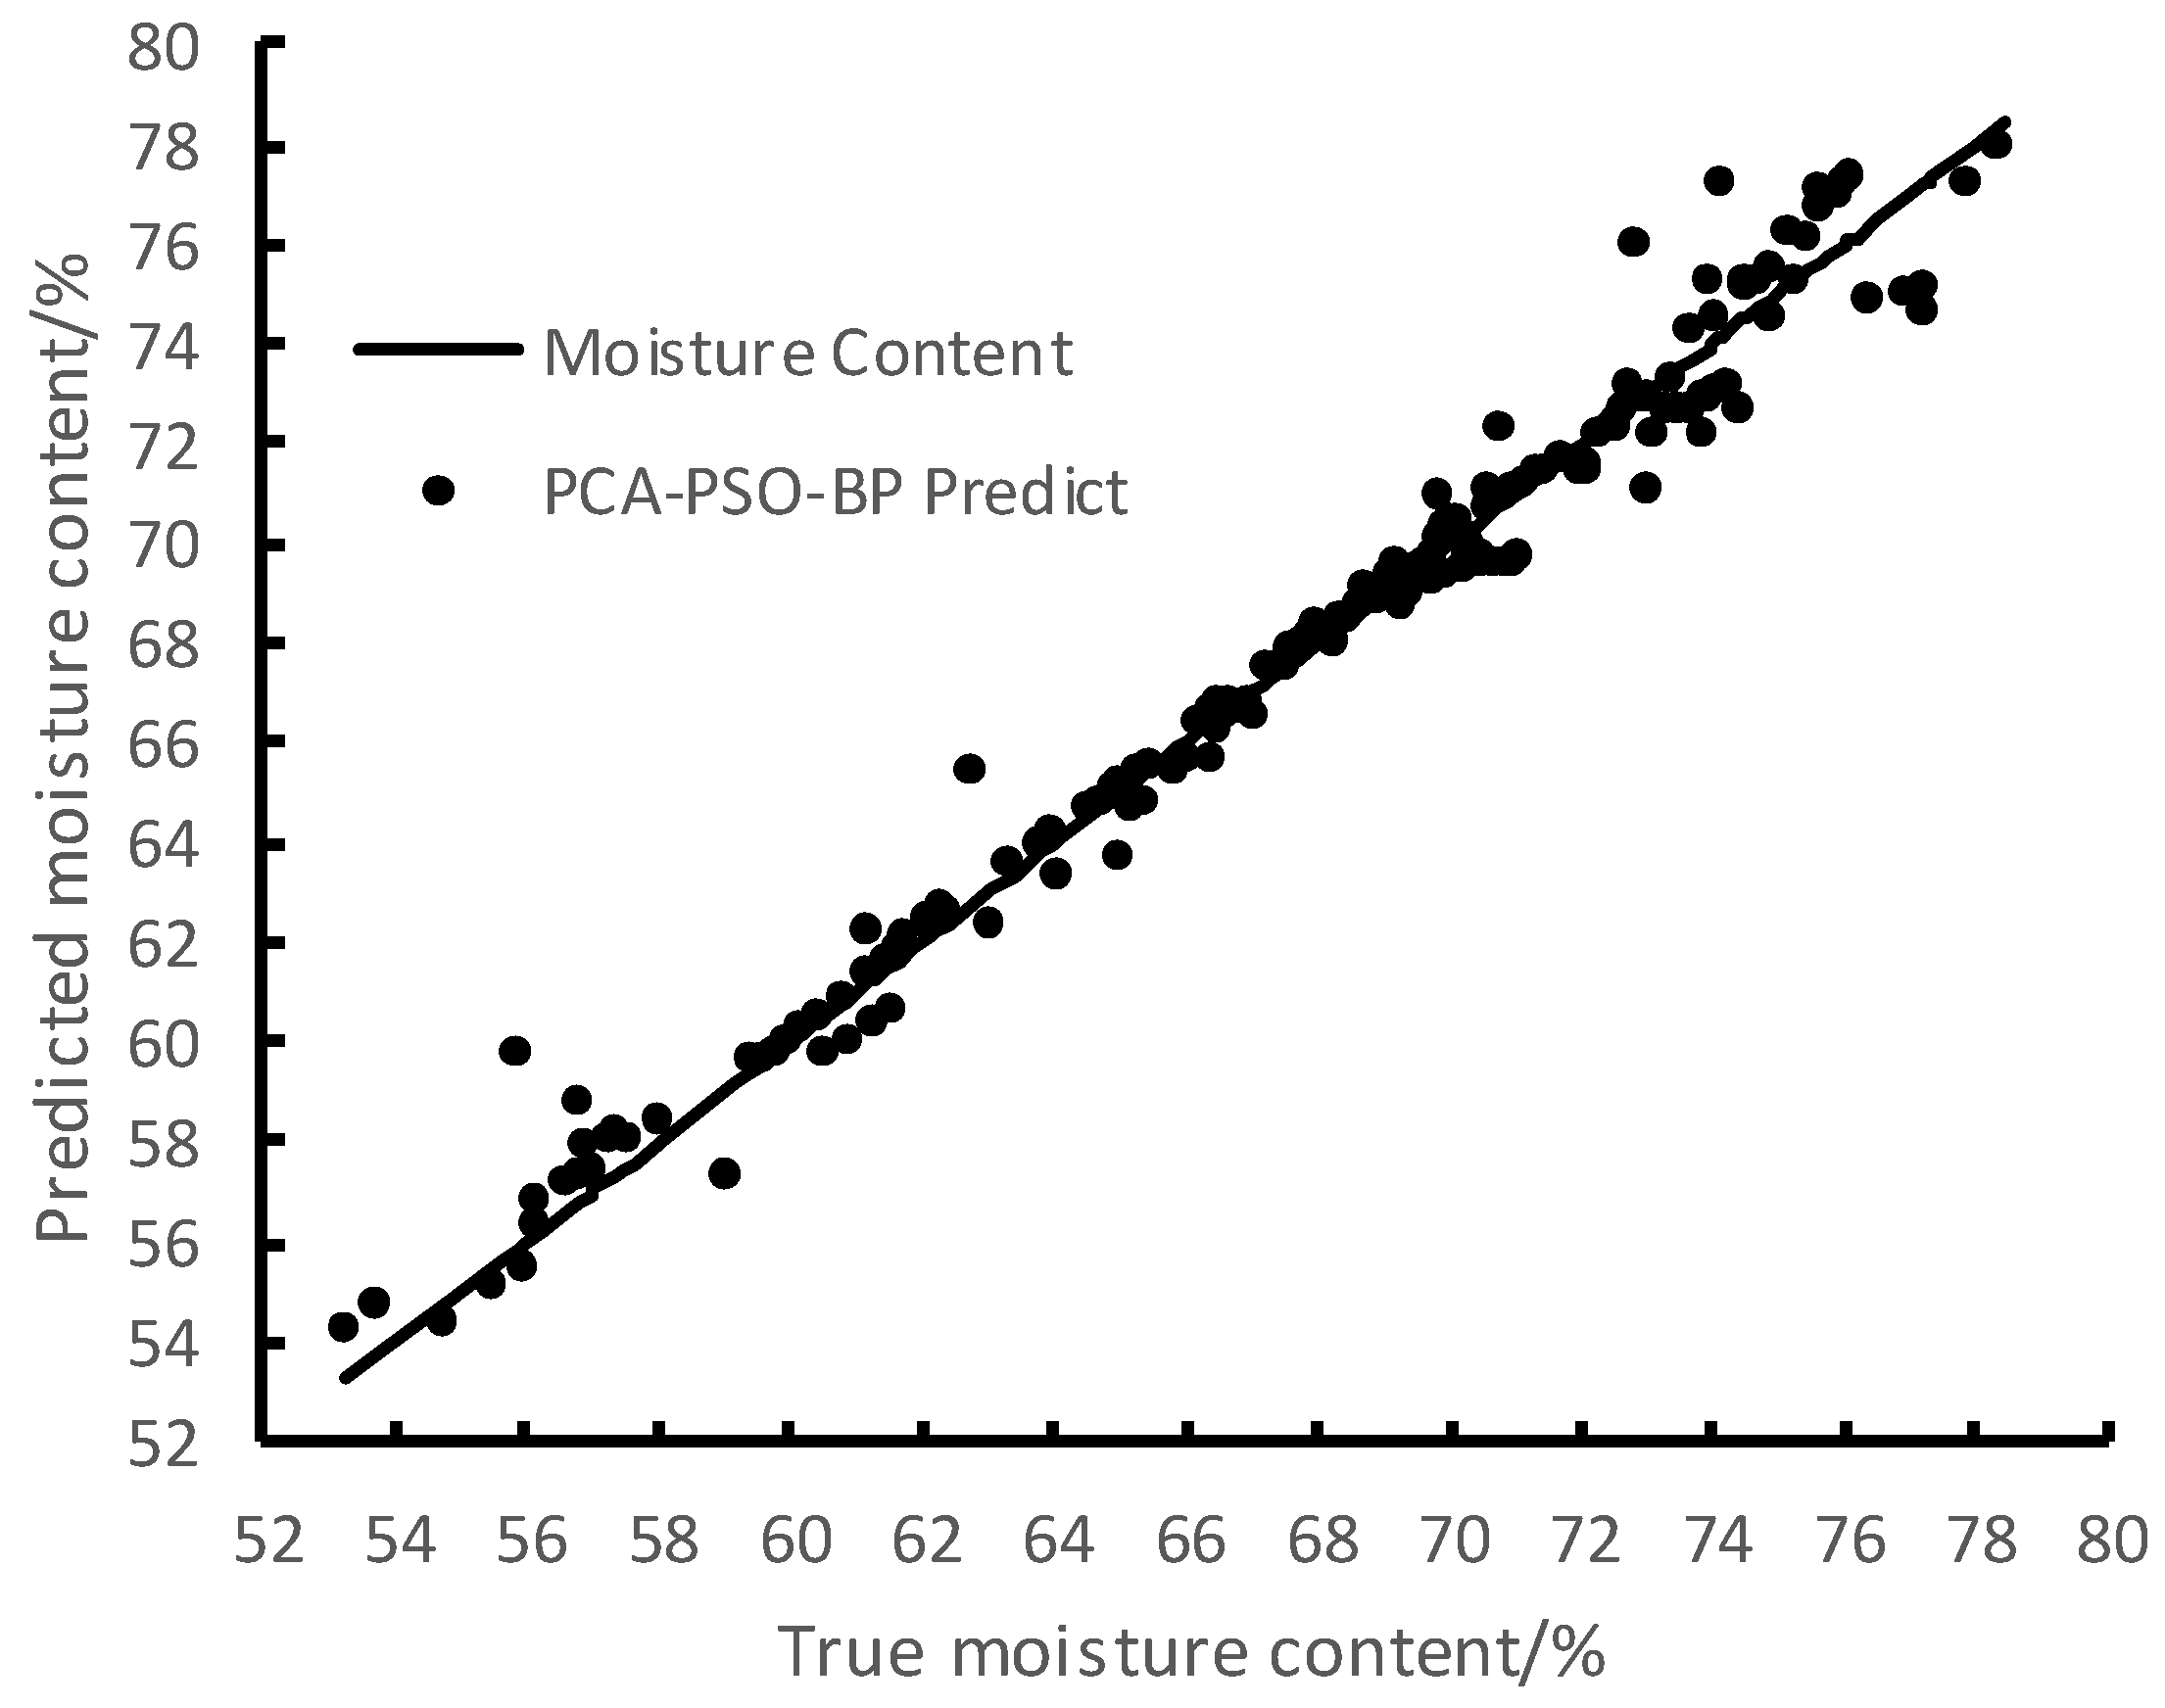
The three models with the highest accuracy in the test set were selected for comparison, as shown in Figure 8, Figure 9 and Figure 10. It can be seen from the figure that the test data points mainly concentrated between 64% and 80%. Because the training data in this moisture content interval were higher, the fitting effect of the three models was the best in this interval. In general, the moisture content predicted by PCA-PSO-BP was closer to the real moisture content, and the prediction effect was better than other models. Locally, when the moisture content was less than 64%, the moisture content predicted by PCA-PSO-BP deviated seriously from the real moisture content; the moisture content predicted by the PCA-GA-BP model was relatively stable; and LDA-PSO-BP predicted that the moisture content was always greater than the real moisture content. When the moisture content was greater than 64%, the moisture content predicted by PCA-PSO-BP was more concentrated, but the other models were more dispersed.
When the cluster of moisture content data points in the test set was split at 64%, the prediction results of the three models on the test set are shown in Table 4 and Table 5. It can be seen from the table that the indexes of PCA-PSO-BP were better than the other models when the moisture content was greater than 64%. The MAE of PCA-GA-BP was higher than that of PCA-PSO-BP, but the overall accuracy was higher than that of PCA-PSO-BP when the moisture content was less than 64%. In this paper, an improved BP neural network model was constructed to combine PCA-GA-BP and PCA-PSO-BP and to predict the moisture content of the Yinghong No. 9 tea leaves.
In order to further reflect the advantages of the improved BP neural network model, it was compared with partial least squares (PLS) and support vector regression (SVR). The prediction effect on the test set is shown in Table 6. It can be seen from the various indicators that the improved BP neural network model was more suitable for the task of detecting the moisture content of the Yinghong No. 9 tea leaves.

6.2. Model Validation

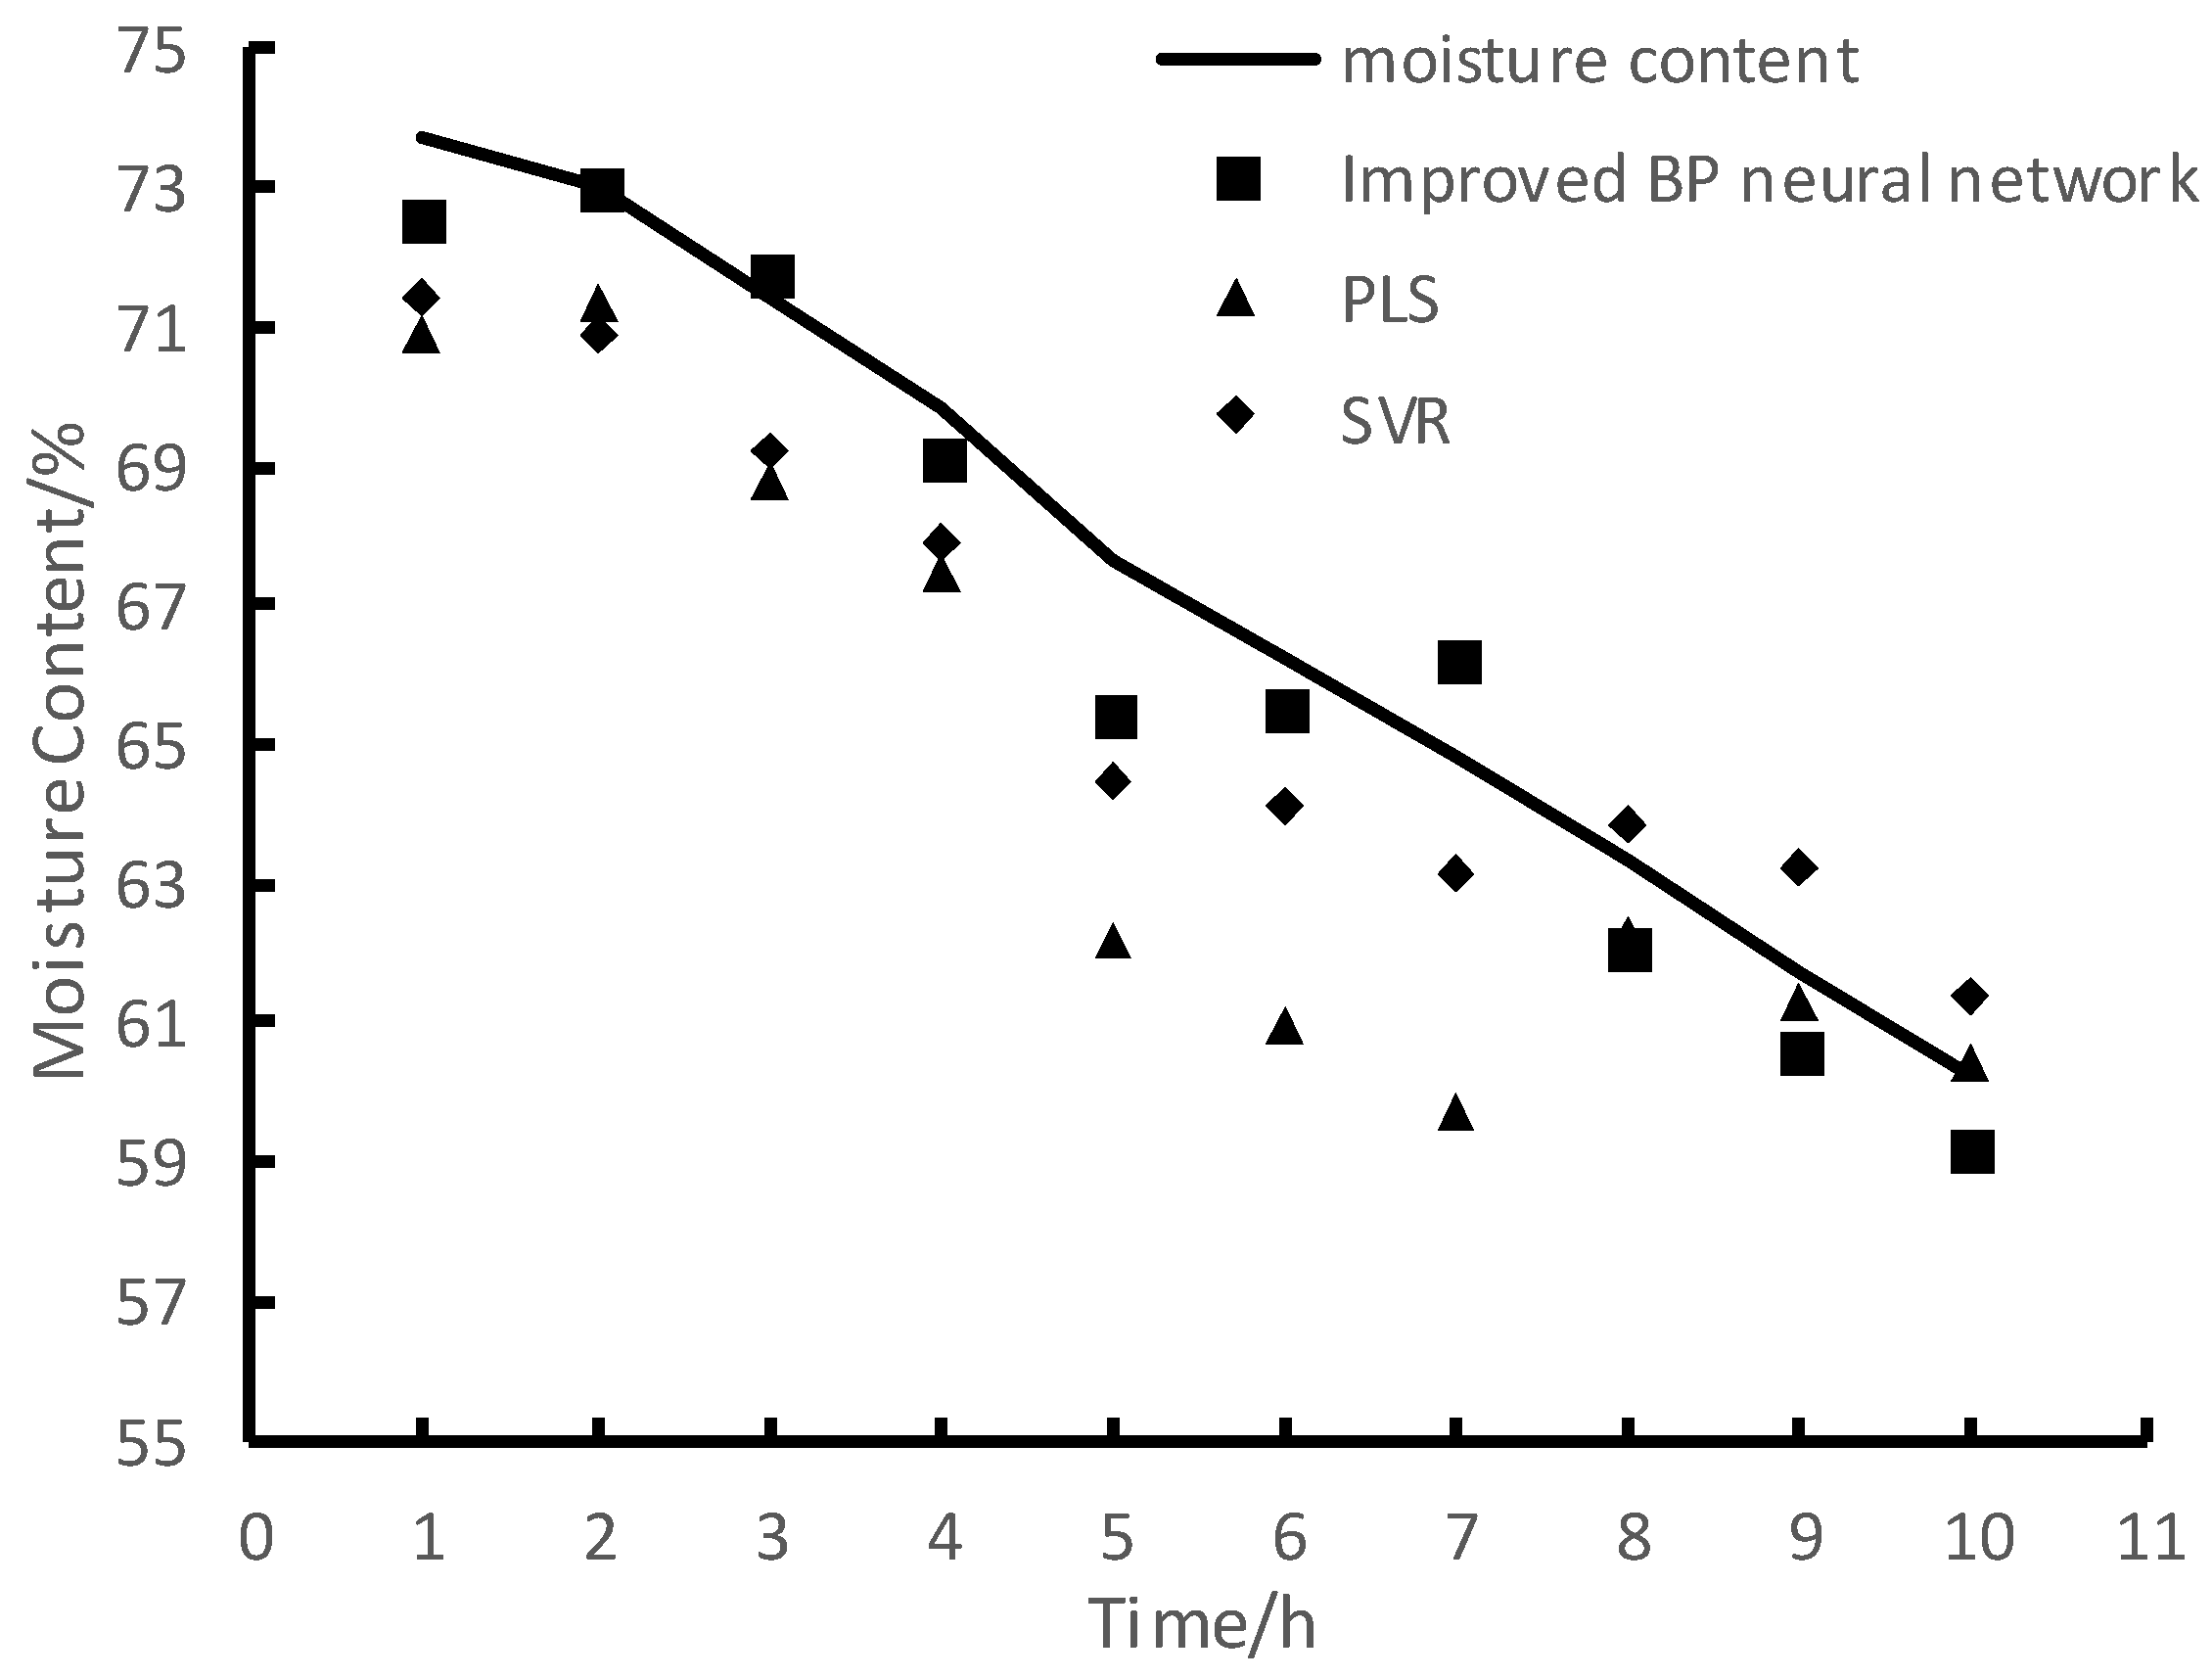
In order to verify the robustness of the improved BP neural network model, the method in Section 4 was adopted to modify the interval time to 1 h and reacquire nine Yinghong images and moisture contents for verification. After 10 h of moisture loss, the real-time fresh weight and images of 10 groups of tea leaves were recorded. The test results showed that the moisture content of the tea leaves dropped from 73.68% to 60.27%, which was in line with the model for moisture content prediction. The improved BP neural network model, SVR model, and PLS model were used to predict the verification data, and the prediction effect is shown in Figure 11. Compared with the PLS model, the SVR model was closer to the real moisture content, but the fitting degree was still lower than the improved BP neural network model. The prediction indicators of each model are shown in Table 7. Compared with the SVR and PLS models, the improved BP neural network model had strong robustness that met the needs of moisture content detection for the Yinghong No. 9 tea leaves.

7. Conclusions

In this paper, we designed a moisture content detection system for Yinghong No. 9 tea leaves based on machine vision and used the improved BP neural network model to realize the rapid nondestructive detection of the moisture content of Yinghong No. 9 tea leaves. This method for the moisture content detection of Yinghong No. 9 tea leaves changed the traditional detection method and improved production efficiency.
The PCA and the LDA methods were used to preprocess the data, and the GA and PSO were employed to optimize the BP neural network. After cross-combining and comparing the nine models, it can be concluded that using the GA and PSO algorithms in the optimization algorithm can improve the accuracy of the BP neural network prediction of moisture content. In the preprocessing stage, PCA was more accurate than LDA in predicting the moisture content of the tea leaves. After selecting the three models with the highest accuracy in the test set for comparison, it was found that each index of PCA-PSO-BP was better than that of the other models when the moisture content was higher than 64%, and PCA-GA-BP had fewer outliers and higher accuracy when the moisture content was lower than 64%. Therefore, we combined PCA-GA-BP and PCA-PSO-BP to construct an improved BP neural network model and to predict the moisture content of the Yinghong No. 9 tea leaves.
On the test set, after comparing the improved BP neural network model and the PLS and SVR models, it was found that the improved BP neural network model was better than the PLS and SVR models in all indicators; therefore, the improved BP neural network model was more suitable for the Yinghong No. 9 tea leaves moisture content detection.
After verifying the improved BP neural network model, it was found that the model had strong robustness and high accuracy compared with PLS and SVR. Using the verification data, the model predicted that the R2 of the moisture content was 94.1073%, the RMSE was 1.1490%, and the MAE was 0.9982%, which met the actual production needs.
The moisture content detection system for Yinghong No. 9 tea leaves based on machine vision used the image recognition method to solve the problems brought by the traditional method of measuring moisture content, which has a positive and guiding significance for promoting smart tea factories.

Author Contributions

Methodology, F.W.; Resources, C.M.; Writing—original draft, B.X.; Writing—review & editing, E.L., B.X. and C.M.; Visualization, C.M.; Project administration, F.W. and E.L.; Software, F.W. and S.M.; Formal analysis, Z.Z., S.M. and C.M.; Investigation, Z.Z., S.M. and C.M.; Funding acquisition, Z.Z.; Validation, S.M.; Supervision, J.G.; Data curation, J.G.; All authors have read and agreed to the published version of the manuscript.

Funding

This research was funded by independent scientific research project of Maoming Laboratory, improve the tea science and technology capabilities of cities and counties to promote industrial development projects, 2019 Provincial Agricultural Science and Technology Innovation and Promotion Project of Guangdong Province, R&D and innovation team for common key technologies of agricultural product fresh keeping logistics under the grant number 2021ZZ003, 403-2018-XMZC-0002-90, 2021KJ101 and 2021KJ145.

Institutional Review Board Statement

Not applicable.

Informed Consent Statement

Not applicable.

Data Availability Statement

Not applicable.

Conflicts of Interest

The authors declare no conflict of interest.

References

  1. Qi, D.; Li, J.; Qiao, X.; Lu, M.; Chen, W.; Miao, A.; Guo, W.; Ma, C. Non-targeted Metabolomic Analysis Based on Ul tra-High-Performance Liquid Chromatography Quadrupole Time-of-Flight Tandem Mass Spectrometry Reveals the Effects of Grafting on Non-volatile Metabolites in Fresh Tea Leaves (Camellia sinensis L.). J. Agr. Food Chem. 2019, 67, 6672–6682. [Google Scholar] [CrossRef]
  2. Ntezimana, B.; Li, Y.; He, C.; Yu, X.; Zhou, J.; Chen, Y.; Yu, Z.; Ni, D. Different Withering Times Affect Sensory Qualities, Chemical Components, and Nutritional Characteristics of Black Tea. Foods 2021, 10, 2627. [Google Scholar] [CrossRef] [PubMed]
  3. Zhang, M.; Guo, J.; Ma, C.; Qiu, G.; Ren, J.; Zeng, F.; Lü, E. An Effective Prediction Approach for Moisture Content of Tea Leaves Based on Discrete Wavelet Transforms and Bootstrap Soft Shrinkage Algorithm. Appl. Sci. 2020, 10, 4839. [Google Scholar] [CrossRef]
  4. Mizukami, Y.; Sawai, Y.; Yamaguchi, Y. Moisture Content Measurement of Tea Leaves by Electrical Impedance and Capacitance. Biosyst. Eng. 2006, 93, 293–299. [Google Scholar] [CrossRef]
  5. Wei, Y.; Wu, F.; Xu, J.; Sha, J.; Zhao, Z.; He, Y.; Li, X. Visual detection of the moisture content of tea leaves with hyperspectral imaging technology. J. Food Eng. 2019, 248, 89–96. [Google Scholar] [CrossRef]
  6. Rehman, T.U.; Mahmud, M.S.; Chang, Y.K.; Jin, J.; Shin, J. Current and future applications of statistical machine learning algorithms for agricultural machine vision systems. Comput. Electron. Agric. 2019, 156, 585–605. [Google Scholar] [CrossRef]
  7. Laddi, A.; Sharma, S.; Kumar, A.; Kapur, P. Classification of tea grains based upon image texture feature analysis under different illumination conditions. J. Food Eng. 2013, 115, 226–231. [Google Scholar] [CrossRef]
  8. Wei, Y.; He, Y.; Li, X. Tea moisture content detection with multispectral and depth images. Comput. Electron. Agric. 2021, 183, 106082. [Google Scholar] [CrossRef]
  9. Zhang, Y.; Yang, X.; Cattani, C.; Venkata Rao, R.; Wang, S.; Phillips, P. Tea Category Identification Using a Novel Fractional Fourier Entropy and Jaya Algorithm. Entropy 2016, 18, 77. [Google Scholar] [CrossRef] [Green Version]
  10. Liang, G.; Dong, C.; Hu, B.; Zhu, H.; Yuan, H.; Jiang, Y.; Hao, G. Prediction of Moisture Content for Congou Black Tea Withering Leaves Using Image Features and Nonlinear Method. Sci. Rep.-UK 2018, 8, 7854. [Google Scholar] [CrossRef]
  11. An, T.; Yu, H.; Yang, C.; Liang, G.; Chen, J.; Hu, Z.; Hu, B.; Dong, C. Black tea withering moisture detection method based on convolution neural network confidence. J. Food Process Eng. 2020, 43, e13428. [Google Scholar] [CrossRef]
  12. Zhang, D.; Liu, J.; Jiang, C.; Liu, A.; Xia, B. Quantitative detection of formaldehyde and ammonia gas via metal oxide-modified graphene-based sensor array combining with neural network model. Sens. Actuators Chem. 2017, 240, 55–65. [Google Scholar] [CrossRef]
  13. Jahn, M. Artificial neural network regression models in a panel setting: Predicting economic growth. Econ. Model. 2020, 91, 148–154. [Google Scholar] [CrossRef]
  14. Sun, Q.; Zhang, M.; Yang, P. Combination of LF-NMR and BP-ANN to monitor water states of typical fruits and vegetables during microwave vacuum drying. LWT 2019, 116, 108548. [Google Scholar] [CrossRef]
  15. Meerasri, J.; Sothornvit, R. Artificial neural networks (ANNs) and multiple linear regression (MLR) for prediction of moisture content for coated pineapple cubes. Case Stud. Therm. Eng. 2022, 33, 101942. [Google Scholar] [CrossRef]
  16. Zong, Z.; Liu, G. Design and Experiment of Maize Fertilization Control System Based on Machine Vision. Trans. Chin. Soc. Agric. Mach. 2021, 52, 66–73. [Google Scholar]
  17. Dong, C.W.; Zhu, H.K.; Zhao, J.W.; Jiang, Y.W.; Yuan, H.B.; Chen, Q.S. Sensory quality evaluation for appearance of needle-shaped green tea based on computer vision and nonlinear tools. J. Zhejiang Univ. Sci. 2017, 18, 544–548. [Google Scholar] [CrossRef] [Green Version]
  18. Shahabi, M.; Rafiee, S.; Mohtasebi, S.S.; Hosseinpour, S. Image analysis and green tea color change kinetics during thin-layer drying. Food Sci. Technol. Int. 2014, 20, 465–476. [Google Scholar] [CrossRef]
  19. Fajardo, J.I.; Paltán, C.A.; López, L.M.; Carrasquero, E.J. Textural analysis by means of a gray level co-occurrence matrix method. Case: Corrosion in steam piping systems. Mater. Today Proc. 2022, 49, 149–154. [Google Scholar] [CrossRef]
  20. Vítková, G.; Prokeš, L.; Novotný, K.; Pořízka, P.; Novotný, J.; Všianský, D.; Elko, L.; Kaiser, J. Comparative study on fast classification of brick samples by combination of principal component analysis and linear discriminant analysis using stand-off and table-top laser-induced breakdown spectroscopy. Spectrochim. Acta Part At. Spectrosc. 2014, 101, 191–199. [Google Scholar] [CrossRef]
  21. Brereton, R.G. Chemometrics for Pattern Recognition; John Wiley & Sons, Ltd.: Hoboken, NJ, USA, 2009. [Google Scholar]
  22. Bill, F. Pattern Recognition and Neural Networks. Technometrics 2012, 39, 169–195. [Google Scholar]
  23. Fu, X.; Chen, J.; Li, J.; Dai, G.; Tang, J.; Yang, Z. Mechanism underlying the carotenoid accumulation in shaded tea leaves. Food Chem. X 2022, 14, 100323. [Google Scholar] [CrossRef] [PubMed]
  24. Zhao, J.; Zhang, C.; Min, L.; Li, N.; Wang, Y. Retrieval for soil moisture in farmland using multi-source remote sensing data and feature selection with GA-BP neural network. Trans. Chin. Soc. Agric. Eng. 2021, 37, 112–120. [Google Scholar]
  25. Yao, J.; Wu, Z.; Liu, Y.; Zheng, X.; Zhang, H.; Dong, R.; Qiao, W. Predicting membrane fouling in a high solid AnMBR treating OFMSW leachate through a genetic algorithm and the optimization of a BP neural network model. J. Environ. Manag. 2022, 307, 114585. [Google Scholar] [CrossRef] [PubMed]
  26. Xu, S.; Wan, H.; Zhao, X.; Zhang, Y.; Yang, J.; Jin, W.; He, Y. Optimization of extraction and purification processes of six flavonoid components from Radix Astragali using BP neural network combined with particle swarm optimization and genetic algorithm. Ind. Crop. Prod. 2022, 178, 114556. [Google Scholar] [CrossRef]
Figure 1. Composition of the Yinghong No. 9 tea leaves moisture content detection system.
Applsci 13 01806 g001
Figure 2. Structural diagram of the Yinghong No. 9 tea leaves moisture content detection system: (a) dark room; (b) control room; (1) Camera; (2) Fan; (3) fingerprint recognition module; (4) buckle.
Applsci 13 01806 g002
Figure 3. Yinghong No. 9 tea leaves moisture content detection prototype: (1) Control room; (2) dark room.
Applsci 13 01806 g003
Figure 4. Flow chart of the Yinghong No. 9 tea leaves moisture content detection system.
Applsci 13 01806 g004
Figure 5. The Yinghong No. 9 tea leaves moisture content test platform: (1) Iron frame; (2) camera mount; (3) camera; (4) LED; (5) electronic scale.
Applsci 13 01806 g005
Figure 6. Relationship between the moisture content and image features: (a) Variation trend of the color features; (b) variation trend of the texture features.
Applsci 13 01806 g006
Figure 7. Structure diagram of the moisture content detection model for Yinghong No. 9 tea leaves.
Applsci 13 01806 g007
Figure 8. PCA-GA-BP model prediction scatter plot.
Applsci 13 01806 g008
Figure 9. PCA-PSO-BP model prediction scatter plot.
Applsci 13 01806 g009
Figure 10. LDA-PSO-BP model prediction scatter plot.
Applsci 13 01806 g010
Figure 11. Comparison between the improved BP neural network model and the other models in the validation data.
Applsci 13 01806 g011
Table 1. Main specifications of the camera.
Camera Parameter
Sensor TypeCMOS
Resolution5472 × 3648 ppi
Shutter FormRolling shutter
Dynamic Range65.5 dB
Sensor ModelSONY IMX183
Signal–Noise Ration41.5 dB
Camera Size2.4 × 2.4 μm
Data InterfaceUSB3.0
Table 2. Main parameters of the lens.
Lens Parameter
Focal Length12 mm
Close-up0.1 m
NumberF2.8–F16
Format1.1”
Optical Distortion−1.79%
Weight186 g
Table 3. Predictions from different models.
PreprocessingModelTraining SetTest Set
R2 (%)RMSE (%)MAE (%)R2 (%)RMSE (%)MAE (%)
GA-BP95.05861.23870.867794.01751.39670.9435
BP90.11351.76781.229089.62101.84581.2661
PSO-BP92.68101.51071.105891.95851.60701.1687
PCAGA-BP96.77691.03070.728196.40921.10210.7658
BP95.95451.14290.722294.66321.34740.8353
PSO-BP97.79520.83730.556597.61520.90060.6005
LDAGA-BP96.06201.23280.928394.42551.58371.1858
BP94.44181.19210.923193.63251.31121.0346
PSO-BP96.24841.01490.826495.30361.18610.9263
Table 4. Prediction results of the different models when the moisture content was greater than 64%.
ModelR2 (%)RMSE (%)MAE (%)
LDA-PSO-BP89.45661.14420.9116
PCA-GA-BP89.04261.16650.7761
PCA-PSO-BP93.78020.87890.5978
Table 5. Prediction results of the different models when the moisture content was less than 64%.
ModelR2 (%)RMSE (%)MAE (%)
LDA-PSO-BP79.17891.30030.9691
PCA-GA-BP90.26860.88890.7359
PCA-PSO-BP88.62410.96110.6084
Table 6. Improvements to the prediction effect of the BP neural network model and the other models.
ModelR2 (%)RMSE (%)MAE (%)
Improved BP neural network97.70940.88140.6332
SVR74.37392.63851.7806
PLS70.47682.84122.2902
Table 7. Validation metrics for the different models.
ModelR2 (%)RMSE (%)MAE (%)
Improved BP neural network94.10731.14900.9982
SVR65.92941.98181.8604
PLS42.17993.30232.7059
Disclaimer/Publisher’s Note: The statements, opinions and data contained in all publications are solely those of the individual author(s) and contributor(s) and not of MDPI and/or the editor(s). MDPI and/or the editor(s) disclaim responsibility for any injury to people or property resulting from any ideas, methods, instructions or products referred to in the content.