Article

Adopted Factorial and New In-Situ Micro-Designs for Stimulation of Matrix Acidizing of Carbonate Reservoir Rocks

1
Petroleum Engineering Department, Engineering Faculty, Soran University, Soran-Erbil 44008, Iraq
2
Chemical Engineering Department, Engineering Faculty, Soran University, Soran-Erbil 44008, Iraq
3
Res. Grp.-Biogeochemistry & Modelling of the Earth System, Université Libre de Bruxelles, 1050 Brussels, Belgium
*
Author to whom correspondence should be addressed.
Appl. Sci. 2023, 13(3), 1752; https://doi.org/10.3390/app13031752
Submission received: 1 January 2023 / Revised: 21 January 2023 / Accepted: 28 January 2023 / Published: 30 January 2023

Abstract

:
Matrix acidizing has been developed in the petroleum industry for improving petroleum well productivity and minimizing near-wellbore damage. Mud acid (HF: HCl) has gained attractiveness in improving the porosity and permeability of reservoir formation. However, there are several challenges facing the use of mud acid, comprising its corrosive nature, high pH value, formation of precipitates, high reaction rate and quick consumption. Therefore, different acids have been developed to solve these problems, including organic-HF or HCl acids. Some of these acid combinations proved their effectiveness in being alternatives to mud acid in reservoir rock acidizing. The current research deals with a new acid combination based on Hydrochloric–Oxalic acids for acidizing carbonate core samples recovered from Qamchuqa Formation in Kirkuk oilfield, northern Iraq. A new in-situ micro-model adopted laboratory technique is utilized to study the microscale alteration and evolution of pore spaces, dissolved grains and identification of matrix acidizing characteristics. The in-situ micro-model is based on the injection of an identical dose of different concentrations of the new acid combination into thin section samples under an optical light microscope. The adopted procedure aims to provide unique and rapid information regarding the potential for texture and porosity modification that can be caused by the acidizing stimulation procedure. In connection, solubility tests for the untreated and treated reservoir core samples and the density of the combined acids after treatment are conducted based on designed experiments using response surface methodology (RSM). The effect of acid concentration [12% HCl: Oxalic acid (3.8–8.8%)] and acidizing temperature (from ambient to 78.8 °C) on the solubility percentage of the samples and percentage increase in the combined acid density after acidizing were optimized and modeled. The obtained results confirm that the optimum dissolution of the core samples took place using 12% HCl:3.2% Oxalic acid with an optimum solubility (%) of the carbonate core rock of 53.78% at 21.7 °C, while the optimum increase in density (%) of the combined acids was 1.54% at 78.3 °C. The promising results could be employed for matrix acidizing of carbonate reservoir rocks for other oilfields.

1. Introduction

In the recent decade, the oil and gas sector underwent changes to expand its borders and boundaries in terms of technology and sustainable aspects. Innovative and feasible technology development in well stimulation became one of the first focuses in the oil field; it has become an attractive spot of current research [1,2,3]. The process includes acid injection into the bottom-hole well with a pressure below the formation fracture pressure. The technique stimulates reservoir formations by changing the rock properties, primarily porosity and permeability. The acids dissolve the sediments and mud solids within the pores that are inhibiting the permeability. This process creates more pore spaces and enlarges the natural micropores of the reservoir, which stimulates the flow of hydrocarbons, enhances the production of the well and reduces its skin by dissolving the plugging minerals in the production flow path and removing the formation damage near the wellbore [4,5]. Matrix acidizing is comparatively low cost compared to alternative stimulation methods such as hydraulic fracturing [4,6,7,8].
The acid treatment design is of top importance to a successful sedimentary rock acidizing treatment. However, it may cause many problems, including the release of fine-sized particles, generation of precipitates, formation of emulsions, generation of sludge and also corrosion of steel [7,9]. Different acids had been developed to stimulate depleted reservoir formation; these acids include the most popular mud acid [10], retarded acids [7], organic acids [11,12,13] and foamed acids [14]. Some additives are also incorporated in the acidizing treatment [11,12,13,14,15].
Conventional straight acids are commonly used in the treatment; however, they have highly corrosive properties, making them hazardous acids for health and safety controls. The high reactivity of the plain acid exposes the well tubular to significant corrosion risk besides leading to rapid spending of the acid. Thus, the reaction between the acid and minerals is difficult to control [10,16,17,18,19]. Therefore, it is critical to develop a new acid combination which can mitigate the issues caused by conventional mud acid, in particular at elevated temperatures [11,12,13,20,21].
The main goal of matrix acidizing is to raise the overall permeability of the formation. In heterogeneous formations where there is a contrast in the permeability of the rock, the acid tends to flow through the most permeable zones first and leaves the less permeable zones untreated. To solve this problem, diverters are used, such as viscoelastic surfactants to allow the acid to penetrate more uniformly [3].
On another hand, previous studies in the area of matrix acidizing have shown that optimizing the acid selection and targeting various temperatures of formation environment play vital roles in the process [22]. Hence, many laboratories’ research focuses on finding this optimal acid composition, which could be found from laboratory experiments by determining the pore volume of the tested cores.
The primary aim of this work is to obtain new knowledge on reservoir stimulation techniques in the aspect of matrix acidizing using different mineral–organic acid combinations for core samples of sedimentary rocks. The work is comprehensively and critically investigated experimentally. In addition, the concentration of combined acid formulation and treatment temperature are optimized and modeled. The optimum conditions at which the acids can be suitably applied, resulting in successful acid treatment, are established. The detailed optimization analysis and modeling will be carried out based on parametric study. The experiments include matrix acidizing lab experiments combined with analysis of the mineralogy and geochemistry (elemental composition) of the cores before and after treatment. Solubility and density tests will be also conducted.
The core samples are from the Qamchuqa Formation in the Kirkuk oilfield, northern Iraq (Figure 1). This formation was first defined by [23] at the Qamchuqa Gorge in NE Iraq. It is composed of thick-bedded limestones and strongly dolomitized limestones [24,25]. Several studies have been reported on the Upper Qamchuqa Formation, but mostly focused on the characteristics of reservoirs, while others used core plugs with wireline logging (porosity, gamma rays, resistivity) to measure the permeability, porosity and resistivity [26,27,28]. This study will add, for the first time, two different lines of sophisticated analyses: a new in-situ micro-model setup to draw microscale sizes of the porous media of the reservoir at Qamchuqa Formation and simulation of matrix acidizing in core samples. An adopted in-situ acid injection into thin sections of the carbonate rock samples under optical microscope at different acid concentrations and acidizing temperatures is carried out to observe and quantify the evolution of pore spaces as a function of the acidizing operating variables.

2. The Experimental Part

2.1. Methods and Materials

2.1.1. A New Experimental In-Situ Acidizing Micro-Model Setup

The core samples are from the Qamchuqa Formation in the Kirkuk oilfield, northern Iraq (Figure 1). This formation was first defined by [23] at the Qamchuqa Gorge in NE Iraq. It is composed of thick-bedded limestones and strongly dolomitized limestones [24,25].
The acidizing micro-model setup consists of prepared thin sections obtained from subsurface carbonate core samples, with a final thickness of polished core samples of around 3 µm. The thin section is attached to the stage of optical microscope (Olympus type) equipped with different lens sizes in order to monitor and image the micro-alteration on the 3 µm thick reservoir sample over different times (starting from t = 0) and under high-resolution optical microscope using both PPL and XPL view. A digital camera (Nikon MODEL) is linked between the laptop (data recording) and the microscope in order to image the influence of composite acidizing fluids on the thin section and to record the influence of these fluids on enhanced porous media. Several images were carried out under different lens sizes; later, these images were inserted into ImageJ software (version 1.53t, 2022) to estimate the micro-enhancement of the reservoir. The composite acidizing fluids were heated up to a planned temperature (up to 78.3 °C) using the hot plate stirrer, then the acid was injected into the thin surface of the reservoir formation with a digital micro-pipette to control the volume of the composite acidizing fluid. The monitoring process was observed starting from t = 0 until t = 30 min under the optical microscope in order to record the high-resolution changes over different times. The thin section under optical microscope was injected directly with a composite acid using micro-pipette.
The thin sections of the carbonate core samples were prepared at the standard 30 μm thickness for in-situ injecting through the carbonate core samples with a combined acid formulation in different temperatures. The images were analyzed directly under the optical microscope when the acid combination passed through micro-texture of core samples. The thin sections were petrographically studied under standard polarizing and reflecting microscopes before and after the in-situ acidizing injection to calculate the enhanced pore area percentage. The enhancement carbonate samples were observed under microscale sizes.

2.1.2. Experimental Macro-Design

Two-factorial central composite experimental design with 10 experiments was used to optimize and model the effect of Oxalic acid concentration in a combined acid formulation: 1:1 volume (%) [12% HCl: 3.8–8.8% H2C2O4] and temperature (from ambient to 78.8 °C) on solubility (%) of the carbonate rock samples and density of the combined acid solutions after acidizing treatment. The selection of temperature range represents the field environment. The recent data show the actual levels of the operating variable for the ten experiments and other additional experiments studied for the acidizing experiments (Table 1).
As a material, the carbonate core samples were recovered as plugs from Baba Dome Anticline at Kirkuk oilfield (Figure 1). The NW and SW limb terminations of Baba Dome lie on the Lesser Zab River and Tarjil village, respectively. The area covers 250 km2 with length and width of 52 km and 4–6 km, respectively [29]. In addition, Hydrochloric and Oxalic acids were purchased from Fluka Company and used as received.

2.1.3. Solubility Tests

To determine the optimal acid concentration and treatment temperature, solubility tests were conducted on the bulk core samples. The combined acid formulations were added to the bulk powder (10 g each). The powder samples were left for 6 h at the specified temperature. Then, the samples were cooled, filtered, dried at 70 °C for 24 h and weighed. Finally, the solubility is calculated using Equation (1):
Solubility = (Initial Weight−Final Weight)/Initial Weight × 100
The density of the acid combinations before and after acidizing treatment was measured to identify the change in properties of acid after treatment.

3. Results and Discussion

3.1. Experimental and ANOVA Results

Among all the acid types used for acidizing treatment, the most commonly used acids are inorganic ones, including Hydrochloric acid (HCl). This acid is widely used to enhance the permeability of carbonate formations [30]. In the current work, a combined acid formulation was used based on 12% HCl: Oxalic acid. According to our best knowledge, Oxalic acid has never been used in an acidizing treatment; therefore, the acid combination formulation is considered a new one. The reason behind the selection of Oxalic acid is its weak ionization and slow reaction. It causes less corrosion to the well equipment and allows for a longer reaction period. The concentration of Oxalic acid in the formulation ranges from 3.8–8.8%. Mixtures of equal volumes of the diluted acids were used based on the adopted experimental design.
The mineralogical composition of the rock formation has a significant effect on the rate of the acid–carbonate rock reaction. Carbonate reservoirs composed of limestones (CaCO3) and/or dolomites [CaMg (CO3)2] are able to dissolve in acids. The chemical reaction between carbonate rocks and the injected combined acid could be clarified by the following chemical equations:
Calcite: CaCO3 + 2HCl → CaCl2 + CO2 + H2O
CaCO3 + H2C2O4 = CaC2O4 + CO2 + H2O
Dolomite: CaMg (CO3)2 + 4HCl → CaCl2 + MgCl2 + 2CO2 + H2O
CaMg (CO3)2 + H2C2O4 → CaC2O4 + MgC2O4 + 2CO2 + H2O
The reaction of calcite with HCl (Ka value 1.3 × 10⁶) occurs with a rapid release of carbon dioxide gas, with bubbles of effervescence appearing when a single drop of the acid contacts the calcite surface. However, the reaction of HCl on dolomite generates only a subtle effervescence. This is because of the strong ionic bonds between calcium and magnesium cations and carbonate anions owing to the closer atomic packing within dolomite’s orthorhombic crystal lattice. On another hand, Oxalic acid is a relatively strong organic acid compared to other carboxylic acids (Ka value 5.4 × 10⁻²). It may be more environmentally acceptable relative to other acids such as HCl. It has been reported that Oxalic acid acts both as a depressant and pH modifier in treating the surface chemistry of calcite and dolomite, and other minerals of a similar nature [31]. The oxalate anion acts to fix Mg and Ca ions in solution through chelation throughout forming bridging chelates in two or more directions, owing to the abundant hydrogen bonds accepting sites [32].
The laboratory acidizing experimental results using constant concentrations of the combined acid (12% HCl: 4% Oxalic acid) and different acidizing temperatures are illustrated in Figure 2 and Figure 3. The results indicate that the solubility (%) increases with an increasing temperature up to 40 °C, then decreases steadily (Figure 2). This solubility increase may be attributed to an increase in the acid ionization rate with temperature increase, and so its dissolving power will increase leading to high reaction and easier dissolution of the lithology. The increase in chelation of the released Mg and Ca ions with Oxalic ions at higher temperatures (above 40 °C) and adsorption of the chelates on the rock surface may be behind the inhibition of further dissolution of the minerals in the acid solution at higher temperatures.
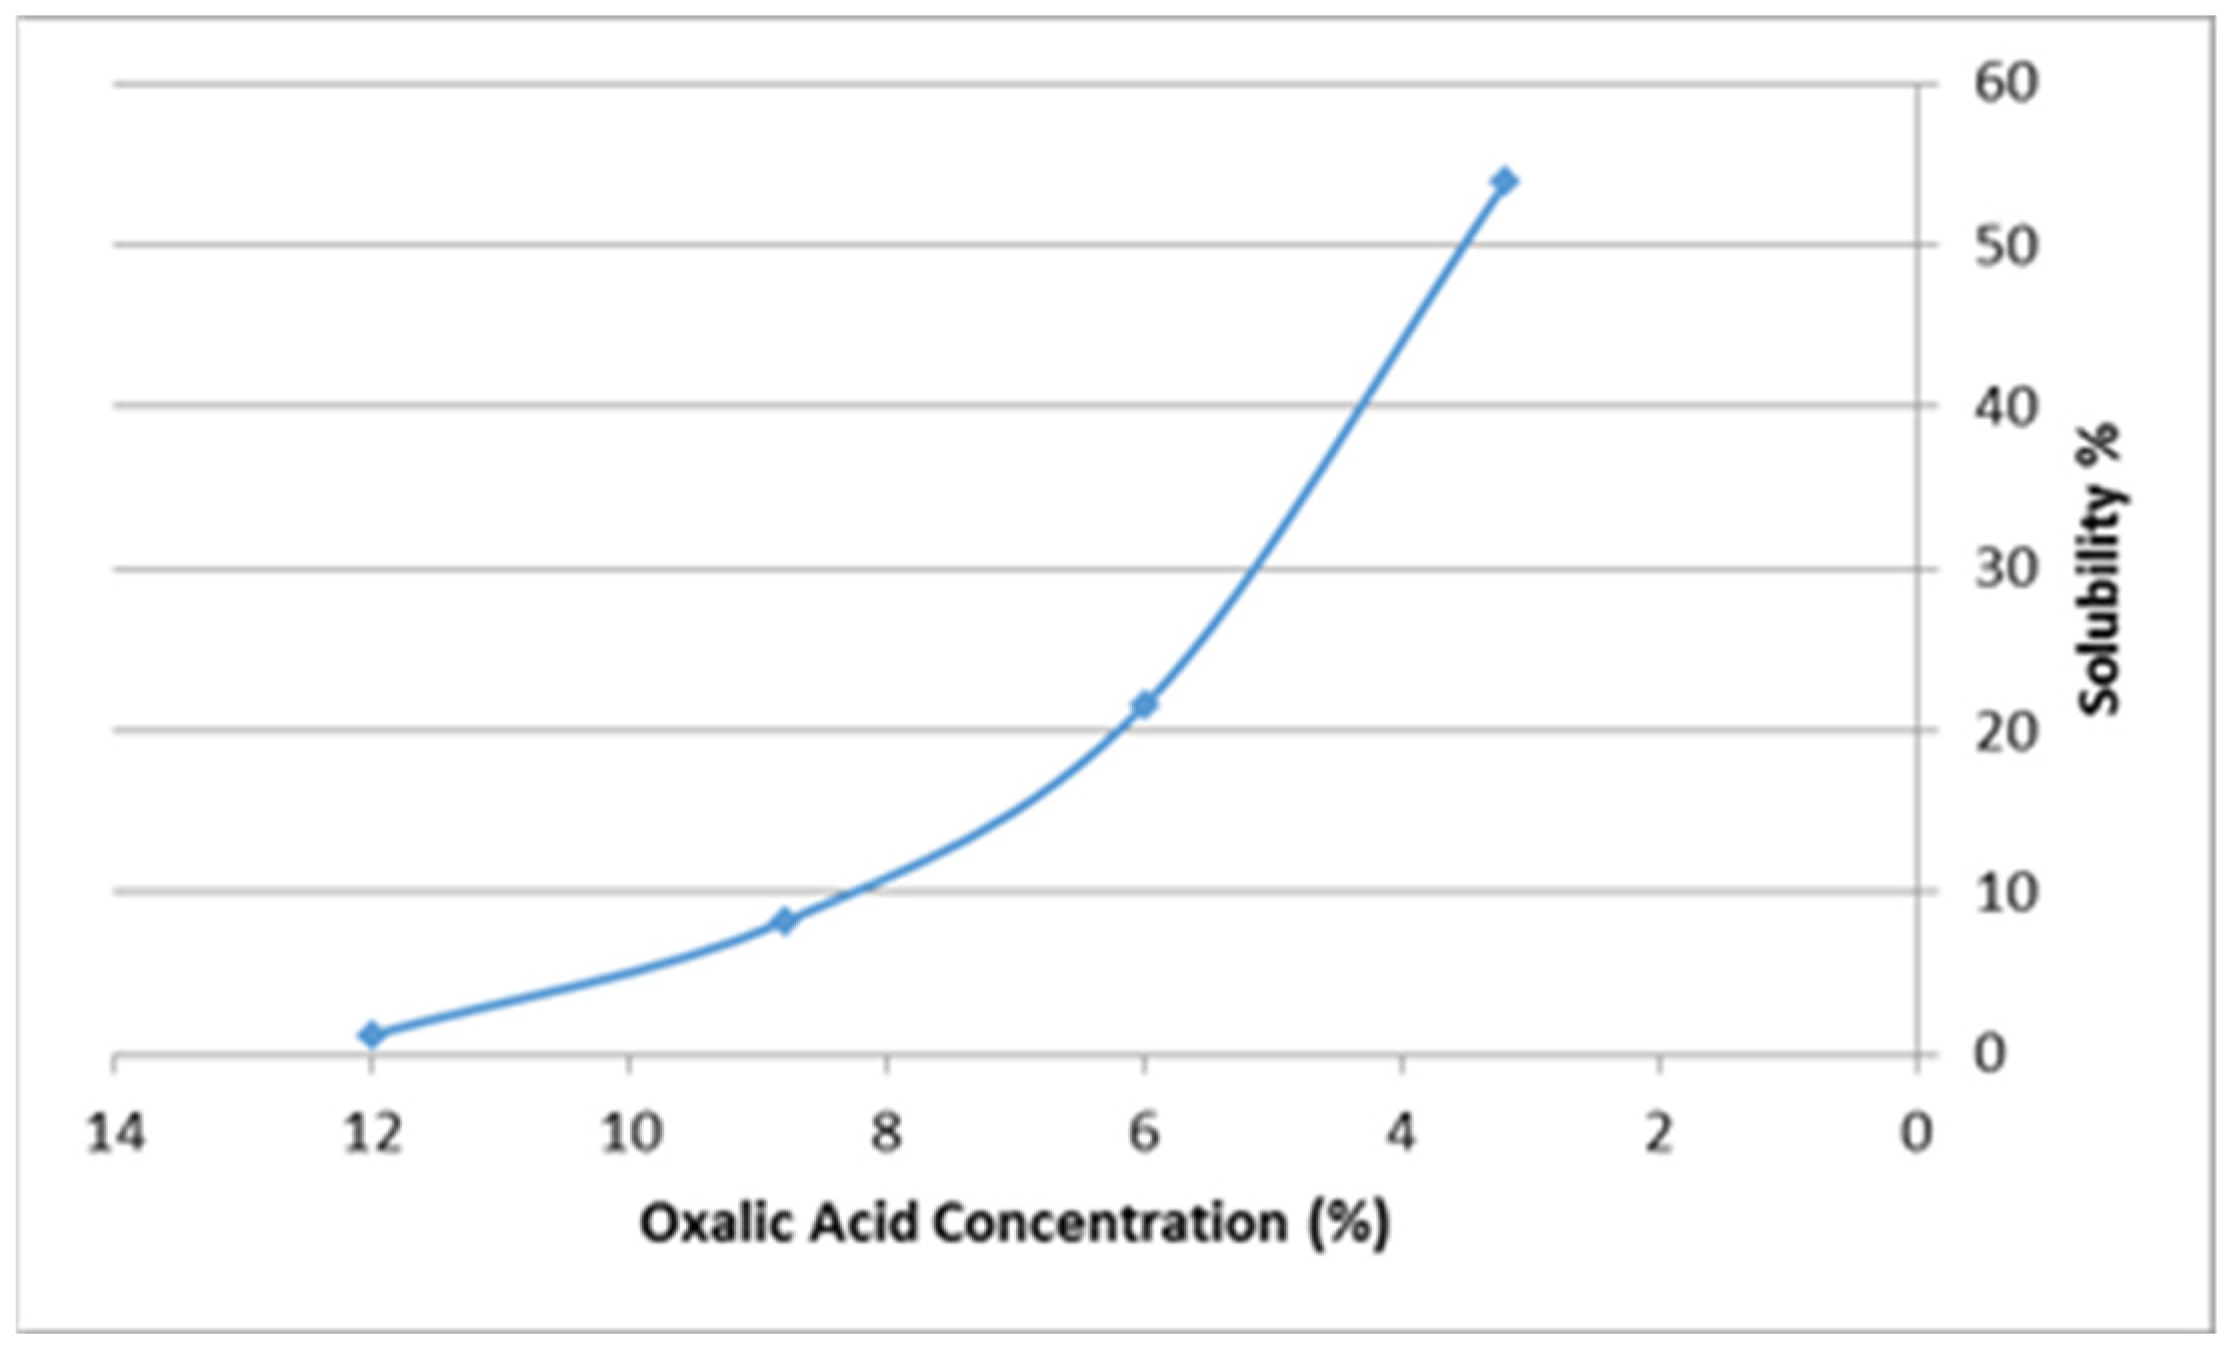
The above phenomenon may be clarified in Figure 3, which shows that increasing the concentration of Oxalic acid from 3.2% to 12% resulted in decrease in the solubility (%) of the rock samples. The situation may be attributed to increasing the formation of the chelates with increasing the concentration of oxalate ions. The chelating compounds could potentially precipitate on the particle surfaces and thus inhibit dissolution.
The optimization and modeling were performed based on what was elucidated in Section 2.1.2 Experimental macro-design. The plots in regard are illustrated in Figure 4 and Figure 5. Ten matrix acidizing experiments were run based on the central composite experimental design depicted in Table 1. The solubility of the samples and the % increase in the density of the acid after each experiment were determined. The numerical values of solubility % and % increase in density of the combined acid after the acidizing process were analyzed by ANOVA (Analysis of Variance) by the software (Portable statgraphics centrion, 15.2.11.0.exe).
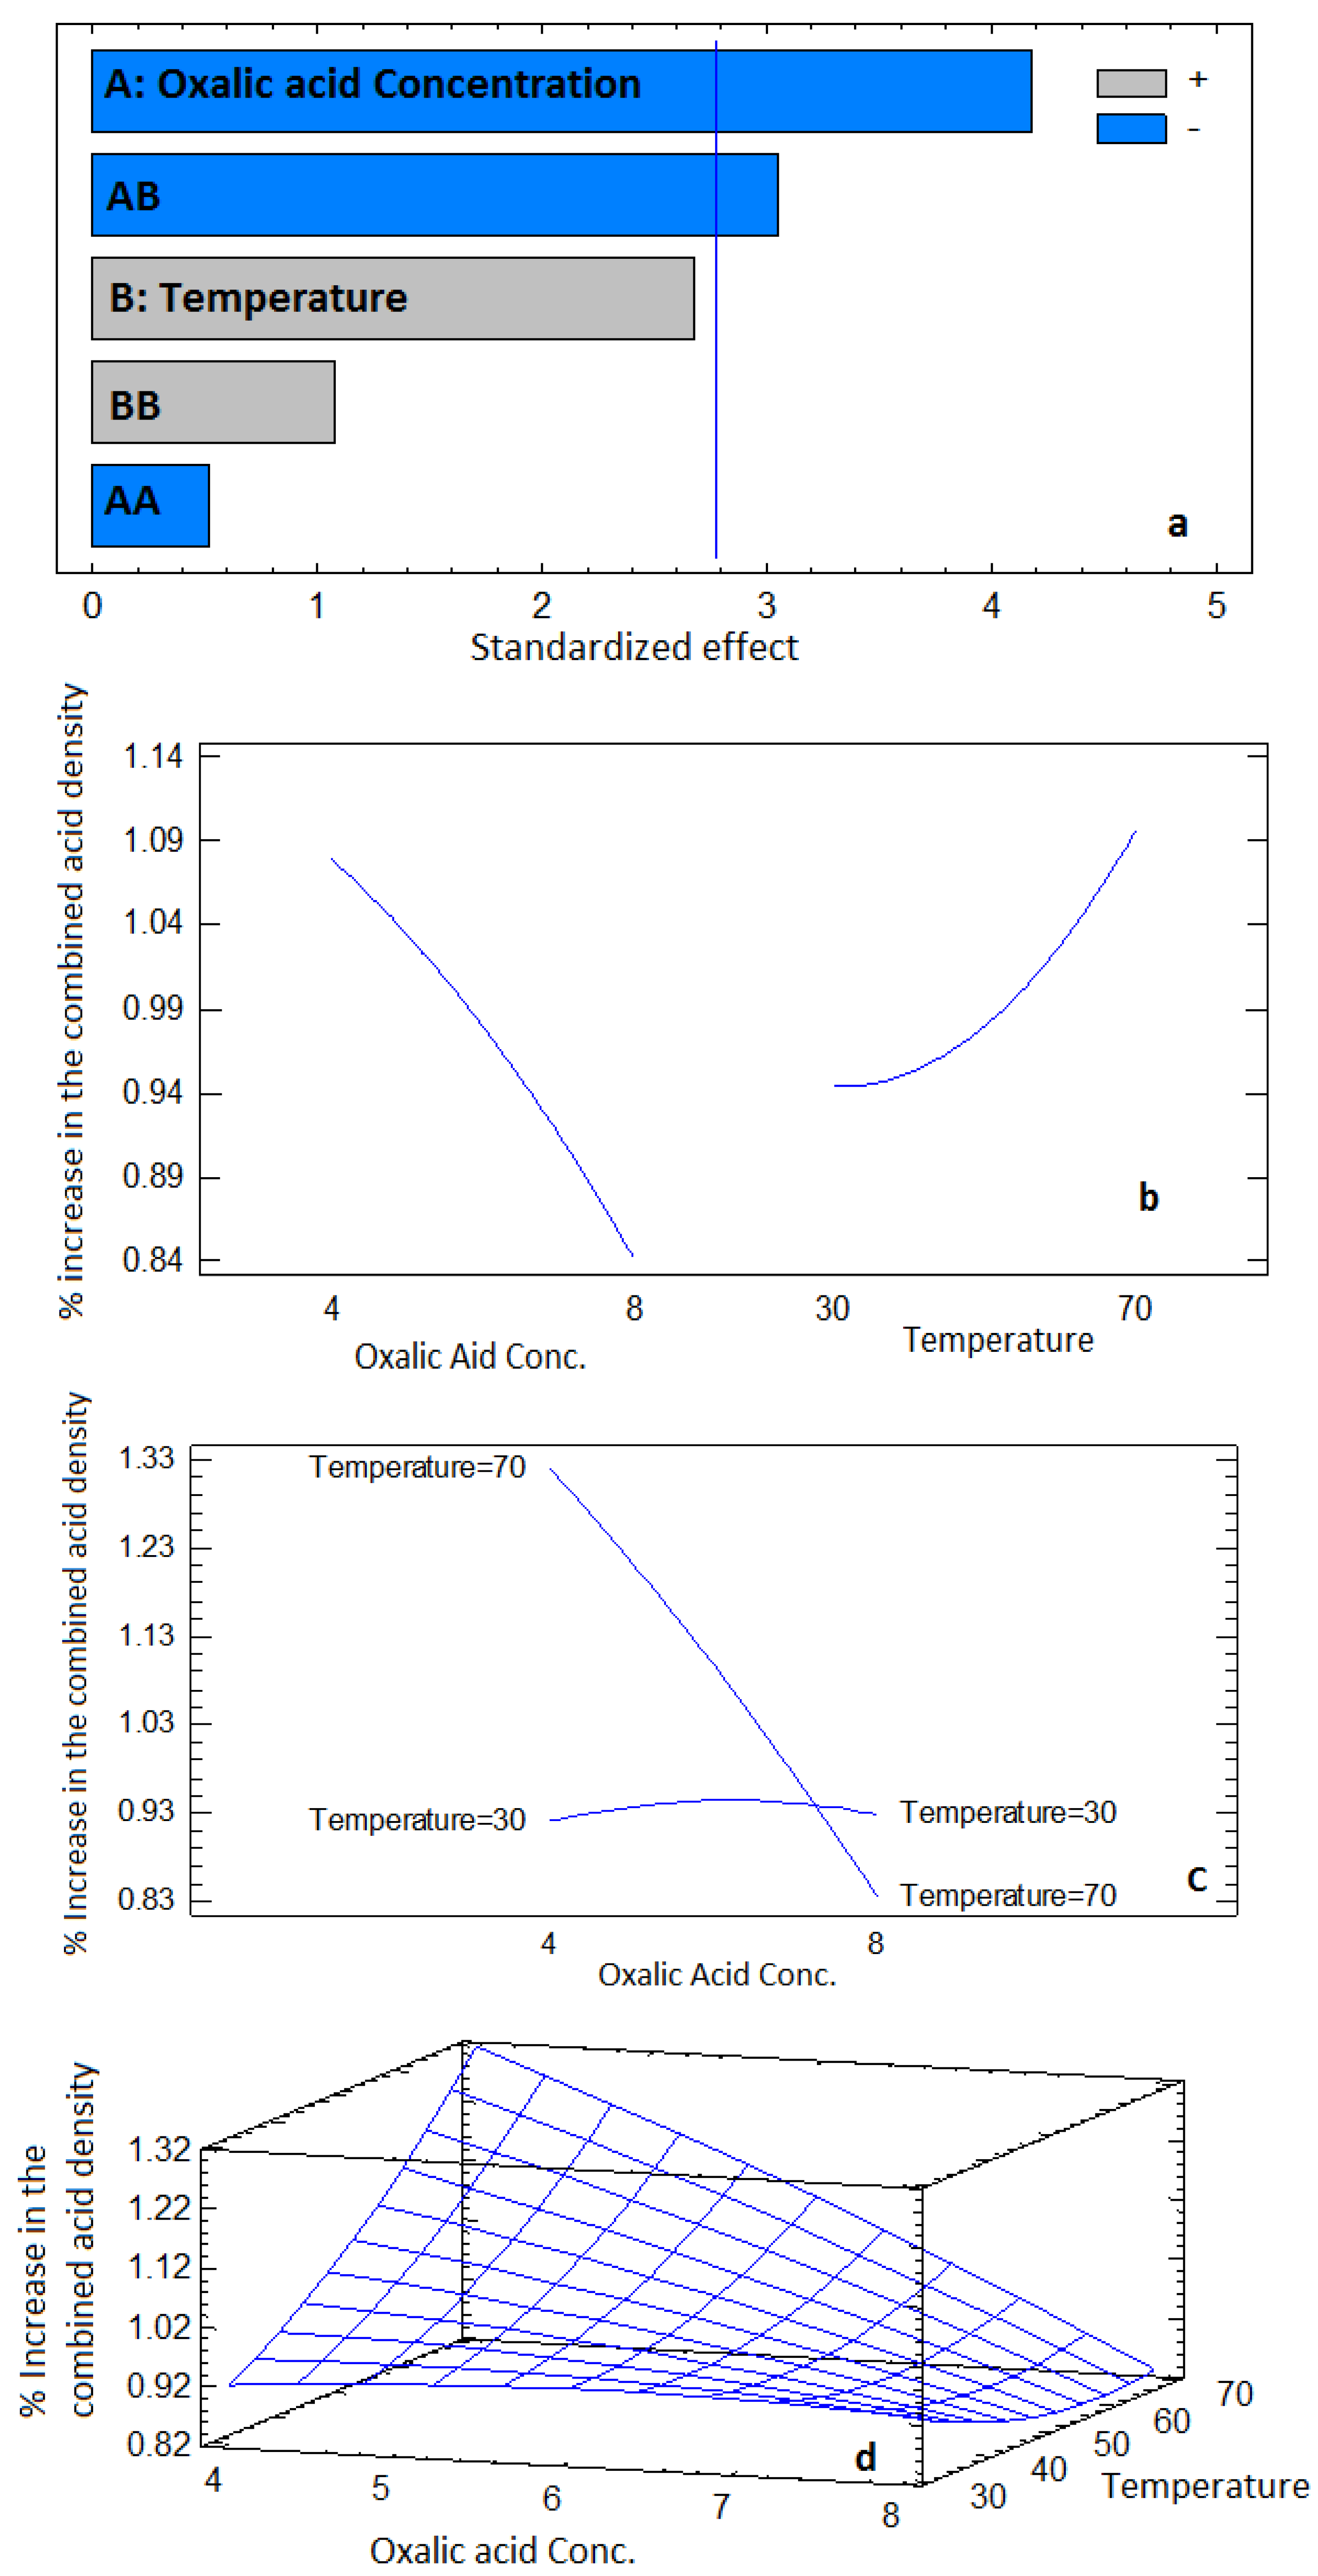
The ANOVA results for solubility (%) of the carbonate rock samples and percentage increase in density of the combined acid solution after the acidizing process are shown in Figure 4 and Figure 5, respectively. All the plots in Figure 4 and Figure 5, the polynomial equations, the optimum solubility % and the % increase in the combined acid density are the output of analysis by the software. The Pareto charts (Figure 4a,b) display the absolute value (magnitude and the importance of the standardized effects of the operating variables represented by bars). If a bar crosses the reference line, it reflects that the effect of the factor is statistically significant at the 0.05 level. The Pareto chart (Figure 4a) shows that the Oxalic acid concentration has a significant effect on solubility (%), while temperature is statistically of less significance. The negative sign of the effect reflects that the solubility (%) decreases with increase in Oxalic acid concentration, while the positive sign of the effect of temperature revealed that solubility (%) increases with temperature increase. The situation is supported by the plots of the standardized effects (Figure 4b). On the other hand, Figure 4c shows that there is an interaction between the two factors reflected by the non-parallel and the crossing of the factor effects. The interaction is obvious at a high concentration of Oxalic acid and high temperatures. Figure 4d shows the three-dimensional response surface plots that illustrate the effect of Oxalic acid concentration and temperature, and their mutual interaction.
Similar trends are shown in Figure 5 for the effects of the Oxalic acid concentration and temperature on density of the combined acids after the acidizing process. However, the temperature impact was more effective on the acid density increase compared to its effect on solubility (%). The increase in acid density is due to dissolution of the carbonate in the acid.
The mathematical models estimated from ANOVA for solubility (%) and (%) increase in density of the combined acids after acidizing were estimated with high regression coefficients R2 78.52% and 90.06, respectively. Response surface methodology using ANOVA can be useful for better data evaluation and model development [33]. The high values of regression coefficients confirmed the accuracy of the models and their high capability to explain the experimental results. The estimated empirical polynomial regression model equations (second order) are represented in Equations (6) and (7):
Solubility (%) = 117.21 − 19.98A − 0.66T + 0.71A2 + 0.095AT + 0.0014T2
(%) Increase in acid density = 0.306 + 0.15A + 0.012T − 0.0045A2 − 0.0031AT + 0.0001T2
where A is the Oxalic acid concentration (%) and T is the temperature of the acidizing process.
An optimum solubility (%) of the carbonate core rock (53.78%) was estimated at optimum conditions of 3.17% Oxalic acid and 21.7 °C, while an optimum increase in density (%) of the combined acids (1.54%) was estimated at 3.17% Oxalic acid and 78.3 °C.

3.2. In-Situ Acidizing Micro-Model and Acid–Rock Interaction

Several workers have studied the reservoir characterization to understand the surface alteration of heterogeneity of carbonate rock through different kinds of parameter, e.g., porosity and permeability. To study these alterations, workers have been utilizing different kinds of application, including well log data, such as gamma ray, sonic, neutron and bulk density data; litho-log with a set of subsurface logs; numerical measurement of porosity and permeability from large-scale core samples as widespread conventional ways of understanding the complex subsurface settings of carbonate rocks. However, to draw a better model for subsurface rocks, a microscale study of these rocks is required through high-resolution tools and the observation of fluid–rock interactions. In general, fluid–rock interactions have been studied intensively in a wide range of experiments and considered essential in the following: subsurface applications, oil migration associated with hot fluids, enhanced oil recovery and enhanced porosity–permeability properties in shallow and subsurface conditions ([34,35,36]). Therefore, this study focuses on acid–rock interactions utilizing the new in-situ micro-model setup. The in-situ micro-model design gives us a high-resolution tool and shows a microscale alteration on the surface of reservoir core samples obtained from subsurface carbonate rocks. A moderate-to-high acid–rock interaction within a considerable size of dolomite and calcite crystals was observed under optical microscope. The petrographic fabric of dolomite is mostly euhedral, in places with euhedral crystals, fine-to-coarse crystalline-sized in a tight carbonate rock, while limestone is smaller in size, with an anhedral crystal shape, less compacted than dolomite fabric, having more pore spaces than in the dolomite lithology. To understand the phenomena of enhancing the porous media by matrix acidizing, combined acids of different formulations (12% HCl: 3.2–12% Oxalic acid) at different temperatures (starting from ambient temperature until 78.8 °C) were injected into micrometer-sized reservoir carbonate core samples under high-resolution micro-design, where thin sections were observed and recorded continuously under optical microscope to measure the rate of alteration of lithology of carbonate rocks. When the acid was injected into the thin section, the interaction rate seemed to change differently according to the acidizing operating conditions (acid concentration and acidizing temperature). During the micro-injection, the most significant alteration and interactions observed were dissolution, precipitation and replacement processes. These processes during the acid injection are strongly effective leading to intensive increase in solubility and dissolution of carbonate crystals, thus enhancing the porous media of the samples from the Qamchuqa Formation reservoir.
Additionally, the precipitation/re-precipitation and accumulation of new crystals in places were observed and probably influence the porous media enhancement and occlusion of pore spaces. The dissolution and replacement processes of carbonate reservoir rocks during acid interaction could be varied according to the rate of elemental/mineral exchange of carbonate composition and other secondary compositional associations. Therefore, the fluid–rock interaction rate was more intensive with calcite compared to dolomite crystals and shows a remarkable dissolution at various ranges of microscale under optical observation. ImageJ software allowed us to observe the high resolution of the lithological alteration and improved porous media (Figure 6a,b).
Nonetheless, the diversity in dissolution is also related to impurities of calcite and dolomite crystals within their lattice [37]. In addition, the elemental and mineralogical exchange is also observed under the micro-model (Figure 6 and Figure 7). During the injection under different temperature conditions, the initial porous media was filled by another mineral phase after acid injection; this probably indicated a new precipitation phase that would positively impact the damage of reservoir rock owing to the injection of the combined acid. Figure 7a,b show the change of pore area before and after 15 min of the acidizing process, respectively. Figure 7c illustrates the pore area calculated values based on the outline of each pore area for the enhanced porous media as a result of the matrix acidizing.
On another hand, the effect of acidizing temperature was investigated by injecting the thin sections with identical concentrations of the combined acid in-situ using the micro-model design. Figure 8 shows the variation of the increase in pore area % as a function of acidizing temperature (from ambient to 50 °C) resulting from injection of the optimum concentration of the combined acids (12% HCl: 3.2% Oxalic acid). The results were estimated from RSM analysis after an acidizing of 15 min. Using this acid combination, the fluid–rock interaction enhanced the pore system to 31.52% pore area when acidizing temperature increases from ambient to 50 °C.
An interesting correlation is also highlighted in this study with a relatively high regression coefficient of 91.39%. The estimated mathematical model is shown in Equation (8).
Y = 0.5926x + 38.514
where Y is the increase in pore area (%) and x is the acidizing temperature (°C).

4. Conclusions

The conclusions which could be drawn from the current work reveal that a successful matrix acidizing processes for carbonate reservoir core samples recovered from the Qamchuqa Formation in the Kirkuk oilfield, northern Iraq, could be performed using a new combined acid formulation based on (HCl: Oxalic acid). The samples show optimum performance using 12% HCl:3.2% Oxalic acid based on analyzing the rock samples treated through different experiments designed by RSM. The dissolution of the samples and the % increase in acid density after acidizing seemed to increase with increasing acidizing temperature. A newly adopted laboratory technique (in-situ micro-model) was employed to study the features of matrix acidizing, as well as identification and evolution of pore spaces based on optical microscopy and petrographic observations from thin sections of the carbonate core samples, which are in-situ injected by the combined acids. The adopted procedure can provide high-resolution and rapid information on porosity enhancement detected by visual observations, and later using ImageJ software to observe the microscale-sized alterations on the surface of thirty-micrometer-thick targeted core samples, and calculations of the enhanced pore area after acidizing at different temperatures which simulate the real temperature of the field environment.

Author Contributions

Author Contributions: Writing and preparation the original draft, N.S., I.K. and A.A.; Review and editing, N.S., I.K. and A.P., Methodology and software, N.S., I.K. and A.A.; Supervision, N.S., I.K. and A.P.; Project administration, N.S. and I.K.; Funding acquisition, A.P. All authors have read and agreed to the published version of the manuscript.

Funding

The study benefited from research funds of the Université Libre de Bruxelles (ULB)-Belgium.

Institutional Review Board Statement

Not applicable.

Informed Consent Statement

Not applicable.

Data Availability Statement

Not applicable.

Conflicts of Interest

The authors declare no conflict of interest.

Nomenclature

ANOVAAnalyses of variance
RSMResponse surface methodology
XAcidizing temperature
YPore area (%)

References

  1. Shafiq, M.U.; Ben Mahmud, H. Sandstone matrix acidizing knowledge and future development. J. Pet. Explor. Prod. Technol. 2017, 7, 1205–1216. [Google Scholar] [CrossRef] [Green Version]
  2. Khormali, A.; Sharifov, A.R.; Torba, D.I. The control of asphaltene precipitation in oil wells. Pet. Sci. Technol. 2018, 36, 443–449. [Google Scholar] [CrossRef]
  3. Chacon, O.G.; Pournik, M. Matrix Acidizing in Carbonate Formations. Processes 2022, 10, 174. [Google Scholar] [CrossRef]
  4. Robertson, J.O., Jr.; Chilingarian, G.V. Acidizing Oilwells. In Developments in Petroleum Science; Elsevier: Amsterdam, The Netherlands, 1989; Volume 19, pp. 161–190. [Google Scholar]
  5. Economides, M.J.; Hill, A.D.; Ehlig-Economides, C.; Zhu, D. Petroleum Production Systems; Pearson Education: New York, NY, USA, 2012. [Google Scholar]
  6. Muecke, T.W. Principles of Acid Stimulation. Presented at the International Petroleum Exhibition and Technical Symposium, Beijing, China, 17–24 March 1982; OnePetro: Richardson, TX, USA, 1982. [Google Scholar] [CrossRef]
  7. Chang, F.F.; Nasr-El-Din, H.A.; Lindvig, T.; Qiu, X.W. Matrix Acidizing of Carbonate Reservoirs Using Organic Acids and Mixture of HCl and Organic Acids. Presented at the SPE Annual Technical Conference and Exhibition, Denver, CO, USA, 21–24 September 2008; OnePetro: Richardson, TX, USA, 2008. [Google Scholar] [CrossRef]
  8. Leong, V.H.; Ben Mahmud, H. A preliminary screening and characterization of suitable acids for sandstone matrix acidizing technique: A comprehensive review. J. Pet. Explor. Prod. Technol. 2018, 9, 753–778. [Google Scholar] [CrossRef] [Green Version]
  9. Lake, L.W.; Clegg, J.D. Petroleum Engineering Handbook; Society of Petroleum Engineers: Richardson, TX, USA, 2007; Volume IV. [Google Scholar]
  10. Zhu, D.; Hill, D.; Ugursal, A.; Shuchart, C.; Purdy, C.; Weissenberger, M.; Uribe, J. A modified acid system to enhance carbonate matrix acid stimulation: An experimental study. Can. J. Chem. Eng. 2021, 100, 1187–1201. [Google Scholar] [CrossRef]
  11. Fredd, C.N.; Fogler, H.S. Alternative Stimulation Fluids and Their Impact on Carbonate Acidizing. SPE J. 1998, 3, 34–41. [Google Scholar] [CrossRef]
  12. Tambini, M. Beyond Acidizing and Fracturing. Presented at the SPE European Formation Damage Conference, The Hague, The Netherlands, 13–14 May 2003; OnePetro: Richardson, TX, USA, 2003. [Google Scholar] [CrossRef]
  13. Houseworth, J. Advanced Well Stimulation Technologies. In Chapter, 2013, Volume 2, pp. 47–88. Available online: http://www.t.ccst.us/publications/2014/2014wst2.pdf (accessed on 30 July 2016).
  14. Kartini, R.; Kim, Y.; Lee, W. Evaluation of Surfactant Mixture for Supercritical Carbon Dioxide Foamed Acid in Car-bonate Matrix Acidizing. Energies 2021, 14, 6567. [Google Scholar] [CrossRef]
  15. Frenier, W.W.; Hill, D.G. Effect of acidizing additives on formation permeability during matrix treatments. Presented at the International Symposium and Exhibition on Formation Damage Control, Lafayette, LA, USA, 20–21 February 2002; OnePetro: Richardson, TX, USA, 2002. [Google Scholar]
  16. King, G.E. Acidizing Concepts Matrix vs. Fracture Acidizing. J. Pet. Technol. 1986, 38, 507–508. [Google Scholar] [CrossRef]
  17. Shokry, A.F.; Tawfik, O.M. Acid Stimulation Results of Arab Carbonate Reservoirs in Offshore Field, U.A.E.: 10 Years of Review, How to Prepare the Future Challenges Linked to Stimulation. Presented at the Abu Dhabi International Petroleum Exhibition and Conference, Abu Dhabi, United Arab Emirates, 1–4 November 2010; OnePetro: Richardson, TX, USA, 2010. [Google Scholar] [CrossRef]
  18. Garrouch, A.A.; Jennings, A.R. A contemporary approach to carbonate matrix acidizing. J. Pet. Sci. Eng. 2017, 158, 129–143. [Google Scholar] [CrossRef]
  19. Reyes, E.A.; Smith, A.L.; Beuterbaugh, A.; Calabrese, T. GLDA/HF facilitates high temperature acidizing and coiled tubing corrosion inhibition. In Proceedings of the SPE European Formation Damage Conference and Exhibition, Budapest, Hungary, 3–5 June 2015. [Google Scholar]
  20. Hendrickson, A.R.; Thomas, R.L.; Economides, M.J. Stimulation of carbonate reservoirs. Dev. Pet. Sci. 1992, 30, 589–625. [Google Scholar] [CrossRef]
  21. Ortega, A. Acidizing High-Temperature Carbonate Formations Using Methanesulfonic Acid. Ph.D. Thesis, Texas A & M University, College Station, TX, USA, 2015. Available online: https://hdl.handle.net/1969.1/155026 (accessed on 25 March 2015).
  22. Al Rbeawi, S.; Kadhim, F.S.; Farman, G.M. Optimum matrix acidizing: How much does it impact the productivity. IOP Conf. Ser. Mater. Sci. Eng. 2018, 454, 012105. [Google Scholar] [CrossRef]
  23. Bellen, R.C.; Dunnington, H.V.; Wetzel, R.; Morton, D.M. Lexique Stratigraphique International; Centre National de la Recherche Scientifique: Paris, France, 1959; Volume 3, p. 333. [Google Scholar]
  24. Jassim, S.Z.; Goff, J.C. (Eds.) Geology of Iraq; Dolin, Prague and Moravian Museum: Brno, Czech Republic, 2006; p. 355. [Google Scholar]
  25. Salih, N.M. Scanning the Lower Cretaceous carbonate rocks utilizing stable isotopes and petrographic records. J. Earth Sci. Environ. Stud. 2022, 6, 148–163. [Google Scholar]
  26. Al-Peryadi, K. Sedimentological Study and Reservoir Characterizations for the Upper Qamchuqa and Jawan formations to Determine the Effective Porosity in Bai-Hassan Field. Unpublished Master’s Thesis, University of Baghdad, Baghdad, Iraq, 2002; p. 178. [Google Scholar]
  27. Al-Qayim, B.; Qadir, F.M.; Albeyati, F. Dolomitization and porosity evaluation of the Cretaceous Upper Qamchuqa (Mauddud) Formation, Khabbaz oil field, Kirkuk area, northern Iraq. Geoarabia 2010, 15, 49–76. [Google Scholar] [CrossRef]
  28. Ghafur, A.A.; Hasan, D.A. Petrophysical Properties of the Upper Qamchuqa Carbonate Reservoir through Well Log Evaluation in the Iraqi Khabbaz Oilfield. UKH J. Sci. Eng. 2017, 1, 72–88. [Google Scholar] [CrossRef]
  29. Deikran, D.B.; AL-Lehaibe, A.M. Study of Joints in Baba Dome-NE Iraq. Kirkuk Univ. J.-Sci. Stud. 2016, 11, 26–37. [Google Scholar]
  30. Abdulraheem, A. Impact of HCl Acidizing Treatment on Mechanical Integrity of Carbonaceous Shale. ACS Omega 2022, 7, 13629–13643. [Google Scholar] [CrossRef]
  31. Chelgani, S.C.; Hart, B. Explaining surface interactions for common associated gangues of rare earth minerals in response to the oxalic acid. Int. J. Min. Sci. Technol. 2018, 28, 343–346. [Google Scholar] [CrossRef]
  32. Dazem, C.L.; Noa, F.M.; Nenwa, J.; Öhrström, L. Natural and synthetic metal oxalates—A topology approach. CrystEngComm 2019, 21, 6156–6164. [Google Scholar] [CrossRef]
  33. Ahmadi, S.; Khormali, A.; Khoutoriansky, F.M. Optimization of the demulsification of water-in-heavy crude oil emulsions using response surface methodology. Fuel 2022, 323, 124270. [Google Scholar] [CrossRef]
  34. Salih, N.; Mansurbeg, H.; Préat, A. Geochemical and dynamic model of repeated hydrothermal injections in two Mesozoic successions, Provencal Domain, Maritime Alps, SE-France. Minerals 2020, 10, 775. [Google Scholar] [CrossRef]
  35. Salih, N.; Mansurbeg, H.; Muchez, P.; Gerdes, A.; Préat, A. Hydrothermal Fluids and Cold Meteoric Waters along Tectonic-Controlled Open Spaces in Upper Cretaceous Carbonate Rocks, NE-Iraq: Scanning Data from In Situ U-Pb Geochronology and Microthermometry. Water 2021, 13, 3559. [Google Scholar] [CrossRef]
  36. Isah, A.; Arif, M.; Hassan, A.; Mahmoud, M.; Iglauer, S. Fluid–rock interactions and its implications on EOR: Critical analysis, experimental techniques and knowledge gaps. Energy Rep. 2022, 8, 6355–6395. [Google Scholar] [CrossRef]
  37. Salih, N.; Mansurbeg, H.; Kolo, K.; Gerdes, A.; Préat, A. In situ U-Pb dating of hydrothermal diagenesis in tectonically controlled fracturing in the Upper Cretaceous Bekhme Formation, Kurdistan Region-Iraq. Int. Geol. Rev. 2019, 62, 2261–2279. [Google Scholar] [CrossRef]
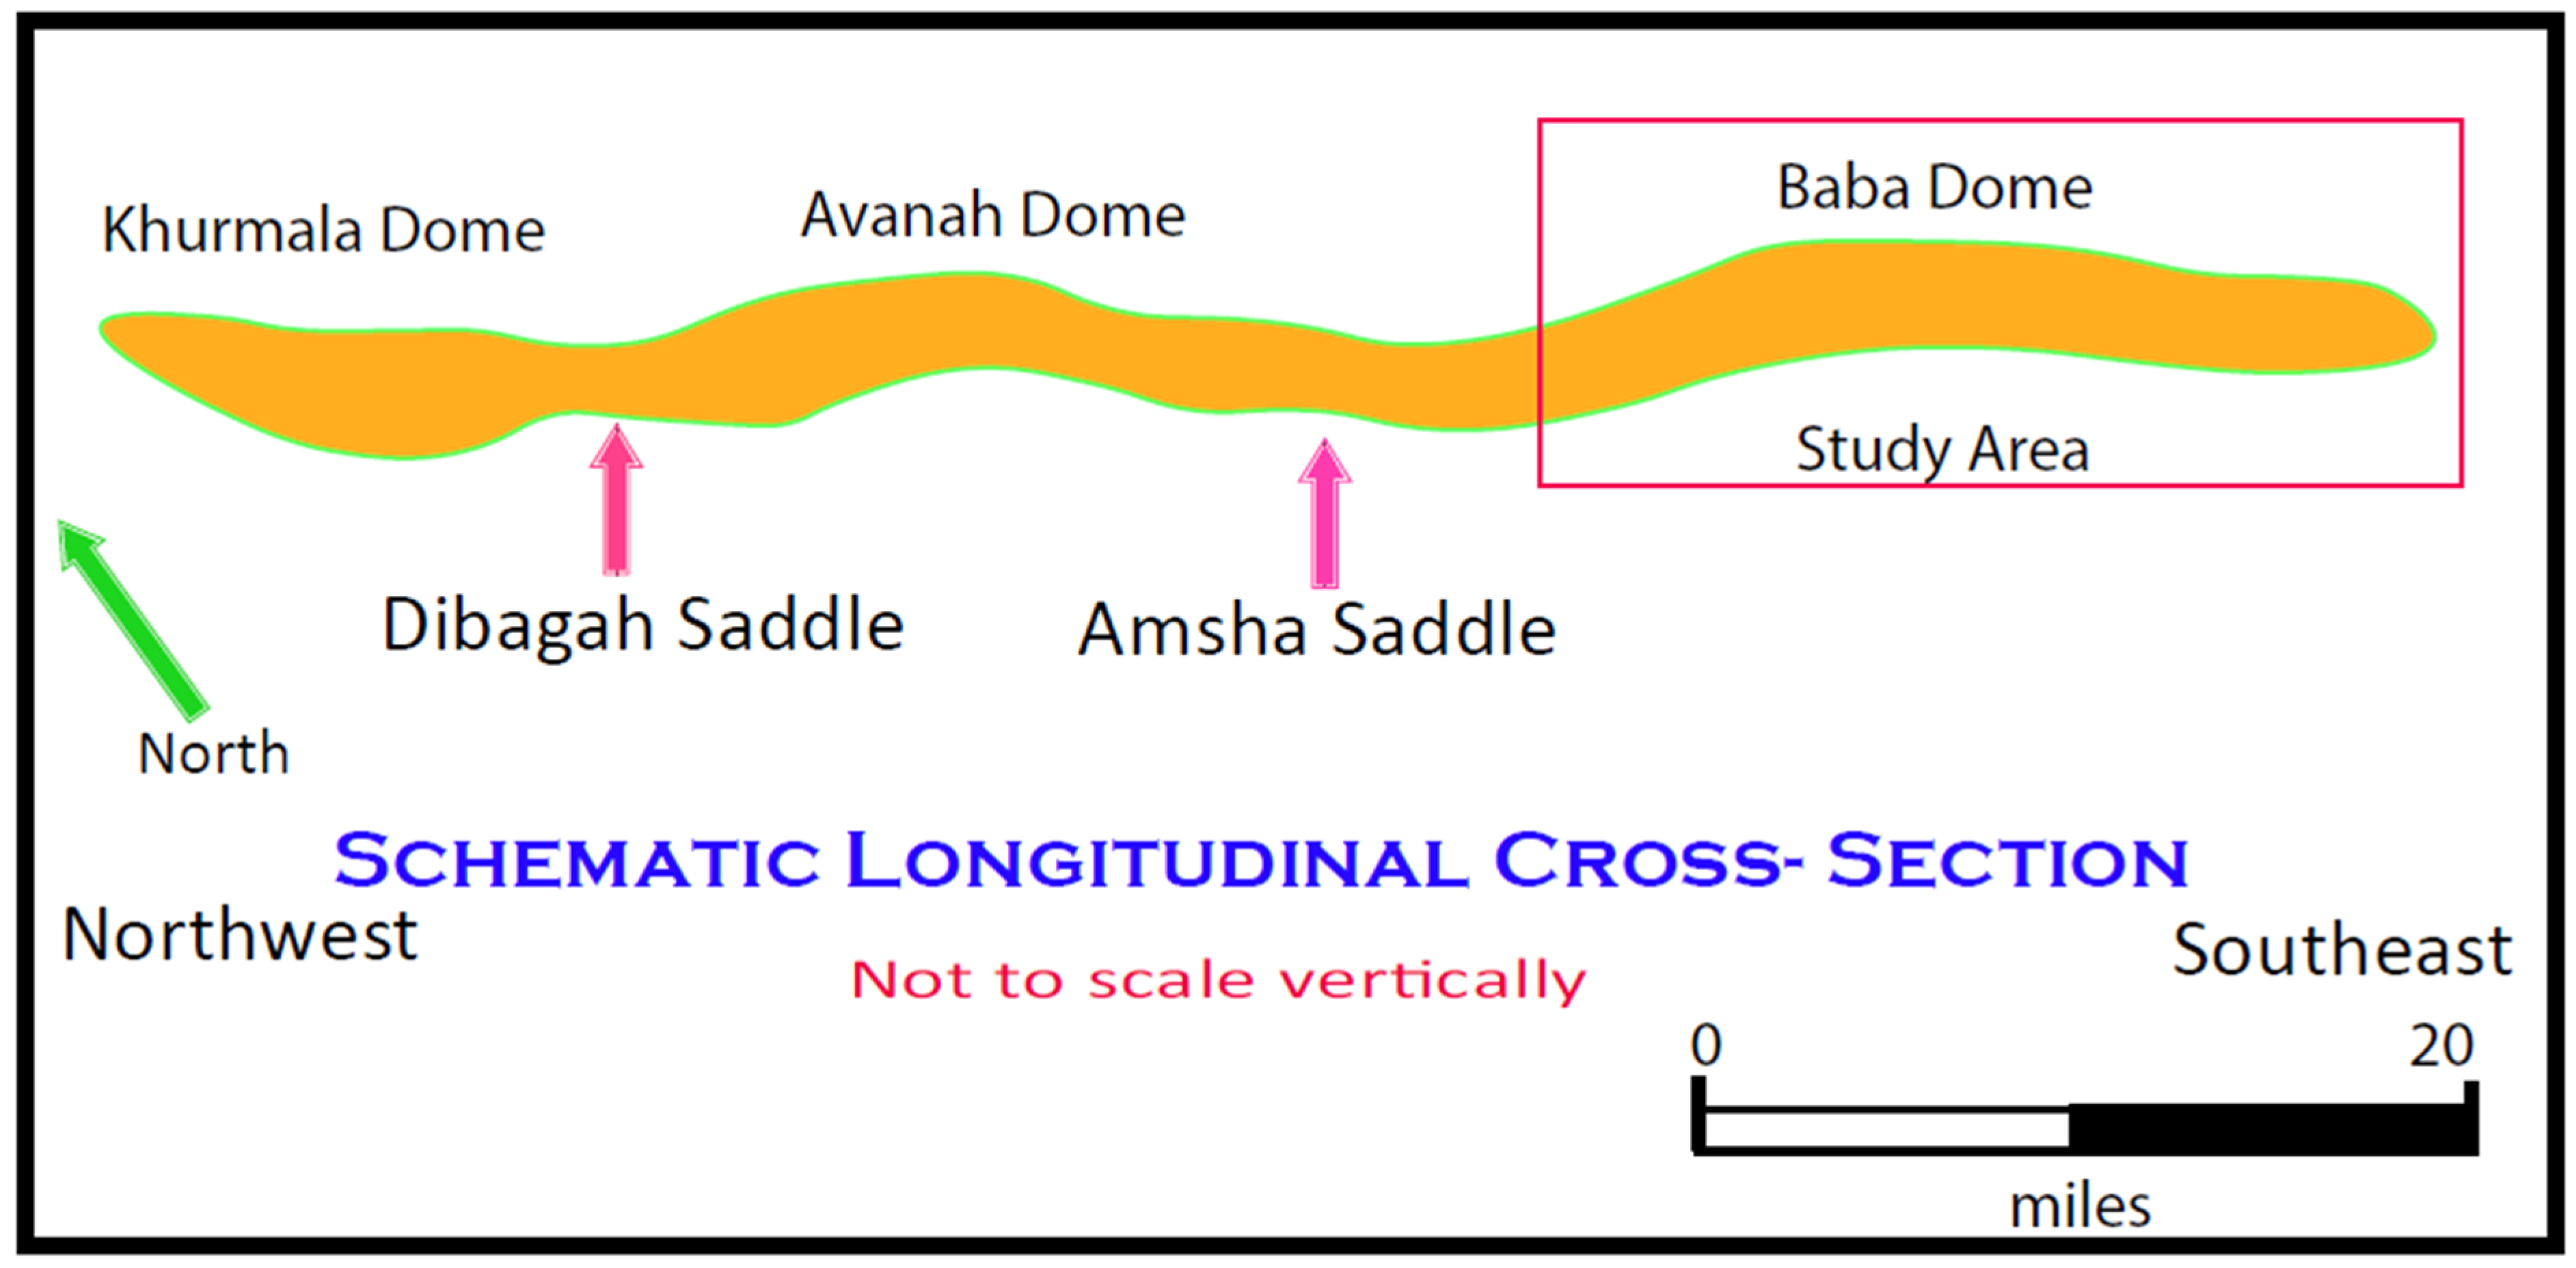
Figure 1. Schematic longitudinal cross-section of the Kirkuk structure (after Dunnington, 1958) including the area from which the samples are recovered.
Applsci 13 01752 g001
Figure 2. Solubility (%) versus temperature (with concentration of Oxalic acid 4%).
Applsci 13 01752 g002
Figure 3. Solubility (%) versus % Oxalic acid at 50 °C.
Applsci 13 01752 g003
Figure 4. Pareto chart (a), standardized effects plot (b), interaction plots (c), for solubility (%), (d) 3D response surface.
Applsci 13 01752 g004aApplsci 13 01752 g004b
Figure 5. Pareto chart (a), standardized effects plot (b), interaction plots (c), 3D response surface (d) for percentage increase in the combined acid density after acidizing.
Applsci 13 01752 g005
Figure 6. Microphotographs illustrate (a) fine–coarse crystalline dolomite with numerous vugs floating within dominant dolostone microfacies under normal conditions (t = 0), (b) the same dolostone microfacies in (a) but after in-situ acid injection (when t = 15 min). The alteration influenced the calcite crystals (close-up, the dark circle) more than the dolomite crystals; the final result is an enhancement of the porous media due to in-situ acid injection.
Applsci 13 01752 g006
Figure 7. Photomicrographs of thin sections under optical microscope show: (a) calculation of porous area under natural condition (i.e., t = 0), (b) calculation of porous area under altered condition when the same sample was subject to injection with acid combination (i.e., t = 15 min), (c) calculation of the same sample in b after its reaction with the acid combination. The numerical values calculated for the pore area were estimated by ImageJ software.
Applsci 13 01752 g007
Figure 8. The increase in pore area (%) as a function of acidizing temperature.
Applsci 13 01752 g008
Table 1. The actual levels of the operating variable for acidizing experiments.
Experiment No.1 *23456789abcd
Oxalic acid %683.268.8864412444
Temp.°C50705021.7503078.37030505040Room Temp.
* Repetition.
Disclaimer/Publisher’s Note: The statements, opinions and data contained in all publications are solely those of the individual author(s) and contributor(s) and not of MDPI and/or the editor(s). MDPI and/or the editor(s) disclaim responsibility for any injury to people or property resulting from any ideas, methods, instructions or products referred to in the content.