Abstract
Tea polyphenols are considered as an important indicator of tea quality. Rapid detection of tea polyphenol content plays a valuable role for tea breeding and quality inspection during tea production. In this work, a portable rapid non-destructive detection device of tea polyphenols in fresh tea leaves was developed, which integrated the fusion technology of visible/short-wave (400–1050 nm) and long-wave (1000–1650 nm) near-infrared spectroscopy (Vis/NIR). Experimental results indicated that the spectra within the overlapping region (1000–1050 nm) were assembled by applying the spectral data fusing method. Followed by spectral data preprocessing with the Savitzky–Golay smoothing (SG) method, least squares support vector regression (LS–SVR) models were established for detecting the tea polyphenol content of fresh tea leaves. Based on the fused Vis/NIR spectra (dual-band), the correlation coefficient of calibration (RC), root mean square error of calibration (RMSEC), correlation coefficient of prediction (RP), root mean square error of prediction (RMSEP), and residual predictive deviation (RPD) reached 0.976, 0.679%, 0.893, 0.897%, and 2.230, respectively, which were better than the visible/short-wave or long-wave near infrared spectral data (single-band). The sensitive spectral wavebands of tea polyphenols extracted using the random frog (RF) algorithm were distributed in 402–448 nm, 555–600 nm, 810–1042 nm, 1056–1103 nm, 1219–1323 nm, 1406–1416 nm, and 1499–1511 nm. This demonstrated that the prediction of tea polyphenol content using fused spectral data combined with the LS–SVR model depended on various functional groups such as auxochromes, chromogenic groups, and hydrogen-containing groups. The proposed device is capable of non-destructive detection of tea polyphenol content in fresh tea leaves, which can provide effective technical support for tea breeding and tea leaf quality control.
1. Introduction
Tea polyphenols are important indicators of tea quality, consisting mainly of catechins, anthocyanins, flavonoids, flavonols, and phenolic acids [1,2], which possess health benefits such as scavenging free radicals, strong antioxidant activity, preventing cardiovascular diseases, and inhibiting cancer cell production [3,4,5]. The content of tea polyphenols is usually determined by high performance liquid chromatography (HPLC), potentiometric analysis, or spectrophotometry, which have high detection accuracy but have the disadvantages of being time-consuming, high cost, and destruction of samples [6,7,8,9]. Therefore, a more efficient detection method and portable detection device are urgently needed.
Visible and near infrared (Vis/NIR) spectroscopy indicates the octave and ensemble absorption characteristics of the vibrations of hydrogen-containing groups (e.g., C-H, n-H, and O-H) in substances, and shows great promise for applications in the fields of tea quality, aquatic products, and food testing [10,11,12]. The quantitative model was established by using an XDS near-infrared spectrometer (400–2498 nm) to detect the content of tea polyphenols and caffeine in green tea processing, and the sensitive wavebands were extracted by the successive projections algorithm (SPA). The results showed that the prediction performance of the multiple linear regression (MLR) model based on SPA for detecting the content of tea polyphenols and caffeine was better, and the prediction coefficient of determination () of this model were all greater than 0.834 [13]. Wang et al. (2020) collected spectral and image information of different tea varieties using a hyperspectral imaging spectrometer (900–1700 nm) and combined it with chemometric methods to estimate phosphorus and potassium contents within tea leaves. The results indicated that the predicted correlation coefficient (RP) of MLR models based on the SPA to extract spectral data in sensitive wavebands were all higher than 0.91 [14]. Chen et al. (2021) used the Vis/NIR spectrometer (400–2498 nm) to collect spectral data of tea leaves during fermentation, with the modeling determination coefficient of calibration () of the modified partial least-squares regression (MPLSR) developed for both total catechins and theanine contents greater than 0.94 [15]. The above results demonstrated the feasibility of applying spectroscopic techniques in tea quality testing; however, the expensive spectroscopic instruments and the strict operating environment limited their laboratory utilization.
Fortunately, several low-cost portable visible spectrometers and near-infrared spectrometers have been developed [16,17]. To overcome the shortage of information obtained by a single spectrometer, Wang et al. (2018) presented a portable optical instrument integrating a AvaSpec-2048 fiber optic spectrometer (200–1100 nm) with a AvaSpec-NIR256–2.5 TEC NIR spectrometer (1000–2500 nm). A “response correction” algorithm was then proposed to fuse the two independent spectral regions into a dual-band region (400–2400 nm) that continuously covers the Vis/short-wave and long-wave NIR spectra. The results indicated that the detection accuracy of quality parameters, including protein, adipose, and potential of hydrogen (PH), of pork based on the dual-band spectral region was better than that of the single-band region (400–1100 nm or 1074–2400 nm), and the coefficients of determination (R2) of the partial least squares regression (PLSR) models all reached above 0.90 [18]. O’Rourke et al. (2016) used Vis/NIR and X-ray fluorescence (XRF) coupled for agronomic soil prediction, which improved the prediction accuracy with a relative improvement in the root mean square error (RMSE) ranging from 4% to 44% [19]. Ryckewaert et al. (2022) combined three micro-spectrometers: SCIO (740–1070 nm), NIRscan (901–1701 nm), and NIRone (1750–2150 nm), and acquired the spectral information of the sequential and orthogonalized partial least squares (SO-PLS) model to achieve a prediction of the total sugar content of sugarcane with comparable performance to the commercial instrument ASD (350–2500 nm) [20]. The above studies illustrated that obtaining spectra of samples in a larger wavelength range by integrating spectrometers of different wavelength ranges improves the detection accuracy and the cost effectiveness of the instrumentation.
In this respect, real-time detection of tea polyphenols in fresh tea leaves is crucial for tea bush breeding and tea leaf quality monitoring. Herein, our study focused on fresh tea leaves of different tea varieties and established a tea polyphenol detection model based on the fusion of Vis/short-wave and long-wave NIR spectra by integrating spectrometers of different wavelength ranges. Furthermore, the real-time quantitative detection of tea polyphenol content in fresh tea leaves was performed. The specific objectives were to (1) build a portable device incorporating two spectrometers and fuse the spectral data acquired from two spectrometers into one spectrum, (2) develop prediction models for tea polyphenol content based on the individual and combined spectral regions, and (3) extract the sensitive wavelength of tea polyphenol content.
2. Materials and Methods
2.1. Sample Preparation
Two types of tea bush varieties were selected for this study, namely Jin Guanyin and Fuyun 6 (Camellia sinensis L.), which were planted in the experimental tea garden of the Agricultural Product Quality Institute, Fujian Agriculture and Forestry University. On August 20, 2021, samples containing one bud and four leaves were collected from the shoot tips of tea bush, and 800 fresh tea leaves were obtained totally. The morphology of the fresh leaves of the two tea varieties as shown in Figure 1. To sustain a complex spectral acquisition environment similar to that of the tea garden, the collected fresh tea leaves without any treatment were immediately placed in black sealed bags and labeled for subsequent spectral data acquisition.
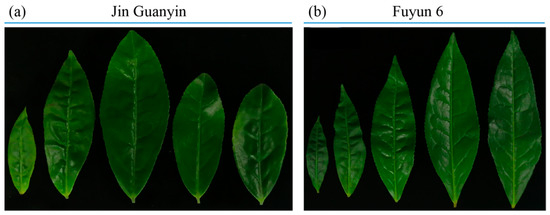
Figure 1.
Fresh tea leaves of Jin Guanyin (a) and Fuyun 6 (b).
2.2. Build a Portable Device
Solidworks 2016 software (Dassault Systèmes, Paris, France) was employed to design the integral structure of the device. The structure schematic and physical diagram of the portable nondestructive detecting device for tea polyphenols in fresh tea leaves is shown in Figure 2, where the spectrometer, plant probe, and Y-type optical fiber are the crucial components of the device. Spectrometer 1 (FieldSpec HandHeld 2, Analytical Spectral Devices Inc., Boulder, CO, USA) had a wavelength range of 325–1075 nm and a spectral resolution of 3 nm. Spectrometer 2 (SW2520, OtO Photonics Inc., Hsinchu City, Taiwan, China) had a wavelength range of 900–1700 nm and a spectral resolution of 15 nm. The plant probe (Analytical Spectral Devices Inc., Boulder, CO, USA) comes with a standard reference panel and tungsten-quartz halogen lamp. The Y-type fiber (SIH400 Y6+1 type fiber, Shenzhen Xinrui Photonics Technology Co., Ltd., Shenzhen, China) had a fiber core diameter of 400 um and a length of 1 m, allowing the transmission of a spectral range of 400 to 2200 nm. To prevent damage to the lithium battery from over-discharge and to enable dual-mode switching of alternating current (AC) and direct current (DC) power supplies, polymer lithium batteries (Genaier 12 V/13000 MAH, Shenzhen Sentech Power Technology Co., Ltd., Shenzhen, China) with a DC uninterruptible power supply (UPS 12 V/5 A, Shenzhen Xin Yuan Jia Industry Co., Ltd., Shenzhen, China) were employed.
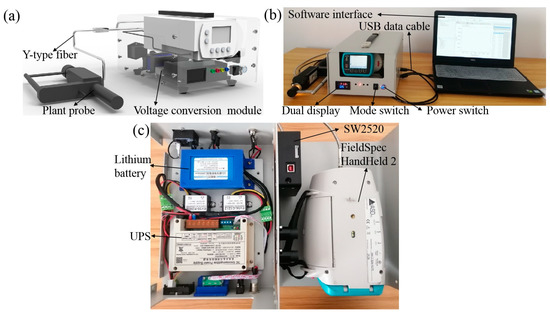
Figure 2.
Portable non-destructive detecting device for tea polyphenols in fresh tea leaves: structure diagram (a), physical diagram (b), and internal diagram (c).
2.3. Spectral Information Acquisition
The portable non-destructive detecting device for tea polyphenols in fresh tea leaves was preheated for about 30 min before spectral data acquisition. Spectrometer 1 parameters were set to acquire spectral information for 10, 20, and 10 times for fresh tea leaves, dark current (reflectance is nearly 0), and standard reference panels (reflectance is nearly 1), respectively. The optimal integration time of spectrometer 2 was set to 40 ms, the smoothness was set to 3, and the number of scans was set to 10. The spectra of the dark current and standard reference panels were firstly acquired. Then, the front side of the fresh tea leaf was clamped by the plant probe for spectral information acquisition. The spectrum of the same fresh tea leaf was repeatedly acquired at three different positions and the average was calculated as the raw spectral reflectance of the fresh tea leaf sample.
2.4. Determination of Tea Polyphenol Content
The tea polyphenol content of fresh tea leaves was measured by referring to the Chinese national standard GB/T 8313–2018 immediately after the spectral data were collected. Slightly modified, the specific steps were as follows: the fresh tea leaves were placed in the oven (DL-6 CH, Quanzhou Deli Agroforestrial Machinery Co., Ltd., Quanzhou, China) at 120 °C for 6 min for fixation, followed by drying at 90 °C to a constant weight. Tea samples from 10 drying tea leaves of the same tea variety was taken as one sample; it was put into a frozen grinding machine (JXCL-3 K, Shanghai Jingxin Industrial Development Co., Ltd., Shanghai, China) to grind for 3 min and uniformly sieved through an 80 mesh sieve to obtain tea powder. Tea powder (0.2000–0.2005 g) was taken in a 10 mL centrifuge tube, and 5 mL of 70% methanol was added after heating in an electric-heated thermostatic water bath (HWS26, Shanghai Yiheng Technology Instrument Co., Ltd., Shanghai, China). Then, the samples were extracted inside a constant temperature water bath at 70 °C for 10 min with shaking at 5 min intervals. After centrifugation at 6886× g for 5 min in a refrigerated ultracentrifuge (Centrifuge 5430 R, Eppendorf Corporate, Hamburg, Germany), the supernatant was transferred to a 10 mL volumetric flask and the extraction was repeated for the precipitated tea powder residue. Finally, the supernatant from the two times extracts were combined into a 10 mL volumetric flask, followed by aspirating the preheated 70% methanol using a dropper to dilute the volume to the mark, which was then shaken evenly.
After sample pretreatment, 1 mL of tea sample and 5 mL of 10% Folin-Ciocalteu’s phenol reagent were taken into a 20 mL test tube and incubated for 6 min. Then, 4 mL of 7.5% sodium carbonate was added and kept at room temperature under light-proof conditions for 30 min. Finally, in a 96-well microtiter plate, the absorbance value of 200 μL of the test solution was measured at 765 nm with the Tecan microplate reader (Infinite M200 Pro, Grödig, Austria), and the tea polyphenol content was calculated according to the standard curve established by the gallic acid standard (Beijing Solarbio Science & Technology Co., Ltd., Beijing, China). Each sample was performed in triplicate. After the measured value with the largest relative error to the remaining two chemical values was eliminated, the average of the remaining two values was recorded as the measured chemical value of the sample. Tea polyphenol content of fresh tea leaves were calculated by Equation (1) as follows:
where TP is the tea polyphenols content (%) of the sample; X is the absorbance of the sample; m is the powder weight (g) of the sample; w is the dry matter content (%) of the sample.
2.5. Data Analysis Methods
2.5.1. Analysis of Variance
Analysis of variance (ANOVA) is a statistical test used to determine if more than two population means are equal. The principal reason for the application of an ANOVA is to analyze group means differences. The ANOVA includes one-way ANOVA and multi-way ANOVA, in which the one-way ANOVA considers whether the effect of a single factor on the index is significant or not [21].
2.5.2. Data Preprocessing
To improve model performance, Monte Carlo cross validation (MCCV) was performed to eliminate outliers in the sample dataset of this study [22]. The raw spectral noise was filtered using Savitzky–Golay smoothing (SG) method [23,24]. The first order polynomial was used to fit the spectral data within the filtered window of 3 to decay the effect of random noise present in the spectral data on the effective information of the sample.
2.5.3. Selection of Sensitive Wavebands
In this study, the sensitive spectral wavebands of tea polyphenols in fresh tea leaves were analyzed using the random frog (RF) algorithm. The principle of RF algorithm for selecting sensitive wavebands is to calculate the probability that each waveband is selected for tea polyphenol content prediction. The higher the probability of the waveband is selected, the more important it is for the indication of tea polyphenol content [25,26].
2.5.4. Spectral Data Fusing Method
Differences in the performance of the two spectrometers resulted in different spectral reflectance acquired in the spectral overlap region (1000–1050 nm). Therefore, it is necessary to splice the two wavebands in the overlapping region to make a contiguous curve. First, the spectra with low signal-to-noise ratio at the edges were truncated, and the spectral data of FieldSpec HandHeld 2 and SW2520 in the range of 400–1050 nm and 1000–1650 nm were preserved, respectively. The spectral reflectance of the two spectrometers at 51 overlapping wavelengths was subsequently calculated by the interpolation algorithm [27]. Finally, the two datasets were stitched together by averaging method, this is a low-level data fusion of visible/short-wave and long-wave NIR spectral data. The formula for calculating the spectral reflectance after fusing as Equations (2) and (3) [28]:
where e represents the difference between the averages of the two datasets of spectral reflectance in the overlap region; z is the number of 51 wavelengths obtained after interpolation of the overlap region; n represents the total number of samples; is the spectral reflectance at the wavelength acquired by FieldSpec HandHeld 2; is the spectral reflectance at the wavelength acquired by SW2520; is the spectral reflectance at the wavelength after data fusion.
2.5.5. Establishment of the Regression Model
The sample set was divided into a calibration set and a prediction set using the Kennard–Stone (KS) algorithm in a ratio of 2:1 [29]. Least squares support vector regression (LS–SVR) is a renovation combined the least square method (LS) and the traditional support vector regression (SVR). LS–SVR employs a least squares linear system as the loss function, which reduces the complexity of the model operations while retaining the advantages of the SVR model [30,31]. LS–SVR uses radial basis function (RBF) as the kernel function and a grid search (GS) algorithm to find the optimal of model regularization parameters gamma (γ) as well as radial basis function sig2 (σ2) bandwidth. The LS was used to calculate the regression coefficients and deviations value, and the final prediction model was obtained [32,33].
After the regression model was established, the predictive performance of the model was evaluated by correlation coefficient (R), root mean square error (RMSE), and residual predictive deviation (RPD). Generally, the larger the R and RPD, the smaller the RMSE, and the closer the R to 1 (RMSE to 0), indicating the better predictive performance of the model [34,35]. These model performance indexes were defined using Equations (4)–(6) as follows:
where , are the actual measured chemical values and model predicted chemical values of the sample, respectively; , are the average of the actual measured chemical values and the average of the model predicted chemical values of the samples, respectively; , are the standard deviation of sample content and the predicted standard deviation of the prediction set, respectively; is the number of samples.
The above spectral data processing method were performed using Matlab 2016 a (The MathWorks, Natick, MA, USA). The Unscrambler X10.1 (CAMO, Process, AS, Oslo, Norway) was also used for spectral pretreatments. The data was illustrated by graphs using Origin 2017 C (OriginLab, Northampton, MA, USA).
3. Results and Discussion
3.1. Statistical Analysis of Tea Polyphenol Content
Figure 3 displays the tea polyphenol content of fresh tea leaves of two tea bush varieties. The tea polyphenol content of Jin Guanyin varieties and Fuyun 6 are 21.83 ± 2.78% and 20.08 ± 2.65%, respectively. The results of the one-way ANOVA revealed that the tea polyphenol content of the two varieties is significantly different (p = 0.0052 < 0.05). The tea polyphenol content of fresh tea leaves from different tea bush varieties were obtained in a series of concentration gradients, which facilitated the subsequent development of a robust quantitative model.
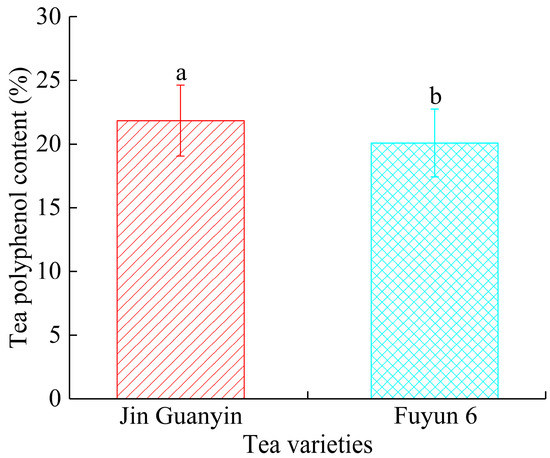
Figure 3.
Histogram of tea polyphenol content in fresh tea leaves of two varieties. Note: Data are presented as mean ± standard deviation. The different letters (a and b) in the figures show significant differences in the tea polyphenol content of different varieties using Duncan test at p < 0.05 confidence level.
3.2. Analysis of Spectral Reflectance
Figure 4 shows the average reflectance spectra ± standard deviation of fresh tea leaves of different varieties, where Figure 4a presents Vis/short-wave NIR spectra of samples collected by FieldSpec HandHeld 2 spectrometer, and Figure 4b presents the reflectance curves of long-wave NIR spectra of samples collected by SW2520 spectrometer. An obvious strong reflectance peak near 550 nm is shown, corresponding to low absorption of green light by green plant leaves; a deep absorption peak is observed near 480 nm and 675 nm, which is attributed to strong chlorophyll absorption within the green leaves; a large variation in spectral reflectance can be seen in the range of 700–775 nm, but a small variation is seen between samples [34,36]; the absorption peaks in the range of 960–980 nm correspond to the second overtone of the vibrations of the free O-H group in phenols [37]. A gentle absorption peak near 1200 nm is assigned to C-H group vibrations; an absorption peak at 1465 nm is mainly associated with the vibration of phenolic O-H group [13]; the reflection peak appears at 1650 nm occurs in response to the C-H group vibration [38]. It demonstrated that both Vis/short-wave and long-wave NIR spectral ranges contain valid spectral information of tea polyphenol content. Therefore, it is necessary to splice the two waveband regions to characterize the content of tea polyphenols.
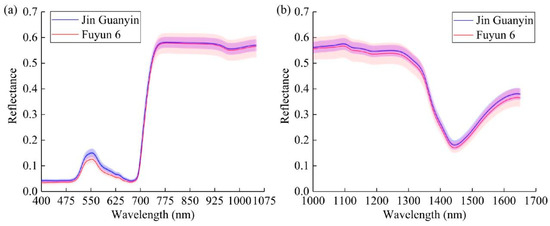
Figure 4.
Raw spectra of fresh tea leaves in different waveband ranges. Mean ± standard deviation of the samples from two different tea varieties. The upper and lower boundaries of the translucent areas represent ± standard deviation. (a) Vis/short-wave NIR spectra (400–1050 nm), (b) long-wave NIR spectra (1000–1650 nm).
3.3. Outlier Screening and Sample Set Division
The MCCV method was used to eliminate abnormal samples related to the sample spectra and tea polyphenol content in this study. The number of cycles was 1000, and the threshold was set to three times the sample mean (MEAN) and standard deviation (STD). The MEAN-STD distribution is depicted in Figure 5. The samples were screened for MEAN greater than 3.069 or STD greater than 2.728 for tea polyphenol content in the range of 400–1050 nm waveband, obtaining sample numbers 17 and 70 as abnormal samples (Figure 5a); the samples were screened for MEAN greater than 4.067 or STD greater than 4.260 in the range of 1000–1650 nm waveband, and sample numbers 17 and 73 were anomalous (Figure 5b); the samples were screened for MEAN greater than 3.153 or STD greater than 2.919 in the 400–1650 nm waveband, and three samples were recognized as abnormal samples (Figure 5c).
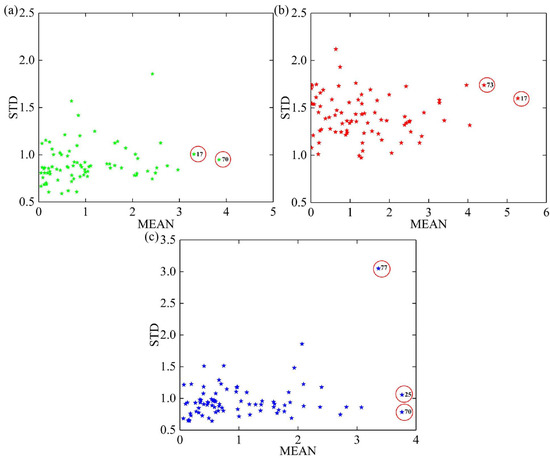
Figure 5.
MEAN-STD distribution of the predicted residuals of tea polyphenol content in different waveband ranges. (a) Vis/short-wave NIR spectra (400–1050 nm), (b) long-wave NIR spectra (1000–1650 nm), and (c) Vis/short-wave and long-wave NIR spectra (400–1650 nm). Different colors represent the predicted residuals of tea polyphenol content in different waveband ranges.
The KS algorithm was employed to divide the sample set after eliminating the abnormal samples, and the data within the sample set were analyzed (Table 1). In all waveband ranges, the MEAN, coefficient of variation (CV), and STD of the whole set of samples were between the calibration set and the prediction set, indicating that the tea polyphenol content of fresh tea leaves had strong variability in this study. This might be caused by the wide range collection of tea leaf positions (the first leaf position to the fourth leaf position of new shoot), resulting in high heterogeneity among tea polyphenols content of fresh tea leaf samples [8,39]. The skewness of all data set is greater than 0, which indicates that the data set do not conform to the normal and right skewed distribution. Kurtosis for both the whole set and the calibration set are less than 0, indicating that the tails of the data set are finer than the normal distribution and have fewer extreme data; the kurtosis of the prediction set is greater than 0, indicating that the tails of the data set are thicker than the normal distribution and the extreme data have a wider distribution. The range of tea polyphenol content in the calibration set covered the range in the prediction set, and the tea polyphenol content in different sample sets were evenly distributed with relatively similar MEAN and STD. Therefore, the sample set division is reasonable and suitable for establishing a robust model.

Table 1.
Statistical characteristics of tea polyphenol content of the calibration and prediction sets in different waveband ranges.
3.4. Construction and Evaluation of Models
Before establishing the model, the raw spectra of two single-band and fused dual-band underwent SG smoothing pretreatment. Comparison of the spectral curves (Figure 6a) before and after spectral data fusion (Figure 6b) reveals that the latter better retains the raw curve variation trend and shape. Moreover, the spectral curves after fusion in the overlapping wavebands (1050–1100 nm) are smoothly connected and smoothly vary at the nodes. The reflectance at the same waveband is distinct depending on the variations in the response of different instruments, while the average splicing prevents the sudden and drastic changes in the spectra caused by the joining of spectral data.
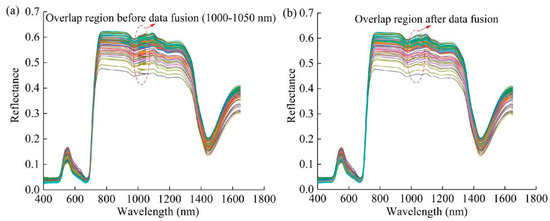
Figure 6.
SG smoothing pretreatment spectral of dual-band. (a) Spectral curve before data fusion, and (b) spectral curve after data fusion. Different colors denote the raw spectral reflectance curves of different samples. There were 40 samples of each tea variety, with a total number of 80 samples, i.e., 80 samples and 80 spectral curves.
The LS–SVR model was established using the spectral reflectance after SG smoothing pretreatment and the tea polyphenol content determined by standard chemical methods as the independent and dependent variables, respectively. To verify the model performance before and after data fusion, the spectral data of single-band and dual-band were used for modeling. As listed in Table 2, the modeling performance using single-band (400–1050 nm) spectral data is better than that of the model established from single-band (1000–1650 nm) spectral data, which might be relevant to the high signal-to-noise ratio and resolution of the FieldSpec HandHeld 2 spectrometer. Crucially, the absorption peaks of catechins, the main components of tea polyphenols, are mainly distributed in 450–780 nm, hence, the modeling is more effective using single band (400–1050 nm) data [34,40]. The modeling performance using dual-band (400–1650 nm) spectral data is superior to that of the model established from single-band (1000–1650 nm) spectral data, with a larger Rp and smaller RMSE and RPD. The dual-band (400–1650 nm) model is slightly better than the single-band (400–1050 nm) model, which may be due to the more comprehensive coverage of the octave and ensemble absorption properties of hydrogen-containing groups in the dual-band spectra [28,41,42]. Therefore, the SG-LS-SVR model based on the dual-band spectral was applied to detect the tea polyphenol content of fresh tea leaves with the best model prediction performance, which the validation set was RP of 0.893, RMSEP of 0.897% and RPD of 2.230, indicating that the device was capable of collecting visible/short-wave and long-wave NIR spectral data simultaneously with a satisfactory result. This was in accordance with the conclusion of [18,20,43] that modeling based on dual-band spectral data was better than single-band. Figure 7a,b show the correlation plots of the SG-LS-SVR detection of tea polyphenol content and the comparison between the predicted and measured values of the prediction set samples, respectively.
Table 2.
Predictive performances of the LS–SVR model for tea polyphenol content detection in different waveband ranges.
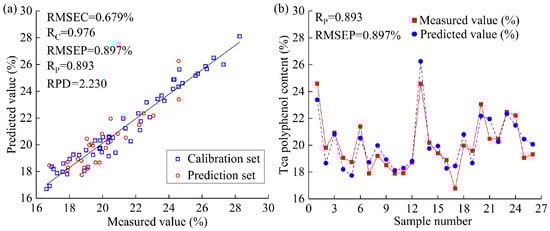
Figure 7.
LS–SVR modeling performances of predicting tea polyphenol content based on dual-band spectral data. (a) Correlation analysis of a scatter plot. The hollow square and circle markers denote the calibration set and prediction set, respectively. The black line is the regression for the whole set. (b) Comparison of predicted and measured values of tea polyphenol content. The solid square and circle markers represent the measured value and predicted value, respectively.
3.5. Sensitive Waveband Analysis
The RF algorithm was used to analyze the relative importance of each wavelength to investigate the intrinsic mechanism of the machine learning model to predict the tea polyphenol content of fresh tea leaves. The number of iterations was set to 1000, the probability threshold was chosen to be 15%, the processing method was chosen to be “center”, and the first 62 wavebands with higher probability were finally taken as sensitive wavebands (Figure 8a). From (Figure 8b), the sensitive wavebands of tea polyphenol content of fresh tea leaves are mainly distributed in 402–448 nm, 555–600 nm, 810–1042 nm, 1056–1103 nm, 1219–1323 nm, 1406–1416 nm, and 1499–1511 nm.
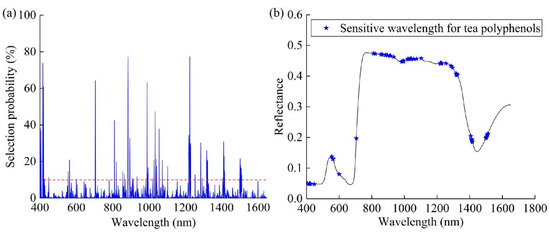
Figure 8.
Sensitive wavebands related to tea polyphenol content extracted by RF algorithm. (a) Selection probability of different wavelengths, and (b) distribution of the first 62 selected sensitive wavebands.
A total of 12 sensitive wavelengths (402, 406, 416, 417, 420, 424, 448, 555, 562, 563, 600, and 705 nm) are located in the visible spectral region (400–780 nm), which correspond to the absorption properties of the auxochromes (e.g., -OH, -NH, and -SH) and chromophores (e.g., carboxyl, ester group, aromatic systems) within the fresh tea leaves [44,45,46]. There are 20 sensitive wavelengths (810, 821 856, 865, 884, 885, 894, 895, 910, 914, 934, 983, 990, 993, 995, 1020, 1027, 1034, 1040, and 1042 nm) in the short-wave NIR spectral region (781–1050 nm), which mainly attribute to the second and third overtones of the O-H group or C-H group vibrations of phenols [47,48]. There are 30 sensitive wavebands (1056, 1074, 1103, 1219, 1220, 1221, 1222, 1225, 1228, 1229, 1254, 1285, 1286, 1294, 1317, 1318, 1320, 1321, 1323, 1406, 1411, 1412, 1414, 1416, 1499, 1501, 1502, 1505, 1508, and 1511 nm) in the long-wave NIR spectral region (1051–1650 nm), depending on the O-H or methyl C-H group in the phenolic. Among them, 1020, 1027, 1034, 1040, 1042, 1056, 1074, and 1103 nm correspond to the second overtones of the O-H group [49]; 1219, 1220, 1221, and 1222 nm relate to the second overtones and combination of the C-H group stretching vibration of -CH2 [50]; 1225, 1228, 1229, 1254, 1285, 1286, 1294, 1317, 1318, 1320, 1321, and 1323 nm are the second overtones and combination of C-H group stretching vibrations [51,52]; 1406, 1411, 1412, 1414, and 1416 nm are associated with the first overtones of free O-H group vibrations; 1499, 1501, 1502, 1505, 1508, and 1511 nm reflect the first overtones of the N-H group stretching vibrations [8]. This demonstrated that the prediction of tea polyphenol content of fresh tea leaves using dual-band spectral data combined with LS–SVR model depends on close correlation between phenolic compounds and auxochromes, chromogenic groups, and hydrogen-containing groups (e.g., -OH, -NH, and -CH) [34].
4. Conclusions
In this study, a portable nondestructive detection device based on Vis/short-wave NIR spectroscopy coupled with long-wave NIR spectroscopy was designed to detect tea polyphenols in fresh tea leaves of summer tea bush varieties (Jin Guanyin and Fuyun 6). This device consists of a spectrometer, Y-type optical fiber, plant probe, lithium polymer battery, DC uninterruptible power supply, voltage conversion module, and aluminum alloy housing. The overlapping regions in two independent spectral wavebands were fused together using the interpolation and mean method, which can collect dual-band spectral data (400–1650 nm) of Vis/short-wave and long-wave NIR of fresh tea leaves simultaneously. The SG-LS-SVR model based on the dual-band spectra achieved the best performance in quantifying tea polyphenol content in fresh tea leaves (Rc = 0.976, RMSEC = 0.679%, Rp = 0.893, RMSEP = 0.897%, and RPD = 2.230). To summarize, the proposed device and method provide effective technical support for the breeding of good tea varieties and online detection of fresh tea leaves quality. For future research, further analysis of other key components of fresh tea leaves, such as caffeine, theanine and catechin monomers (EGCG, ECG, EGC, EC, GA, GCG, CG, GC, and C), can be done to improve the universality of the detection model. Meanwhile, the data fusion methods in the dual-band can also be attempted by the regional feature weighted fusion method, linear fitting method, and direct translation method, etc.
Author Contributions
J.X., F.Q. and H.W. designed the experiment. J.X., B.S. and Z.H. performed the experiment, data curation. J.X., F.Q. and H.W. wrote the manuscript. X.L., D.Y. and R.W. provided suggestions on the results and discussion sections. D.Y. and X.L. provided project administration, funding acquisition. All authors have read and agreed to the published version of the manuscript.
Funding
This work was supported by the National Natural Science Foundation of China (31771676), High Peak Plateau Subject Project of Fujian Province (712018014), and the Science and Technology Innovation Special Fund Project of Fujian Agriculture and Forestry University (KFA19129 A).
Institutional Review Board Statement
Not applicable.
Informed Consent Statement
Not applicable.
Data Availability Statement
Not applicable.
Conflicts of Interest
The authors declare no conflict of interest.
References
- Kerio, L.; Wachira, F.; Wanyoko, J.; Rotich, M. Total polyphenols, catechin profiles and antioxidant activity of tea products from purple leaf coloured tea cultivars. Food Chem. 2013, 136, 1405–1413. [Google Scholar] [CrossRef] [PubMed]
- Lakenbrink, C.; Lapczynski, S.; Maiwald, B.; Engelhardt, U.H. Flavonoids and other polyphenols in consumer brews of tea and other caffeinated beverages. J. Agric. Food Chem. 2000, 48, 2848–2852. [Google Scholar] [CrossRef] [PubMed]
- Chen, G.; Yi, Z.; Chen, X.; Ma, X.; Su, W.; Li, X. Polyphenol nanoparticles from commonly consumed tea for scavenging free radicals, stabilizing pickering emulsions, and inhibiting cancer cells. ACS Appl. Nano Mater. 2020, 4, 652–665. [Google Scholar] [CrossRef]
- Jang, M.; Park, R.; Park, Y.-I.; Cha, Y.-E.; Yamamoto, A.; Lee, J.I.; Park, J. EGCG, a green tea polyphenol, inhibits human coronavirus replication in vitro. Biochem. Biophys. Res. Commun. 2021, 547, 23–28. [Google Scholar] [CrossRef] [PubMed]
- Khan, N.; Mukhtar, H. Tea polyphenols for health promotion. Life Sci. 2007, 81, 519–533. [Google Scholar] [CrossRef] [PubMed]
- Denisenko, T.A.; Miekh, Y.V.; Vishnikin, A.B. Spectrophotometric determination of polyphenols in green teas with 18-molybdodiphosphate. Odesa Natl. Univ. Herald. Chem. 2018, 23, 70–82. [Google Scholar] [CrossRef]
- Gharibzahedi, S.M.T.; Barba, F.J.; Zhou, J.; Wang, M.; Altintas, Z. Electronic sensor technologies in monitoring quality of tea: A review. Biosensors 2022, 12, 356. [Google Scholar] [CrossRef]
- Hazarika, A.K.; Chanda, S.; Sabhapondit, S.; Sanyal, S.; Tamuly, P.; Tasrin, S.; Sing, D.; Tudu, B.; Bandyopadhyay, R. Quality assessment of fresh tea leaves by estimating total polyphenols using near infrared spectroscopy. J. Food Sci. Technol. 2018, 55, 4867–4876. [Google Scholar] [CrossRef]
- Zhang, X.-H.; Zhou, Q.; Liu, Z.; Qing, X.-D.; Zheng, J.-J.; Mu, S.-T.; Liu, P.-H. Comparison of three second-order multivariate calibration methods for the rapid identification and quantitative analysis of tea polyphenols in Chinese teas using high-performance liquid chromatography. J. Chromatogr. A. 2020, 1618, 460905. [Google Scholar] [CrossRef]
- Biancolillo, A.; Marini, F. Special issue “application of spectroscopy in food analysis”. Appl. Sci. 2021, 11, 3860. [Google Scholar] [CrossRef]
- Fasolato, L.; Balzan, S.; Riovanto, R.; Berzaghi, P.; Mirisola, M.; Ferlito, J.C.; Serva, L.; Benozzo, F.; Passera, R.; Tepedino, V.; et al. Comparison of visible and near-infrared reflectance spectroscopy to authenticate fresh and frozen-thawed swordfish (Xiphias gladius L.). J. Aquat. Food Prod. Technol. 2012, 21, 493–507. [Google Scholar] [CrossRef]
- Ren, G.; Liu, Y.; Ning, J.; Zhang, Z. Assessing black tea quality based on visible–near infrared spectra and kernel-based methods. J. Food Compos. Anal. 2021, 98, 103810. [Google Scholar] [CrossRef]
- Sanaeifar, A.; Huang, X.; Chen, M.; Zhao, Z.; Ji, Y.; Li, X.; He, Y.; Zhu, Y.; Chen, X.; Yu, X. Nondestructive monitoring of polyphenols and caffeine during green tea processing using Vis-NIR spectroscopy. Food Sci. Nutr. 2020, 8, 5860–5874. [Google Scholar] [CrossRef] [PubMed]
- Wang, Y.-J.; Jin, G.; Li, L.-Q.; Liu, Y.; Kalkhajeh, Y.K.; Ning, J.-M.; Zhang, Z.-Z. NIR hyperspectral imaging coupled with chemometrics for nondestructive assessment of phosphorus and potassium contents in tea leaves. Infrared Phys. Technol. 2020, 108, 103365. [Google Scholar] [CrossRef]
- Chen, S.; Wang, C.-Y.; Tsai, C.-Y.; Yang, I.-C.; Luo, S.-J.; Chuang, Y.-K. Fermentation quality evaluation of tea by estimating total catechins and theanine using near-infrared spectroscopy. Vib. Spectrosc. 2021, 115, 103278. [Google Scholar] [CrossRef]
- Hershberger, J.; Mbanjo, E.G.N.; Peteti, P.; Ikpan, A.; Ogunpaimo, K.; Nafiu, K.; Rabbi, I.Y.; Gore, M.A. Low-cost, handheld near-infrared spectroscopy for root dry matter content prediction in cassava. Plant Phenome J. 2022, 5, e20040. [Google Scholar] [CrossRef]
- Neto, R.; Niehus, M. Portable optical fiber coupled low cost visible spectrometer. Procedia Technol. 2014, 17, 595–600. [Google Scholar] [CrossRef]
- Wang, W.; Peng, Y.; Sun, H.; Zheng, X.; Wei, W. Real-time inspection of pork quality attributes using dual-band spectroscopy. J. Food Eng. 2018, 237, 103–109. [Google Scholar] [CrossRef]
- O’Rourke, S.M.; Stockmann, U.; Holden, N.M.; McBratney, A.B.; Minasny, B. An assessment of model averaging to improve predictive power of portable vis-NIR and XRF for the determination of agronomic soil properties. Geoderma. 2016, 279, 31–44. [Google Scholar] [CrossRef]
- Ryckewaert, M.; Chaix, G.; Héran, D.; Zgouz, A.; Bendoula, R. Evaluation of a combination of NIR micro-spectrometers to predict chemical properties of sugarcane forage using a multi-block approach. Biosyst. Eng. 2022, 217, 18–25. [Google Scholar] [CrossRef]
- Blanco-Topping, R. The impact of Maryland all-payer model on patient satisfaction of care: A one-way analysis of variance (ANOVA). Int. J. Health Manag. 2020, 14, 1397–1404. [Google Scholar] [CrossRef]
- Liu, Z.; Cai, W.; Shao, X. Outlier detection in near-infrared spectroscopic analysis by using Monte Carlo cross-validation. Sci. China Chem. 2008, 51, 751–759. [Google Scholar] [CrossRef]
- Zhang, G.; Hao, H.; Wang, Y.; Jiang, Y.; Shi, J.; Yu, J.; Cui, X.; Li, J.; Zhou, S.; Yu, B. Optimized adaptive Savitzky-Golay filtering algorithm based on deep learning network for absorption spectroscopy. Spectrochim. Acta Part A Mol. Biomol. Spectrosc. 2021, 263, 120187. [Google Scholar] [CrossRef]
- Zimmermann, B.; Kohler, A. Optimizing Savitzky–Golay parameters for improving spectral resolution and quantification in infrared spectroscopy. Appl. Spectrosc. 2013, 67, 892–902. [Google Scholar] [CrossRef] [PubMed]
- Haruna, S.A.; Li, H.; Wei, W.; Geng, W.; Adade, S.Y.-S.S.; Zareef, M.; Ivane, N.M.A.; Chen, Q. Intelligent evaluation of free amino acid and crude protein content in raw peanut seed kernels using NIR spectroscopy paired with multivariable calibration. Anal. Methods. 2022, 14, 2989–2999. [Google Scholar] [CrossRef] [PubMed]
- Li, X.; Sun, C.; Luo, L.; He, Y. Determination of tea polyphenols content by infrared spectroscopy coupled with iPLS and random frog techniques. Comput. Electron. Agric. 2015, 112, 28–35. [Google Scholar] [CrossRef]
- Abed, F.M.; Amirshahi, S.H.; Abed, M.R.M. Reconstruction of reflectance data using an interpolation technique. J. Opt. Soc. Am. A. 2009, 26, 613–624. [Google Scholar] [CrossRef]
- Wang, W.; Peng, Y.; Sun, H.; Wang, F.; Tian, F.; Chen, X. Development of simultaneous detection device for multi-quality parameters of meat based on Vis/NIR spectroscopy. Trans. Chin. Soc. Agric. Eng. 2016, 32, 290–296. [Google Scholar] [CrossRef]
- Saptoro, A.; Tadé, M.O.; Vuthaluru, H. A modified Kennard-Stone slgorithm for optimal division of data for developing artificial neural network models. Chem. Prod. Process. Model. 2012, 7, 1–14. [Google Scholar] [CrossRef]
- Steiner, M.; Bourinet, J.-M.; Lahmer, T. An adaptive sampling method for global sensitivity analysis based on least-squares support vector regression. Reliab. Eng. Syst. Saf. 2018, 183, 323–340. [Google Scholar] [CrossRef]
- Wei, Y.; He, Y.; Li, X. Tea moisture content detection with multispectral and depth images. Comput. Electron. Agric. 2021, 183, 106082. [Google Scholar] [CrossRef]
- Wan, Z. Quantitative structure-property relationship of standard enthalpies of nitrogen oxides based on a MSR and LS-SVR algorithm predictions. J. Mol. Struct. 2020, 1221, 128867. [Google Scholar] [CrossRef]
- Yang, B.; Li, X.; Wu, L.; Chen, Y.; Zhong, F.; Liu, Y.; Zhao, F.; Ye, D.; Weng, H. Citrus Huanglongbing detection and semi-quantification of the carbohydrate concentration based on micro-FTIR spectroscopy. Anal. Bioanal. Chem. 2022, 414, 6881–6897. [Google Scholar] [CrossRef] [PubMed]
- Huang, Y.; Dong, W.; Sanaeifar, A.; Wang, X.; Luo, W.; Zhan, B.; Liu, X.; Li, R.; Zhang, H.; Li, X. Development of simple identification models for four main catechins and caffeine in fresh green tea leaf based on visible and near-infrared spectroscopy. Comput. Electron. Agric. 2020, 173, 105388. [Google Scholar] [CrossRef]
- Kamruzzaman, M.; Makino, Y.; Oshita, S. Parsimonious model development for real-time monitoring of moisture in red meat using hyperspectral imaging. Food Chem. 2016, 196, 1084–1091. [Google Scholar] [CrossRef]
- Bian, M.; Skidmore, A.K.; Schlerf, M.; Wang, T.; Liu, Y.; Zeng, R.; Fei, T. Predicting foliar biochemistry of tea (Camellia sinensis) using reflectance spectra measured at powder, leaf and canopy levels. ISPRS J. Photogramm. Remote. Sens. 2013, 78, 148–156. [Google Scholar] [CrossRef]
- Workman, J., Jr. Ultraviolet, visible, and near-infrared spectrometry. In Applied Spectroscopy: A Compact Reference for Practitioners; Elsevier: Amsterdam, The Netherlands, 1998; pp. 29–48. [Google Scholar] [CrossRef]
- Xiong, C.; Liu, C.; Pan, W.; Ma, F.; Xiong, C.; Qi, L.; Chen, F.; Lu, X.; Yang, J.; Zheng, L. Non-destructive determination of total polyphenols content and classification of storage periods of Iron Buddha tea using multispectral imaging system. Food Chem. 2014, 176, 130–136. [Google Scholar] [CrossRef]
- Zhou, R.-Q.; Li, X.-L.; He, Y.; Jin, J.-J. Determination of catechins and caffeine content in tea (Camellia sinensis L.) leaves at different positions by Fourier-Transform infrared spectroscopy. Trans. ASABE 2018, 61, 1221–1230. [Google Scholar] [CrossRef]
- Chen, Q.; Zhao, J.; Chaitep, S.; Guo, Z. Simultaneous analysis of main catechins contents in green tea (Camellia sinensis (L.)) by Fourier transform near infrared reflectance (FT-NIR) spectroscopy. Food Chem. 2009, 113, 1272–1277. [Google Scholar] [CrossRef]
- Chen, Q.; Zhao, J.; Liu, M.; Cai, J.; Liu, J. Determination of total polyphenols content in green tea using FT-NIR spectroscopy and different PLS algorithms. J. Pharm. Biomed. Anal. 2008, 46, 568–573. [Google Scholar] [CrossRef]
- Luo, W.; Tian, P.; Fan, G.; Dong, W.; Zhang, H.; Liu, X. Non-destructive determination of four tea polyphenols in fresh tea using visible and near-infrared spectroscopy. Infrared Phys. Technol. 2022, 123, 104037. [Google Scholar] [CrossRef]
- Wang, W.; Peng, Y. Improvement of Prediction Models for Nondestructive Detection of TVB-N Using Dual-Band Vis/NIR Spectroscopic Technique. Trans. ASABE 2017, 60, 1075–1082. [Google Scholar] [CrossRef]
- Maccioni, A.; Agati, G.; Mazzinghi, P. New vegetation indices for remote measurement of chlorophylls based on leaf directional reflectance spectra. J. Photochem. Photobiol. B Biol. 2001, 61, 52–61. [Google Scholar] [CrossRef] [PubMed]
- Picollo, M.; Aceto, M.; Vitorino, T. UV-Vis spectroscopy. Phys. Sci. Rev. 2018, 4, 1–14. [Google Scholar] [CrossRef]
- Rocha, F.S.; Gomes, A.J.; Lunardi, C.N.; Kaliaguine, S.; Patience, G.S. Experimental methods in chemical engineering: Ultraviolet visible spectroscopy-UV-Vis. Can. J. Chem. Eng. 2018, 96, 2512–2517. [Google Scholar] [CrossRef]
- Liu, J.-X.; Xin, J.-Y.; Gao, T.-T.; Li, F.-L.; Tian, X. Effect of variable selection and rapid determination of total tea polyphenols contents in Fuzhuan tea by near-infrared spectroscopy. CyTA-J. Food 2022, 20, 236–243. [Google Scholar] [CrossRef]
- Yan, J.; Huang, X.-P.; Zhu, W.-W. Simultaneous determination of antioxidant properties and total phenolic content of Siraitia grosvenorii by near infrared spectroscopy. J. Food Meas. Charact. 2020, 14, 2300–2309. [Google Scholar] [CrossRef]
- Ong, P.; Chen, S.; Tsai, C.-Y.; Chuang, Y.-K. Prediction of tea theanine content using near-infrared spectroscopy and flower pollination algorithm. Spectrochim. Acta Part A Mol. Biomol. Spectrosc. 2021, 255, 119657. [Google Scholar] [CrossRef]
- Li, X.; Jin, J.; Sun, C.; Ye, D.; Liu, Y. Simultaneous determination of six main types of lipid-soluble pigments in green tea by visible and near-infrared spectroscopy. Food Chem. 2018, 270, 236–242. [Google Scholar] [CrossRef]
- Bai, X.; Zhang, L.; Kang, C.; Quan, B.; Zheng, Y.; Zhang, X.; Song, J.; Xia, T.; Wang, M. Near-infrared spectroscopy and machine learning-based technique to predict quality-related parameters in instant tea. Sci. Rep. 2022, 12, 3833. [Google Scholar] [CrossRef]
- Li, C.; Guo, H.; Zong, B.; He, P.; Fan, F.; Gong, S. Rapid and non-destructive discrimination of special-grade flat green tea using Near-infrared spectroscopy. Spectrochim. Acta Part A Mol. Biomol. Spectrosc. 2018, 206, 254–262. [Google Scholar] [CrossRef] [PubMed]
Disclaimer/Publisher’s Note: The statements, opinions and data contained in all publications are solely those of the individual author(s) and contributor(s) and not of MDPI and/or the editor(s). MDPI and/or the editor(s) disclaim responsibility for any injury to people or property resulting from any ideas, methods, instructions or products referred to in the content. |
© 2023 by the authors. Licensee MDPI, Basel, Switzerland. This article is an open access article distributed under the terms and conditions of the Creative Commons Attribution (CC BY) license (https://creativecommons.org/licenses/by/4.0/).