Abstract
The whistle of the rail train is usually directly controlled by the driver. However, in long-distance transportation, there is a risk of traffic accidents due to driver fatigue or distraction. In addition, the noise pollution of the train whistle has also been criticized. In order to solve the above two problems, an intelligent whistling system for railway trains based on deep learning is proposed. The system judges whether to whistle and intelligently adjusts the volume of the whistle according to the road conditions of the train. The system consists of a road condition sensing module and a whistling decision module. The former includes the target detection model based on YOLOv4 and the semantic segmentation model based on U-Net, which can extract the key information of the road conditions ahead; the latter is to carry out logical analysis of the data after the intelligent recognition and processing and make the whistling decision. Based on the train-running data set, the intelligent whistle system model is tested. The results of this research show that the whistling accuracy of the model on the test set is 99.22%, the average volume error is 1.91 dB/time, and the Frames Per Second (FPS) is 18.7 f/s. Therefore, the intelligent whistle system model proposed in this paper has high reliability and is suitable for further development and application in actual scenes.
1. Introduction
A railway signal is composed of a visual signal and an auditory signal. As the main auditory signal, the train whistle is used to communicate with the train operation management and reduce traffic accidents. Each country has issued regulations on the technical management of train operation, which specify the type of train whistle. Train drivers must honk in strict accordance with the regulations [1,2,3]. However, in the process of driving, it is impossible for drivers to maintain a high degree of concentration at all times. In addition, the sight may be blocked due to bad weather and other factors, so train traffic accidents occur from time to time. For example, 26 people were killed, and more than 130 were injured in the collision between a passenger train and a freight train in Los Angeles on 12 September 2008. On 4 December 2011, a train and a car crash occurred in west-central France, which resulted in four deaths, including three children [4]. These tragic accidents exposed that the train whistle and brake system relying solely on human control has certain defects.
In terms of train noise control, current research and application are mainly divided into two categories [5,6]. One is to reduce the excitation intensity of the noise vibration source so as to reduce the acoustic energy radiated outward. For example, Wang et al. proved that the application of dynamic damper theory to low-floor railway trains could effectively reduce the vertical abnormal vibration of trains by establishing a vertical mathematical model and three-dimensional dynamic simulation model [7]; The other method is to increase the attenuation of noise by building noise barriers and other measures to reduce the impact on residential areas along the line. For example, Munemasa et al. studied the dynamic response of high noise barriers during the passage of high-speed trains and developed a practical evaluation method for the case of increasing the running speed in the future [8]. However, considering the actual economic benefits, it is difficult to popularize this vibration-reduction and noise-reduction equipment to the whole railway line. For example, noise barriers are usually only installed on key roads, such as densely populated residential areas, while their popularity is low in sparsely populated villages. At the same time, the train whistle has the characteristics of having a high pitch and being short, and the noise pollution caused by it is much higher than the train-running noise. Therefore, it is of great significance to study how to reduce the noise brought by the whistle while maintaining its safe-sounding effect [9].
With the rapid development of artificial intelligence, deep learning is widely used in computer vision [10], speech recognition [11], and fault diagnosis [12]. The continuous improvement of various efficient algorithms and processor computing power has provided a strong driving force for the intelligent and safe driving of trains [13]. At present, a large number of scholars have applied various deep-learning models to the field of railway transportation. For example, Lou et al. used a shallow information fusion convolutional neural network (SSIF-CNN) to effectively diagnose the bearing fault of a high-speed train axle box [14]. Yang et al. proposed a high-precision pole number recognition framework, including high-performance cascaded CNN-based detection and recognition YOLO (DR-YOLO) and time redundancy methods, and conducted extensive experimental research on four data sets representing the conventional working environment of high-speed trains [15]. The current whistle-control methods are based on remote communication technology and database retrieval [16]. Such methods rely too much on remote communication, so they can only achieve simple volume control in designated whistling-restricted areas or stations. At the same time, due to the poor adaptability of the database, it is unable to make real-time responses to pedestrians, vehicles, and new buildings near the track.
Therefore, this paper proposed an intelligent train whistle system based on deep learning, which provides a new idea for the application of artificial intelligence in the field of a train whistle and noise control. First, the front images captured by the dash cam were converted to 608 × 608 through undistorted Resize, then the converted images were put into the YOLOv4 model based on a train-running data set for target detection [17] and intelligently identified 11 types of target information, such as tracks, pedestrians, and vehicles in the scene, and then determined the current track through the anchor box weight mean ranking method; the detected anchor box area was semantically segmented by using the U-Net model [18] to determine the specific shape of the track. Finally, the whistling decision program can make reasonable whistling decisions based on the comprehensive consideration of space–time factors according to the current track shape, the location, and the size of each target.
2. Description of Data Set
2.1. Data Source
The data come from public videos of the first driving angle of trains in various countries on YouTube [19]. The data structure is close to the actual application scenario, and its shooting environment covers periods of time from day to night, sunny days, rainy and snowy days, driving scenes, including towns, uplands, meadows, jungles, canyons, etc., and is rich in occlusion and scale changes of the real environment. The visual angle of the video is facing the direction of the train. The camera is located about 2 m above the railway track, and the image resolution is higher than 1280 × 720. Figure 1 shows the diversity of data sets. Table 1 shows the specific information of data sources.
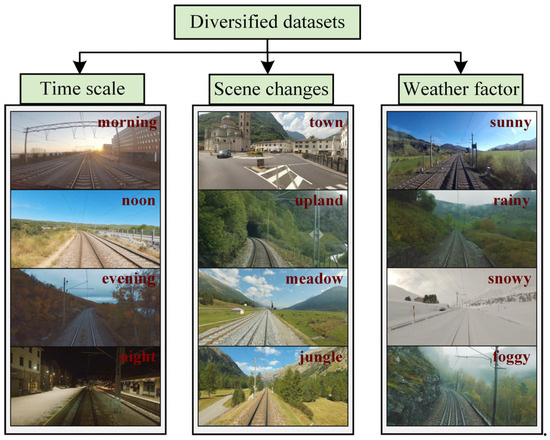
Figure 1.
Diversified data sets.

Table 1.
Specific information of data sources.
2.2. Data Cleansing
During this study, we performed picture capture and data preprocessing for the selected video. Due to the correlation of time series between video frames, the background of adjacent frames has a high similarity with the identified target. In order to prevent redundant data from causing model overfitting [20], all selected frames must maintain a time difference of more than 3 s and not take pictures when the train is paused.
Considering that the input size of YOLOv4 is 608 × 608, the resize operation can adaptively convert pictures of different sizes to this resolution, but due to the requirement of no distortion, square pictures have a higher effective resolution after processing, so secondary areas on the left and right edges of the image are removed. The processing effect is shown in Figure 2.
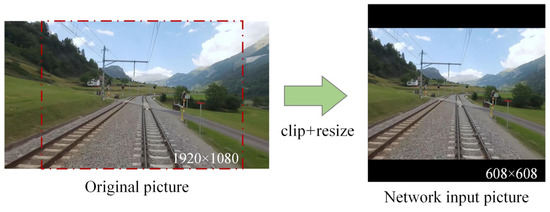
Figure 2.
Data clipping and resizing.
2.3. Label Description
According to the relevant regulations of railway technology management and in combination with the actual noise reduction requirements, the data set constructed contains 11 types of labels: straight track, curved track, pedestrian, vehicle, house, village, crossing, bridge, tunnel, whistling sign, and operation sign.
Straight track and curved track are used as labels to enable the model to identify the type and shape of the running track so as to enhance the safety of the train when passing the curve. The recognition of pedestrians and vehicles can effectively prevent trains from colliding with them, so these two types of labels are added. In order to reduce the noise pollution of the train to the residential area near the track, the labels of houses and villages are added. When the system recognizes the houses and villages in front, it will suppress the whistle and whistle volume. According to relevant regulations, when the train enters the crossing, bridge, and tunnel, it needs to whistle in advance to inform the personnel ahead to notice the arrival of the train. Whistling sign is usually set 500~1000 m in front of crossing, bridge, tunnel, and places with poor visibility. The operation sign is set at 500~1000 m from the construction line and its adjacent line to both ends of the construction site, prompting the driver to sound the horn in advance and notify the construction personnel ahead to evacuate. The whistling and operation signs are shown in Figure 3.
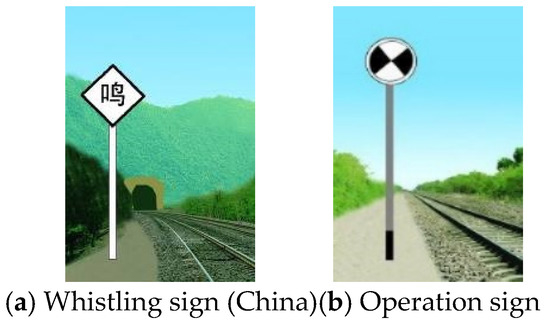
Figure 3.
Whistling sign and operation sign.
In order to alleviate the imbalance of data samples in the original data set, local clipping, scaling, mirroring, and other methods are used for the categories with small sample numbers to ensure that the number of such samples is not less than 500 [21], and the focal loss method is used for sample equalization in the training phase [22]. Table 2 shows the number of labels in the train operation data set.

Table 2.
Number of Labels.
2.4. Data Set Division
The original data set is 8048 frames of images from 16 train-running videos. After data cleaning and data enhancement, the data set is expanded to 9000 samples. Now, the dataset is randomly divided by 8:1:1. There are 7200 samples in training sets, 900 samples in verification sets, and 900 samples in test sets.
3. Road Condition Sensing Module
The function of the road condition recognition module is to intelligently recognize the front image taken by the camera. Figure 4 shows the topology of the intelligent whistle system. The workflow of the road condition recognition system is shown in the left part of Figure 4.
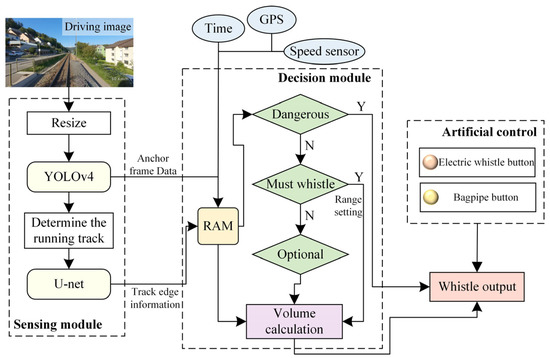
Figure 4.
Intelligent whistle system.
Firstly, the program uses the YOLOv4 model based on a train-running data set to detect 11 types of key objects that may exist in the image. After determining the current track, the program uses the U-Net model to segment the main track anchor box region semantically. Finally, it records the size and location information of the identified object as the basis for the next whistle judgment.
3.1. Target Detection Model Based on YOLOv4
- (1)
- Model Structure
YOLOv4 is a model proposed by Alexey Bochkovskiy et al. on CVPR in 2020. Some optimization strategies were added based on YOLOv3, mainly including the following: (1) upgrade Darknet53 to CSPMarknet53 to improve the backbone feature extraction network; (2) SPP and PANet structures are used to improve the strong feature extraction network; (3) a mosic data-enhancement method is used; (4) take CIOU as regression Loss; (5) Mish activation function is used. Figure 5 shows the network structure of YOLOv4.
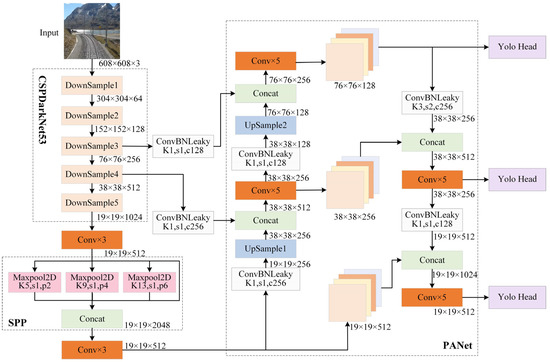
Figure 5.
Network structure of YOLOv4.
- (2)
- Model Training
The deep learning framework used in this paper is PyTorch, developed by the Facebook artificial intelligence research institute [23], and the model is trained on a computer with Intel Core i7-11800H CPU and NVIDIA GeForce RTX3060 GPU. In order to ensure the reliability of the experiment, the subsequent tests of the model are carried out on the same platform. Table 3 shows the training parameters of YOLOv4.

Table 3.
Training parameters of YOLOv4.
In order to ensure the efficiency and accuracy of training, the weight of YOLOv4 based on the VOC2007 dataset was used as the model pretraining weight [24,25]. The training process was divided into freezing and unfreezing stages. In the freezing phase, the weight of the model backbone is frozen so that the feature extraction network does not change; in the unfreezing phase, the weight is not locked [26]. In addition, the focal Loss method was used for optimization. By increasing the weight of difficult-to-distinguish samples in the Loss function, the Loss function tends to be difficult to distinguish, which helps to improve the accuracy of small sample categories and alleviates the problem of the uneven number of sample categories. The training results are shown in Figure 6. To speed up the training, the mean Average Precision (mAP) of the validation set is updated every ten Epochs [27].
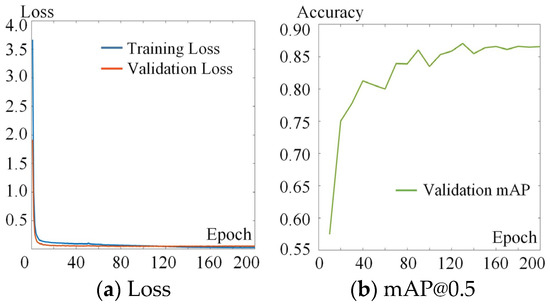
Figure 6.
Training Loss and mAP of YOLOv4.
It can be seen from Figure 6 that the model training process is relatively stable and has almost converged after 80 Epochs of training. At the end of the training, the Loss of the model on the training set and verification set is 2.76 × 10⁻² and 5.21 × 10⁻², the mAP values on the verification set and test set are 86.45% and 86.26%, and the average Frames Per Second (FPS) is 26.4 f/s. Table 4 shows the specific performance of YOLOv4 on the test set when IoU is 0.5.

Table 4.
Results of YOLOv4 on test set.
The evaluation index mAP can effectively evaluate the recognition effect of the model. This parameter is composed of Precision and Recall. The definition of Precision and Recall is as follows.
where TP refers to the number of positive cases identified as positive cases by the model; FP represents the number of false cases identified as positive cases by the model; FN indicates the number of positive cases identified as false cases by the model. Therefore, Precision represents the proportion of correct positive predictions to all positive predictions, and Recall represents the proportion of correct positive predictions to all actual positive. AP is defined as the area of the interpolated precision–recall curve and the X-axis envelope. It can be expressed as
where , , …, are the Recall corresponding to the first interpolation of the Precision interpolation segment in ascending order. When there are K types of targets, the formula of mAP can be expressed as
3.2. Identification Method of the Driving Track
In order to ensure the safety of the train, the road condition identification system will focus on detecting whether there is an intrusion near the track. Before that, the model needs to identify the current track. The main problems solved are as follows:
- As straight and curved roads belong to different types, therefore, for the same track (usually the track with small curvature), there may be two anchor boxes, straight and curved.
- When there are multiple tracks in the captured front image, the model needs to confirm which track the train is currently running on.
For problem 1, the Non-Maximum Suppression (NMS) algorithm was used [28]. Traditional NMS was used to suppress non-maximum targets of the same kind and search for the local maximum of such targets. Read straight and curved roads identified by the YOLOv4 model and regard them as the same kind of targets, then perform the NMS algorithm with an intersection and merger ratio threshold of 0.5 to eliminate overlapping anchor boxes. The effect of NMS is shown in Figure 7.
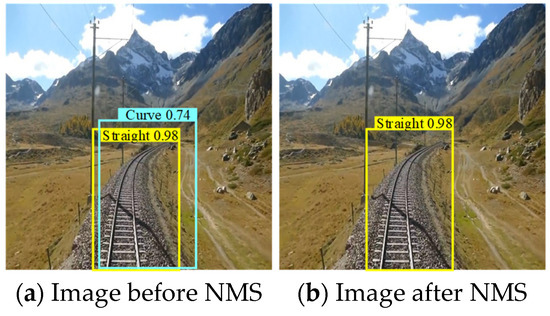
Figure 7.
The effect of NMS.
For problem 2, a new method of the weighted mean ordering of anchor box was proposed. This method determines the track of the anchor box where the maximum value is located as the current running track of the train by calculating and ranking the average weight of each track anchor box area under the weight matrix. Because the camera position is relatively fixed, the main track must appear in the middle and the lower part of the image. Therefore, a weight matrix W with the same size as the original image was set. The weight value in the matrix was set to meet the rule that the greater the probability of the main track, the greater its value. A circle O was added at 608 × 608 size image; the result is shown in Figure 8.
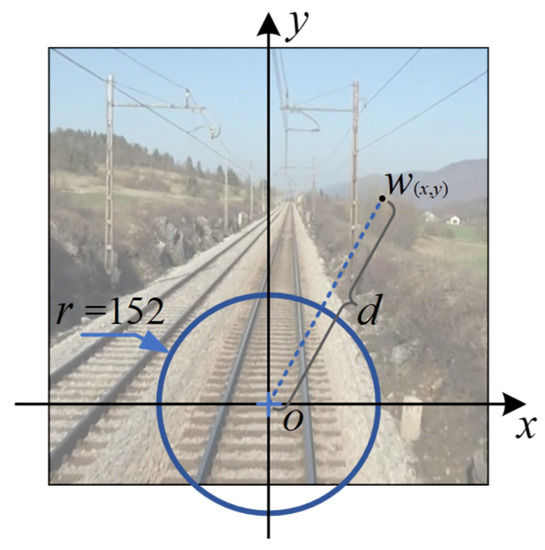
Figure 8.
Construction of weight matrix.
The radius of circle O is one-quarter of the image width. The Cartesian coordinate system can be established with the center of the circle as the origin and the distance between the left and right adjacent pixels as the unit distance. Then, the equation of the circle can be obtained.
The corresponding image range can be expressed as.
Then, fill the area within this range with reasonable weight. Set the weight value corresponding to the origin as 1 and the weight value of all points on the circle as 0. The pixel farther from the center of the circle has a smaller weight value. The law of decline meets the following equation.
where w(x, y) represents the weight of any point on the image, and d represents the Euclidean distance from the point to the center of the circle. The weight attenuation function corresponding to w(x, y) is shown in Figure 9.
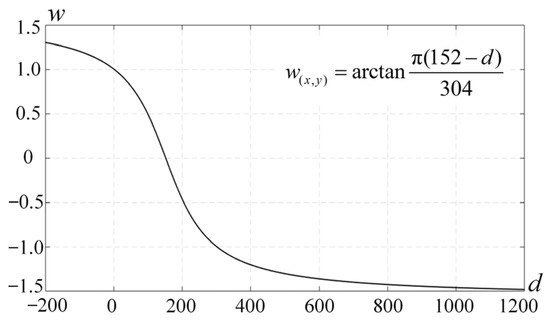
Figure 9.
Weight attenuation function.
Each position of the picture corresponds to a weight w(x, y). When d is 152, w(x, y) is 0, and the trend of rapid decline is presented. This is to correspond to the trend of rapid decline in the probability of the travel track area appearing outside the circle. Assume that the model identifies several rails; its respective anchor box information can be expressed as.
According to the position and size of each anchor box, calculate the weight of each anchor box in the weight matrix, and the average value can be obtained as follows:
As shown in Figure 10, for the two rail anchor boxes detected by the model in Figure 8, calculate the weight mean value, respectively, and the mean values of anchor box 1 and anchor box 2 are −0.3307 and 0.1571, respectively. Therefore, the track identified by anchor box 2 is set as the current running track.
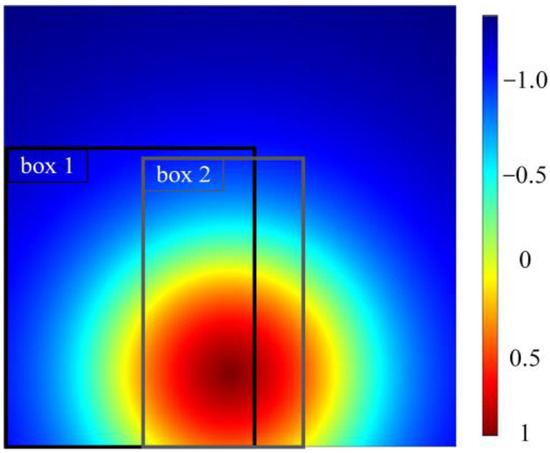
Figure 10.
Color gamut of weight matrix.
3.3. U-Net Semantic Segmentation Model
- (1)
- Model structure
The whistling system needs to recognize the spatial relationship between the main track and the surrounding objects, so the main track anchor box image needs to be separated into semantic segments to extract its shape information. The U-Net is a variant of Fully Convolutional Networks (FCN), which is the most commonly used and relatively simple semantic segmentation model [29]. Its structure is shown in Figure 11.
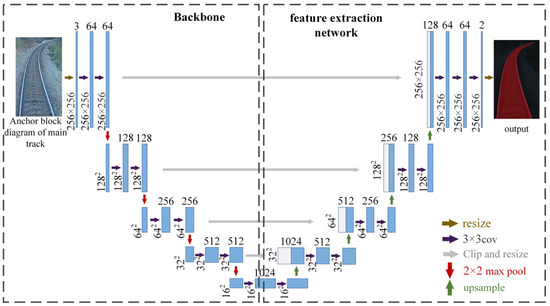
Figure 11.
U-Net network structure.
- (2)
- Model training
Since the system only needs to identify the shape of the current track, the pictures of the main track anchor box area identified by the YOLOv4 model were cut out separately and input into U-Net. In this case, the model only needs to identify the background and rail, and segmentation is less difficult. Therefore, in order to reduce the computation and improve the model FPS, the network input size was adjusted to 256 × 256. The data set used for training was 800 pictures of the track anchor box area identified by YOLO from the train-running data set. After labeling these samples, they are randomly divided into the training set and the verification set according to the proportion of 8:2. Table 5 shows the parameters related to model training.

Table 5.
Training parameters of U-Net.
The model training results are shown in Figure 12. The whole process is relatively stable. After 100 Epochs of training, the Loss and mAP of the model tend to converge. At the end of the training, the Loss of the model on the training set and verification set is 6.58 × 10⁻³ and 1.31 × 10⁻², and the mAP on the validation set is 98.81%.
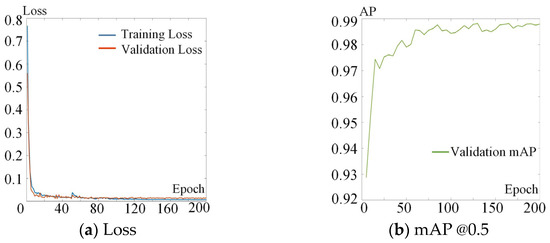
Figure 12.
Training Loss and mAP of U-Net.
4. Whistling Decision Module
4.1. Module Overview
The whistle decision module adopts a rule-based decision algorithm [30,31]. The whole whistling decision module can be divided into three parts: scene segmentation module, volume calculation module, and horn control module. First, the whistling decision module divides the current driving scene of the train through the data obtained by the perception system, calculates the reasonable volume according to the volume setting rules corresponding to the divided scene, and finally, controls the volume output according to the finite state machine (FSM) method of rule logic control. The design criteria of the system are to ensure good real-time performance, take safety as the highest priority, and reduce noise pollution as the goal.
Scene division is the first step of the decision-making system, which divides various driving scenes into the dangerous scene, the scene of must whistling, and the scene of selective whistling. Table 6 shows the whistle settings for three scenarios.

Table 6.
The whistle settings for three scenarios.
4.2. Dangerous Scene
Dangerous scenes refer to emergency scenes that may endanger the safety of train operations or cause casualties. To divide the current scenes into dangerous scenes, two conditions must be met: (1) the speed of the train must be greater than 30 km·h−1; (2) intrusive objects (such as pedestrians, vehicles, and so on) exist near the track. To judge condition 2, it is necessary to set the minimum safe distance between the intruder and the track. Since the input image has three channels, the program cannot directly obtain the distance between the train and the intruder. However, because the camera’s angle of view is relatively fixed, the size of the object in the image relative to this kind of object can be used as the reference standard for the distance between the object and the train. Taking the distance between adjacent pixels in the horizontal direction of the image after resizing as the unit distance, the calculation formula of the safe distance between each object and the track can be written as follows:
where d represents the minimum allowable safe distance from the bottom center point of the object anchor box to the track edge, v represents the driving speed (m/s), and S1 represents the anchor box area of the identified object; S2 is adaptive constant; when calculating the safe distance to pedestrians and vehicles, the values are 5 × 10³ and 1 × 10⁴, respectively; σ is the coefficient added to prevent the safe distance from being too small, and its value is usually 1 × 10⁻³.
By calculating the allowable safe distance d between the train and potential invaders at the current speed, the range of 1~1.5d from the track was divided into areas where the whistle must be sounded, and the farther areas will not play a role or inhibit the volume of whistling. Figure 13 shows the effect diagram of the safe area division for pedestrians at the speed of 80 km·h−1.
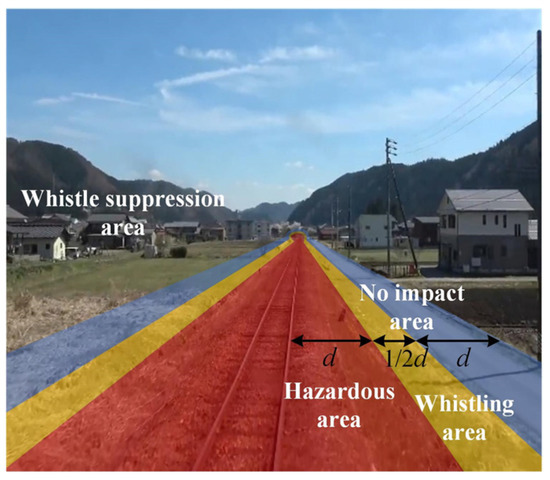
Figure 13.
Influence of different positions of pedestrians on whistling.
4.3. Scene of Must Whistling
The scene that must whistle refers to when the train passes by according to relevant laws and regulations, including bridge, tunnel, crossing, and construction site. These places are often the places where train accidents occur frequently. When trains pass these places, necessary whistling can well inform the people ahead of time to evacuate, thereby reducing the occurrence of safety accidents.
After confirming that the current scene is a non-dangerous scene, it is necessary to make a decision on the must whistle scene. Different from the dangerous scene, its volume output is based on the identification of target data, with reference to the current time and train speed, and the minimum threshold of volume is 90 dB.
4.4. Scene of Selective Whistling
The discrimination of the scene of selective whistling is at the end of the series structure, but it is the environment that the train has been in for a long time. It is the most effective and reasonable to reduce the noise of the whistle in this scene.
The corresponding whistling volume is 100~80 dB, and the lowest volume is 80 dB, which is equivalent to the whistling intensity of a family car. The noise pollution generated is relatively small. This kind of whistling is usually realized when the train passes through an area where whistling is required at night, but there is a residential area nearby. At night, due to the characteristics of low passenger flow along the railway, dark and quiet environment, the train having the light signal of headlights and the vibration sound signal is generated by its own driving, the low volume whistle can meet the safety and the noise reduction needs of the scene [32].
4.5. Whistling Volume Formula
Except for the difference in some initial values and thresholds, the whistling volume formula will be used to calculate the reasonable volume in both must and selective whistle scenarios. Its inputs are time, train speed, and target information identified by the sensing system. After comprehensive consideration of these parameters, the whistling decision program outputs the corresponding volume, and its formula is shown in Table 7.

Table 7.
Whistling volume formula.
4.6. Horn Control
The horn adopts the control method based on FSM. FSM has four elements: present state, condition, action, and next state. The corresponding state transition rules are shown in Figure 14. The train is equipped with a bagpipe and electric whistle, with a corresponding volume range of 100~110 dB and 80~100 dB. The train can only be in one of three states: no whistle, bagpipe works, or electric whistle works. After the decision system divides the current scene and calculates the whistle volume, it will generate the movement from the present state to the next state according to the conditions met. In addition, the system has set an additional manual control route, which can play an important role when the intelligent system works abnormally. In the practical application and future development, more complex control structures can be established according to the specific parameters and functions of the horn to realize the control of tone, whistle time, and combined whistle signal.
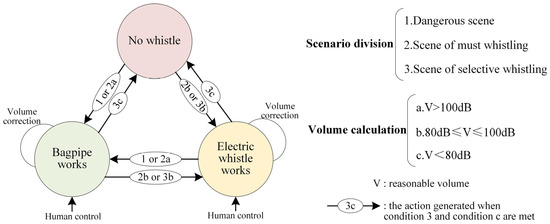
Figure 14.
State transition diagram of the state machine.
5. Model Performance Test
5.1. Reactivity Test
The responsiveness of the whistling system plays a vital role in intelligent and safe driving. The core indicators of the control system are how far ahead key objects can be identified and how long it takes to make a whistle judgment on the current scene [33,34]. The test method is to input the recognition network in the form of a video, so the network input is a series of pictures of the target to be identified from far to near, and these images do not appear in the training and verification sets. Figure 15 is a screenshot of some test images.
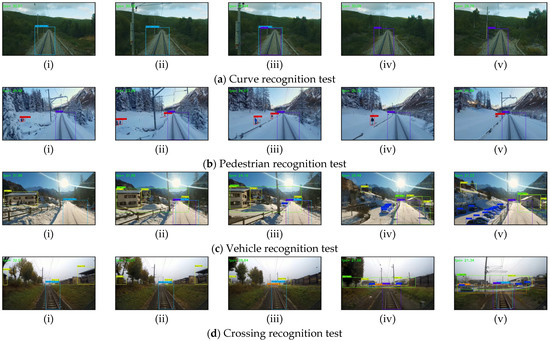

Figure 15.
Test effect of recognition distance of model to object.
In Figure 15, the timeline is from left to right. By estimating the distance of the picture of the identified object captured by the YOLOv4 model for the first time in multiple groups of videos, the detection distance data of the whistling system to the target is obtained. The deep learning series algorithm belongs to the black box model, so it is unable to carry out a specific mathematical description of the identification features and internal logic [35]. At the same time, the recognition effect of the model is affected by the picture quality, light, and other factors, so the average value of target recognition distance in multiple scenes is taken as the index to evaluate the model recognition ability. The detailed data are shown in Table 8.

Table 8.
Effective detection distance of model to objects.
It can be seen from Table 8 that the recognition distance of the system for each object is mostly larger than 100 m, but for some small targets, the recognition distance of the model is relatively limited.
The size of the entire intelligent whistle system is 349MB, and the FPS is about 18.7 f/s. Under this performance, assuming that the train is running at 100 km/h, and considering the calculation speed of the system and the propagation speed of the sound, pedestrians have about 2.9 s to evacuate after hearing the whistle. If the pedestrian is not in the restricted movement state, this time is enough for the pedestrian to evacuate.
5.2. Accuracy Test of Whistling System
The accuracy of the whistling system depends on whether the whistling command is correct and on the accuracy of the whistling volume. This indicator is used to evaluate the safety and noise reduction effect of the train whistling system. To test the accuracy of the whistling system, firstly, 900 pictures in the test set were evaluated to determine their reasonable whistling volume values, then these pictures were input into the intelligent recognition system and the decision system in turn, and the prediction results of the model output were compared with the correct volume values to calculate the accuracy of the whistling system. After testing, the accuracy of the system is 99.22%, and the average volume error of the system is 1.91 dB/time. Figure 16 shows the volume control performance of the model on the test set.
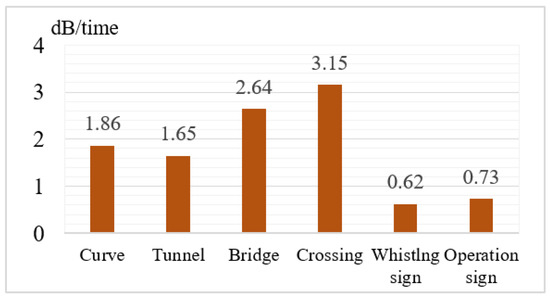
Figure 16.
Volume error on test set.
It can be seen from Figure 16 that the volume error of the whistling system is small. In more complex places, such as crossings and bridges, the whistling volume error will be about 3dB, and the whistling volume in other scenes is relatively accurate, with the average value below 2dB. This shows that the intelligent whistle system designed can effectively and intelligently control the whistle volume according to the actual scene, so as to achieve the goal of safe noise reduction.
5.3. Model Performance and Application Analysis
In order to improve the safety of train operation and reduce the noise pollution caused by a train whistle, this paper applies deep learning technology to the intelligent control of train whistle for the first time and provides a new idea for the application of artificial intelligence in the field of train noise control. The whole system is composed of a road condition sensing subsystem and a whistling decision subsystem. The road condition sensing subsystem is divided into a target recognition module, a current track confirmation module, and a semantic segmentation module. The whistling decision subsystem is divided into a scene segmentation module, a volume calculation module, and a horn control module.
First of all, in terms of security, the model adopts the YOLOv4 target detection algorithm based on train operation data set training and achieves 86.26% mAP for 11 key targets in the test set. It can be seen from Table 4 that the mAP of the model is greater than 85% for most targets, but the mAP for pedestrians and crossings is slightly lower, 77.27% and 78.06%, respectively. It can be seen from Table 8 that the recognition distance of the model for each target is mostly longer than 100 m, but the recognition distance for pedestrians, crossings, whistling signs, and operating signs is slightly shorter. Among them, whistling signs and operating signs pay more attention to recognition accuracy, and the requirements for the recognition distance are slightly lower. By bringing it into the actual scene, it is concluded that with the current recognition ability of the model, the intruders can safely evacuate before the train arrives if they are not restricted in their own movement. In addition, the whistle system has natural advantages in response time. Based on the RTX3060, the whistling system designed in this paper can reach about 19 f/s, and its corresponding response time is 53 ms, while the human response speed is about 300 ms, and human beings cannot always maintain a high concentration of attention as machines.
As for the volume control of the whistle, the model adopts the idea of dividing and conquering. By dividing the running scene of the current train, and then, according to the volume formula set in the corresponding scene, a reasonable volume is obtained, and the efficient control of the horn is realized. In the accuracy test of the whistling system, the accuracy of the system can achieve 99.22%, and the average volume error is 1.91 dB/time, so the overall accuracy of whistle control is good. The traditional whistle-control method based on remote positioning and database retrieval can only achieve limited volume control in some scenes, and the volume selection space is small. In contrast, the model proposed in this paper is more real-time and flexible and can make a comprehensive decision with full reference to the target information, train speed, and time in the train-running scene.
However, there are still some aspects to be improved in the intelligent whistle system. For example, the perception accuracy of the model for pedestrians and intersections is limited, which exposes its insufficient recognition ability for small and complex targets. In this regard, future research can be improved by adopting models with stronger recognition ability and adding optimization algorithms to strengthen the recognition ability of small targets. In addition, the perception ability of the model will be reduced due to insufficient light at night. In this regard, the target detection capability of the model can be improved by adding infrared cameras or depth cameras, using additional network input channels, or building road traffic signs for assistance [36]. In terms of the functional scope, the intelligent model in this paper still stays in control of the volume of the whistle. Future research can add more functions to the model, such as tone control, combined whistle mode for communication between trains, and identification function for stations and traffic lights.
6. Conclusions
In this paper, in order to solve the problem of increasing the risk of train traffic accidents due to driver fatigue or distraction and the problem of noise pollution caused by a train whistle, an intelligent whistling system for railway trains based on deep learning is proposed, and the following conclusions are obtained:
- (1)
- The method of connecting the YOLOv4 object detection model and the U-Net semantic segmentation model in series and adopting a rule-based decision algorithm to intelligently control the train whistling has high feasibility.
- (2)
- The designed algorithm combining the NMS algorithm for different categories with the anchor box weight mean ranking method can effectively confirm the current track of the train. At the same time, under the condition of three channels of input images, the designed road scene division method and whistling formula can adjust the corresponding volume of 11 types of detection targets.
- (3)
- The performance test based on the train-running data set shows that the FPS of the model reaches 18.7 frames/second, the accuracy of the whistling system is 99.22%, and the volume error of the whistling system is 1.91 dB/time.
- (4)
- The subsequent research can focus on improving the small target recognition ability of the model, model lightweight, improvement of the decision algorithm, expanding the model functions (such as adding the recognition of stations and indicator lights), and adding the system design research under the depth direction data.
Author Contributions
K.W.: formal analysis, investigation, software, methodology, writing—original draft; Z.Z.: formal analysis, investigation, methodology, software, writing—original draft; C.C.: funding acquisition, methodology, project administration, supervision, writing—review and editing; J.R.: formal analysis, methodology, validation, and writing—review and editing; N.Z.: methodology, funding acquisition, investigation, and writing—review and editing. All authors have read and agreed to the published version of the manuscript.
Funding
This work was supported by the Nature Science Foundation of Hebei Province under grant no. E2020402060, and Key Laboratory of Intelligent Industrial Equipment Technology of Hebei Province (Hebei University of Engineering) under grant No. 202204 and 202206.
Institutional Review Board Statement
Not applicable.
Informed Consent Statement
Not applicable.
Data Availability Statement
Not applicable.
Conflicts of Interest
The authors declare no conflict of interests.
References
- Ministry of Railways of the People’s Republic of China Regulations on Railway Technology Management; China Railway Press: Beijing, China, 2006; pp. 24–31.
- Huang, Y.; Feng, S. Comparative analysis on domestic and foreign regulations on railway technology management. Railway Qual. Control 2016, 44, 3–7. [Google Scholar]
- Lopez, I.; Aguado, M.; Pinedo, C. A step up in European rail traffic management systems: A Seamless Fail Recovery Scheme. IEEE Veh. Technol. Mag. 2016, 11, 52–59. [Google Scholar] [CrossRef]
- Zhang, Z.P.; Liu, X. Safety risk analysis of restricted-speed train accidents in the United States. J. Risk Res. 2020, 23, 1158–1176. [Google Scholar] [CrossRef]
- Jie, Z.; Xin, B.X.; Xiao, Z.S.; Dan, Y.; Rui, Q.W. An acoustic design procedure for controlling interior noise of high-speed trains. Appl. Acoust. 2020, 168, 107419. [Google Scholar]
- Anlar, O.; Ksili, M.; Tombul, T.; Ozbek, H. Three-dimensional multiresonant lossy sonic crystal for broadband acoustic attenuation: Application to train noise reduction. Appl. Acoust. 2019, 146, 1–8. [Google Scholar]
- Wang, Q.S.; Jing, Z.; Lai, W.; Cheng, Z.; Bin, Z. Reduction of vertical abnormal vibration in carbodies of low-floor railway trains by using a dynamic vibration absorber. Proc. Inst. Mech. Eng. Part F. J. Rail Rapid Transit 2018, 232, 1437–1447. [Google Scholar] [CrossRef]
- Munemasa, T.; Masamichi, S.; Tetsuo, S. Dynamic response evaluation of tall noise barrier on high-speed railway structures. J. Sound Vib. 2016, 366, 293–308. [Google Scholar]
- Nemec, M.; Danihelova, A.; Gejdos, M. Train noise-comparison of prediction methods. Acta Phys. Pol. 2015, 127, 125–127. [Google Scholar] [CrossRef]
- Naqvi, R.A.; Arsalan, M.; Qaiser, T.; Khan, T.M.; Razzak, I. Sensor data fusion based on deep learning for computer vision applications and medical applications. Sensors 2022, 22, 8058. [Google Scholar] [CrossRef]
- Alsayadi, H.A.; Abdelhamid, A.A.; Hegazy, I. Arabic speech recognition using end-to-end deep learning. IET Signal Process. 2021, 2, 521–534. [Google Scholar] [CrossRef]
- Xue, Y.F.; Cai, C.Z.; Chi, Y.L. Frame structure fault diagnosis based on a high-precision convolution neural network. Sensors 2022, 22, 9427–9442. [Google Scholar] [CrossRef] [PubMed]
- Fan, J.; Ma, C.; Zhong, Y. A selective overview of deep learning. Stat. Sci. 2021, 36, 264–290. [Google Scholar] [CrossRef] [PubMed]
- Luo, H.L.; Bo, L.; Peng, C.; Hou, D.M. Fault diagnosis for high-speed train Axle-Box bearing using simplified shallow information fusion convolutional neural network. Sensors 2020, 20, 4930. [Google Scholar] [CrossRef] [PubMed]
- Yang, Y.; Wen, S.Z.; Ze, W.H.; Ding, L. High-speed rail pole number recognition through deep representation and temporal redundancy. Neurocomputing 2020, 415, 201–214. [Google Scholar] [CrossRef]
- Lin, X.Z.; Yang, D.W.; Gao, W. Study on vibration and noise reduction of semi-or fully enclosed noise barriers of high-speed railways. Noise Vib. Control. 2018, 38, 8–13. [Google Scholar]
- Bochkovskiy, A.; Wang, C.Y.; Liao, H. YOLOv4: Optimal speed and accuracy of object detection. arXiv 2020, arXiv:2004.10934. [Google Scholar]
- Olaf, R.; Philipp, F.; Thomas, B. U-Net: Convolutional networks for biomedical image segmentation. In Medical Image Computing and Computer-Assisted Intervention–MICCAI 2015, Proceedings of the 18th International Conference, Munich, Germany, 5–9 October 2015; Part III 18; Springer International Publishing: Berlin/Heidelberg, Germany, 2015; pp. 234–241. [Google Scholar]
- Cab Ride St. Moritz-Tirano, Switzerland to Italy. Available online: http://www.youtube.com (accessed on 27 May 2022).
- Joost, P.B.; Menno, P.R.; van Gent Marcel, R.A. Deep learning video analysis as measurement technique in physical models. Coast. Eng. 2020, 158, 103689. [Google Scholar]
- Zhun, Z.; Liang, Z.; Guo, L.K. Random erasing data augmentation. Proc. AAAI Conf. Artif. Intell. 2020, 34, 13001–13008. [Google Scholar]
- Lin, T.Y.; Goyal, P.; Girshick, R. Focal loss for dense object detection. IEEE Trans. Pattern Anal. Mach. Intell. 2020, 42, 318–327. [Google Scholar] [CrossRef]
- Paszke, A.; Gross, S.; Massa, F. PyTorch: An imperative style, high-performance deep learning library. arXiv 2019, 721, 8026–8037. [Google Scholar]
- Everingham, M.R.; Eslami, S.; Gool, L.J. The pascal visual object classes challenge. Int. J. Comput. Vis. 2015, 111, 98–136. [Google Scholar] [CrossRef]
- Huan, L.; Guang, J.; Rui, Y. Object localization using positive features. Neurocomputing 2016, 171, 463–470. [Google Scholar]
- Zhu, D.H.; Dai, X.Y.; Chen, J.J. Pre-train and learn: Preserving global information for graph neural networks. J. Comput. Sci. Technol. 2021, 36, 1420–1430. [Google Scholar] [CrossRef]
- Li, Q.; Ding, X.; Wang, X. Detection and identification of moving objects at busy traffic road based on YOLOv4. Inst. Internet Broadcast. Commun. 2021, 1, 141–148. [Google Scholar]
- Bodla, N.; Singh, B.; Chellappa, R. Soft-NMS -- Improving object detection with one line of Code. IEEE Int. Conf. Comput. Vis. 2017, 6, 5562–5570. [Google Scholar]
- Long, J.; Shelhamer, E.; Darrell, T. Fully convolutional networks for semantic segmentation. IEEE Trans. Pattern Anal. Mach. Intell. 2015, 39, 640–651. [Google Scholar]
- Chen, X.M.; Tian, G.; Miao, Y.S. Driving rule acquisition and decision algorithm to unmanned vehicle in urban traffic. Trans. Beijing Inst. Technol. 2017, 37, 491–496. [Google Scholar]
- Liu, H. Train unmanned driving algorithm based on reasoning and learning strategy. Unmanned Driv. Syst. Smart Trains 2021, 1, 101–151. [Google Scholar]
- Keysha, W.Z.; Anugrah, S.S.; Joko, S. Noise comparison of Argo Parahyangan train in different class and journey time. AIP Conf. Proc. 2019, 2088, 050014. [Google Scholar]
- Bo, Z.; Joost, W.; Silvia, V. Determinants of take-over time from automated driving: A meta-analysis of 129 studies. Transp. Res. Part F Psychol. Behav. 2019, 64, 285–307. [Google Scholar]
- Papini, G.; Plebe, A.; Mauro, D.L. A reinforcement learning approach for enacting cautious behaviours in autonomous driving system: Safe speed choice in the interaction with distracted pedestrians. IEEE Trans. Intell. Transp. Syst. 2021, 99, 1–18. [Google Scholar]
- Riccardo, G.; Anna, M.; Salvatore, R. A survey of methods for explaining black box models. ACM Comput. Surv. 2018, 51, 1–42. [Google Scholar]
- Ji, D.C.; Min, Y.K. A sensor fusion system with thermal infrared camera and LiDAR for autonomous vehicles: Its calibration and application. In Proceedings of the 2021 Twelfth International Conference on Ubiquitous and Future Networks (ICUFN 2021), Jeju Island, Republic of Korea, 17–20 August 2021; pp. 361–365. [Google Scholar]
Disclaimer/Publisher’s Note: The statements, opinions and data contained in all publications are solely those of the individual author(s) and contributor(s) and not of MDPI and/or the editor(s). MDPI and/or the editor(s) disclaim responsibility for any injury to people or property resulting from any ideas, methods, instructions or products referred to in the content. |
© 2023 by the authors. Licensee MDPI, Basel, Switzerland. This article is an open access article distributed under the terms and conditions of the Creative Commons Attribution (CC BY) license (https://creativecommons.org/licenses/by/4.0/).