Abstract
There is a great deficiency in the collection and disposal of solid waste, with a considerable amount disposed of in dumps instead of in landfills. In this sense, the objective of this research is to propose a solid waste mitigation plan through recovery in the District of Santa Rosa, Ayacucho. For this, a solid waste characterization plan was executed in eight days, and through ANOVA it was shown that there is a significant difference in means between business pairs except between a bakery and a hotel. Through clustering, zones A and B are highly correlated, reflecting that the amount of organic waste was greater than inorganic waste. In the organic waste valorization plan, the results through ANOVA indicate a significant difference for monthly and daily averages, and the clustering shows the different behavior of each month, drawing attention to August, concluding that the valorization pilot plan is viable due to the contribution of a large amount of organic solid waste to the valorization plant.
1. Introduction
Urban growth requires greater spending and investment in goods and services and generates improvements in terms of waste management, called waste or solid waste (SW), which is mostly organic [1,2]. SW has an environmental impact, which increases as urban areas grow and time progresses. Poor SW management facilitates the deterioration of green areas, leaving society at greater risk [3,4]. The projection for 2050 estimates an increase of 3.05 billion tons of total waste per year, a value much higher than that of 2016, with a total of 2.01 billion tons [5,6]. However, organic waste is projected to decrease from 49 to 37 percent [5,7,8].
Given this context, decision making to appropriately redirect industrialization and urbanization to prevent the explosive growth of SW is inevitable [9,10]. For Latin America or other continents, sustainable management strategies can help recover and sustain green areas, thereby recovering urban ecosystems [11,12]. In this sense, there is a need to design protocols together with parallel processes that provide alternative waste management policies or complement existing techniques, such as low-cost composting or other more expensive strategies such as incineration, pyrolysis and gasification, among others [13,14].
Recent studies show how solid waste is potentially a usable energy source according to SW management and mitigation methodologies within the context of a circular economy [15,16], as is the case in the region of Guangdong, China, where municipal urban waste and other residues, such as manure from farms, can be recycled using properly efficient waste disposal methods [17,18].
In Latin America, solid waste management techniques seek to maintain an acceptable margin for public health, since the degree of environmental impact is undeniably linked to poor waste management or urban arrangements [19,20,21]. On the other hand, highly developed countries generally have well-developed systems for proper waste management, which directly impacts the economy, as well as the environment [22,23]. Peru, as well as other developing countries, tends to prioritize urban growth, which leaves a gap in solid waste management due to the rapid urban changes accompanying the growth of cities [24,25].
In Peru, the generation of organic SW from domestic use has varied, partially as a result of precautions taken during the COVID-19 pandemic, which is an indicator of promptly disposing of products to avoid affecting the health of residents [26,27,28]. In Ayacucho, Peru, possible SW management and mitigation measures are being evaluated due to the impact of COVID-19 [29]. Ayacucho is characterized by having limited resources and access together with a population distributed in rural and urban areas for both agricultural and typical urban activities [30]. Among the communities that stand out for the generation of waste is Occochaca, in the District of Huanta, where inadequate SW management led to outbreaks of hepatitis and anemia [31]. Close to Occochaca, is the populated center of Sacsamarca, Huancasancos province, with cases of gastrointestinal disorders, respiratory difficulties and notorious impact on livestock due to SW distributed and inadequately managed in the area [32]. In this sense, the set of factors that influence SW generation are the object of study in order to develop SW mitigation policies and procedures that make continuous development and prosperous urban growth possible. Given these reasons, the present study proposes generating appropriate organic SW management policies and systems to obtain a better understanding and extension of each of the sub-stages involved in the District of Santa Rosa, Ayacucho. The considerations are detailed below, as well as the set of protocols structured in the following order:
- The present study proposes to structure a set of methodological sequences to describe, quantify and segregate all organic SW generated as a product of urban consumption and design a mitigation plan.
- Using as a basis the approach developed by Kunitoshi [33], we develop a series of mitigation steps outlined in the literature that are sequentially ordered to provide a regular management policy for solid waste as proposed by MINAM.
- The focus is on the District of Santa Rosa because this high Andean area lacks resources and mitigation protocols for waste generated by urban and agricultural activities, since there is only street sweeping around parks and the market. In addition, collection is performed by trucks only in the district capital, leaving 42 communities without this service. Finally, the waste is disposed of in a dump without treatment.
- According to the results obtained in the municipal solid waste characterization study and the organic solid waste recovery pilot plan in the District of Santa Rosa, the development of a solid organic waste recovery plan to produce compost is proposed, in order to reduce the deposit of reusable waste in the municipal dump.
2. Materials and Methods
The methodology is based on the methodological guide for the development of a municipal solid waste characterization study, where it details the equipment, field materials, adequate inputs, and physical spaces needed for the collection, weighing and classification of samples. Solid waste will be segregated and sampled to evaluate per capita generation, density and physical composition according to its nature and source (residential, non-residential and special properties) with the corresponding labeling and registration for final disposal in sanitary landfills and/or the recovery of solid waste [33].
Considering the solid waste item and its impact on urban society, adequate management linked to protocols for the particular District of Santa Rosa are needed. Therefore, a solid waste characterization study (ECRS) is proposed with a subsequent recovery strategy, which is structured in Figure 1 [34,35].
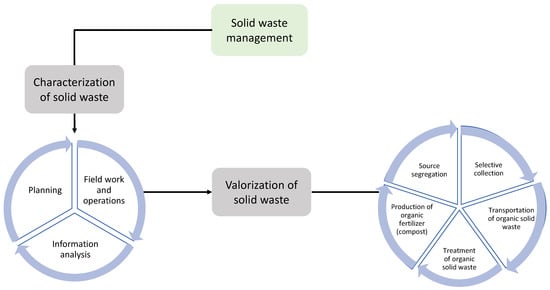
Figure 1.
Solid waste management and its corresponding sub-stages: Characterization and valorization.
2.1. Solid Waste Characterization
The intervention of district municipalities added to the implementation of management instruments allow obtaining data on solid waste from homes. For this, a sequence of steps based on the Kunitoshi Sakurai methodology was designed, where three levels were outlined (see Figure 2) [34,36].
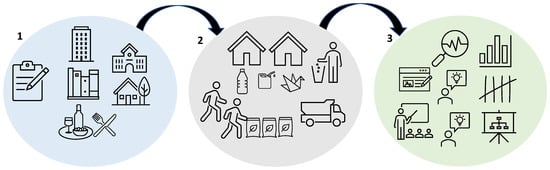
Figure 2.
Stages in the characterization of solid waste: 1: planning; 2: fieldwork and operations and 3: information analysis.
- Planning. Initially, the mayoral resolution (or municipal management resolution prepared by the head of the field team) is prepared that allows maintaining the structure of the work plan together with its projections for the properties, samples, identification of these and their subsequent analysis at the end of the collection. According to the ECRS Guide, to determine the number of samples for the study, official data from INEI 2017 [37] is taken into account, which indicates that the district has 3210 homes. According to the range of household samples established by the guide for the characterization of municipal solid waste, a sample size of 94 homes is considered, to which must be added 19 contingency samples, making a total of 113 household samples (see Table 1).
 Table 1. Determination of the sample size for the characterization study. CS: contingency sample and HS: home samples.To determine the distribution of the samples, the guide recommends dividing the study area into 2 strata (A and B) according to the number of homes in the district, with stratum A being considered as an area with a greater number of homes and few businesses, and stratum B as an area with fewer homes and more shops (see Figure 3). In the same way, the determination of non-domestic generators was made, among them: wineries (35), restaurants (10), hostels and lodgings (4), Internet booths (2) and bakery (1) [38].
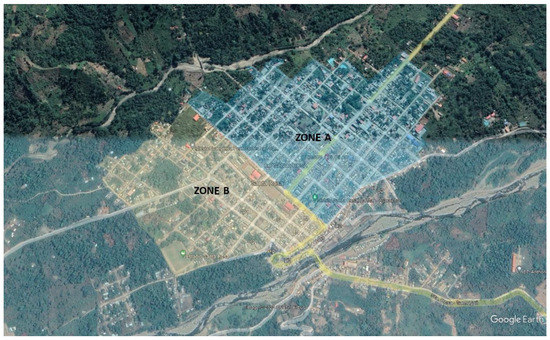 Figure 3. Sample distribution map for the study of municipal solid waste in the District of Santa Rosa.The sequence of steps for the planning stage is divided into four groups. The first group authorized by the competent municipal authority is in charge of designing, approving and managing the work plan with the corresponding supervision of the documentation of logistics, administration and planning, considering precautions towards the environment. On the other hand, the sample handling procedures fall exclusively on a second team or group of helpers, associated workers and other volunteers, led by a specialist with experience in ECRS, who will be in charge of collecting solid waste in the area of study. Consequently, the analyses of the samples collected by a third group are carried out under logistical approaches that involve transport, destination areas (main and/or auxiliary), presence of managers, operators, promoters and managers of the devices or equipment to be used during the study in such a way that the objective is maintained efficiently and accurately.
 - Fieldwork and operations. The solid waste sampling process stands out for the registration of residential and non-residential properties using spreadsheets for handling, assigning and analyzing samples, as well as for each agent that generates solid waste. Within this methodology, specific data are detailed, such as volume (using shaking techniques to avoid bias), homogeneous segregation and additional criteria that allow quantifying and ordering each of the values obtained. The manager responsible for the study was in charge of providing the training and assignment of functions as well as training on the use and management of safety implements and proper handling of solid waste for the entire work team. The team of the present study delivered letters of information and orientation to the owners of the homes, commercial establishments and market administrator and coordinated with the street sweeping personnel. Registers were filled with the data of sources that generate waste and classification of the participants by assigning codes. A physical space authorized by the municipality was enabled to carry out the collection, weighing and classification of the samples.Likewise, a vehicular unit was designated especially for the collection of the samples at an established time and the transfer with the corresponding precautions to be deposited in the assigned physical space, where they go through stages such as weighing each of the samples and writing them down on a file for subsequent data analysis. Subsequently, the content is emptied to separate the components, classify the materials by type, and determine the physical composition of the waste. For determination of the density, a metallic cylinder of defined volume (200 L) was conditioned, and the sample was placed in the cylinder where the density calculation was completed using formulas where the average density of solid waste was obtained [39]. This procedure was carried out for 8 days for all samples.
- Information analysis. In the estimation of waste generated per capita (GPC), calculation tools were available for each mathematical analysis involved in obtaining values according to the data and days evaluated [39,40]. For an efficient analysis, it is necessary to work with certain considerations, such as delimiting all the data in the housing number, assigned codes, number of inhabitants and GPC data, among others. The records with null values were not written as zeros but as empty cells, and thus avoiding calculations that alter the average. To determine the household generation per capita , it was necessary to know the number of inhabitants for each dwelling (289 inhabitants). Coded samples were collected for 8 consecutive days, and bag weights were noted. Performing the calculations using the formula established in RM 457-2018 Municipal Waste Characterization Guide [41], a household GPC of 0.77 kg/day was completed, and a non-household GPC of 4.37 kg/day was determined. The total generation of municipal solid waste was 3132.71 kg/day made up of domestic waste (2420.98 kg/day) and non-domestic waste (711.73 kg/day). Likewise, during the analysis of the physical composition of the solid waste of the district, it was determined that reusable waste predominated with 69.87% to 30.13% for non-usable waste of the total waste collected during the study, 222.49 kg/m3. For the determination of the density of residential solid waste, 7 days were considered, excluding day zero because it was considered unreliable data according to the guide, obtaining the result of 222.49 kg/m3, and the density for non-residential solid waste was 202 kg/day [42].
2.2. Solid Waste Valorization
Article No. 37 of Legislative Decree 1278 details the comprehensive solid waste management law, where SW management is proposed as a complement to the final characterization for reuse or recycling purposes, among other possible mitigation alternatives [24,43]. Giving SW components an objective for various mitigation processes, physical or energetic, is a field that involves the valorization process (see Figure 4) [44]. Chemical, physical and other related processes can be used in the recycling of residual matter, such as oil recovery, bioconversion and composting [45], obtaining various materials or substances, as well as validated products within material recovery. On the other hand, the use implies processes of co-incineration, biodegradation for energy purposes, co-processing or obtaining energy comparable to materials that conventionally generate energy, such as gas, oil and hydroelectricity [46].
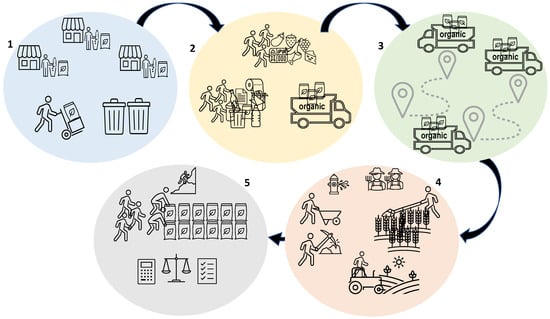
Figure 4.
Stages in the valorization of solid waste: 1: source segregation; 2: selective collection; 3: transport of organic solid waste; 4: treatment of organic solid waste and 5: production of organic fertilizer (compost).
- Source segregation. Prior to the valuation study, it was decided to work mainly with 2 organic SW generators: the market (30 participants) and the green areas (2 parks and 2 gardens). Additionally, there was a sporadic generator of a fair during a week in the month of August. It should be noted that these segregation establishments were previously registered, trained and sensitized for correct segregation and adequate storage of SW.
- Selective collection. Organic SW from the market was collected on Monday, Tuesday, Wednesday, Thursday and Friday. Sundays were included only for the last two months (October and November). Containers were placed at strategic points in the market for participants to deposit their waste in a coded bag; the personnel responsible for the collection weighed the samples and made the corresponding annotation in the daily records. The collection of solid organic waste from the maintenance and cleaning of the green areas of the district was on a monthly basis.
- Transport of organic solid waste. It was carried out by the trained personnel of the municipality in a truck with the enabled containers, from the district to the recovery plant located in the Simariva Population Center, Ayapampana sector, about 3.80 km. from the city.
- Treatment of organic solid waste. Once the organic solid waste arrived at the district recovery plant (total area of the plant: 12 × 9 m, concrete floor, leachate channel and tin roof), trained personnel from the municipality proceeded to remove the non-biodegradable materials (plastic, glass, metal). Then, this organic material was arranged in static piles of 3 m × 2 m with a height of 1.2 m.
- Production of organic fertilizer (compost). Organic solid waste was subjected to aerobic composting techniques and covered with plastic for 10 days. Subsequently, the batteries were removed when there was a sudden change in temperature or humidity. Once the waste had a dark color, it was dried and sieved with a 1 cm cubic sieve to pack it in bags of organic fertilizer, destined for the different green areas, as well as for the production of seedlings for forestry projects.
2.3. Methodology
2.3.1. Analysis of Variance
The analysis of variance (ANOVA) allows making a global comparison between samples, minimizing the probability of sampling error, since, as the number of samples increases, the total number of comparisons between pairs increases exponentially. That said, we can describe the effects model as follows:
where is the jth observation of level i of factor A;, is the global average of the data, is effect of factor level i, and is the random component of the error.
ANOVA can be understood as a method to perform equality tests between three or more population means based on the analysis of sample variance. In this article, ANOVA was used to test whether the population means between the variables collected in the field research are the same or different—being, as noted, the analysis performed through the variances of the sample data collected.
If the differences between the means are significant, the Tukey test is used. The Tukey test is based on the total studentized amplitude and can be used to compare any contrast between two treatment means; that is, it does not allow comparing groups with each other. This procedure calculates the minimum significant differences. With the Tukey test, it is expected to find which groups have growth rates with statistically equal means.
Tukey’s test can be used to test any difference between two sample means, being defined from the least significant difference (MSD). The test can be defined as
where n is the number of observations in the sample, is a value in Tukey test table with k levels, and MSE is the mean squared error.
2.3.2. Correlation Analysis
To perform the degree of dispersion more accurately, we used Pearson’s correlation coefficient (). This coefficient measures the degree of correlation between two variables (negative or positive correlation). If , we say that there is a perfect positive correlation between the variables; if , there is a perfect negative correlation between the variables; if , the variables are linearly independent. We can write Pearson’s coefficient as
where and are two variables for , and are means, and and are variances.
2.3.3. Clustering Analysis
As a clustering instrument, a principal component analysis (PCA) method was chosen. This method aims to analyze the covariance structure through a process of linear combination of variables. The main component being defined by
where is a random vector.
3. Results
This section presents the results found in the study. We show the analysis of variance, correlation matrix between observations and clustering analysis with principal component. The methods are applied for three collected datasets: house solid waste, commercial solid waste, and grocery solid waste observations.
3.1. House Analysis
The ANOVA was applied to identify whether there is a significant difference between the means observed for the two groups analyzed (Group A and Group B) in relation to the eight days of the week collected in the survey.
The results (Table 2) indicate that there is no significant difference for the means of Groups A and B and for the days of the week. Thus, with a p-value of 0.5091, we do not reject the null hypothesis of equality between the means, and with a p-value of 0.2864, we do not reject the null hypothesis of equality between the means.
Table 2.
Anova results for house solid waste.
Correlation analysis is effective for identifying similar behaviors among a set of observations for variables. Figure 5 shows that there is a high correlation between the volume of waste observed in homes during the days of the survey, considering the two groups analyzed. The result observed between days (high correlation coefficients) shows that the two observed groups haven very similar behavior.
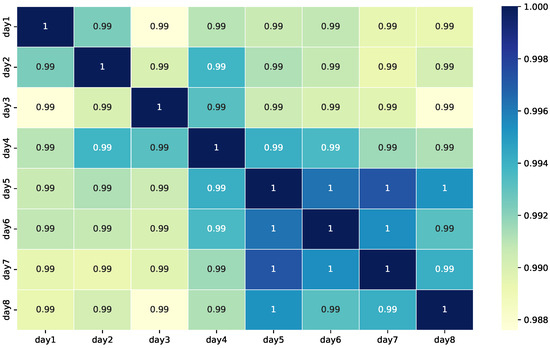
Figure 5.
Correlation matrix for weekdays-House.
Figure 6 presents an analysis based on principal components. It is possible to observe which are the most important variables to observe the variation of the data and identify how the data are grouped. It is observed that as the data are highly correlated, there is no well-defined pattern, rather an overlap of results that follow similar paths. The first principal component contains 41.76% of the variance, and the second principal component contains 17.70% of the variance. Together, the two components contain 59.46% of the information.
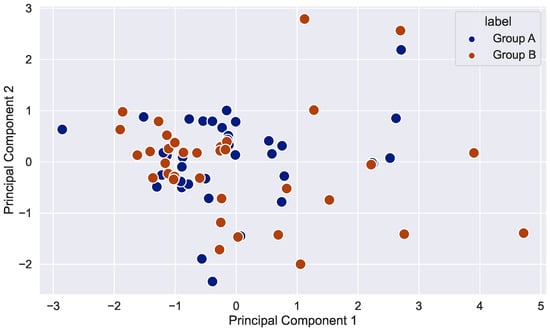
Figure 6.
Principal components analysis (clustering-house).
The analysis also considered the composition of the residues in organic and inorganic matter (Figure 7). It is observed that there is a higher concentration of organic waste, with a higher incidence on Day 1. Another fact is the stable values on inorganic solid waste.
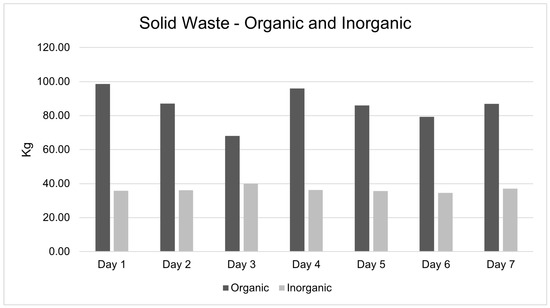
Figure 7.
Solid waste, organic and inorganic.
3.2. Commercial Analysis
The ANOVA was applied to identify whether there is a significant difference between the means observed for the five groups analyzed (store, coffee shop, bakery, hotel, and restaurant) in relation to the eight days of the week collected in the survey.
The results (Table 3) indicate that there is significant difference for the means of groups and no significance for the days of the week. Thus, with a p-value of 0.3296, we do not reject the null hypothesis of equality between the means, and with a p-value of 0.000, we reject the null hypothesis of equality between the means for groups.
Table 3.
Anova results for commercial solid waste.
To identify which of the groups has a significant difference, we apply a Tukey test (Table 4). Observing the pairs, we can see that there is a significant difference between the bakery and the hotel (Figure 8). The other groups do not show a significant difference.
Table 4.
Tukey test results for commercial solid waste.
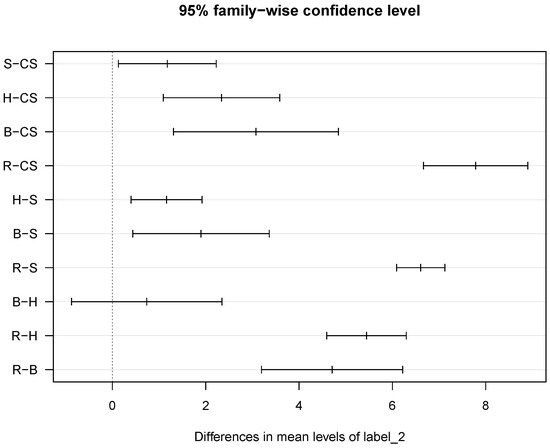
Figure 8.
Tukey test plot with mean difference for each pair of group. Note: S—store, CS—coffee shop, H—hotel, B—bakery and R—restaurant.
Figure 9 shows that there is a high correlation between the volume of waste observed in commercial buildings during the days of the survey, considering the two groups analyzed. The result observed between Days 7 and 3 (0.87), between Days 7 and 1 (0.84) and between Days 7 and 8 (0.85) can be highlighted. These results show that the consumption of waste observed in the groups has a similar behavior.
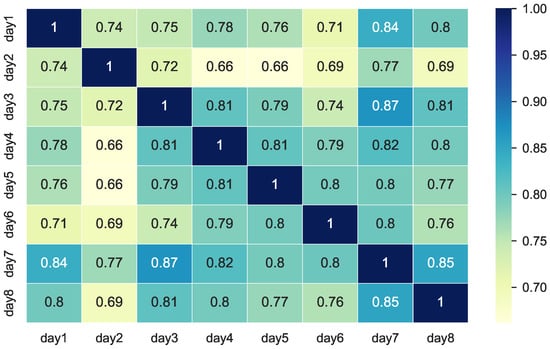
Figure 9.
Correlation matrix for weekdays—Commercial.
Figure 10 presents an analysis based on principal components. As we see in house analysis, it is possible to observe which are the most important variables to observe the variation of the data and identify how the data are grouped. It is observed that there is a difference between the behavior of the restaurant in relation to other commercial establishments. The other establishments are grouped in terms of volume of waste generated, while restaurants have a greater participation in Component 1. In this case, we use five principal components. The first principal component contains 79.56% of the variance, and the second principal component contains 5.26% of the variance. Together, the two components contain 84.82% of the information.
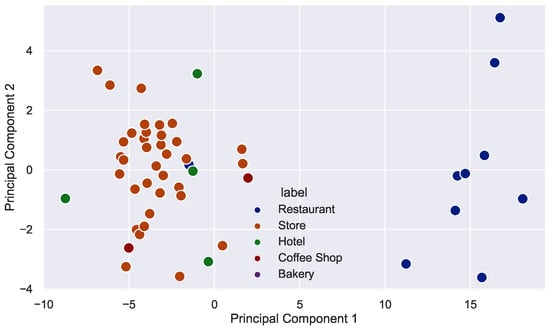
Figure 10.
Principal components analysis (clustering-commercial).
3.3. Grocery Analysis
The ANOVA was applied to identify whether there is a significant difference between the means observed for the two groups analyzed (from June to November) in relation to the twenty days of the month collected in the survey.
The results (Table 5) indicate that there is significant difference for the means of months and for the days of the month. Thus, with a p-value of 0.0000, we reject the null hypothesis of equality between the means of months, and with a p-value of 0.0000, we reject the null hypothesis of equality between the means of days of months.
Table 5.
Anova results for grocery solid waste.
To identify which of the groups has a significant difference, we apply a Tukey test (Table 6). Observing the pairs, we can see that there is a significant difference between all analysed months (Figure 11).
Table 6.
Tukey test results for grocery solid waste.
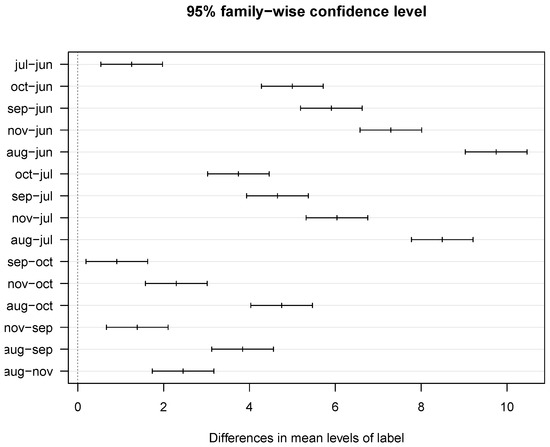
Figure 11.
Tukey test plot with mean difference for each pair of group.
Figure 12 shows that there is a medium and low correlation between the volume of waste observed in grocery buildings during the days of the survey, considering the two groups analyzed. The result observed between Days 18 and 16 (0.71), 19 and 16 (0.75), 19 and 20 (0.74), 18 and 20 (0.66), 5 and 6 (0.68), 7 and 6 (0.65), 12 and 6 (0.54) and between Days 17 and 1 (0.56) can be highlighted. These results show that the consumption of waste observed in the groups has no similar behavior.
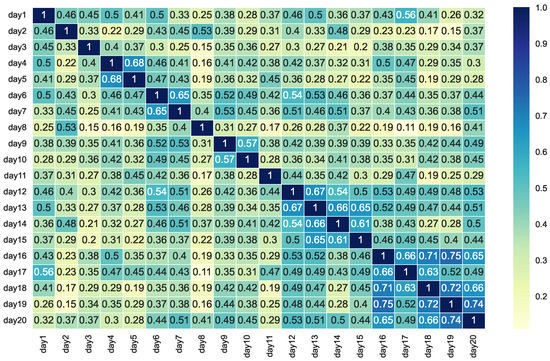
Figure 12.
Correlation matrix for weekdays-Grocery.
Figure 13 presents an analysis based on principal components. As we see in the other analysis, it is possible to observe which are the most important variables to observe the variation of the data and identify how the data are grouped. It is observed that there are three main groups: District 1 (June and July), District 2 (September, October and November) and District 3 (August). In this case, we use six principal components. The first principal component contains 46.63% of the variance, and the second principal component contains 11.10% of the variance. Together, the two components contain 57.73% of the information.
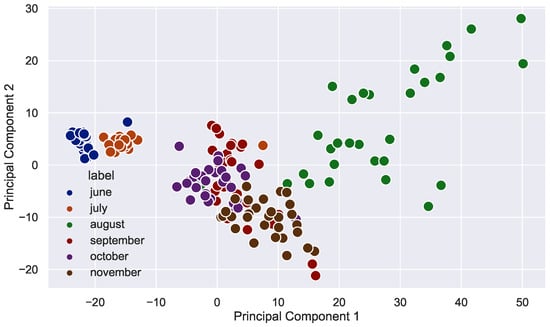
Figure 13.
Principal components analysis (clustering-grocery).
4. Discussion
The problem of solid waste disposal in the Santa Rosa District, Ayacucho, is linked to poor access to public services, which makes the residentrs dispose of their municipal solid waste in dumps, constituting a serious environmental and sanitary problem. This is the same scenario as another district, Ayacucho (Sacsamarca), that also makes use of dumps with a few years of useful life, whose solution projected by the municipality only focuses on building larger dumps [32] and not on carrying out studies of characterization and recovery of solid waste that are of vital importance within the process of urban planning and territorial ordering [47]. A similar case, in another country, occurs in Keta, Africa, where they lack solid waste management due to having little availability of economic resources [48].
The GPC of residential solid waste in Santa Rosa (0.77 kg/day) was higher than that found in Dilla Town, Ethiopia (0.47 kg/day) [49] and lower than the GPC of non-residential solid waste of Santa Rosa (4.37 kg/day) for having fewer commercial establishments such as warehouses, restaurants, hotels, bakeries and cafeterias. Likewise, the averages obtained from GPC of household solid waste for the strata of the present study (0.44 stratum A and 1.03 stratum B), are similar to the results of the studies carried out in the city of Laga Dadi, Ethiopia, with an average GPC of 0.45 for household solid waste [50]. On the other hand, the GPC values for non-residential solid waste from hotels and other commercial establishments for Santa Rosa were 4.17 and 6.0, respectively, and for Laga Dadi, 1.81 and 1.57, respectively, [50]. In another investigation, developed in Germany, it was found that hotels generate around 58% of organic solid waste and that a minimum of 36% of recyclable waste could be recovered [51,52].
The solid waste generated is predominantly made up of more usable waste (69.87%) than non-usable waste (30.13%) and within the usable waste, a greater amount of organic than inorganic solid waste was obtained, similar to what was found in Dilla Town, Ethiopia and in Costa Rica, whose percentage of organic solid waste was 68.40 and 55.9%, respectively [47,49]. However, regarding inorganic solid waste, the percentage of paper and plastics was very different; while in the District of Santa Rosa, 14.43% of plastic was generated, in Dilla Town and Costa Rica 1.90 and 10.2% of plastics were generated, respectively [49]. The high percentage of plastics in Santa Rosa corresponds to the increase in urbanization and its consequent increase in inorganic solid waste [53,54,55]. When comparing the results obtained for the commercial and household sectors, it is evident that organic matter waste acquires a greater preponderance than materials with recycling potential [47].
It should be noted that one of the main causes of the generation of waste for Santa Rosa is consumption by the population during festive dates [56]. In this sense, in the month of August, the patron festival alluding to the patron saint Santa Rosa de Lima [57] is commemorated. Likewise, in the month of November, the main date is the political creation of the District of Santa Rosa [58], as well as the consecration towards the regeneration of life and fertility, a festivity that welcomes the rains of the humid seasons [57]. This set of dates and other possible alternate festivities may be the cause of the increase in solid waste in the months of August and November (see Figure 14) compared to June to July, with much less SW produced. By reducing the amount of organic waste generated, the District of Santa Rosa could obtain economic benefits by reducing the costs of collection, transportation and disposal of waste [59] and through recovery increase the options for solid waste management when the establishment of sanitary landfills is not viable [60].
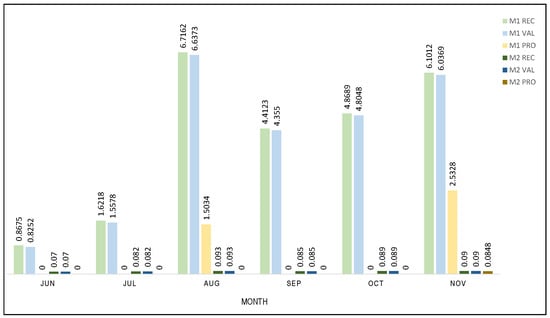
Figure 14.
Valorized organic waste.
5. Conclusions
The proposed methodology was organized in its own sequences that allowed a quantification, segregation and subsequent valuation within the District of Santa Rosa. However, it was concluded in the characterization study that the physical composition of solid waste is predominantly made up of reusable waste with 69.87% usable and 30.13% non-usable. In addition, a total of 2420.98 kg/day of household solid waste was collected, whose GPC was 0.77 kg/day and density was 222.49 kg/m3. Likewise, a total of 711.73 kg/day of non-residential solid waste was collected, with a GPC of 4.37 kg/day and a density of 202 kg/m3. In addition, according to the characterization carried out by Strata A and B, no significant differences were found between the amount of solid waste collected (p-value = 0.2864) despite the fact that in Stratum B, there were a greater number of commercial establishments. Within the latter, significant differences were observed between the solid waste generated in restaurants and other non-residential solid waste generators. On the other hand, it was determined that organic waste is generated in greater quantity than inorganic waste.
With the characterization of solid waste, it was possible to show that the collected sample is predominantly composed of organic solid waste, so it was necessary to carry out a recovery plan for this type of waste. This plan implied the participation of two generating sources: the market and parks–gardens, collecting organic solid waste between the months of June and November, within which, in the month of August, the largest amount of organic solid waste was collected due to the many festivals being celebrated. It was shown that the markets produce more organic RSS, and therefore, by valuing what was collected, a greater amount of fertilizer was produced, unlike the green areas that produce few RSS and less frequently, so the markets would be the best source of generation of organic RSS for valorization studies. Finally, as a result of the recovery, a total of 4.12 tons of compost was obtained through composting.
At the end of the characterization and recovery procedure, it was possible to determine that the largest amount of solid waste arriving at the dump was organic solid waste and that its recovery managed to minimize the amount of organic solid waste entering the dump. It should be noted that previous characterization studies have been carried out in the District of Santa Rosa, this being the first time that a pilot plan for the recovery of organic waste was carried out for six months, with which it was possible to obtain compost as a product final. This compost was allocated to different green areas of the city, to the production of forest seedlings for the different district projects and as an incentive in ecological contests. In this context, it is concluded that it is feasible to carry out an organic solid waste recovery plan for the District of Santa Rosa in order to obtain more than four tons of natural compost within a period of six months.
Author Contributions
Conceptualization, K.Q., M.M. and J.L.L.-G.; methodology, K.Q., M.M., K.d.C. and J.L.L.-G.; software, K.d.C. and J.L.L.-G.; validation, J.L.L.-G., K.d.C. and A.R.H.D.L.C.; formal analysis, K.d.C. and J.L.L.-G.; investigation, K.Q., M.M. and J.L.L.-G.; resources, H.R.G., J.F.V.y.R.V., L.D.M.M. and M.M.H.M.; data curation, K.Q., M.M., K.d.C. and J.L.L.-G.; writing—original draft preparation, K.Q., M.M., K.d.C., J.L.L.-G., A.R.H.D.L.C., H.R.G., J.F.V.y.R.V., L.D.M.M. and M.M.H.M.; writing—review and editing, K.Q., M.M., K.d.C., J.L.L.-G., A.R.H.D.L.C., H.R.G., J.F.V.y.R.V., L.D.M.M. and M.M.H.M.; visualization, K.Q., M.M., K.d.C., J.L.L.-G., A.R.H.D.L.C., H.R.G., J.F.V.y.R.V., L.D.M.M. and M.M.H.M.; supervision, J.L.L.-G.; project administration, J.L.L.-G. and K.d.C.; funding acquisition, J.L.L.-G. and A.R.H.D.L.C. All authors have read and agreed to the published version of the manuscript.
Funding
This research received no external funding.
Institutional Review Board Statement
Not applicable.
Informed Consent Statement
Not applicable.
Data Availability Statement
Not applicable.
Conflicts of Interest
The authors declare no conflict of interest.
References
- Bello, H. Impact of changing lifestyle on municipal solid waste generation in residential areas: Case study of Qatar. Int. J. Waste Resour 2018, 8. [Google Scholar] [CrossRef]
- Chen, Y.C. Effects of urbanization on municipal solid waste composition. Waste Manag. 2018, 79, 828–836. [Google Scholar] [CrossRef] [PubMed]
- Daryabeigi Zand, A.; Vaeziheir, A.; Hoveidi, H. Comparative evaluation of unmitigated options for solid waste transfer stations in North East of Tehran using rapid impact assessment matrix and Iranian Leopold matrix. Environ. Energy Econ. Res. 2019, 3, 189–202. [Google Scholar]
- Song, Q.; Li, J.; Zeng, X. Minimizing the increasing solid waste through zero waste strategy. J. Clean. Prod. 2015, 104, 199–210. [Google Scholar] [CrossRef]
- Kaza, S.; Yao, L.; Bhada-Tata, P.; Van Woerden, F. What a Waste 2.0: A Global Snapshot of Solid Waste Management to 2050; World Bank Publications: Washington, DC, USA, 2018. [Google Scholar]
- Shah, A.V.; Singh, A.; Mohanty, S.S.; Srivastava, V.K.; Varjani, S. Organic solid waste: Biorefinery approach as a sustainable strategy in circular bioeconomy. Bioresour. Technol. 2022, 349, 126835. [Google Scholar] [CrossRef] [PubMed]
- Sharma, S.; Misra, S.; Singh, J. Critical review on the Solid-wastes issue: Generation, Composition, Disposal and their recycling potential for various applications. J. Phys. Conf. Ser. 2021, 1804, 012147. [Google Scholar] [CrossRef]
- Chen, D.M.C.; Bodirsky, B.L.; Krueger, T.; Mishra, A.; Popp, A. The world’s growing municipal solid waste: Trends and impacts. Environ. Res. Lett. 2020, 15, 074021. [Google Scholar] [CrossRef]
- Awasthi, M.K.; Zhao, J.; Soundari, P.G.; Kumar, S.; Chen, H.; Awasthi, S.K.; Duan, Y.; Liu, T.; Pandey, A.; Zhang, Z. Sustainable management of solid waste. In Sustainable Resource Recovery and Zero Waste Approaches; Elsevier: Amsterdam, The Netherlands, 2019; pp. 79–99. [Google Scholar]
- Deus, R.M.; Mele, F.D.; Bezerra, B.S.; Battistelle, R.A.G. A municipal solid waste indicator for environmental impact: Assessment and identification of best management practices. J. Clean. Prod. 2020, 242, 118433. [Google Scholar] [CrossRef]
- Dlamini, S.; Simatele, M.D.; Serge Kubanza, N. Municipal solid waste management in South Africa: From waste to energy recovery through waste-to-energy technologies in Johannesburg. Local Environ. 2019, 24, 249–257. [Google Scholar] [CrossRef]
- Tong, H.; Yao, Z.; Lim, J.W.; Mao, L.; Zhang, J.; Ge, T.S.; Peng, Y.H.; Wang, C.H.; Tong, Y.W. Harvest green energy through energy recovery from waste: A technology review and an assessment of Singapore. Renew. Sustain. Energy Rev. 2018, 98, 163–178. [Google Scholar] [CrossRef]
- Fetene, Y.; Addis, T.; Beyene, A.; Kloos, H. Valorisation of solid waste as key opportunity for green city development in the growing urban areas of the developing world. J. Environ. Chem. Eng. 2018, 6, 7144–7151. [Google Scholar] [CrossRef]
- Alshehrei, F.; Ameen, F. Vermicomposting: A management tool to mitigate solid waste. Saudi J. Biol. Sci. 2021, 28, 3284–3293. [Google Scholar] [CrossRef]
- Paes, L.A.B.; Bezerra, B.S.; Deus, R.M.; Jugend, D.; Battistelle, R.A.G. Organic solid waste management in a circular economy perspective–A systematic review and SWOT analysis. J. Clean. Prod. 2019, 239, 118086. [Google Scholar] [CrossRef]
- Kurniawan, T.A.; Liang, X.; O’Callaghan, E.; Goh, H.; Othman, M.H.D.; Avtar, R.; Kusworo, T.D. Transformation of solid waste management in China: Moving towards sustainability through digitalization-based circular economy. Sustainability 2022, 14, 2374. [Google Scholar] [CrossRef]
- Wang, H.; Song, J.; Ren, J.; Duan, H. Energy conversion of urban wastes in China: Insights into potentials and disparities of regional energy and environmental benefits. Energy Convers. Manag. 2019, 198, 111897. [Google Scholar] [CrossRef]
- Cai, K.; Xie, Y.; Song, Q.; Sheng, N.; Wen, Z. Identifying the status and differences between urban and rural residents’ behaviors and attitudes toward express packaging waste management in Guangdong Province, China. Sci. Total. Environ. 2021, 797, 148996. [Google Scholar] [CrossRef] [PubMed]
- Hettiarachchi, H.; Ryu, S.; Caucci, S.; Silva, R. Municipal solid waste management in Latin America and the Caribbean: Issues and potential solutions from the governance perspective. Recycling 2018, 3, 19. [Google Scholar] [CrossRef]
- Sánchez-Muñoz, M.d.P.; Cruz-Cerón, J.G.; Maldonado-Espinel, P.C. Urban solid waste management in Latin America: An analysis from the perspective of waste generation. Rev. Finanz. Polític. Econ. 2019, 11, 321–336. [Google Scholar] [CrossRef]
- Nwogwugwu, N.; Ishola, A.O. Solid waste management and public health challenges: Appraisal of local government capacity to achieve effective environmental governance. Asian Soc. Sci. 2019, 15, 1–9. [Google Scholar] [CrossRef]
- Ikhlayel, M. Development of management systems for sustainable municipal solid waste in developing countries: A systematic life cycle thinking approach. J. Clean. Prod. 2018, 180, 571–586. [Google Scholar] [CrossRef]
- Velvizhi, G.; Shanthakumar, S.; Das, B.; Pugazhendhi, A.; Priya, T.S.; Ashok, B.; Nanthagopal, K.; Vignesh, R.; Karthick, C. Biodegradable and non-biodegradable fraction of municipal solid waste for multifaceted applications through a closed loop integrated refinery platform: Paving a path towards circular economy. Sci. Total. Environ. 2020, 731, 138049. [Google Scholar] [CrossRef] [PubMed]
- Achachagua, A.J.Y. The Management Of Urban Solid Waste In Sustainable Development In A Peruvian Municipality In The Context Of The Coronavirus Pandemic (Covid-19). Turk. J. Comput. Math. Educ. 2021, 12, 3484–3489. [Google Scholar]
- Retuerto, M.G.; Espinoza, D.Y.; Andrade-Arenas, L. System Dynamics Modeling for Solid Waste Management in Lima Peru. Int. J. Adv. Comput. Sci. Appl. 2021, 12, 537–542. [Google Scholar] [CrossRef]
- Requena-Sanchez, N.; Carbonel-Ramos, D.; Moonsammy, S.; Klaus, R.; Punil, L.S.; Ng, K.T.W. Virtual Methodology for Household Waste Characterization During The Pandemic in An Urban District of Peru: Citizen Science for Waste Management. Environ. Manag. 2022, 69, 1078–1090. [Google Scholar] [CrossRef] [PubMed]
- Requena-Sanchez, N.; Carbonel-Ramos, D.; Campodónico, L.F.D. A novel methodology for household waste characterization during the COVID-19 pandemic: Case study results. J. Mater. Cycles Waste Manag. 2022, 24, 200–209. [Google Scholar] [CrossRef] [PubMed]
- Badillo-Rivera, E.; Fow-Esteves, A.; Alata-López, F.; Virú-Vásquez, P.; Medina-Acuña, M. Environmental and social analysis as risk factors for the spread of the novel coronavirus (SARS-CoV-2) using remote sensing, GIS and analytical hierarchy process (AHP): Case of Peru. MedRxiv 2020. [Google Scholar] [CrossRef]
- Vázquez-Rowe, I.; Ziegler-Rodriguez, K.; Margallo, M.; Kahhat, R.; Aldaco, R. Climate action and food security: Strategies to reduce GHG emissions from food loss and waste in emerging economies. Resour. Conserv. Recycl. 2021, 170, 105562. [Google Scholar] [CrossRef]
- Jaeger, A.; Blanchard, R. Techno-economic analysis of an enhanced anaerobic digester in the Andean area of Peru. Int. J. Energy Environ. Eng. 2022, 13, 805–819. [Google Scholar] [CrossRef]
- Marchan-Solier, C.E.; Zorrilla-Crespo, V.A.; Cardenas-Quispe, M.A.; Pacheco, A. Contaminación por Residuos Sólidos Urbanos: Caso Comunidad de Occochaca, Huanta, Perú, 2021. Sci. Res. J. CIDI 2021, 1, 1–14. [Google Scholar] [CrossRef]
- Murga Cotrina, C.J. Propuesta de Gestión de Residuos Sólidos para Sacsamarca, Ayacucho. Master’s Thesis, Pontificia Universidad Católica del Perú, San Miguel, Peru, 2017. [Google Scholar]
- Villalba, L.; Donalisio, R.S.; Basualdo, N.E.C.; Noriega, R.B. Household solid waste characterization in Tandil (Argentina): Socioeconomic, institutional, temporal and cultural aspects influencing waste quantity and composition. Resour. Conserv. Recycl. 2020, 152, 104530. [Google Scholar] [CrossRef]
- Abu Yazid, N.; Barrena, R.; Komilis, D.; Sánchez, A. Solid-state fermentation as a novel paradigm for organic waste valorization: A review. Sustainability 2017, 9, 224. [Google Scholar] [CrossRef]
- Abdel-Shafy, H.I.; Mansour, M.S. Solid waste issue: Sources, composition, disposal, recycling, and valorization. Egypt. J. Pet. 2018, 27, 1275–1290. [Google Scholar] [CrossRef]
- Veneros Urbina, B.; Amaya Alvarado, P.; Chuan Torres, Y.A.; Manchay Hernández, C. Characterization and Opportunities for the Improvement of Solid Waste at the Educational Institution, La Esperanza (Trujillo-Peru), 2019; Universidad Nacional Autonoma de Huanta: Huanta, Peru, 2020. [Google Scholar]
- INEI. Resultados Definitivos del Censo Nacional del 2017, Ayacucho, Peru; Technical Report 1023; Instituto Nacional de Estadísticas e Informática: Lima, Peru, 2018. [Google Scholar]
- Vallejo, F.; Díaz-Robles, L.; Cubillos, F.; Perez, A. Valorization of municipal solid waste using hydrothermal carbonization and gasification: A review. Chem. Eng. 2020, 81. [Google Scholar]
- Johannessen, L.M. Guidance Note on Recuperation of Landfill Gas from Municipal Solid Waste Landfills; World Bank, Urban Development Division, Urban Waste Management Thematic Group: Washington, DC, USA, 1999. [Google Scholar]
- Xiao, S.; Dong, H.; Geng, Y.; Francisco, M.J.; Pan, H.; Wu, F. An overview of the municipal solid waste management modes and innovations in Shanghai, China. Environ. Sci. Pollut. Res. 2020, 27, 29943–29953. [Google Scholar] [CrossRef]
- MINAM. Guía para la Caracterización de Residuos Sólidos Municipales; Technical Report 76; MINAM: Lima, Peru, 2018. [Google Scholar]
- Ugwu, C.O.; Ozoegwu, C.G.; Ozor, P.A. Solid waste quantification and characterization in university of Nigeria, Nsukka campus, and recommendations for sustainable management. Heliyon 2020, 6, e04255. [Google Scholar] [CrossRef] [PubMed]
- Huang, J.; Zhao, R.; Huang, T.; Wang, X.; Tseng, M.L. Sustainable municipal solid waste disposal in the belt and road initiative: A preliminary proposal for Chengdu city. Sustainability 2018, 10, 1147. [Google Scholar] [CrossRef]
- Daza, E.; Da Cruz, A.; Camargo, S.; Zavala, S.; Vargas, L.; Balbin, N. Proposal for the Management of Solid Urban Waste Generated in Naranjillo, Capital of the District of Luyando, Perú. In Proceedings of the IOP Conference Series: Earth and Environmental Science; IOP Publishing: Bristol, UK, 2022; Volume 1008, p. 012019. [Google Scholar]
- Millones, C.E.; Vásquez, E.R.; Fernandez-Güimac, S.L.; Bustamante, D.E.; Calderon, M.S. Cellulolytic and Amylolytic Bacteria with Potential for Composting Urban Solid Waste at Low Temperatures in Northern Peru. SSRN. Available online: https://ssrn.com/abstract=4239422 (accessed on 1 December 2022).
- Babu, R.; Veramendi, P.M.P.; Rene, E.R. Strategies for resource recovery from the organic fraction of municipal solid waste. Case Stud. Chem. Environ. Eng. 2021, 3, 100098. [Google Scholar] [CrossRef]
- Herrera-Murillo, J.; Rojas-Marín, J.F.; Anchía-Leitón, D. Tasas de generación y caracterización de residuos sólidos ordinarios en cuatro municipios del área metropolitana costa rica. Rev. Geográf. Amér. Cent. 2016, 2, 235–260. [Google Scholar] [CrossRef]
- Edjabou, M.E.; Møller, J.; Christensen, T.H. Solid waste characterization in Kétao, a rural town in Togo, West Africa. Waste Manag. Res. 2012, 30, 745–749. [Google Scholar] [CrossRef]
- Fereja, W.M.; Chemeda, D.D. Status, characterization, and quantification of municipal solid waste as a measure towards effective solid waste management: The case of Dilla Town, Southern Ethiopia. J. Air Waste Manag. Assoc. 2022, 72, 187–201. [Google Scholar] [CrossRef]
- Assefa, M.; Mohammed, M. Solid Waste Generation Rate and Characterization Study for Laga Tafo Laga Dadi Town, Oromia, Ethiopia. Int. J. Environ. Prot. Policy 2017, 5, 84–93. [Google Scholar] [CrossRef]
- Chaabane, W.; Nassour, A.; Nelles, M. Solid waste management key indicator development for hotels: A Tunisian case study analysis. Recycling 2018, 3, 56. [Google Scholar] [CrossRef]
- Filimonau, V.; Tochukwu, C.O. Exploring managerial approaches to mitigating solid waste in hotels of Lagos, Nigeria. J. Clean. Prod. 2020, 270, 122410. [Google Scholar] [CrossRef]
- Radwan, H.R.; Jones, E.; Minoli, D. Managing solid waste in small hotels. J. Sustain. Tour. 2010, 18, 175–190. [Google Scholar] [CrossRef]
- Mbasera, M.; Du Plessis, E.; Saayman, M.; Kruger, M. Environmentally-friendly practices in hotels. Acta Commer. 2016, 16, 1–8. [Google Scholar] [CrossRef]
- Tsai, F.M.; Bui, T.D.; Tseng, M.L.; Lim, M.K.; Hu, J. Municipal solid waste management in a circular economy: A data-driven bibliometric analysis. J. Clean. Prod. 2020, 275, 124132. [Google Scholar] [CrossRef]
- Munguía, N.E.; Díaz, Á.M.; Velazquez, L.E.; Perez, R.; Esquer, J.; Zepeda, D.S. Valorization of solid waste recovery in an institution of higher education. Green Sustain. Chem. 2018, 8, 180. [Google Scholar] [CrossRef]
- Ulfe, M.E. Danzando en Ayacucho: Música y Ritual del Rincón de los Muertos; Pontificia Universidad Católica del Perú, Instituto Riva-Agüero: San Miguel, Peru, 2004. [Google Scholar]
- Manyavilca Bendez, E. El Juego Cooperativo para el Desarrollo de Las Habilidades Sociales en Estudiantes de 3 Años del Nivel Inicial de la Institución Educativa Santa Rosa Distrito de San Miguel Provincia de la Mar región de Ayacucho en el Año Académico 2018; Universidad Catolica Los Angeles Chimbote: Chimbote, Peru, 2018. [Google Scholar]
- Essaidi, L. How can the City of Querétaro in Mexico Adopt a More Sustainable Solid Waste Management System from an Economical and Environmental Standpoint? Ph.D. Thesis, Haute École de Gestion de Genève, Geneva, Switzerland, 2020. [Google Scholar]
- Buenrostro, O.; Bocco, G. Solid waste management in municipalities in Mexico: Goals and perspectives. Resour. Conserv. Recycl. 2003, 39, 251–263. [Google Scholar] [CrossRef]


Disclaimer/Publisher’s Note: The statements, opinions and data contained in all publications are solely those of the individual author(s) and contributor(s) and not of MDPI and/or the editor(s). MDPI and/or the editor(s) disclaim responsibility for any injury to people or property resulting from any ideas, methods, instructions or products referred to in the content. |
© 2023 by the authors. Licensee MDPI, Basel, Switzerland. This article is an open access article distributed under the terms and conditions of the Creative Commons Attribution (CC BY) license (https://creativecommons.org/licenses/by/4.0/).