Abstract
Stress relaxation properties have a significant impact on the performance of polyvinyl chloride (PVC) geomembranes (GMBs) at the peripheral joints of the membrane faced rockfill dam (MFRD). This paper presents a fractional order viscoelastic model (FOVM) to measure the relaxation stress as a function of time. Model parameters were obtained by best fit to results from wide-width strip tensile tests conducted at three tensile rates and three initial strains for 48 h. The results of a 90 d stress relaxation test demonstrate the applicability of the model to describe the stress relaxation behavior of PVC GMBs. The tensile rate and initial strain marginally influenced the relaxation modulus rate, while having no effects on the fractional derivative order. Residual stress could account for the difference in relaxation stress between the longitudinal and transverse specimens. Finally, the FOVM could be used for predicting the service cycle under specifying failure stress criteria. Furthermore, it has great potential for applications in predicting the long-term deformation of PVC GMBs at the peripheral joints of MFRD. Furthermore, it has great potential for applications in predicting the long-term deformation of PVC GMBs at the peripheral joints of MFRD.
1. Introduction
Polyvinyl chloride (PVC) geomembranes (GMBs) have been applied in membrane faced rockfill dams (MFRDs) for their outstanding flexibility, strong adaptability to deformation, and low permeability, thereby making them candidates as anti-seepage materials [1,2]. As known, they have a nonlinear stress–strain behavior that depends on strain rate and time [3,4,5,6,7], and undergo time-dependent decreases in stress under constant strain (i.e., stress relaxation). The stress relaxation behavior plays a critical role in the mechanical properties of PVC GMBs, and tests can be performed by applying a constant strain and measuring the corresponding stress required to maintain the deformation as a function of time.
At the peripheral joints of the MFRD, the GMB is placed with one end on the dam surface, relying on the interface friction to maintain stability when subjected to water load [8,9,10], and the other end anchored on the plinth of the dam abutment or the top of the concrete antiseepage wall (See Figure 1). Generally, the GMB on the dam surface can accommodate the local small deformation at the bottom of the gravel cushion, while that at the peripheral joints is subjected to large tensile deformation due to differential displacement between the dam body and abutment. The tensile deformation mainly in the initial impoundment of the reservoir and operation results in decreasing stress, and then the anti-seepage structure is susceptible to failure.
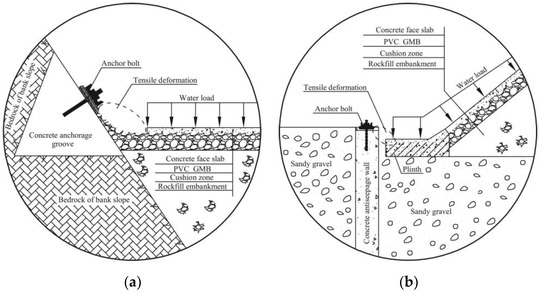
Figure 1.
Anchorage of PVC GMBs in MFRD: (a) on the plinth of the dam abutment; (b) on the top of the concrete antiseepage wall.
There has been extensive research on the establishment of a constitutive model to theoretically describe stress relaxation behavior. The simplest was the classical Maxwell model (one spring and one dashpot in series), and then several generalized Maxwell models were established [11,12,13], combining springs and dashpots in diverse ways. Thereafter, alternative models were developed, including linear and nonlinear viscoelastic models [14], viscoplastic models [15,16], three-component models [17,18,19,20], Zener models [21,22], Poynting Thomson models [23], and viscoelastic–viscoplastic models [24,25]. All models can evaluate the stress relaxation behavior of polymers. However, they are based on constitutive equations with differential operators of integer order. Pronounced relaxation behavior that spans over several decades requires many Kelvin–Voigt or Maxwell elements, respectively, leading to numerous parameters to be identified from experimental data. For this reason, the models fail to predict accurately the relaxation stress at specified relaxation time.
In contrast, the FOVM based on fractional-order calculus was found to describe complex stress relaxation of polymers with fewer parameters [26,27]. The use of fractional operators in viscoelastic material models was justified, consistent with molecular theories by Bagley and Torvik [28]. Therefore, the FOVM was successfully applied in describing the relaxation behavior of other viscoelastic materials [29,30]. However, rather less attention has been paid to its application to the GMBs.
The purpose of this paper is to provide and validate a viscoelastic constitutive model, i.e., FOVM, for modeling the stress relaxation in a 2.0 mm thick, PVC GMB at 20 ± 1 °C: (1) Formulate the FOVM based on fractional-order calculus; (2) Identify the model parameters by best fit to results from wide-width strip tensile tests conducted over a range of tensile rates; (3) Verify the feasibility of FOVM in simulating the stress relaxation response of PVC GMBs; (4) Investigate the effects of tensile rate and initial strain on the model parameters, stress relaxation rate, and relaxation modulus, and analyse the residual stress during the relaxation process.
2. Materials and Test Methods
2.1. Materials and Apparatus
According to statistics by the International Commission on Large Dams (ICOLD) in 2010, PVC GMBs commonly used in MFRD higher than 150 m, generally have a thickness above 1.5 mm. The commercially available GMB selected in this paper is a 2.0 mm thick PVC GMB made using the calendaring technology, with a single roll of 45.0 m long and 2.0 m wide, manufactured by Hongxiang New Material Co., Ltd. The index properties of PVC GMBs are reported in Table 1. The chemical composition of PVC GMB is, respectively, PVC resin (47.4%), plasticizer (mainly dihexyl phthalate, 30%) stabilizer (2.1%), filler(20%) and antioxidant (0.5%).

Table 1.
Index properties of PVC GMBs.
The test setup (shown in Figure 2) consists of the temperature control system, the tensile testing machine for geosynthetics (TTMG), the controller, and the data acquisition system. The temperature control system can control the temperature in the range of 4 to 35 °C accurate to 0.5 °C. The TTMG (CMT-5000, Nss(Shenzhen) Laboratory Equipment Co., Ltd., Shenzhen, China) was employed to perform the tensile tests, with parameters as follows: maximum load of 30.0 kN, maximum stroke of 2.1 m and deformation measurement range of 0.2 to 100 mm with error in 0.5 mm. The data acquisition system (CJ-3600) was adopted with a frequency ranging from 200 to 2000 Hz. The test temperature was 20 ± 1 °C, and stress relaxation was monitored for 48 h.
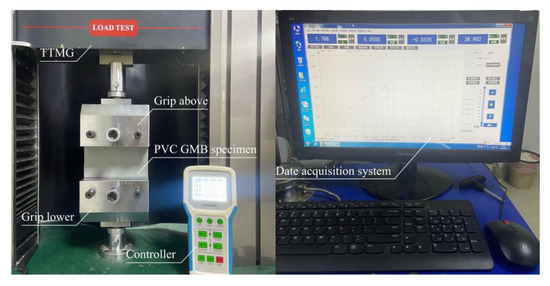
Figure 2.
Diagram of stress relaxation test setup.
2.2. Specimens Preparation
Previous research [34,35] has demonstrated that the mechanical properties of PVC GMBs vary in the transverse and the longitudinal direction. To enhance the reliability of test results, the specimens in both directions, denoted by symbols T and L in this work, respectively, were taken from single rolls of the product and cut with the long dimension parallel to the machine direction. A special GMB cutter and punching machine were used to cut the specimens along the longitudinal and transverse directions, and the prepared specimens were 200 mm wide and 180 mm long. A marker was used to draw a 200 mm marked line along the width direction with 40 mm away from both ends of the length direction. The distance between two parallel marked lines, namely the gauge length of the test specimen, was 100 mm. To assess the effects of tensile rates and initial strains on the stress relaxation properties, three tensile rates were selected, 2.5, 5.0, and 10.0 mm/min, and three initial strains were investigated, 40.55%, 58.78%, and 81.09% to simulate the PVC GMBs at the peripheral joints during construction and initial impoundment of the reservoir. According to the tensile rates and initial strains, 18 groups of tests were designed (nine for transverse specimens and nine for longitudinal specimens), and five specimens were prepared for each group.
2.3. Test Procedures
When loading the specimens, the controller was employed to adjust the distance between the upper and lower grips of TTMG, and the grip was equipped with two corrugated clamps inside. Firstly, place the specimen between the clamps of the upper grip with the marking line coinciding with the horizontal surface at the bottom of the grip, and tighten the specimen using the fastening bolts on the grips. Next, adjust the distance between the upper and lower grips again, and load the specimen in the lower grip using the same method. The loaded specimen must be kept flat and cannot be tilted, otherwise reload the specimen.
The stress relaxation control program was edited in the data acquisition system to realize that the stretching automatically stops and the tensile displacement remains constant at the set tensile displacement, and the tension sensor collected the tension of the specimen continuously until the set relaxation time is reached.
Procedures:
- (1)
- Set the test temperature and start the temperature control system, when the temperature maintains stability, turn to step (2).
- (2)
- Place the prepared specimen in the TTMG, and set the tensile rate and tensile displacement according to the test scheme.
- (3)
- Select the stress relaxation mode of the data acquisition system, and then set the terminal tensile displacement as the initial deformation of GMB. Maintain the frequency at 1000 Hz, and start the TTMG.
- (4)
- Once the TTMG stops, measure the thickness and width at the center of the specimen, and acquire the tension for 48 h.
- (5)
- Repeat step (2) to start the next test until all tests are completed.
3. Formulation of the FOVM
As the classical viscoelastic model is constructed based on springs and dashpots, and these equations take the form of integer order differential or integral, simple combinations of elements fail to accurately describe the long-term stress relaxation. Increasing the number of elements and changing the form of the combination are generally employed to improve the fitting accuracy; however, the increased parameters lead to the instability of the model [36]. The spring-pot is used instead of springs and dashpots, and the constitutive equation based on fractional-order differential can describe the stress relaxation of polymers with good stability [30,37]. A fractional-order Maxwell model (illustrated in Figure 3b) is constructed by replacing the spring and dashpot in the classical Maxwell model (see Figure 3a) with the spring-pot.
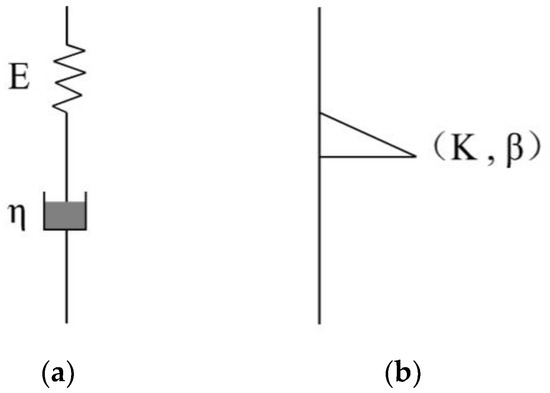
Figure 3.
Viscoelastic model: (a) classical Maxwell model; (b) fractional order Maxwell model.
By Hooke’s law and Newton’s law, we can write out the following equations.
where is the relaxation stress, is the elastic modulus, is the viscosity coefficient, and represent the zero-order and first-order derivative of with respect to , respectively, is the strain as a function of time, and is the relaxation time.
Based on the Bollzman superposition principle, the relaxation stress can be formulated as
is the relaxation modulus, and its self-similar power law form is:
is the Gamma function, defined as:
As the PVC GMB is viscoelastic, the -order Riemann–Liouville derivative is introduced here as follows:
where is the fractional derivative order. 0 and m − 1, is the minimal integer greater than , , is integrable on , + and is differentiable on , +.
Combining Equations (3), (4) and (6) yields
Let
when = 0, Equation (8) is the same as Equation (1), and the spring-pot exhibits the properties of a spring, and K is equivalent to the modulus of elasticity. When = 1, Equation (8) is the same as Equation (2), and the spring-pot exhibits the properties of a dashpot, and K is equivalent to the coefficient of viscosity. Therefore, the spring-pot is a viscoelastic element with the properties of between a spring and a dashpot.
The initial strain of the specimen in the relaxation stress state is a constant , and Equation (8) becomes
Equation (9) can be simplified by taking the logarithm of both sides, namely
Let
Equation (10) simplifies to
where is the logarithm of relaxation stress at the relaxation time of 1 h.
Thus, the FOVM expressed by Equation (12) was established to evaluate the stress relaxation behavior of PVC GMBs. A relationship between and is needed to build the model, while the wide-width strip tensile tests were conducted to explore such a relationship and the variation of and is readily measured. The following section presents the tensile test results and how the model parameters are identified from the test data, together with the verification of the model.
4. Results
4.1. Wide-Width Strip Tensile Test Results
Engineering strain is expressed by a ratio of the increment of gauge length to the initial gauge length (Equation (13)) in engineering practice. It is proved that the engineering strain is merely appropriate at small strains. However, it varies remarkably with the true strain at larger strains. Merry and Bray deduced the formula for the theoretical strain in the gauge by calculus (Equation 14), already included in ASTM D5323-92 [38].
where is the engineering strain, is the increment of the gauge length, is the initial gauge length of the specimen, is the distance between gauge marks at any time, and is the theoretical strain.
Both the width and thickness of the specimen decrease during the uniaxial tensile test. Zhang [35] measured the Poisson’s ratios in the transverse and longitudinal directions of the material using the digital image correlation (DIC) non-contact measurement method, and concluded that the Poisson’s ratio and of PVC GMB were 0.51, 0.49, respectively.
The relaxation stress is calculated by tension divided by the deformed width and thickness (Equation (15)).
where is the relaxation stress, is the measured force acting on the specimen during the uniaxial tension test, is the cross-sectional area of the specimen during the uniaxial tension test, is the initial width of the specimen, is the initial thickness of the specimen, is the transverse Poisson’s ratio, and is the longitudinal Poisson’s ratio.
Figure 4 reports the stress-relaxation curves of transverse and longitudinal specimens at distinct tensile rates and initial strains. The variation of relaxation stress with time follows similar patterns among the specimens. As expected, the relaxation stress declined sharply at the initial stage, followed by a slow degradation until it reached stability. According to the relaxation rate, the stress relaxation curve was classified into two typical stages, characterized by a faster stress-relaxation rate at the initial stage and a relatively low value subsequently. Moreover, the dividing point between the two stages is approximately located at a relaxation time of 2 h.

Figure 4.
Stress relaxation curves at different tensile rates and initial strains: (a) v = 2.5 mm/min; (b) v = 5.0 mm/min; (c) v = 10.0 mm/min.
The longitudinal specimens shared similar patterns with the transverse specimens at the same tensile rate and initial strain, and the relaxation stress in the former was slightly higher than that in the latter. This may be attributed to the stress state of the material during the production process. At the same tensile rate, a greater initial strain resulted in a higher relaxation stress, and hence the time for relaxation stress to stabilize was longer. For example, at a tensile rate of 2.5 mm/min, the average relaxation stress and the time for relaxation stress to stabilize at the initial strain of 81.09%, 58.78%, and 40.55% were (4.75 MPa, 39.5 h), (3.21 MPa, 29.9 h), and (2.10 MPa, 25.8 h), respectively. One possible explanation for this discrepancy is that the specimen was subjected to a greater tension at a larger tensile strain, while the width and thickness decreased. Consequently, the initial strain affects the relaxation stress and the time for relaxation stress to stabilize.
The comparison of the stress-time curves for distinct tensile rates suggests that at the same initial strain, a slower tensile rate resulted in a lower relaxation stress and shorter time for relaxation stress to stabilize, namely, viscous response of the material. Significant changes in the relaxation stress were observed between the transverse and the longitudinal specimens, exhibiting higher values in the longitudinal direction than those in the transverse direction over the entire stress relaxation period. As the initial strain increased at the same tensile rate, the difference between them increased. Likewise, it increased with the increase in the tensile rate at the same initial strain. This indicates that the relaxation stress of both transverse and longitudinal specimens is closely associated with both the tensile rate and initial strain.
4.2. Identification of Model Parameters
As mentioned above, the fractional two-parameter model would be sufficient to describe the stress relaxation behavior of PVC GMBs. The parameters, and , were identified by taking the logarithms of the relaxation stress and relaxation time from the test data and then fitting them with the FOVM. As observed in fitting curves of versus in Figure 5, the relaxation stresses calculated by the FOVM matched the general pattern and magnitude of the experimental values, exhibiting a pronounced linear relation between them. has a constant value of 0.125, and was calculated by Equation (11). All the model parameters are summarized in Table 2. The correlation coefficients, R2 (0.991–0.997), at different initial strains and tensile rates were all greater than 0.99, indicating that the FOVM describes the stress relaxation law of PVC GMBs with high accuracy.

Figure 5.
Fitting results of the curves: (a) v = 2.5 mm/min; (b) v = 5.0 mm/min; (c) v = 10.0 mm/min.

Table 2.
Model parameters determined through fitting with the test data.
In Equation (9), as reaches positive infinity, approaches zero, following the general rule of stress relaxation. For a given relaxation time, the relaxation stress can be accurately predicted in theory. Furthermore, if the relaxation stress for judging the failure of PVC GMBs is provided, the FOVM can predict their service life theoretically. For the transverse specimen tested at 5.0 mm/min, while the relaxation stress approaches approximately 15% of initial stress, the relaxation time at the initial strain of 40.55%, 58.78%, and 81.09% were 212, 375, and 395 d, respectively.
4.3. Verification of the FOVM
To verify the correctness of the FOVM, a long-term stress relaxation test was carried out at a tensile rate of 5.0 mm/min and 40.55% initial strain for transverse specimens, and the relaxation stress was monitored for 90 d. Subsequently, the calculated results using the FOVM were compared with the actual monitoring data.
Figure 6a shows a comparison between the experimental data and the calculated relaxation stress. The experimental data corresponded well with the theoretical values. Figure 6b presents a comparison between the monitoring data and the calculated values for every 10 d. The difference in relaxation stress was within 0.02 ± 0.002 MPa, an extremely small figure, at specified times other than 10 d and 20 d, where it was within 0.04 ± 0.002 MPa, thus demonstrating that the longer the relaxation time is, the higher the accuracy of the FOVM to predict the relaxation stress. Consequently, the FOVM predicts reasonably well the relaxation stress and proves to be an efficient approach to estimating the stress relaxation properties of PVC GMBs.
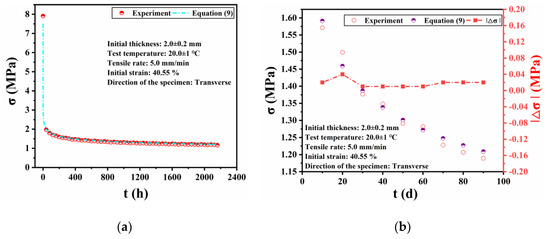
Figure 6.
Comparison between the experimental data for 90 d and the calculated results by Equation (9): (a) overall trend; (b) difference in relaxation stress at specified time.
5. Discussion
5.1. Analyses of Model Parameters
The FOVM established in Section 3 contains two parameters: the fractional derivative order and viscoelastic parameter . As reported in Section 4.2, the constant indicates no correlation with the tensile rate and initial strain, and hence it has no impact on the variation of relaxation stress with time, whereas the viscoelastic parameter varies with the tensile rate and initial strain.
Figure 7 presents the linear relationship between and tensile rate v at three initial strains. The linear function K = av + b was used for fitting, and the fitting parameters are described in Table 3. As shown, all the correlation coefficients exceeded 0.96, verifying the accuracy of fitting results. Moreover, the viscoelastic parameter decreased linearly with the tensile rate, that is, the lower the tensile rate, the more obvious the viscoelasticity.
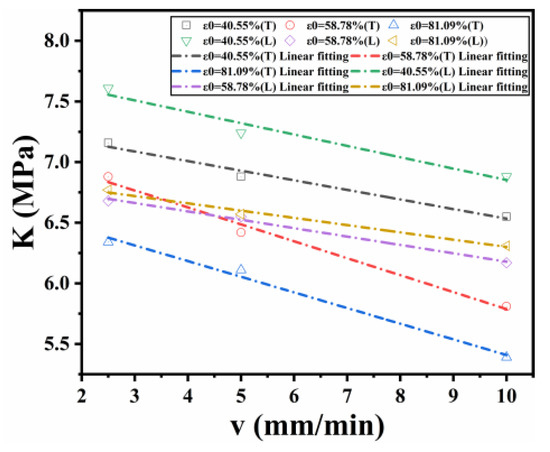
Figure 7.
Relationship between and tensile rate v at three initial strains.

Table 3.
Fitting parameters by fitting a line between and tensile rate v.
Figure 8 presents the relationship between and initial strain at three tensile rates. The function was chosen for fitting, and the results are listed in Table 4. The correlation coefficients of the transverse specimens, in the range of 0.943 to 0.989, were all greater than 0.94, indicating an outstanding linear relation with relatively high accuracy, whereas no linear relation between and of the longitudinal specimens was noted. For the transverse specimens, the viscoelastic parameter tends to decrease linearly with the increasing initial strain, or, a smaller initial strain corresponds to a larger , suggesting more remarkable viscoelasticity. The reason is that the smaller initial strain results in less work done by axial tension, and a shorter time for viscoelastic materials to adjust internal energy. Whereas, no linear relation between and was observed in the longitudinal specimens, which may be likely due to their residual stresses.
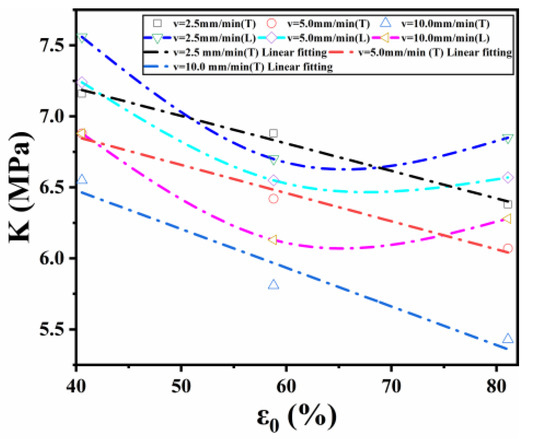
Figure 8.
Relationship between and initial strain ε0 at three tensile rates.

Table 4.
Fitting parameters by fitting a line between and initial strain ε0.
In general, the viscoelastic parameter in the FOVM is negatively correlated with both the tensile rate and initial strain, while is a constant, irrelevant to the initial strain, direction of the specimen, and tensile rate.
5.2. Stress-Relaxation Rate
In addition to −dσ/dt, −d(σ/σ0)/d(lnt) and −dσ/d(lnt) are also frequently adopted to characterize the stress relaxation rate in the dynamics on stress relaxation of polymers [39]. Figure 9 presents the stress-relaxation rate expressed by −d(σ/σ0)/d(lnt) at three tensile rates. As observed, the stress-relaxation rate was positively correlated with σ/σ0, the initial relaxation rate reached the maximum at 58.78% strain and the minimum at 81.09% strain at identical tensile rates, and the longitudinal specimens had higher values than the transverse specimens. The relaxation stress is related to the initial stress σ0 and the relaxation time, and σ0 depends on the tensile rate and initial strain. The comparison shows that the specimen at a larger tensile rate has a higher initial stress-relaxation rate.

Figure 9.
Stress-relaxation rate at different tensile rates: (a) v = 2.5 mm/min; (b) v = 5.0 mm/min; (c) v = 10.0 mm/min.
The stress-relaxation rate distributes more densely with smaller σ/σ0, the curves can be classified into initial and later stages, considering the denser distribution as the later stage, and vice versa as the initial stage. The boundary between the two stages is significantly affected by the tensile rate, considering the σ/σ0 in the range of 0.45 to 1.0 as the initial stage at v = 2.5 mm/min, 0.4 to 1.0 at v = 5.0 mm/min and 0.35 to 1.0 at v = 10.0 mm/min. This indicates that a larger tensile rate leads to a relatively narrower range of σ/σ0. This is mainly caused by the fact that the frozen polymer chain segments of rapidly stretched specimens fail to overcome the energy barriers and move in time, resulting in low energy loss, and when the stretching is completed, they gradually overcome the energy barriers and move activated by the high stored energy, resulting in the accelerated energy loss and a faster initial relaxation rate.
The relaxation rate slowly decreases at the later stage for the reason that the polymer chain segments move slowly due to the almost stored energy in the specimen released at the initial stage, and then the relaxation stress per unit time reduces. Either a larger tensile rate or a larger initial strain leads to a lower stress relaxation rate at the later stage, indicating a longer time required for the relaxation stress to reach stability. This may be because the specimen is subjected to larger tensile deformations, more work is performed by the external force at greater strains, and more energy is stored internally.
5.3. Residual Stress
The residual stress, , refers to the constant relaxation stress after sufficient relaxation time. As a consequence of the internal stress of polymers, it is composed of two parts: the residual stress induced by the thermal history during the forming process, and the internal stress caused by the deformation during the stress relaxation process.
The residual stress can be derived from the stress relaxation curves at different tensile rates and initial strains. The residual stress can be determined as follows: Firstly, plot the −dσ/dlnt versus σ curves in Figure 10 and establish the maximum of −dσ/dlnt. Secondly, plot (−dσ/dlnt)max against of the longitudinal and transverse specimens in Figure 11a,b. Finally, connect the points at different initial strains but the same tensile rate and fit them with a straight line, and its intercept is regarded as . This is because the polymers should first overcome before the relaxation activation energy barrier under constant strains. In other words, as the initial stress less than is applied, the polymers fail to deform. Therefore, the residual stress corresponds to the initial stress when (−dσ/dlnt)max extrapolated to zero. Figure 11a,b display the relationship between (−dσ/dlnt)max and σ0 of longitudinal and transverse specimens, respectively. The initial stresses of transverse specimens at different tensile rates were close to zero, indicating that no residual stress exists or has been relaxed in the transverse direction. However, those of longitudinal specimens were approximately −0.98 Mpa, indicating that in the longitudinal direction is 0.98 Mpa. This may be explained by the fact that as the PVC GMBs in the longitudinal direction are subjected to the traction by roller crimping, molecular orientation appears at a high temperature. Nevertheless, it does not return in time as the temperature quickly reduces at the extrusion exit, resulting in the stored stress in the material. Due to no crimping traction in the transverse direction, the PVC GMBs are not constrained, and hence no molecular orientation exists as the temperature reduces.
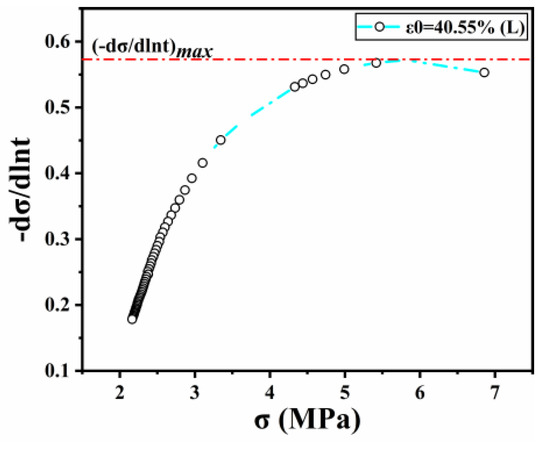
Figure 10.
Curve of −dσ/dlnt versus σ.
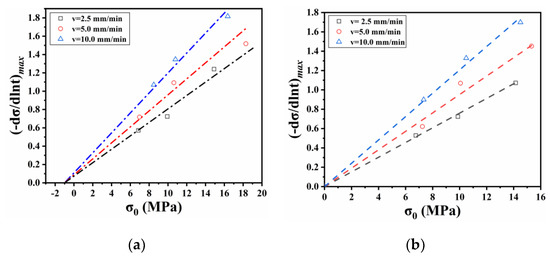
Figure 11.
Relationship between (−dσ/dlnt)max and σ0: (a) longitudinal specimens; (b) transverse specimens.
Due to the polymer cross-linked amorphous structure of PVC GMBs, no crystallization occurs, or . Therefore, the total residual stress is primarily the residual stress induced by the thermal history in the forming process. The discrepancy in residual stress between the longitudinal and the transverse specimens essentially accounts for the difference in relaxation stress during the stress relaxation process.
6. Conclusions
This paper presents a viscoelastic constitutive model, namely the FOVM, for simulating the stress relaxation behavior of PVC GMBs in a single direction at the peripheral joints of MFRD, which cannot represent actual deformation. Model parameters were obtained by best fit to results from wide-width strip tensile tests on longitudinal and transverse specimens conducted at the initial strain of 40.55%, 58.78%, and 81.09%. The accuracy of the FOVM in predicting the relaxation stress at any time was then verified by performing a long-term stress relaxation test for 90 d, and the FOVM proved to be an efficient approach to estimating the stress relaxation properties of PVC GMBs. Based on the results of the present investigation, the following conclusions can be drawn.
- (1)
- The stress relaxation behavior of PVC GMB was strongly associated with tensile rate, initial strain, and longitudinal and transverse directions, and the higher the initial strain and tensile rate, the longer time for the relaxation stress to stabilize. The relaxation stress in longitudinal direction was higher than that in transverse direction under the same initial strain and tensile rate.
- (2)
- The fractional-order Maxwell model constructed from a single spring-pot contained two parameters, β and K. The relaxation stress of PVC GMB deduced by the model was in good agreement with the measured value. If the criteria for relaxation stress at failure are provided, the FOVM could predict the corresponding relaxation time, and then examine whether the project satisfies the service cycle.
- (3)
- The fractional derivative order was found to be independent of initial strain and tensile rate. Whereas the viscoelastic parameter was associated with initial strain and tensile rate, and decreased linearly with the tensile rate for both transverse and longitudinal specimens. A linear decrease in the of transverse specimens with the initial strain was observed, while a nonlinear relation was detected in the longitudinal specimens.
- (4)
- Due to the orientation of polymer chain segments, the residual stress appeared in longitudinal specimens during the production process, whereas no residual stress existed in transverse specimens, which primarily account for the difference in relaxation stress between the longitudinal and transverse specimens.
The FOVM provides some insight into the stress relaxation behavior of PVC GMBs and predicts the relaxation stress at any time with great accuracy. Moreover, it has great potential for applications in predicting the long-term deformation of PVC GMBs at the peripheral joints of MFRD to prolong the relaxation time at failure and the service life of the project. For example, the PVC GMBs can be subjected to lower initial strain and tensile rate by taking measures to reduce their differential displacement and settlement rate at the peripheral joints of MFRD.
The PVC GMBs at the peripheral joints in practice are subjected to horizontal opening displacement, vertical settlement displacement, and shear displacement. Although the tensile deformation produced by the former two can be synthesized in a single direction, that induced by the shear displacement still exists. This paper focuses on the stress relaxation behavior of PVC GMBs in a single direction, which cannot represent their true deformations. Future work should take into account the shear strain in the stress relaxation properties of PVC GMBs.
Author Contributions
Conceptualization, Y.W.; methodology, C.Y. and Y.W.; validation, X.G.; formal analysis, Y.W.; data curation, Y.W.; writing—original draft preparation X.Z.; writing—review and editing, Y.W. and X.Z. All authors have read and agreed to the published version of the manuscript.
Funding
This research was funded by the National Natural Science Foundation of China (grantnumbers 51079047, 51379069). The authors would like to acknowledge the anonymous referees whose comments helped us improve the presentation of this paper.
Institutional Review Board Statement
Not applicable.
Informed Consent Statement
Not applicable.
Data Availability Statement
Not applicable.
Conflicts of Interest
The authors declare no conflict of interest.
Nomenclature
Basic SI units are given in parentheses.
| relaxation stress (Pa) | |
| E | elastic modulus (Pa) |
| viscosity coefficient(Pa·s) | |
| viscoelastic parameter (Pa) | |
| strain (dimensionless) | |
| t | relaxation time (s) |
| fractional derivative operator (dimensionless) | |
| fractional derivative order (dimensionless) | |
| -order Riemann–Liouville derivative (dimensionless) | |
| relaxation modulus | |
| arbitrary positive real number (dimensionless) | |
| Gamma function (dimensionless) | |
| minimal integer greater than (dimensionless) | |
| initial strain (dimensionless) | |
| logarithm of relaxation stress at the relaxation time of 1 h (Pa) | |
| engineering strain (dimensionless) | |
| theoretical strain (dimensionless) | |
| increment of the gauge length (m) | |
| distance between gauge marks at any time (m) | |
| initial gauge length of the specimen (m) | |
| measured force acting on the specimen during the uniaxial tension test (N) | |
| cross-sectional area of the specimen during the uniaxial tension test (m2) | |
| initial width of the specimen (m) | |
| initial thickness of the specimen (m) | |
| transverse Poisson’s ratio (dimensionless) | |
| longitudinal Poisson’s ratio (dimensionless) | |
| tensile rate (m/s) | |
| initial relaxation stress (Pa) | |
| residual stress of polymers (Pa) | |
| residual stress induced by the thermal history during the forming process (Pa) | |
| internal stress caused by the deformation during the stress relaxation process (Pa) |
References
- Koerner, R.; Wilkes, J. 2010 ICOLD bulletin on geomembrane sealing systems for dams. Geosynthetics 2012, 30, 34–36,38,40,42–43. [Google Scholar]
- Scuero, A.; Vaschetti, G. Geomembrane sealing systems for dams: ICOLD bulletin 135. Innov. Infrastruct. Solut. 2017, 2, 29. [Google Scholar] [CrossRef]
- Giroud, J. Quantification of geosynthetic behavior. Geosynth. Int. 2005, 12, 2–27. [Google Scholar] [CrossRef]
- Merry, S.; Bray, J. Geomembrane response in the wide strip tension test. Geosynth. Int. 1996, 3, 517–536. [Google Scholar] [CrossRef]
- Wesseloo, J.; Visser, A.; Rust, E. A mathematical model for the strain-rate dependent stress–strain response of HDPE geomembranes. Geotext. Geomembr. 2004, 22, 273–295. [Google Scholar] [CrossRef]
- André, J.; Cruz Pinto, J. Modeling nonlinear stress relaxation of polymers. Polym. Eng. Sci. 2014, 54, 404–416. [Google Scholar] [CrossRef]
- Cardile, G.; Moraci, N.; Pisano, M. Tensile behaviour of an HDPE geogrid under cyclic loading: Experimental results and empirical modelling. Geosynth. Int. 2017, 24, 95–112. [Google Scholar] [CrossRef]
- Shu, Y.M.; Wu, H.M.; Jiang, X.Z. Need and key technology on development of high membrane faced rockfill dam: Key technology of high membrane faced rockfill dam (I). Adv. Sci. Technol. Water Resour. 2015, 35, 1–9. [Google Scholar]
- Shu, Y.M.; Wu, H.M.; Jiang, X.Z.; Gu, K. Mechanism of anchoring influence at perimeter of high membrane faced rockfill dam and eliminating approach: Key technology of high membrane faced rockfill dam (II). Adv. Sci. Technol. Water Resour. 2015, 35, 10–15. [Google Scholar]
- Shu, Y.M.; Wu, H.M.; Jiang, X.Z. The development of anti-seepage technology with geomembrane on reservoirs and dams in China. Chin. J. Geot. Eng. 2016, 38, 1–9. [Google Scholar]
- Kelly, P. A viscoelastic model for the compaction of fibrous materials. J. Text. Inst. Proc. Abstr. 2011, 102, 689–699. [Google Scholar] [CrossRef]
- Ma, Y.; Xuan, C.; Wu, P.; Yang, J.; Su, H.; Zhang, Y. Experiment on stress relaxation of corn stover during compression with assisted vibration. Trans. Chin. Soc. Agric. Eng. 2016, 32, 88–94. [Google Scholar]
- Du, X.X.; Wang, C.G.; Guo, W.B.; Wang, H.B.; Jin, M.; Liu, X.D.; Li, J. Stress relaxation characteristics and influencing factors of sweet sorghum: Experimental study. Bioresources 2018, 13, 8761–8774. [Google Scholar] [CrossRef]
- Spathis, G.; Katsourinis, S.; Kontou, E. Evaluation of fundamental viscoelastic functions by a nonlinear viscoelastic model. Polym. Eng. Sci. 2017, 57, 1389–1395. [Google Scholar] [CrossRef]
- Zhang, C.; Moore, I. Finite element modelling of inelastic deformation of ductile polymers. Geosynth. Int. 1997, 4, 137–163. [Google Scholar] [CrossRef]
- Eldesouky, H.; Brachman, R. Viscoplastic modelling of HDPE geomembrane local stresses and strains. Geotext. Geomembr. 2020, 48, 41–51. [Google Scholar] [CrossRef]
- Hirakawa, D.; Kongkitkul, W.; Tatsuoka, F.; Uchimura, T. Time-dependent stress–strain behavior due to viscous properties of geogrid reinforcement. Geosynth. Int. 2003, 10, 176–199. [Google Scholar] [CrossRef]
- Kongkitkul, W.; Chantachot, T.; Tatsuoka, F. Simulation of geosynthetic load–strain–time behaviour by the non-linear three-component model. Geosynth. Int. 2014, 21, 244–255. [Google Scholar] [CrossRef]
- Ezzein, F.; Bathurst, R.; Kongkitkul, W. Nonlinear load-strain modeling of polypropylene geogrids during constant rate-of-strain loading. Polym. Eng. Sci. 2015, 55, 1617–1627. [Google Scholar] [CrossRef]
- Siddiquee, M.; Dhar, A. A novel viscoplastic model of high-density polyethylene pipe material. Geosynth. Int. 2015, 22, 173–182. [Google Scholar] [CrossRef]
- Chen, L.J.; Liao, N.; Xing, L.; Han, L.J. Description of Wheat Straw Relaxation Behavior Based on a Fractional-Order Constitutive Model. Agron. J. 2013, 105, 134–142. [Google Scholar] [CrossRef]
- Yin, Y.L.; Yang, Z.H.; Shi, M.L. Complex plane analysis of fractional derivative model and its use for parameter determination of viscoelastic material. IOP Conf. Ser. Mater. Sci. Eng. 2019, 592, 012009. [Google Scholar] [CrossRef]
- Zhou, Y.N.; Chen, Y.P.; Chen, J.J. Study of fractional order Poynting-Thomson rheological model. J. Southwest Univ. Sci. Technol. 2013, 28, 31–35. [Google Scholar]
- Chehab, A.; Moore, I. Constitutive model for high density polyethylene to capture strain reversal. In Pipelines 2006; American Society of Civil Engineers: Reston, VA, USA, 2006; pp. 1–8. [Google Scholar] [CrossRef]
- Kühl, A.; Muñoz-Rojas, P.; Barbieri, R.; Benvenutti, I. A procedure for modeling the nonlinear viscoelastoplastic creep of HDPE at small strains. Polym. Eng. Sci. 2017, 57, 144–152. [Google Scholar] [CrossRef]
- Stiassnie, M. On the application of fractional calculus for the formulation of viscoelastic models. Appl. Math. Model. 1979, 3, 300–302. [Google Scholar] [CrossRef]
- Nonnenmacher, T.; Glockle, W. A fractional model for mechanical stress relaxation. Philos. Mag. Lett. 1991, 64, 89–93. [Google Scholar] [CrossRef]
- Bagley, R.; Torvik, P. A theoretical basis for the application of fractional calculus to viscoelasticity. J. Rheol. 1975, 27, 201–210. [Google Scholar] [CrossRef]
- Schmidt, A.; Gaul, L. Finite element formulation of viscoelastic constitutive equations using fractional time derivatives. Nonlinear Dyn. 2002, 29, 37–55. [Google Scholar] [CrossRef]
- Müller, S.; Kästner, M.; Brummund, J.; Ulbricht, V. A nonlinear fractional viscoelastic material model for polymers. Comput. Mater. Sci. 2011, 50, 2938–2949. [Google Scholar] [CrossRef]
- ASTM D5199-12; Standard Test Method for Measuring the Nominal Thickness of Geosynthetics. ASTM International: West Conshohocken, PA, USA, 2019.
- ASTM D5261-10; Standard Test Method for Measuring Mass per Unit Area of Geotextiles. ASTM International: West Conshohocken, PA, USA, 2018.
- ASTM D4885-01; Standards Test Method for Determining Performance Strength of Geomembranes by the Wide Strip Tensile Method. ASTM International: West Conshohocken, PA, USA, 2018.
- Giroud, J. Poisson’s ratio of unreinforced geomembranes and nonwoven geotextiles subjected to large strains. Geotext. Geomembr. 2004, 22, 297–305. [Google Scholar] [CrossRef]
- Zhang, X.L.; Ma, Z.Y.; Wu, Y.Y.; Liu, J.Q. Response of mechanical properties of polyvinyl chloride geomembrane to ambient temperature in axial tension. Appl. Sci. 2021, 11, 864. [Google Scholar] [CrossRef]
- Heymans, N. Constitutive equations for polymer viscoelasticity derived from hierarchical models in cases of failure of time–temperature superposition. Signal Process. 2003, 83, 2345–2357. [Google Scholar] [CrossRef]
- Heymans, N.; Bauwens, J. Fractal rheological models and fractional differential equations for viscoelastic behavior. Rheola Acta 1994, 33, 210–219. [Google Scholar] [CrossRef]
- ASTM D 5323-92; Standard Practice for Determination of 2% Secant Modulus for Polyethylene Geomembranes. ASTM International: West Conshohocken, PA, USA, 1999.
- Cai, L.H.; Zhang, C.; Guo, B.H.; Xu, J.; Huang, H.Y. Stress relaxation behavior of Nylon 1010. Acta Polym. Sin. 2016, 3, 382–390. [Google Scholar] [CrossRef]
Disclaimer/Publisher’s Note: The statements, opinions and data contained in all publications are solely those of the individual author(s) and contributor(s) and not of MDPI and/or the editor(s). MDPI and/or the editor(s) disclaim responsibility for any injury to people or property resulting from any ideas, methods, instructions or products referred to in the content. |
© 2023 by the authors. Licensee MDPI, Basel, Switzerland. This article is an open access article distributed under the terms and conditions of the Creative Commons Attribution (CC BY) license (https://creativecommons.org/licenses/by/4.0/).