Article

Passive Cooling of PV Modules Using Heat Pipe Thermosiphon with Acetone: Experimental and Theoretical Study

by
Zakariya Kaneesamkandi
1,
Mohammed Jarallah Almalki
1,
Abdul Sayeed
1 and
Zeyad A. Haidar
2,3,*
1
Mechanical Engineering Department, College of Engineering, King Saud University, Riyadh 11421, Saudi Arabia
2
Sustainable Energy Technologies Center, College of Engineering, King Saud University, Riyadh 11421, Saudi Arabia
3
Electrical Engineering Department, College of Engineering, Aden University, Aden 6312, Yemen
*
Author to whom correspondence should be addressed.
Appl. Sci. 2023, 13(3), 1457; https://doi.org/10.3390/app13031457
Submission received: 19 November 2022 / Revised: 13 January 2023 / Accepted: 16 January 2023 / Published: 22 January 2023
(This article belongs to the Section Energy Science and Technology)

Abstract

:

Featured Application

A theoretical model for photovoltaic panel with heat pipe thermosiphon to dissipate the heat produced in the panel will be useful for designers to obtain accurate insight into its cooling performance under different configurations and external conditions.

Abstract

The effect of heat pipe thermosiphon in reducing the operating temperature of a photovoltaic panel has been analyzed theoretically and experimentally in this paper. Copper heat pipe thermosiphon with acetone as a working fluid was used. The theoretical study involved a heat balance analysis of the panel with cylindrical heat pipe with surface contact with the panel bottom. The experimental study involved recording temperature variations, with and without a heat pipe, which had very good agreement with the theoretical results of 2.61%. Additionally, the optimum quantity of acetone was 50 mL, with a maximum reduction in panel temperature of 10 °C.

1. Introduction

Cost of electricity produced by solar photovoltaic (PV) systems has seen an 80% decrease over the past 10 years and is currently at 57 USD per MWh [1]. Although 85% of this reduction is attributed to a decrease in panel cost, enhancement in the efficiency of the solar panel can increase the available power and decrease the price of electricity, making it available at a more affordable price, with reduced unfavorable environment effects. Persisting market pressure to reduce the cost per watt boosted the development of efficient renewable energy systems, thereby enhancing their performances and usage [2]. Apart from PV systems, efficiency improvement in renewable energy applications in heating, power generation, and desalination also underwent substantial development [3,4]. Solar PV technology is adaptable to different types of customers, due to its simple and trouble-free operation and direct end use [5]. Recent studies have established that a linear reduction in the power generation of a photovoltaic panel occurs when the panel temperature increases beyond its normal operating cell temperature, which is attributed to the fact that the voltage of the electrical output reduces due to the inherent material properties, thereby producing an overall decrease in the power output [6]. The heat present in the panel needs to be continuously removed, in order to maintain the optimum operating temperature, which can result in increased power output, efficiency, and extension in the service life of the panel. For this reason, enhancement in the thermal performance of the PV by cooling is focused recently in PV research [7].
Hybridization of the solar PV system is accomplished by coupling a cooling mechanism for simultaneous extraction and utilization of heat from a panel surface for useful end use [8]. Two different hybridization techniques were adopted and tested by researchers. These techniques can be classified as passive methods, in which no additional energy is used and active methods where extra energy is used to achieve forced circulation heat transfer. Passive techniques include the application of fins or extended surfaces to promote heat transfer or involves phase change cooling, heat pipe cooling, and natural circulation cooling using water/air as the heat absorbing medium. Active techniques use forced circulation of air or water on the panel surfaces, with the help of fans or pumps, with possible heat recovery for useful end use. Experimental results indicated that natural and forced convection hybridization methods achieved 10 °C and 30 °C decreases in the temperatures of the PV panels, respectively [9].
Numerical studies on panel cooling using heat sinks of different configurations and geometry reported a reduction in the panel temperature of about 10 °C, with a consequent increase in the power output from 6.97 to 7.55%, compared to the base case without heat sinks [10]. The fins were in the form of ribs at the back of the panel. The optimization of the fins design was investigated for passive cooling of PV panels [11].
Another study presented a novel design of the racking mechanical structure that was suggested to serve a dual function: mechanical support and heat sink [12]. A numerical study was conducted, and the results were compared to the experimental data. It was concluded that the temperature could be reduced by 6.3 °C, and the efficiency could be enhanced by 3%. A discontinuous heat sink was proposed and studied numerically and experimentally [13]. A reduction of 5 °C in the temperature of the PV panels was reported.
Heat pipe thermosiphon heat sinks were used to cool the concentrating solar PV system, due to extreme high operating temperatures [14]. Experimental study was conducted on three PCMs: Rubitherm RT-25 H (RT25), Rubitherm RT-35 H (RT35), and Rubitherm RT-44 H (RT44) with heat pipe to cool PV modules, and they found that the best PCM for PV modules cooling was RT35 [15]. The thermosiphon cooling technique was combined with the floating PV systems, and this method enhanced the power of the PV system by 3.34%, compared to the floating system without the thermosiphon cooling, and by 7.86%, compared to the ground mounted PV system [16].
Experimental study on a heat pipe array with air cooling or water cooling on the condenser side indicated that the air cooling method produced an increase in efficiency of 2.6%, and the water cooling method produced a 3% increase in efficiency [17]. The experimental tests on the application of different types of phase change material for cooling the panels were conducted and concluded that up to a 10.26 °C temperature reduction can be obtained, resulting in an efficiency improvement of 3.73% [18]. Although a considerable cooling rate was achieved, when PCM is used, the system becomes bulky, with a large volume of PCM required, apart from the thermal conductivity issues within the material. Studies on the water cooling of PV panels include either submerging the panel in water or circulating water through the tubes attached to the backside of the panels. The experimental effects of submerging the panel in water concluded that the panel temperature could be maintained at 30 °C, increasing the relative efficiency by 20%, but with a reduction in the intensity of solar radiation falling on the collector [19]. The comparison of air- and water-based methods show that water-based cooling system performance is higher than the air cooling system [8]. Thermosiphon systems without phase change using water was tested using a copper sheet and tubing at the back of the panel with a water capacity of 80 L, and they reported an increase in the relative efficiency of 19% [20].
Experiments on forced convection cooling include forced air cooling by using specially constructed ducts on the back of the panel using a 3.6 W fan and reported an improvement in the overall efficiency of 0.6% [21]. The experimental results of water cooling by providing aluminum pipes on the backside of the panel reported an efficiency gain of 0.8% [22]. Evaporative cooling using water is a kind of phase change cooling that can be active [23,24] or passive [25,26]. Generally, evaporative cooling is very effective in regulating the temperature of the PV modules. However, active systems need extra power and more equipment, making them unattractive.
While the passive systems mentioned above showed positive results, it was observed that the overall efficiency improvement was maximum in the case of thermosiphon method without phase change [20]. Additionally, the thermosiphon heat pipe method with the phase change tested on the concentrating collectors produced considerable cooling. Other methods showed inadequate heat transfer between the panel and the cooling fluid. The application of solid phase change material requires large volumes, due to the absence of re-circulation.
In this study, a heat pipe thermosiphon (HPT), which is a closed-loop evaporative cooling system, is tested to maintain an appropriate range of operating temperature in a solar panel after its temperature reaches a particular level. An experimental investigation of using HPT with copper pipes was conducted under real environmental conditions. Three different quantities of the phase change liquid (PCL) were used to find the optimum quantity that achieves best results. The theoretical study involves a lumped capacitance thermal model, which is used to predict the temperature of the PV panels with and without HPT.
The HPT cooling uses PCL, which evaporates by absorbing the heat produced by the panel once the panel temperature reaches its phase change temperature. Vapor rises up after evaporating at the heated region of the panel and condenses at the top section above the panel. It releases the heat to the surroundings through convection and radiation. Condensed liquid returns to the evaporation zone by gravity.

2. Experimental Study

Figure 1 shows the PV/HPT cooling experimental setup. The PV/HPT system comprises a solar PV panel mounted on inclined metallic frame work with the heat pipe tubes slightly flattened and attached to the bottom of the panel (Figure 1a,b). Acetone is the used as a PCL, due to its desirable phase change temperature of 56 °C [27]. Heat is rejected to the surrounding in the extended portion of the heat pipe where condensation of the working fluid (WF) takes place. The panel attached with HPT was filled with the acetone after completely evacuating the air from it.
The HPT tube is attached at the back of the panel. Another PV panel without a heat pipe is used as a reference for the comparison. The heat transfers by conduction through the layers of the PV panel and then into the HPT tube, which contains the WF. As the temperature rises and reaches the phase change temperature, the evaporation of WF takes place, and the vapor rises up along the tube to the condenser region. The condenser region condenses the vapors on its walls by dissipating heat to the surroundings, which is at a lower temperature than the condensing temperature of WF. The heat is transferred to the surroundings by convection and radiation from the HPT. The condensed liquid flows down to the evaporating zone, and the cycle is continued, thereby maintaining the desired temperature of the panel. The WF selection is based on the temperature of the panel to be maintained. The following instruments were used during the experimentation process:
  • A pyranometer to measure the global solar radiation.
  • Data acquisition to record the data and a personal computer.
  • K-type thermocouples to measure the temperatures at different location.
The panels were mounted on steel frames at a height of 1.75 m from the floor. The floor was made of red clay tiles. The panels were placed at an angle of 24° and were oriented towards the south in Riyadh, KSA. The diameter and thickness of the copper HPT were 0.025 m and 0.003 m, respectively. The area of the contact of HPT on the panel bottom surface was 0.0109 m2. The length of the HPT was 1.5 m.
Four K-type thermocouples were fixed on each panel at four different locations, with two points on the front side and the other two on the back side. Another thermocouple was also used to record the ambient temperature during the experimentation. The pyranometer was also fixed in a tilted position on the frame holding the panels. The thermocouples and pyranometer were connected to the data acquisition system, which was, in turn, connected to a computer with Daq plus software installed on it. The specifications of the thermocouple used is given below:
Material was (CHROMEGA®-ALOMEGA®), maximum temperature is 175 °C (350 °F) continuous, minimum temperature is −60 °C (−75 °F) continuous, and dimensions were 25 L × 19 W × 0.3 mm (1 × 0.8 × 0.01 inch″). The calculated uncertainty of the thermocouple at level of confidence 95% was ±0.0153 °C.
The test was conducted during the summer conditions, from 9 a.m. to about 3 p.m. The temperatures of the reference panel and the panel with the thermosiphon were measured simultaneously.
Specifications of HPT and WF
Polycrystalline PV panels from BP SOLAR were used, with 350 Wp, and the area was 0.839 m × 0.537 m. The dimensions and material properties of the panel are given in Table 1.
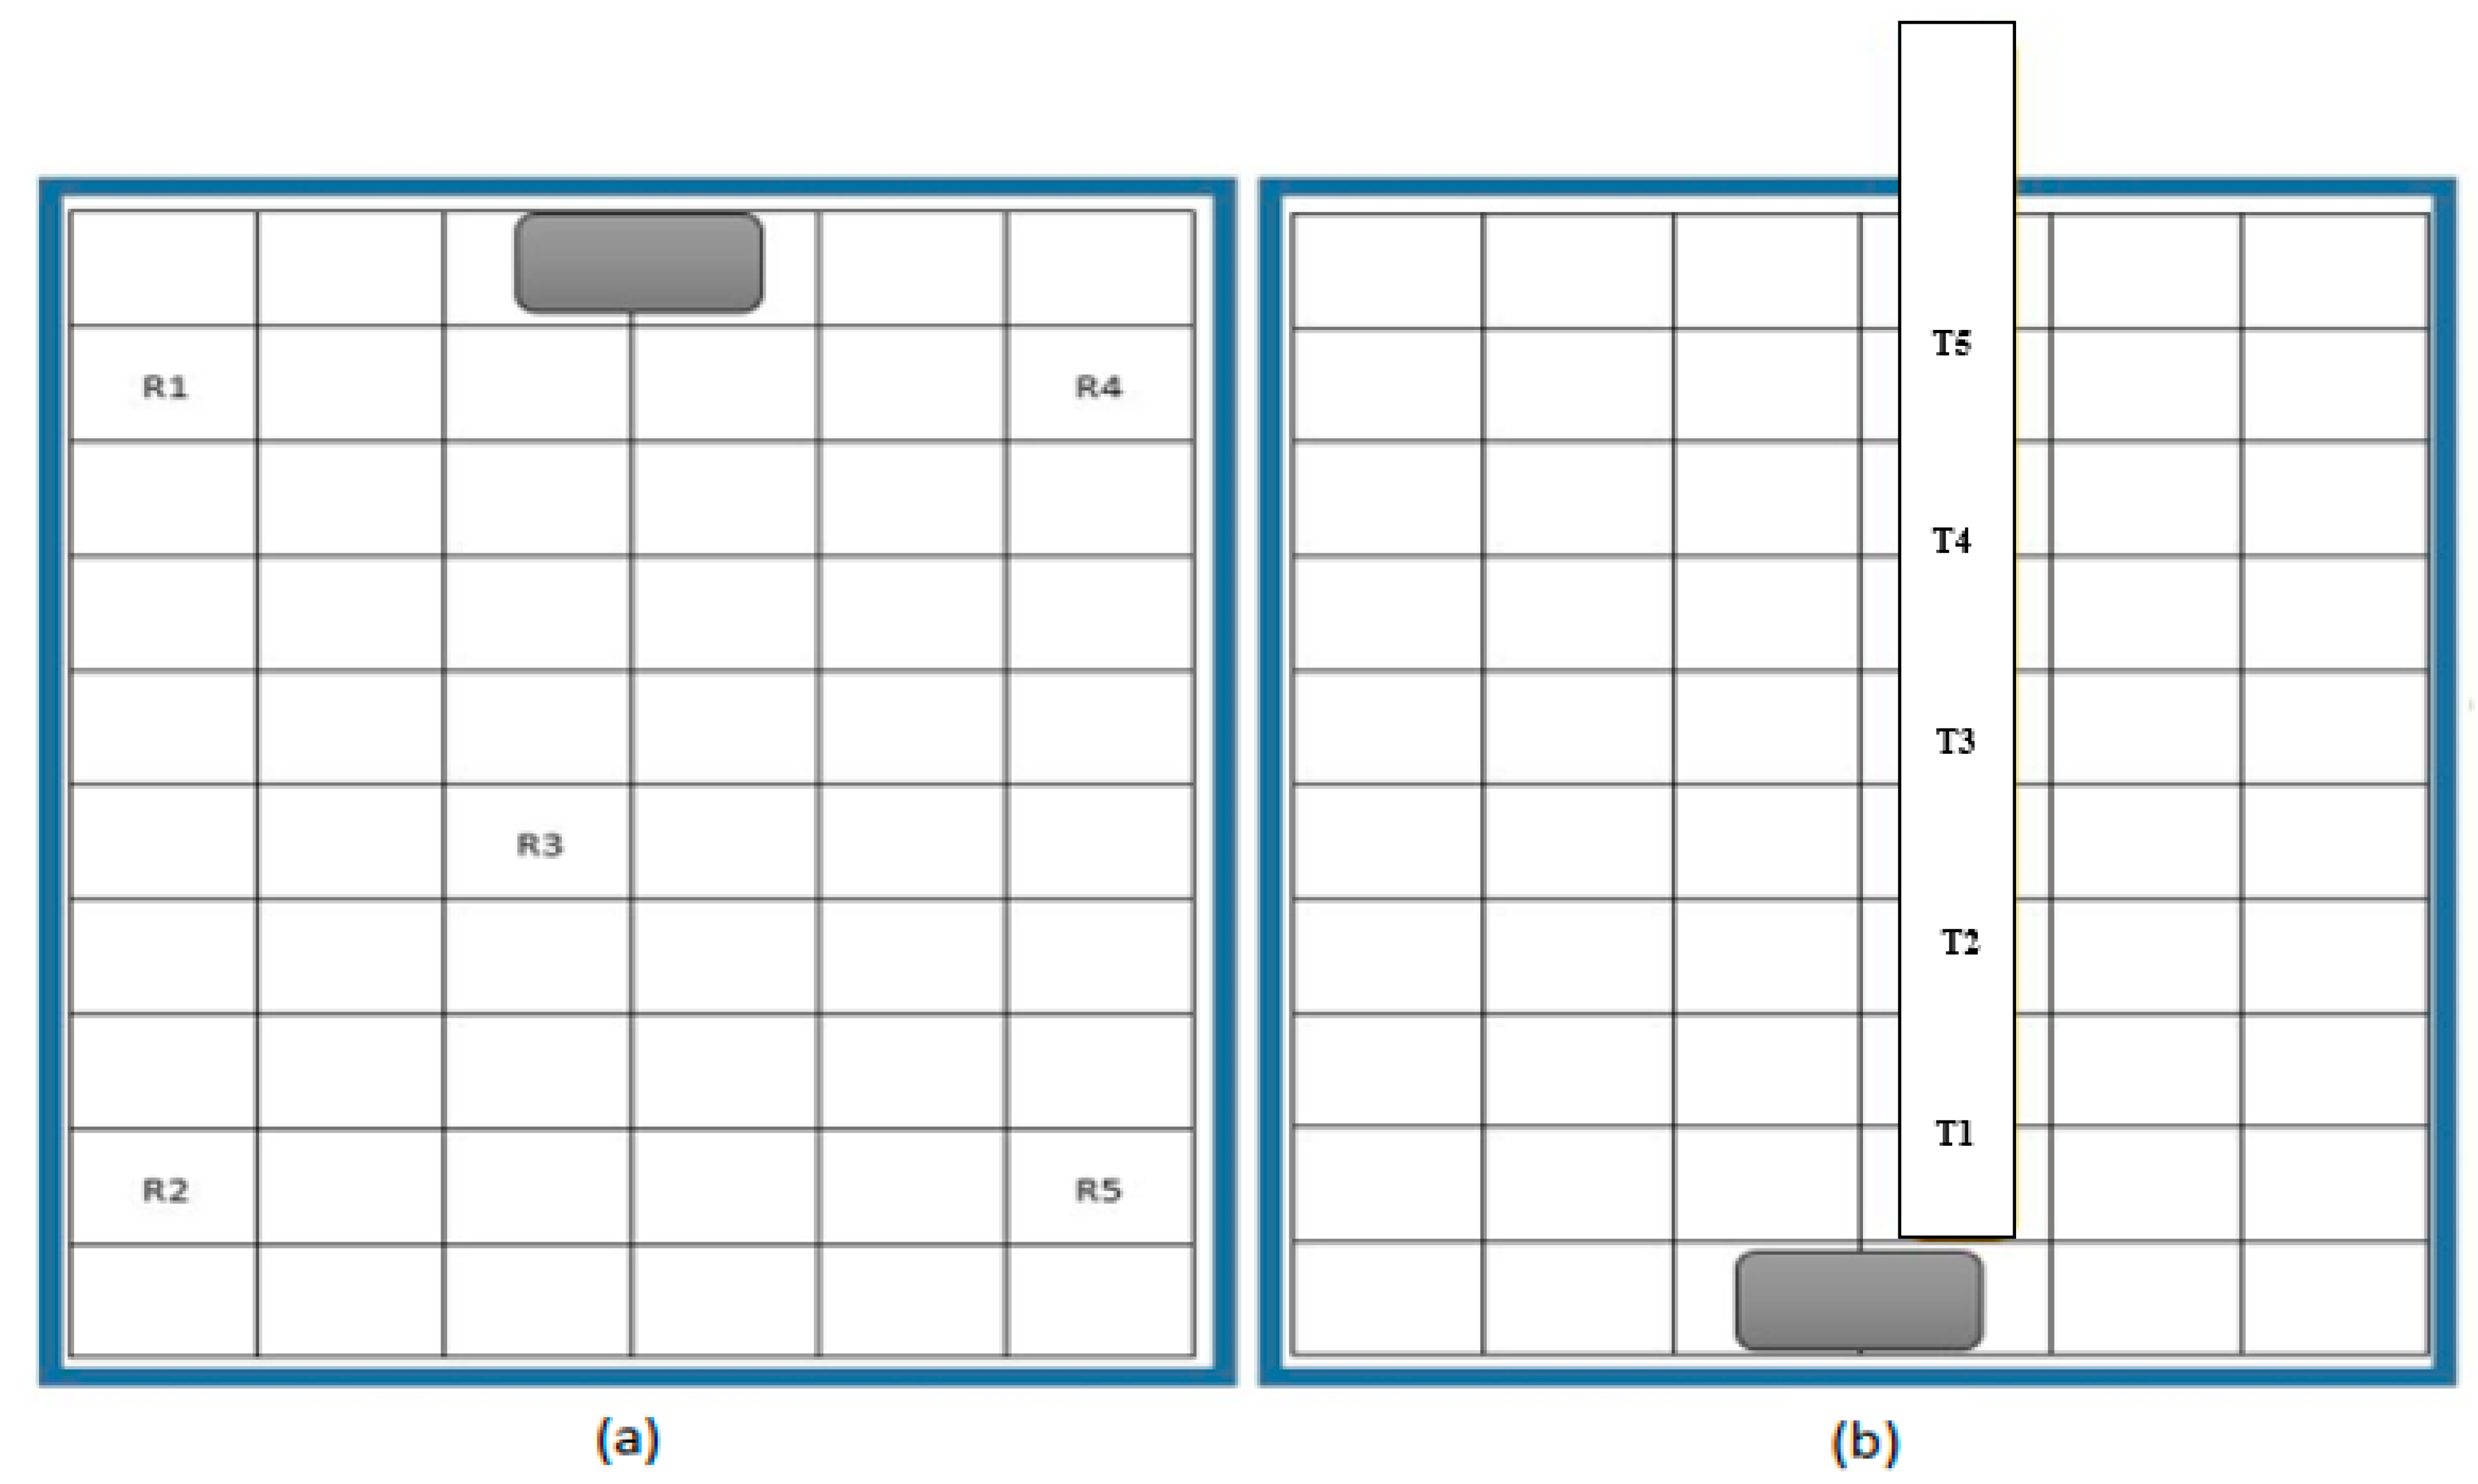
The reference panel temperature was measured using thermocouple R1–R5, and the average value was used. The cooled PV panels was fitted with one HPT’s, which was secured to the panel bottom, along with thermal conducting paste to ensure good heat transfer (Figure 2b). The HPTs were slightly flattened at the area of contact with the PV panel. Seven thermocouples were used (T1–T5) to measure the temperature of the area of the PV panel that was covered by the HPT pipe, as shown in the figure. Table 2 gives the specification of the working fluid (WF).

3. Theoretical Study

The panel was considered a lumped system composed of materials with different physical properties. The panel temperature is a function of the intensity of solar irradiation, tilt angle of the panel to the ground, ambient temperature, wind temperature, and properties of the atmosphere and the nature of the ground. The objective of this analysis is to find the temperature of the panels analytically and compare it to the experimental results under similar input conditions.
The solar energy is the input energy that is absorbed by the PV panel. Heat is lost to the environment from the front side and back side of the panel by convection and radiation. The HPT helps in heat loss by three mechanisms: latent heat when the acetone phase changes from liquid to vapor, sensible heat convection, and finally, heat radiation when there is no phase change.
The following assumptions were assumed during the analysis of the PV panel:
  • The temperature distribution is uniform all over the panel.
  • The average panel temperature is a linear average of the temperatures at different panel layers and at different points on the surface.
  • Heat loss through the supporting structure is negligible.
  • The heat pipe has no loses and all the heat received from the panel is used to evaporate the phase change fluid used inside the heat pipe.
  • No dry out of the evaporator region occurs.
The overall rate of energy transfer for PV module without HPT is given by the energy balance of all the incoming and outgoing energy over the panel. Using this energy balance, the change in panel temperature with time is given by Equation (1):
C t × dT module dt = q sw q lw q c P o
where qsw is the solar radiations received from the sun, qlw is the heat dissipated as the longwave radiation from the top of the panel to the sky and from the bottom of the panel to the ground, Po represents the electrical power output, qc represents the convection losses from both sides due to wind, and Ct is the total specific heat capacity of the panel, which is the sum of the specific heat capacity of each layer of the panel, and it is given by Equation (2):
C t = m A m   t m C m ρ m
where A m , t m , C m , ρ m are the area, thickness, specific heat capacity, and density of each layer m. Using the values in Table 1, Ct = 2717.69 J/kg·K.
The longwave radiation loss is shown in Equation (3) and comprises three parts, namely the radiation exchange to the sky, to the ground, and from the panel.
q lw = A × σ × [ ( 1 + cos β ) 2 × ε s × T s 4 + ( 1 cos β ) 2 × ε g × T g 4 ( ε p × T p 4 ) ]
where σ is the Boltzmann’s constant (5.669 × 10⁻⁸ (W/m2 K4)), εg is the emissivity of the ground (0.95), and εp is emissivity of the panel (0.9). The two factors, (1 − cos β)/2 and (1 + cos β)/2, represent the shape factors for radiation loss to the top and bottom of the panel. The sky temperature Ts is given by Equations (4) and (4b) for clear and overcast sky conditions, respectively. The sky temperature Ta is equal to ambient temperature Ta.
Tsky = Ta − Δt
where Δt = 20 and Ta is the ambient temperature [28].
The shortwave radiation received by the panels is given in Equation (5), as follows:
  q sw = α ×   I t × A
where I t   is the incident solar radiation, and α is the absorptivity of the panel, taken as 0.7, after considering a glass reflectivity of 10% [29].
The convection heat loss   q c is given in Equation (6), which consists of two terms: forced convection h c ,   forced due to wind blowing and natural convection h c ,   free .
q c = ( h c ,   free + h c ,   forced ) × A × ( T p T a )
where h c ,   free and h c ,   forced   are given in Equation (7) [29] and Equation (8) [30], respectively:
h c ,   free = 1.31 ( T P T a ) 1 / 3
h c ,   forced   = 3.0 w + 2.8
where w is the wind speed. The power output of the PV panel P o is determined based on the electrical efficiency of the panel, as shown in Equation (9)
P o = η el × I t × A
The electrical efficiency η el is, again, a function of the cell temperature [31].
η el = η ref × [ 1 β c × ( T c T ref ) ]
where η ref is the nominal efficiency of the panel at a reference temperature T ref of 298 K, T c   is the cell temperature (K), and β c is the cells temperature coefficient, which indicates the drop of efficiency with temperature. The temperature coefficient used in this panel is −0.4%/°C (as per the manufacturer’s specifications).
When the HPT is attached to the PV panel, the overall rate of temperature change with time for the PV module will be the same as Equation (1), with an additional term that includes the impact of HP. Hence, Equation (1) will be modified as follows:
C t × dT cell dt = q sw q lw q lwp q c q hp Po
The longwave radiation q lw includes the heat loss from the top of the panel and the bottom of the panel, excluding the area occupied by the heat pipe.
q lw = σ × [ A × ( 1 + cos β ) 2 × ε s × T s 4 + ( A A p ) × ( 1 cos β ) 2 × ε g × T g 4 ( A × ε p × T p 4 ) ]
The longwave heat q lwp is transferred from the HP to the ground. Initially, when the panel is at temperature below the phase change temperature, Equation (13) is used for calculating q lwp , and when the panel temperature reaches phase change temperature, Equation (14) is used.
q lwp = ( π D p L p L × Wp ) [ ( 1 cos β ) 2 × ε g × T g 4 ( ε p × T p 4 ) ] When   T p <   T pc
q lwp = ( π D p L p L × Wp ) [ ( 1 cos β ) 2 × ε g × T g 4 ( ε p × T pc 4 ) ] When   T p     T pc
where Tp is panel temperature and Tpc is the phase change temperature of WF. The term q hp represents the amount of latent heat absorbed by the HPT during the phase change process of the acetone inside the HP. It is calculated using Equations (15) and (16):
q hp = 0   when   T p T pc
q hp = Δ T Δ x t k t . A + Δ x hp   k hp . A   when   T p > T pc
where Δ x t   is   the   thickness   of   Tedlar ,   k t   is the thermal conductivity of the Tedlar, Δ x hp   is the thickness of the HPT material, k hp is the thermal conductivity of the HPT material, and Δ T is the difference between the temperature of the panel and the temperature of the phase change material.
Euler’s method was used to find the temperature of the temperature of the PV panels numerically. At any time, the temperature of the PV panel can be computed numerically, as follows:
T module ( n   + 1 ) = T module ( n ) + h   *   dT cell dt
where Tmodule(n) is the temperature of the PV module at time n, Tmodule(n + 1) is the temperature of the module at time n + 1, h is the time interval constant (60 s), and dT cell = is the change in temperature of a module with change of time dt. Since Euler’s method is an initial value problem, the initial value of this is taken as equal to Ta in the first step, with Tmodule(n) = Tmodule(n), the experimental value.

4. Results and Discussion

4.1. Comparison of Experimental and Theoretical Results

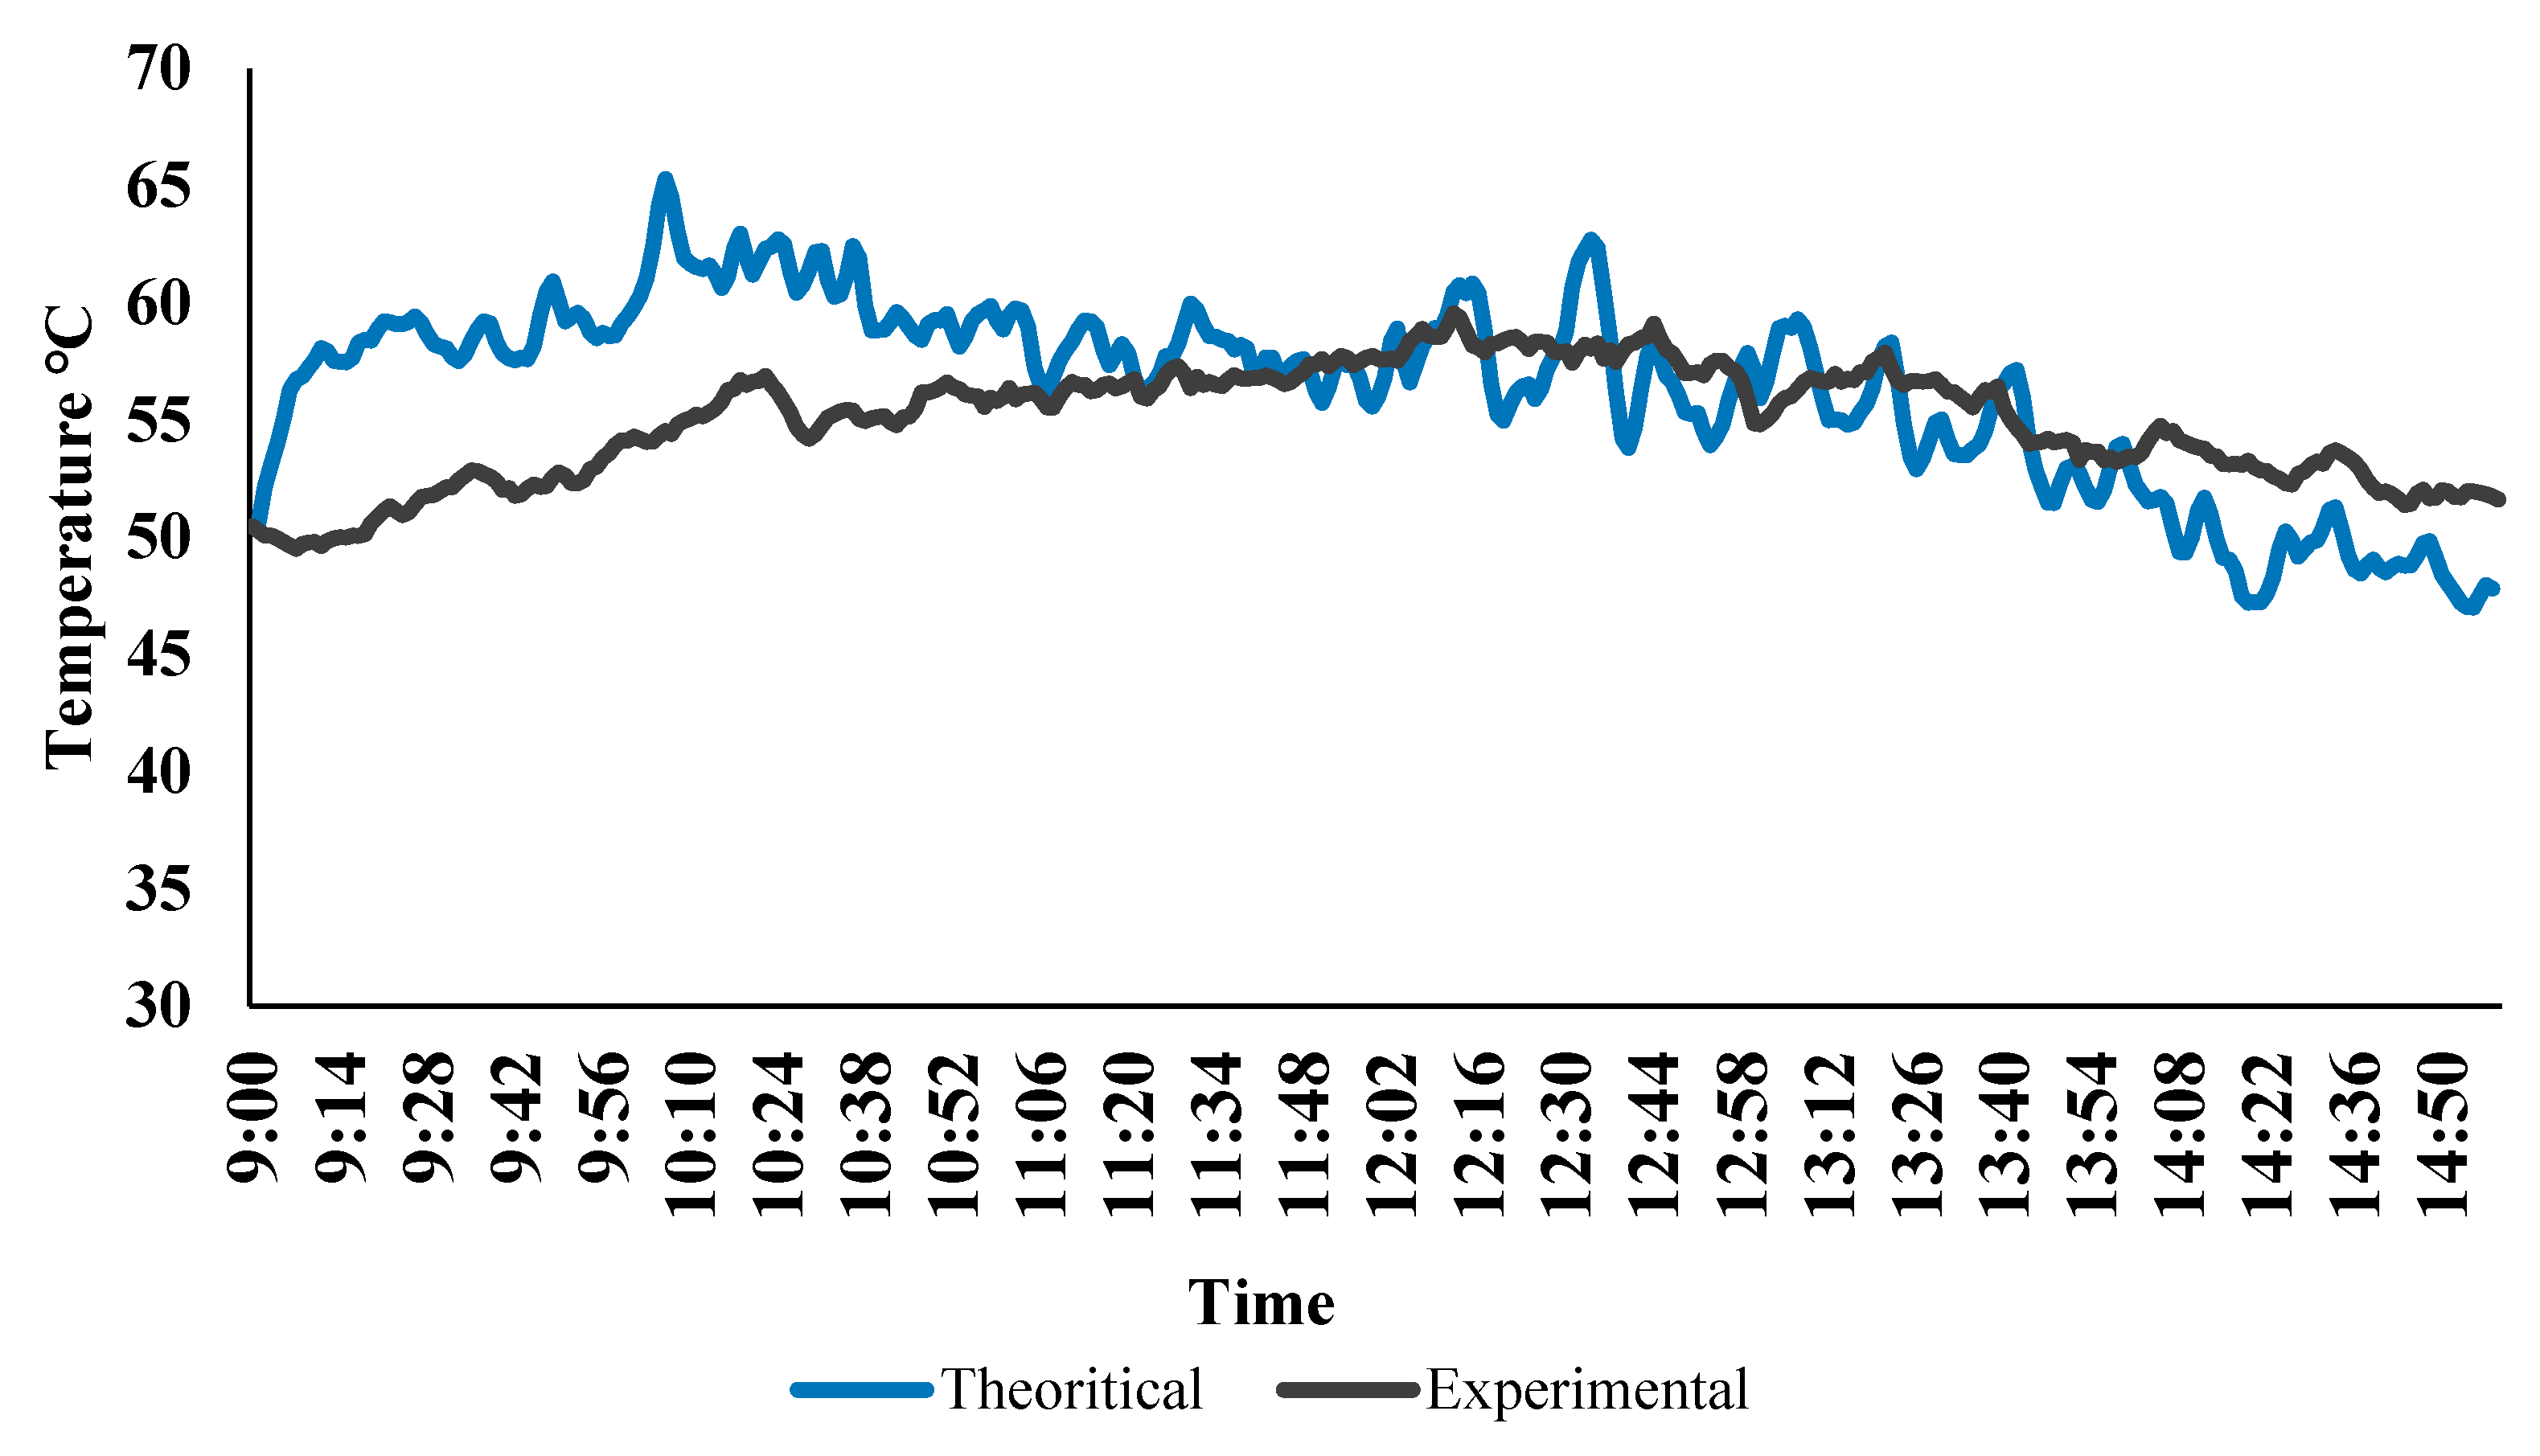
Figure 3 presents a comparison between the experimental results and the theoretical modelling of the temperature of the cooled PV panel with 100 mL acetone. It shows the real-time temperature of the PV panel for hot summer conditions over the period from 9 a.m. to 5 p.m. The difference between the experimental and theoretical results was big in the beginning of the experimentation process, and then it became smaller after the midday hours. The initial variation is attributed to high wind speed at the beginning of the data collection. The average error between the two results curves was 2.61%, which indicates a fear agreement between the theoretical and experimental results. Therefore, the modelling can be used for studying the temperature of the PV panels with HPT cooling.

4.2. Optimum Quantity of the WF

The experiments on HPT were conducted using a copper tube with four quantities of acetone: 25, 50, 75, and 100 mL, which is 3.39%, 6.79%, 10.18%, and 13.58% of the filling ratio, respectively. Figure 4 shows the results of the copper HPT filled with 25 mL of acetone between hour 9 and hour 15. The temperature of the PV panels with HPT was higher than that of the reference panel over the whole experimental period. The maximum temperature with a heat pipe was 67 °C and without a heat pipe was 65 °C, which indicates that using 25 mL of acetone is not effective.
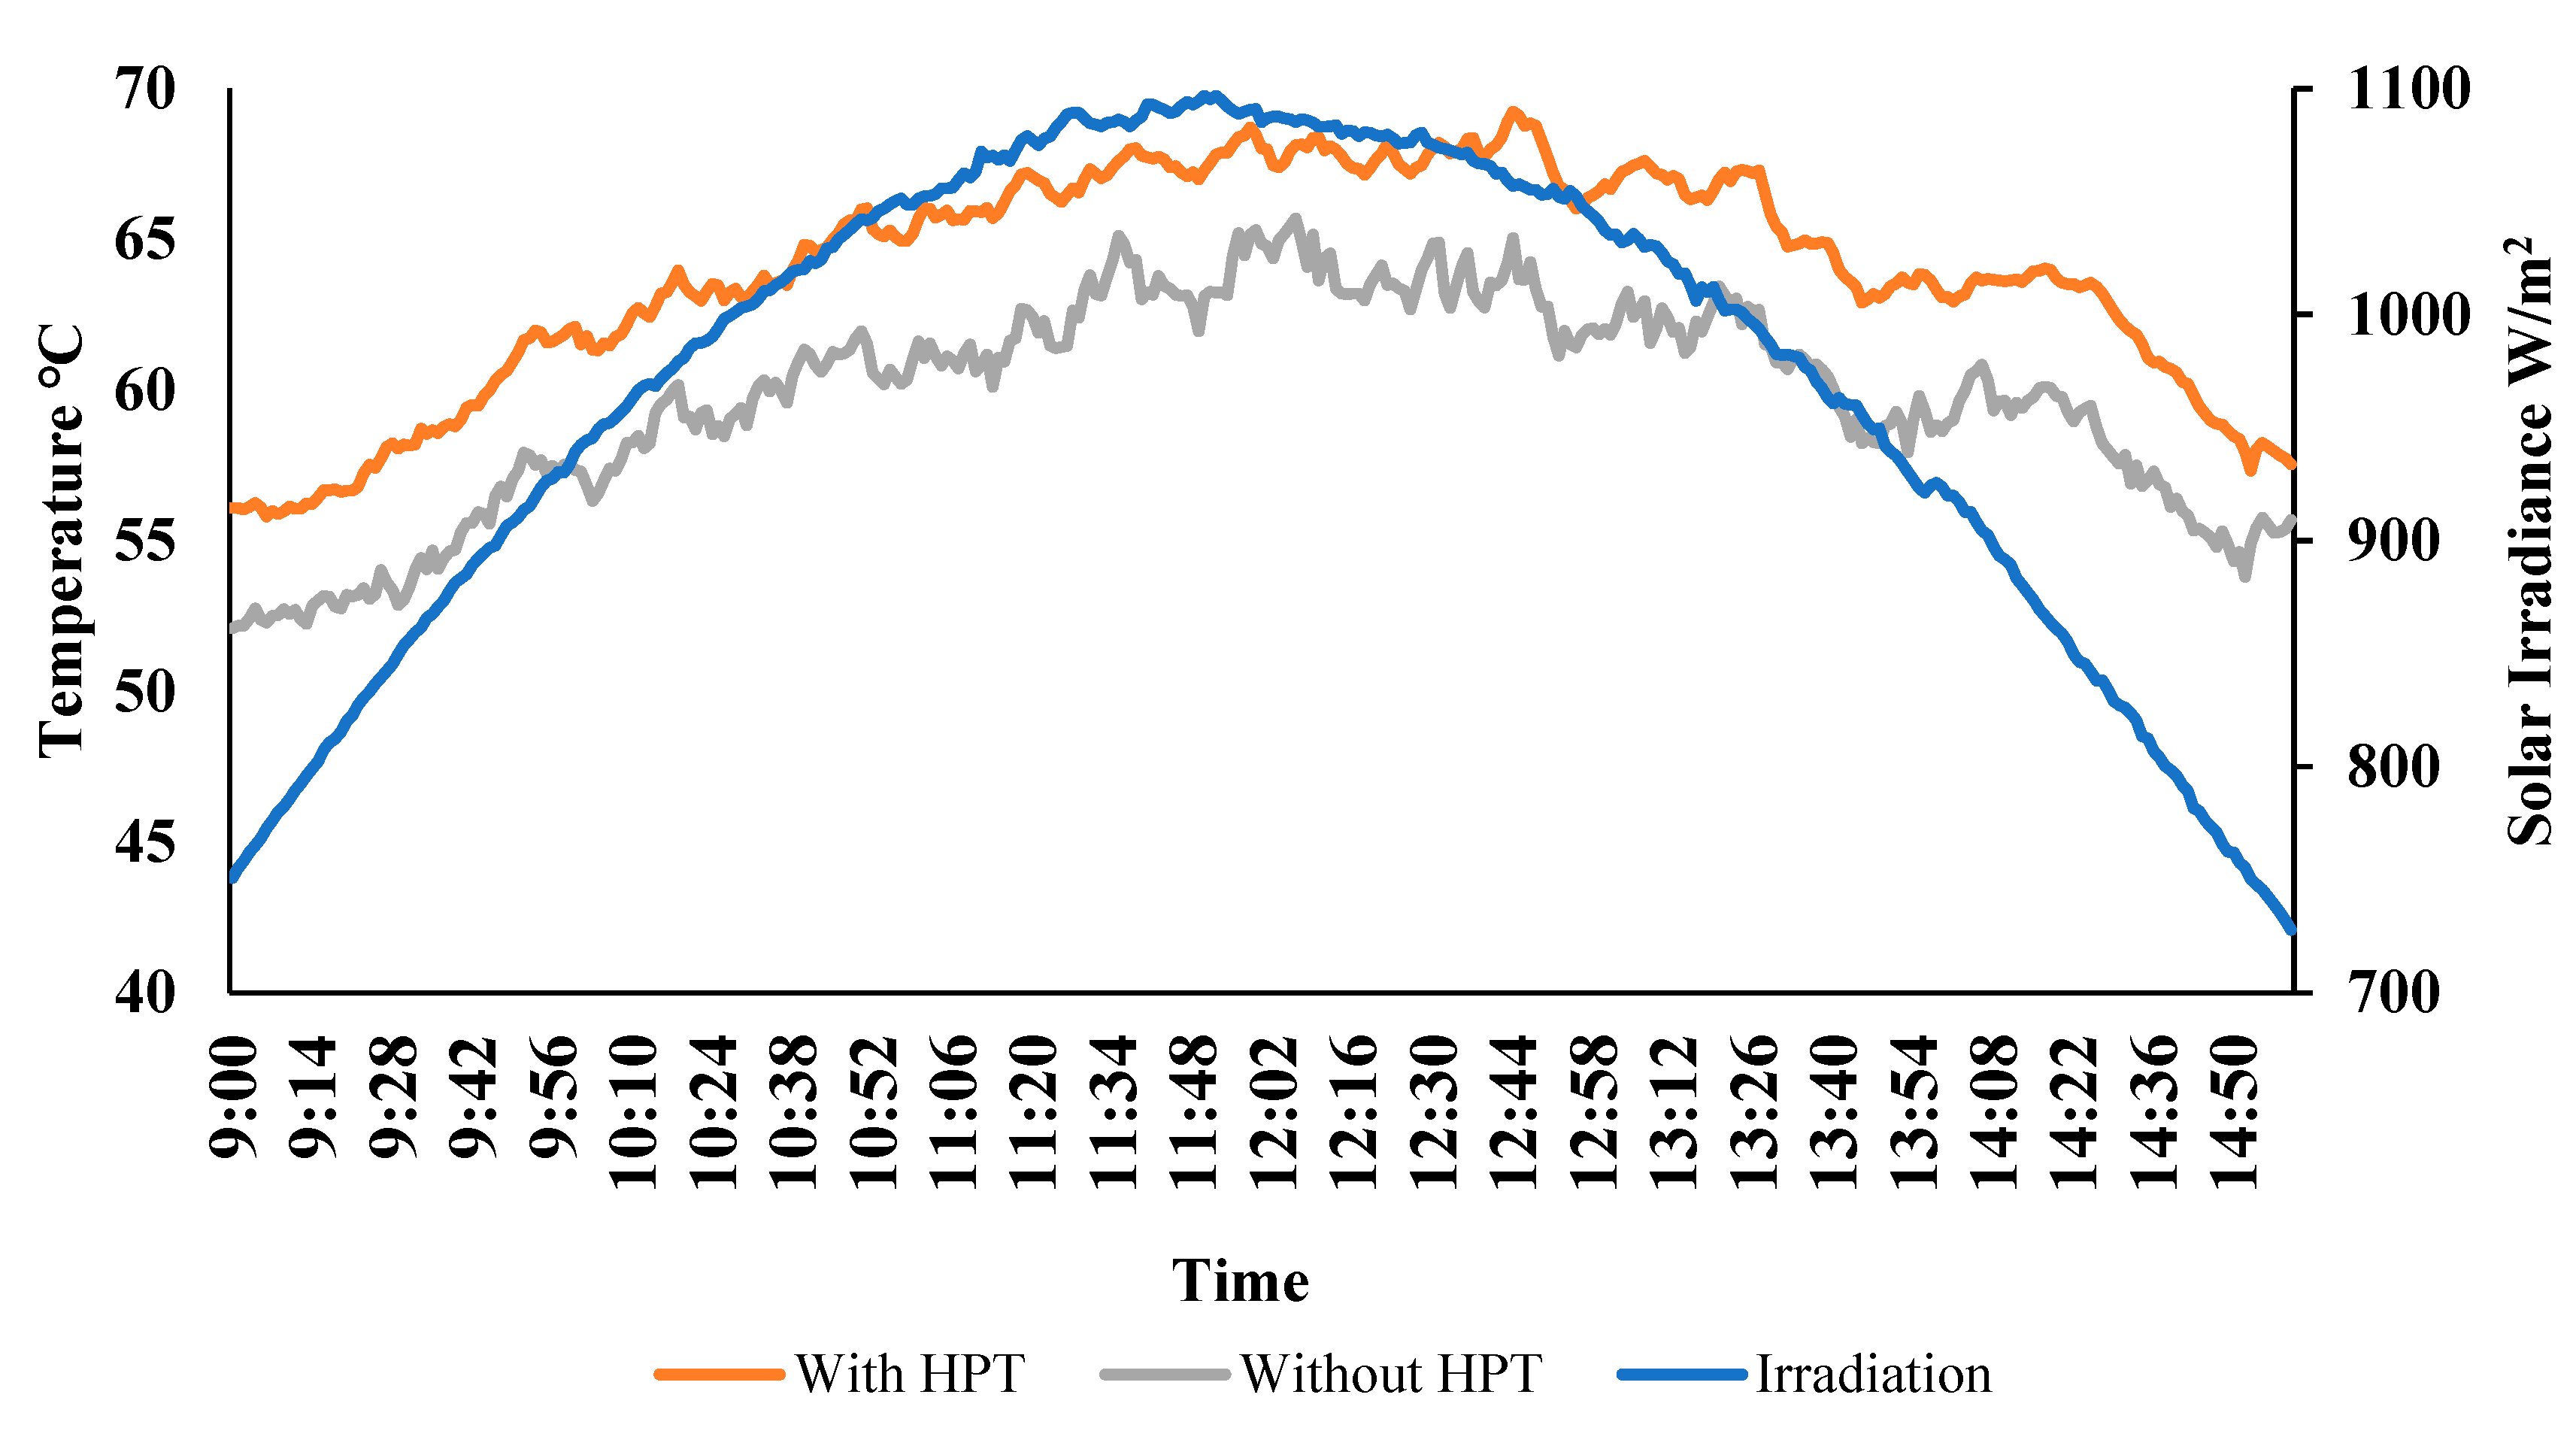
Figure 5 shows the results of the copper HPT filled with 50 mL of acetone between hour 9 and hour 15. The temperature of the PV panels with HPT was successfully kept lower than that of the reference panel over the whole experimental period. The maximum and average differences between the two curves were 7.89 °C and 6.6 °C, respectively. The average temperature of the cooled panel was 55 °C.
Figure 6 shows the results of the copper HPT filled with 75 mL of acetone. The temperature of the cooled PV panel was lower than that of the reference panel throughout the whole time. However, the difference between the two temperatures was smaller than the difference of the case of 50 mL. The maximum and average differences between the two curves were 4.9 °C and 3.26 °C, respectively. The average temperature of the cooled panel was 58.2 °C.
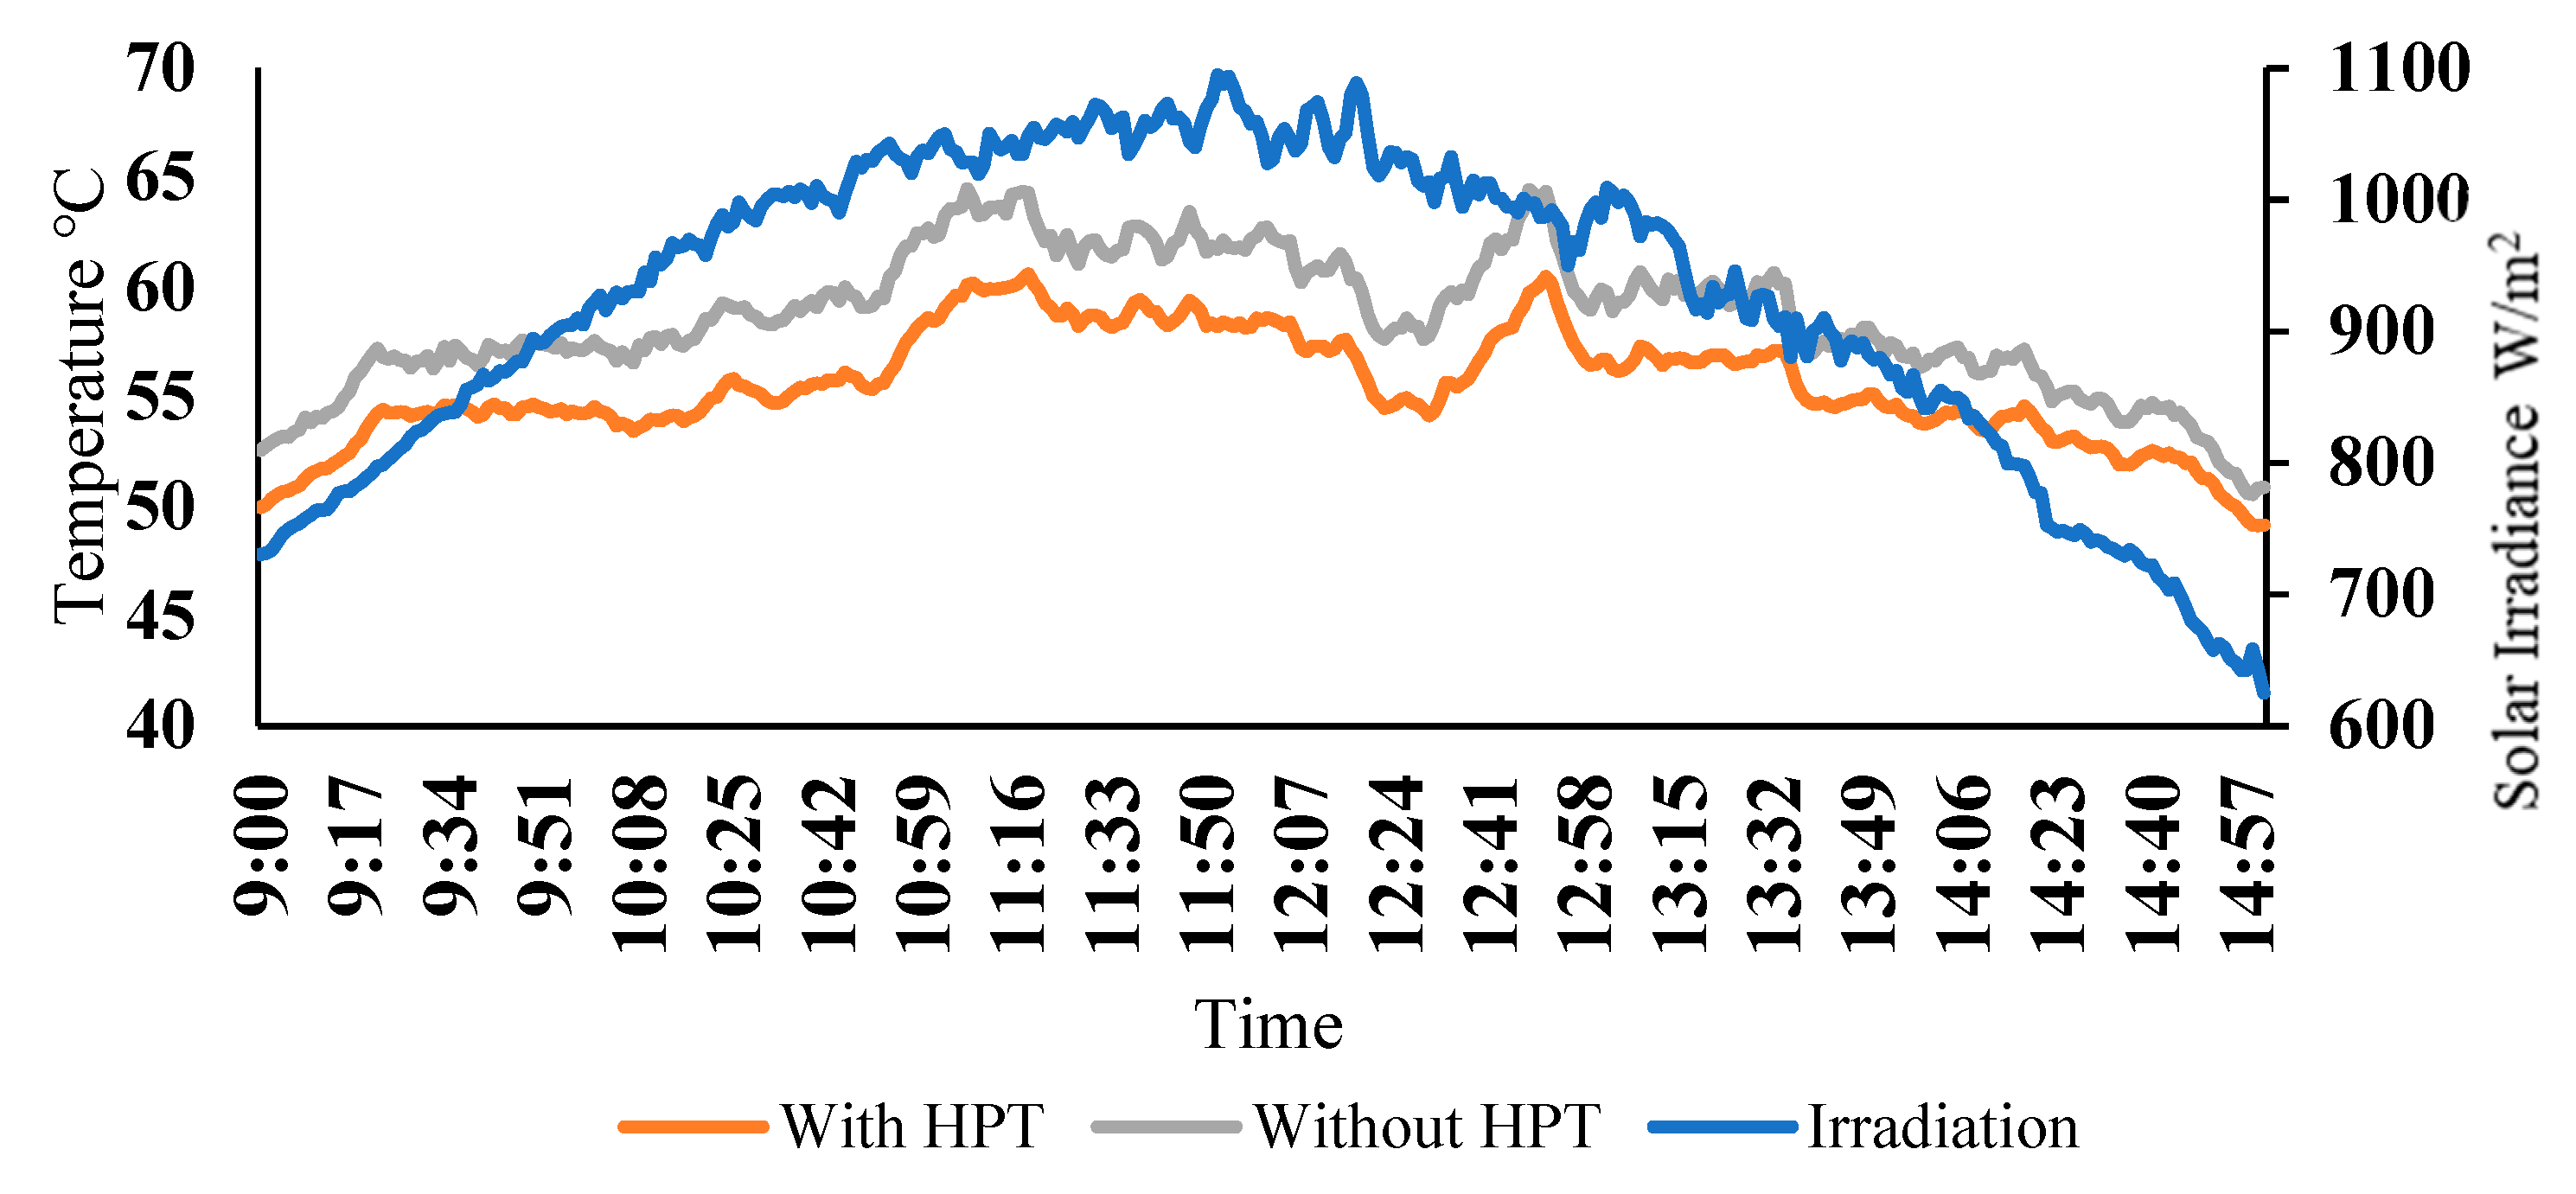
Figure 7 shows the results of the case of HPT filled with 100 mL acetone. Similar to the 75 mL case, the temperature of the cooled PV was lower than that of the reference, but the difference in the two temperatures was not better than the 50 mL case. The maximum and average differences between the two curves were 6.8 °C and 5.4 °C, respectively. The average temperature of the cooled panel was 57.7 °C. Therefore, it can be concluded that the best cooling performance was achieved when the HTP was filled by 50 mL of acetone.

4.3. Effect of Number of HPTs

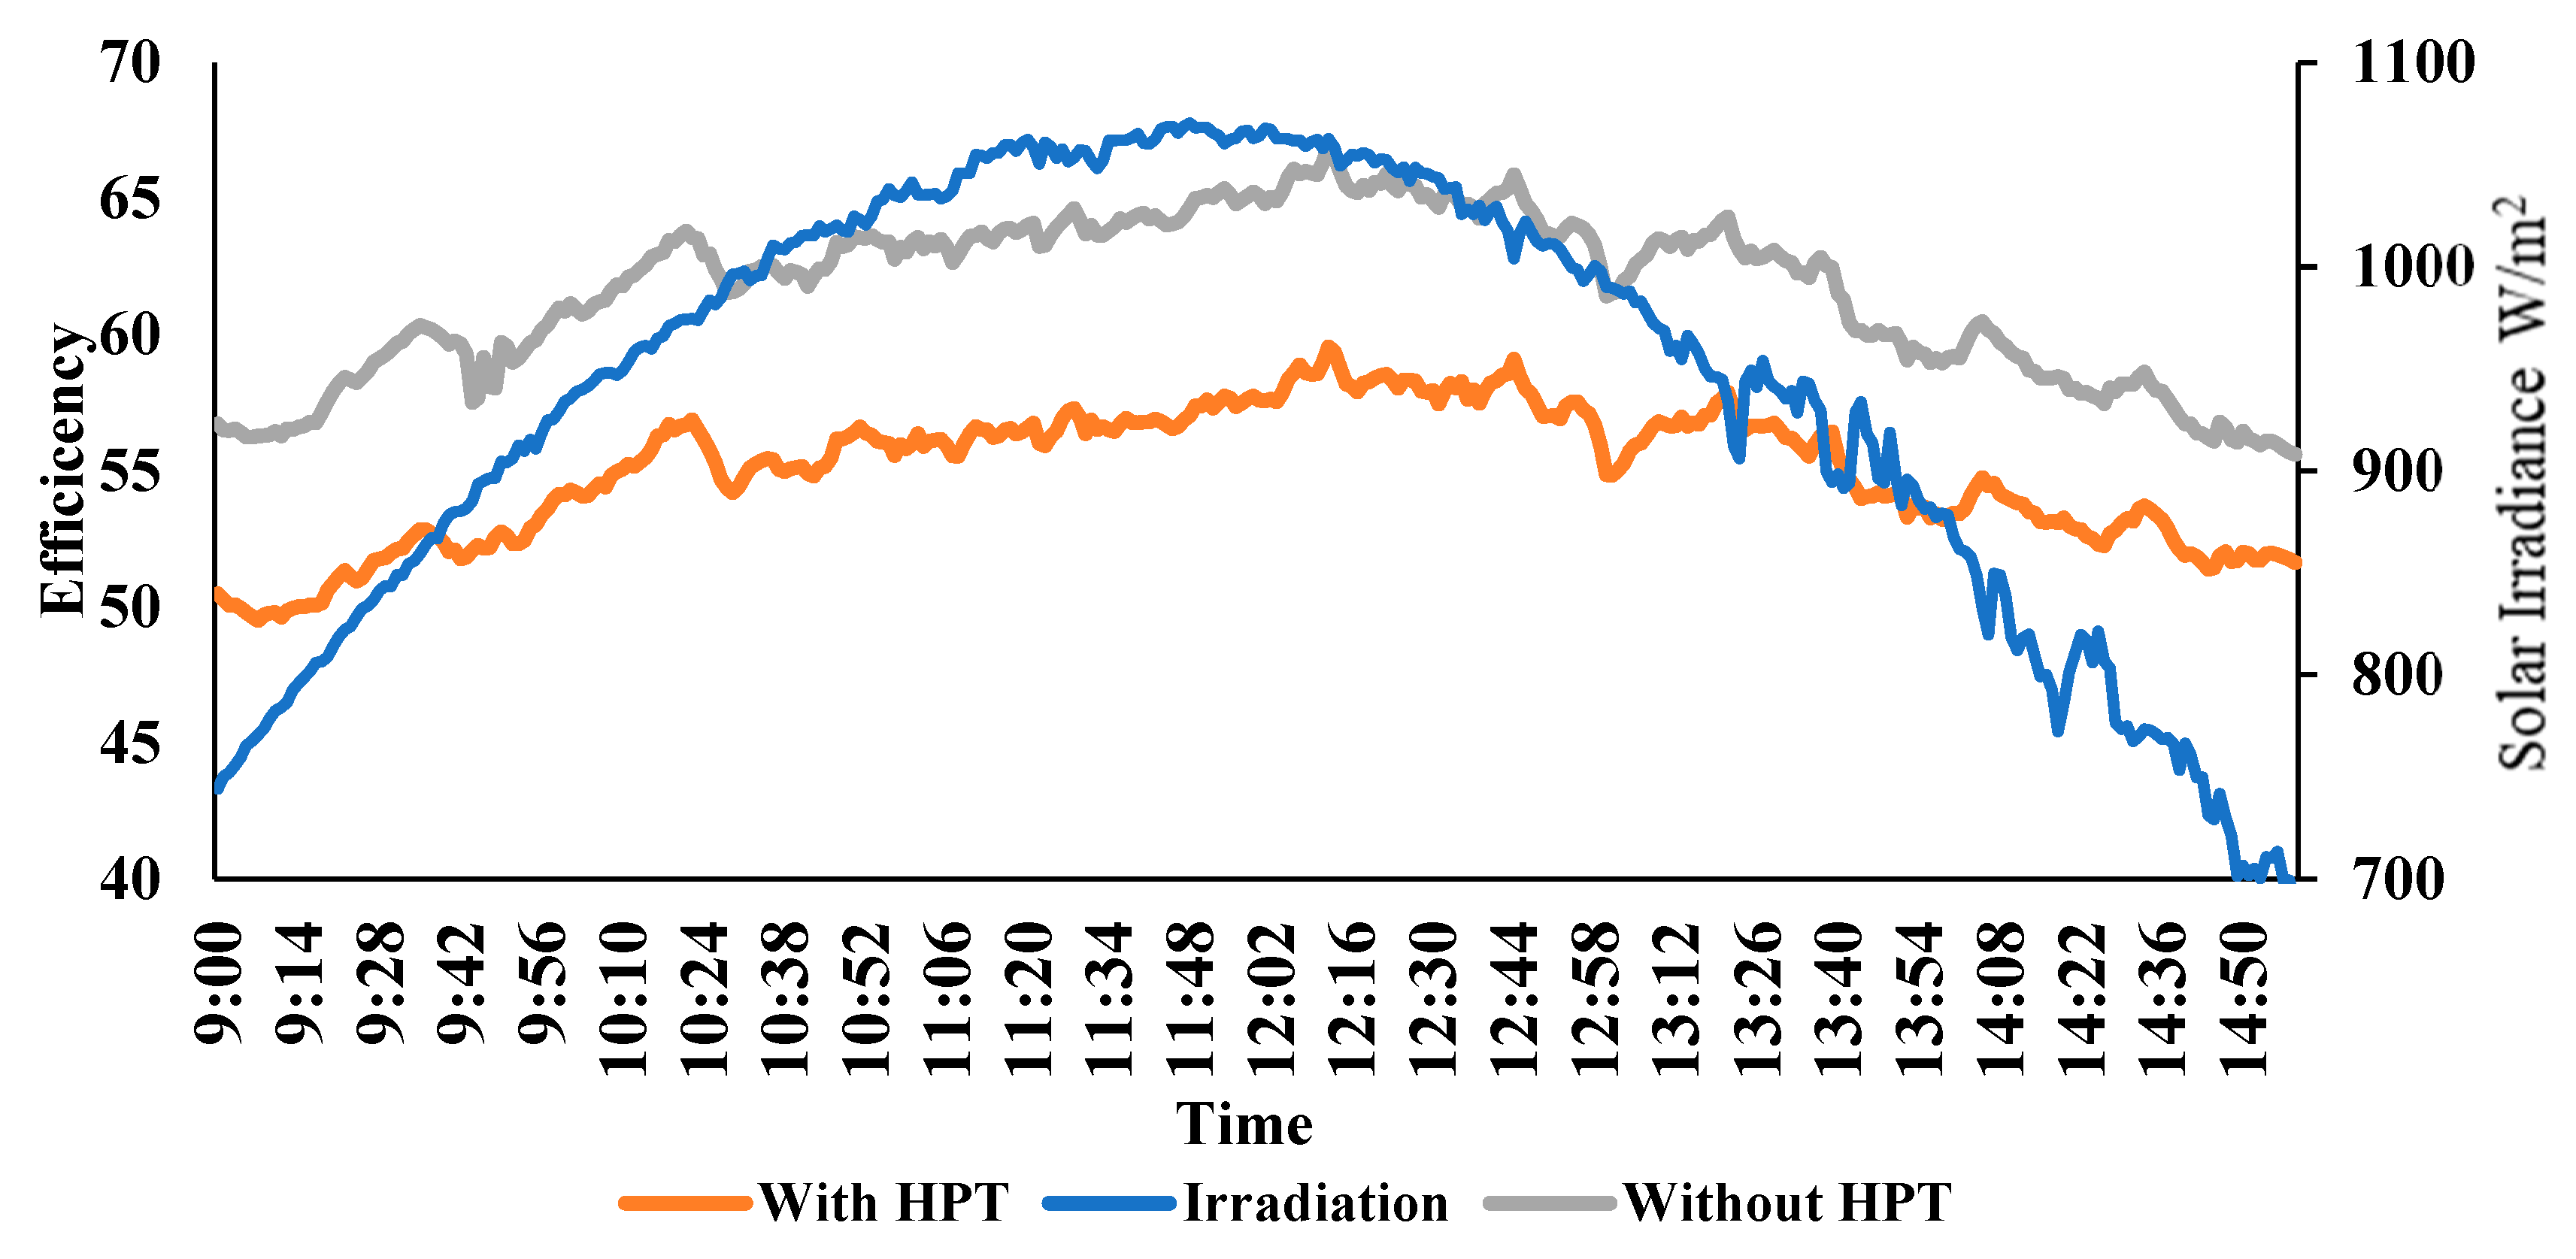
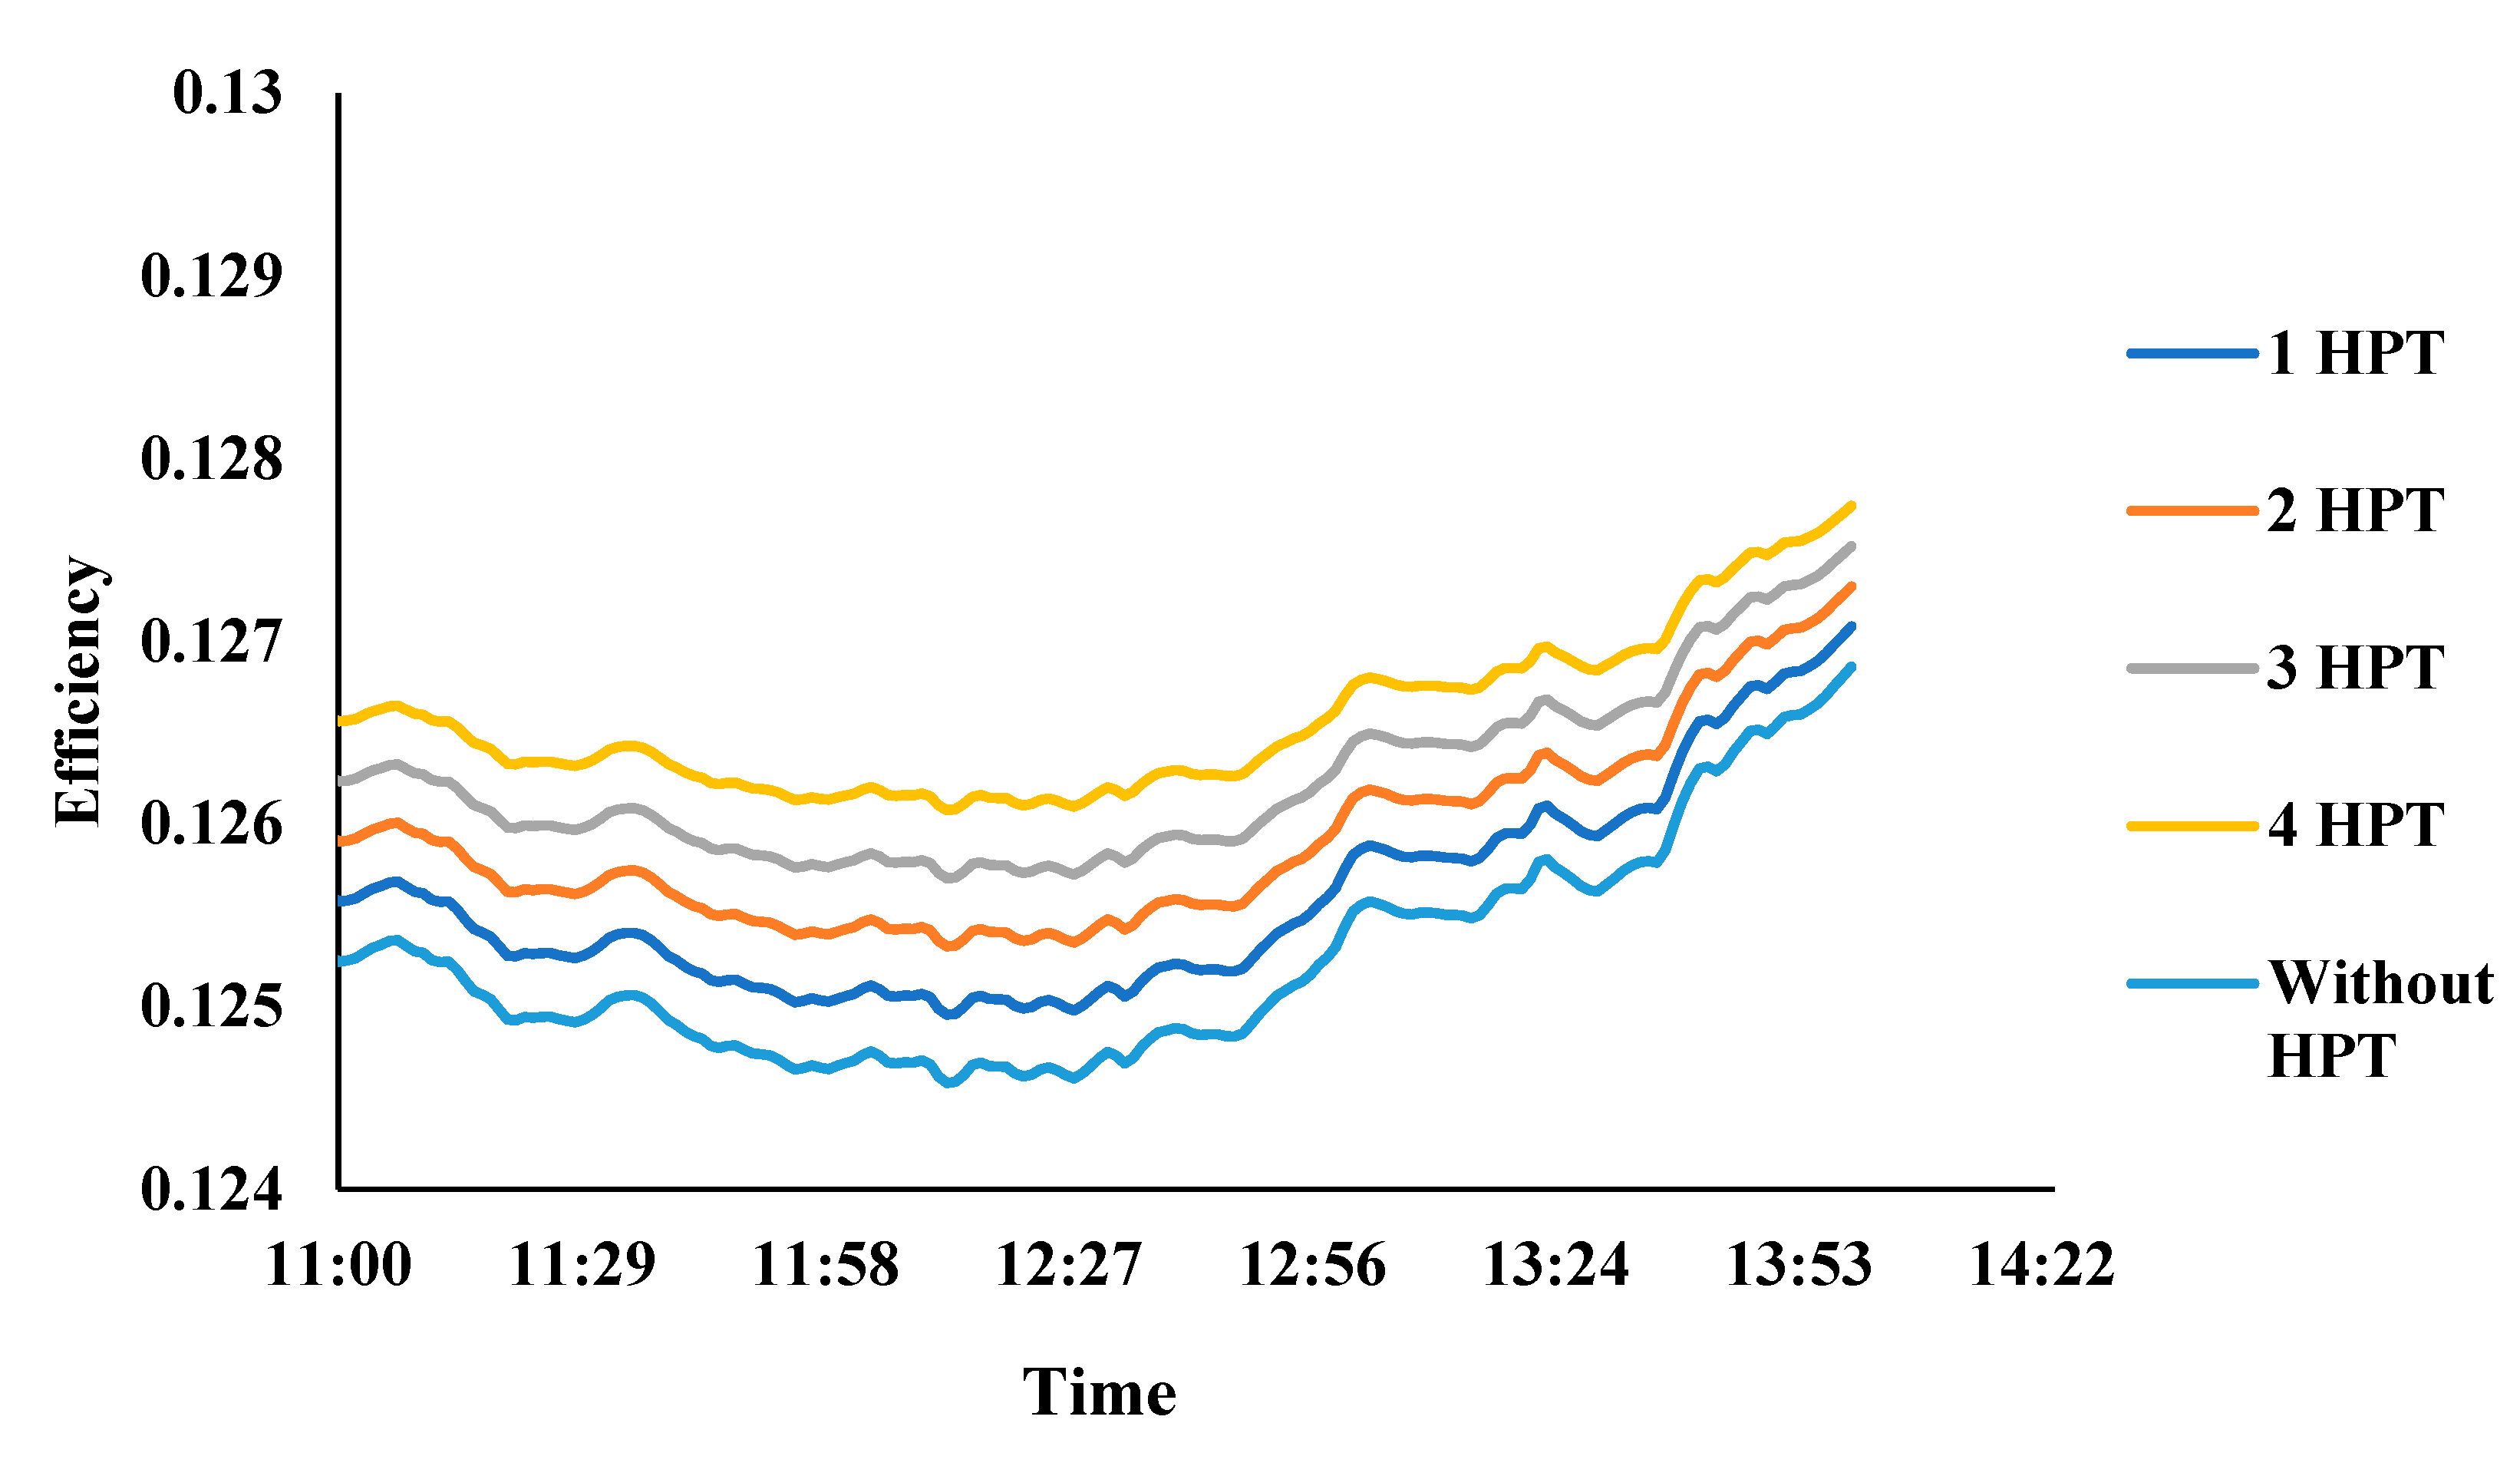
The theoretical and experimental study involves a single heat pipe. When there is more than one heat pipe in the PV panel cooling arrangement, the effect of the heat pipes on the overall panel temperature can be estimated, and the panel efficiency can be determined using Equation (11), above. The measurements of panel temperature in the experimental method were made in the line of contact of the thermosiphon with the panel bottom, and the panel temperatures in the theoretical model were also determined in a single line of the panel. As an approximation, the panel was divided into four regions and it was assumed that the panel temperature in each region was uniform. The average panel temperature was determined by making an average of the four regions. If one of the regions was fitted with heat pipe, then the average panel temperature was decreased. This decrease in the panel temperature continued with every addition of a heat pipe in the successive regions, as shown in Figure 8.

4.4. Effect of HPT Material and PCL Phase Change Temperature

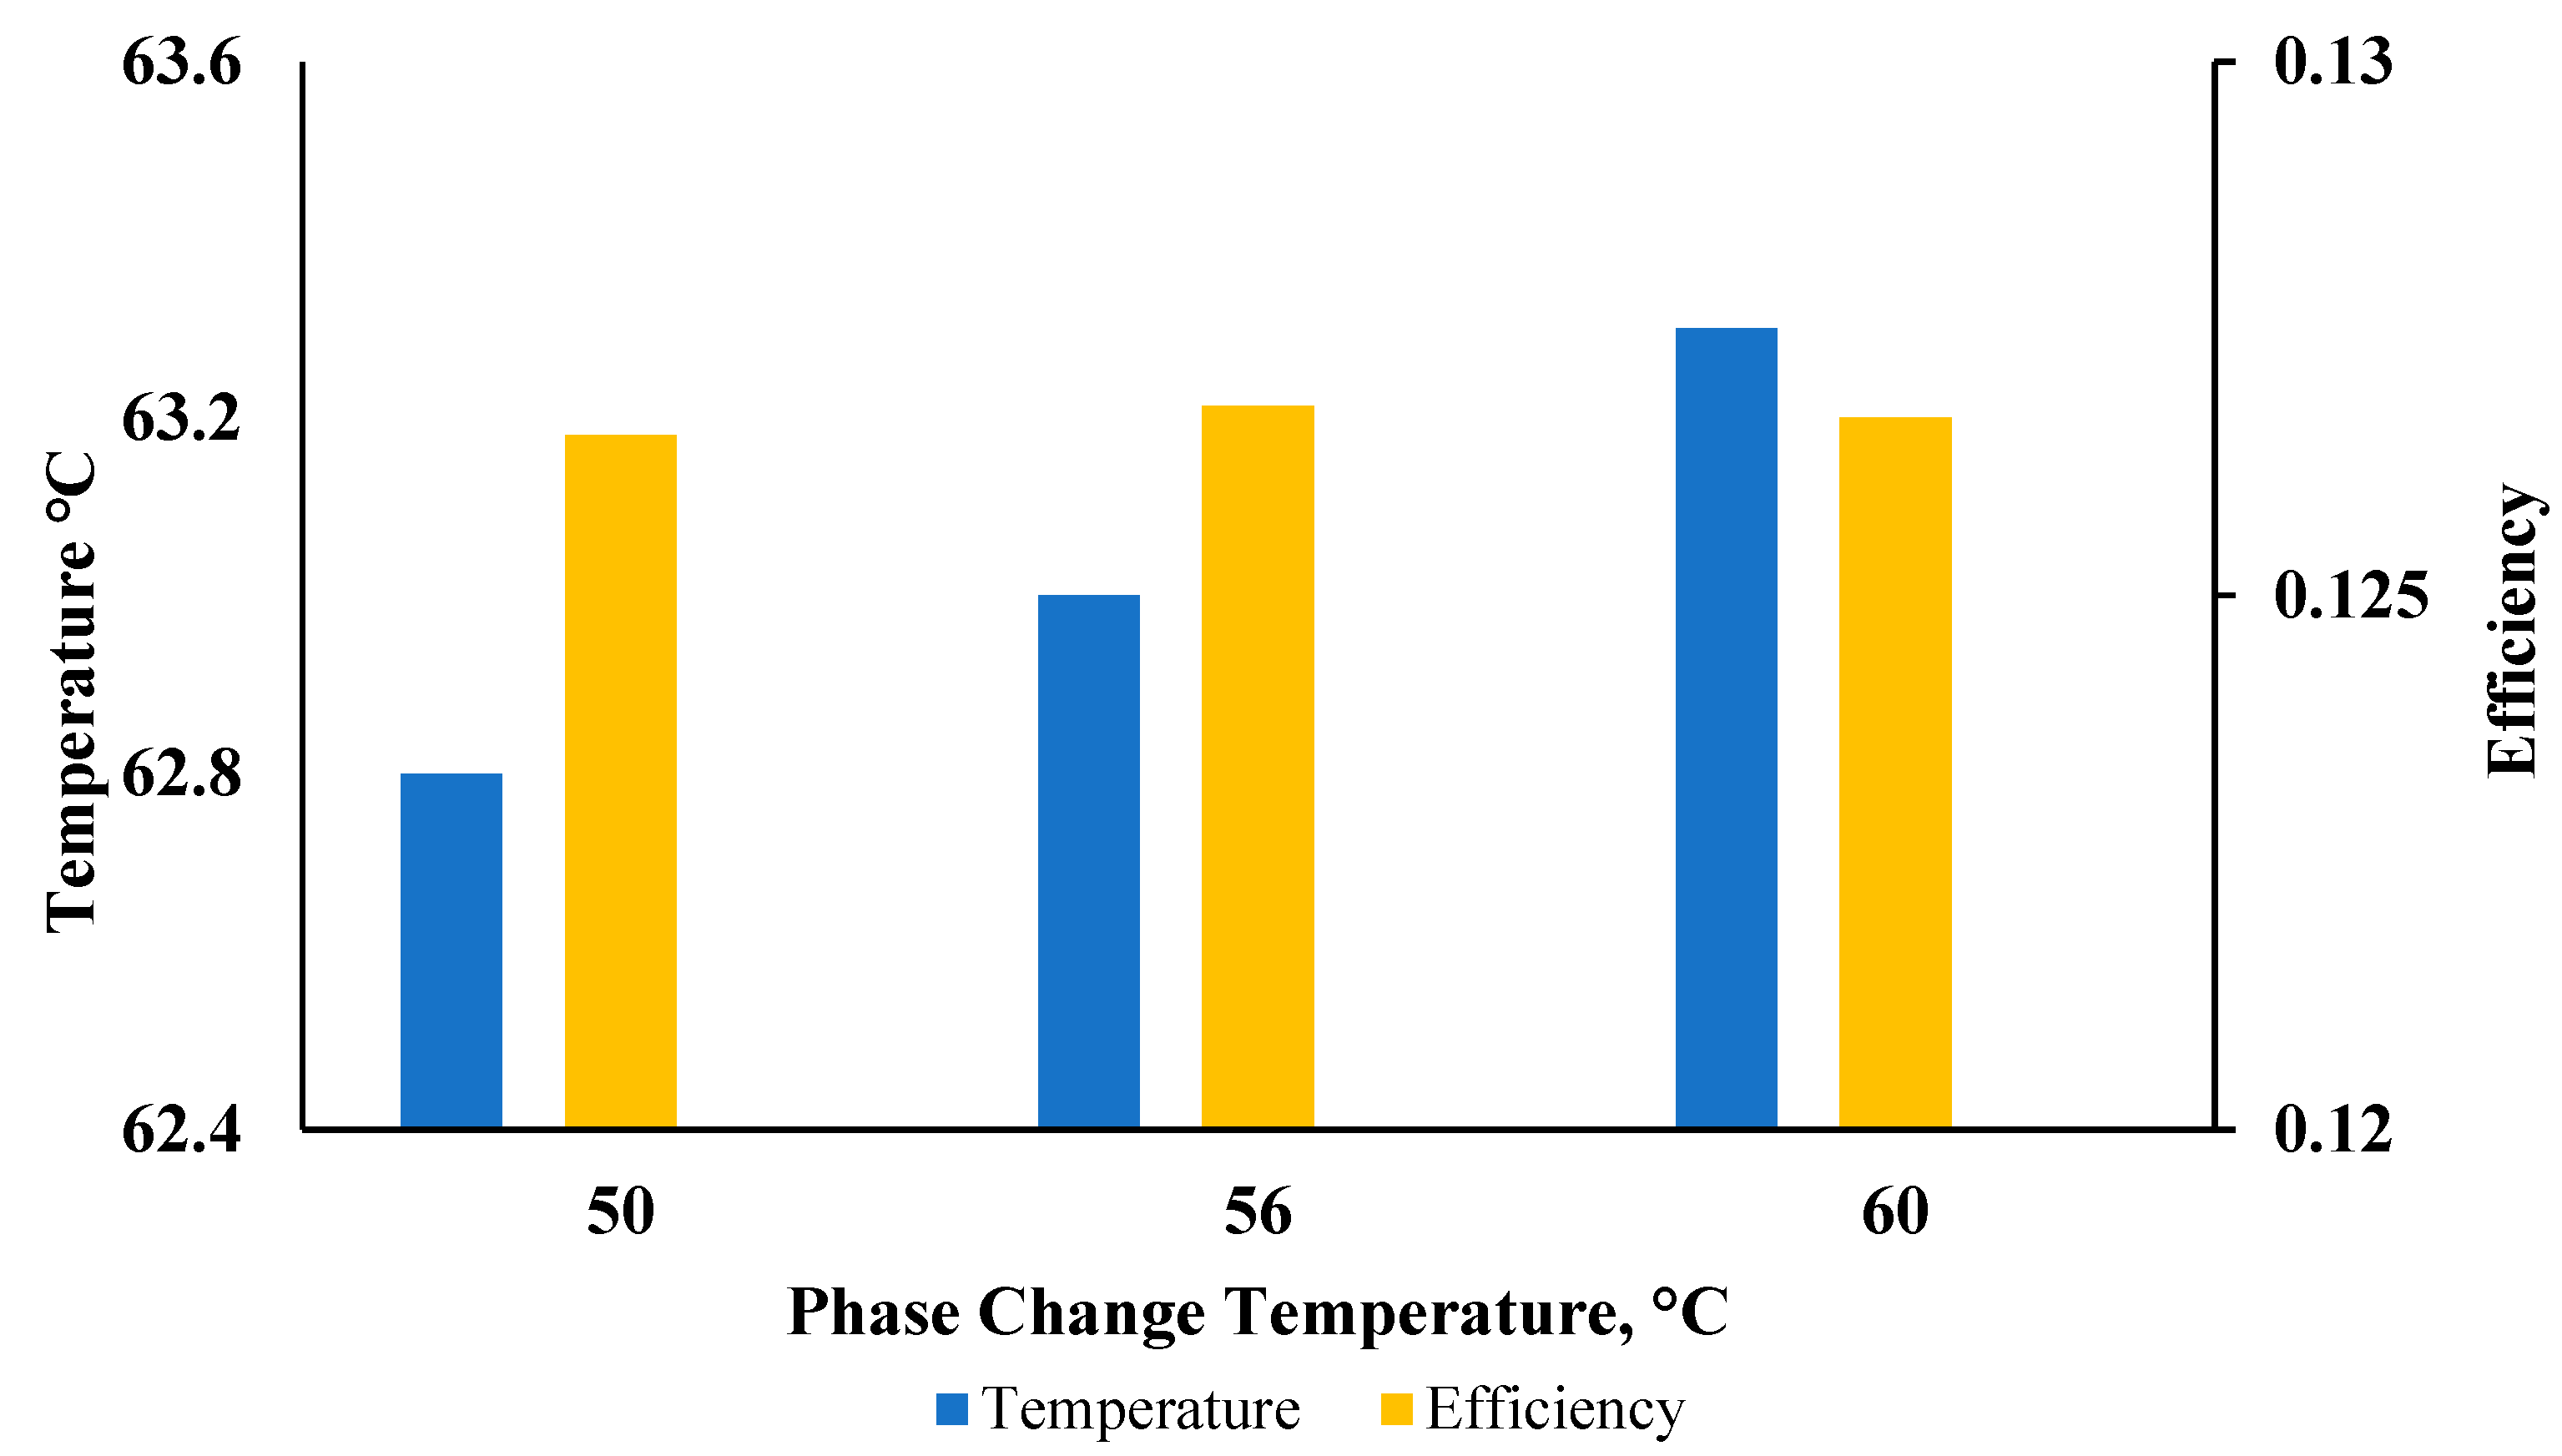
Heat pipes are made using steel, aluminum, or copper. However, the thermal conductivity of the heat pipe material has an effect on the heat conduction into the pipe from the surface of the Tedlar to the phase change liquid in the evaporation region and the phase change liquid to the atmosphere in the condensation region, as evident from Equations (13)–(15). Higher thermal conductivity achieves lower temperature and, hence, enhanced efficiency, as shown in Figure 9. A similar trend is shown when the phase change temperature is increased or decreased, as shown in Figure 10. It is clear from the figures that the thermal conductivity of the heat pipe material and the evaporation temperature of the PCL do not have a significant impact on the panel temperature or the panel efficiency.

5. Conclusions

From the above results and discussion, it is clear that the efficiency of the PV panel decreases with increases in the PV cell temperature beyond the normal operating temperature. The technique employed by using WF with HPTs as the coolant is effective in increasing the efficiency of the panel by maintaining the panel cell temperature in the optimum range. The theoretical analysis made in comparing the experimental results of the PV performance, in consideration of the efficiencies and temperatures, with and without a heat pipe, satisfies each other and, hence, the numerical heat transfer analysis can be considered reasonably accurate in determining the thermal performance of the PV panel. The results obtained by analysis with different WF boiling temperatures and differences material of HPT’s The theoretical model can be extended to verify the actual performance of different combinations of heat pipe material and working fluid.

Author Contributions

Formal analysis, Z.K. and Z.A.H.; methodology, Z.K. and Z.A.H.; experiments and validation, Z.K., M.J.A. and A.S.; writing—original draft, Z.K.; writing—review and editing, Z.A.H. All authors have read and agreed to the published version of the manuscript.

Funding

This research was funded by the Deputyship for Research and Innovation, Ministry of Education, Saudi Arabia, Grant number IFKSURG-2-1569 and the Article Publication Charges was funded by Deputyship for Research and Innovation, Ministry of Education, Saudi Arabia.

Institutional Review Board Statement

Not Applicable.

Informed Consent Statement

Not Applicable.

Data Availability Statement

Data is contained within the article.

Acknowledgments

The authors extend their appreciation to the Deputyship for Research and Innovation, Ministry of Education, Saudi Arabia, for funding this research work, through project no. IFKSURG-2-1569.

Conflicts of Interest

The authors declare no conflict of interest. The funders had no role in the design of the study; in the collection, analyses, or interpretation of data; in the writing of the manuscript; or in the decision to publish the results.

Nomenclature

AArea of the panel (m2)
APTotal area of the heat pipes in contact with the panel (m2)
CmHeat capacity of the module (J/kg K)
DDiameter of the heat pipe thermosiphon (m)
h c Combined free and forced convection heat transfer coefficient (W/m2 K)
ItIncident solar radiation on the panel surface (W/m2)
LTotal length of the HPT In contact with the panel
LPActual total length of the heat pipe (m)
tmThickness of the material (m)
TmoduleModule temperature (K)
TaAmbient temperature (K)
TpTemperature of a module (K)
TpcPhase change temperature of the fluid (K)
T ref Reference temperature (K) At STC (298 K)
TskyEffective sky temperature (K)
WWind speed 5.14 (m/s)
WPWidth of the HPT in contact with panel (m)
αAbsorptivity of the panel
βInclined angle
β c Cell temperature coefficient (0.004)
εGround: emissivity of surface to ground
σStefan Boltzmann (5.669 × 10⁻⁸ (W/m2 K4))
ρmDensity of material (kg/m3)
Δ x t Thickness of Tedlar (m)
Δ x p Thickness of the heat pipe (m)
η ref Nominal efficiency of the panel at the standard temperature of 298 K

References

  1. Fu, R.; Feldman, D.; Margolis, R.; Woodhouse, M.; Ardani, K.U.S. Solar Photovoltaic System Cost Benchmark: Q1. United States. 9 January 2017. Available online: https://www.osti.gov/servlets/purl/1395932 (accessed on 24 June 2022).
  2. Amin, T.E.; Roghayeh, G.; Fatemeh, R.; Fatollah, P. Evaluation of Nanoparticle Shape Effect on a Nanofluid Based Flat-Plate Solar Collector Efficiency. Energy Explor. Exploit. 2015, 33, 659–676. [Google Scholar] [CrossRef] [Green Version]
  3. Tarwidi, D.; Murdiansyah, D.T.; Ginanjar, N. Performance evaluation of various phase change materials for thermal energy storage of a solar cooker via numerical simulation. Int. J. Renew. Energy Dev. 2016, 5, 199–210. [Google Scholar] [CrossRef] [Green Version]
  4. Dellosa, J.T. Potential Effect and Analysis of High Residential Solar Photovoltaic (PV) Systems Penetration to an Electric Distribution Utility (DU). Int. J. Renew. Energy Dev. 2016, 5, 179–185. [Google Scholar] [CrossRef] [Green Version]
  5. Naseri, A.; Bidi, M.; Ahmadi, M.H. Thermodynamic and exergy analysis of a hydrogen and permeate water production process by a solar-driven transcritical CO2 power cycle with liquefied natural gas heat sink. Renew. Energy 2017, 113, 1215–1228. [Google Scholar] [CrossRef]
  6. Skoplaki, E.; Palyvos, J.A. Operating temperature of photovoltaic modules: A survey of pertinent correlations. Renew. Energy 2009, 34, 23–29. [Google Scholar] [CrossRef]
  7. Nazari, M.A.; Aslani, A.; Ghasempour, R. Analysis of Solar Farm Site Selection Based on TOPSIS Approach. Int. J. Soc. Ecol. Sustain. Dev. 2018, 9, 12–25. [Google Scholar] [CrossRef]
  8. Chaniotakis, E. Modelling and Analysis of Water Cooled Photovoltaics; University of Strathclyde: Glasgow, UK, 2001. [Google Scholar]
  9. Tonui, J.K.; Tripanagnostopoulos, Y. Improved PV/T solar collectors with heat extraction by forced or natural air circulation. Renew. Energy 2007, 32, 623–637. [Google Scholar] [CrossRef]
  10. Popovici, C.G.; Hudişteanu, S.V.; Mateescu, T.D.; Cherecheş, N.-C. Efficiency Improvement of Photovoltaic Panels by Using Air Cooled Heat Sinks. Energy Procedia 2016, 85, 425–432. [Google Scholar] [CrossRef] [Green Version]
  11. AlAmri, F.; AlZohbi, G.; AlZahrani, M.; Aboulebdah, M. Analytical Modeling and Optimization of a Heat Sink Design for Passive Cooling of Solar PV Panel. Sustainability 2021, 13, 3490. [Google Scholar] [CrossRef]
  12. Al-Amri, F.; Saeed, F.; Mujeebu, M.A. Novel dual-function racking structure for passive cooling of solar PV panels –thermal performance analysis. Renew. Energy 2022, 198, 100–113. [Google Scholar] [CrossRef]
  13. Hernandez-Perez, J.G.; Carrillo, J.G.; Bassam, A.; Flota-Banuelos, M.; Patino-Lopez, L.D. Thermal performance of a discontinuous finned heatsink profile for PV passive cooling. Appl. Therm. Eng. 2021, 184, 116238. [Google Scholar] [CrossRef]
  14. Anderson, G.; Tamanna, S.; Sarraf, D.; Dussinger, P. Heat Pipe Cooling of Concentrating Photovoltaic (CPV) Systems. In Proceedings of the 6th International Energy Conversion Engineering Conference (IECEC), Cleveland, OH, USA, 28–30 July 2008. [Google Scholar] [CrossRef] [Green Version]
  15. Soliman, A.M.A.; Yousef, M.S.; Ookawarad, S.; Hassan, H. Experimental study of using system of flat heat pipe-phase change material inclusion heat sink for thermal regulation of simulated PV. Exp. Heat Transf. 2022. Available online: https://www.tandfonline.com/doi/full/10.1080/08916152.2022.2071359 (accessed on 4 April 2022).
  16. Sutanto, B.; Indartono, Y.S.; Wijayanta, A.T.; Iacovides, H. Enhancing the performance of floating photovoltaic system by using thermosiphon cooling method: Numerical and experimental analyses. Int. J. Therm. Sci. 2022, 180, 107727. [Google Scholar] [CrossRef]
  17. Tang, X.; Quan, Z.; Zhao, Y. Experimental Investigation of Solar Panel Cooling by a Novel Micro Heat Pipe Array. Energy Power Eng. 2010, 2, 171–174. [Google Scholar] [CrossRef] [Green Version]
  18. Arıcı, M.; Bilgin, F.; Nižetić, S.; Papadopoulos, A.M. Phase change material based cooling of photovoltaic panel: A simplified numerical model for the optimization of the phase change material layer and general economic evaluation. J. Clean. Prod. 2018, 189, 738–745. [Google Scholar] [CrossRef]
  19. Rosa-Clot, M.; Rosa-Clot, P.; Tina, G.M.; Scandura, P.F. Submerged photovoltaic solar panel: SP2. Renew. Energy 2010, 35, 1862–1865. [Google Scholar] [CrossRef]
  20. El-Seesy, I.E.; Khalil, T.; Ahmed, M. Experimental investigations and developing of photovoltaic/thermal system. World Appl. Sci. J. 2012, 19, 1342–1347. [Google Scholar]
  21. Arcuri, N.; Reda, F.; De Simone, M. Energy and thermo-fluid-dynamics evaluations of photovoltaic panels cooled by water and air. Sol. Energy 2014, 105, 147–156. [Google Scholar] [CrossRef]
  22. Du, B.; Hu, E.; Kolhe, M. Performance analysis of water cooled concentrated photovoltaic (CPV) system. Renew. Sustain. Energy Rev. 2012, 16, 6732–6736. [Google Scholar] [CrossRef]
  23. Haidar, Z.A.; Orfi, J.; Kaneesamkandi, Z. Photovoltaic Panels Temperature Regulation Using Evaporative Cooling Principle: Detailed Theoretical and Real Operating Conditions Experimental Approaches. Energies 2021, 14, 145. [Google Scholar] [CrossRef]
  24. Kadhim, A.M.; Aljubury, I.M.A. Experimental Evaluation of Evaporative Cooling for Enhancing Photovoltaic Panels Efficiency Using Underground Water. J. Eng. 2020, 26, 14–33. [Google Scholar] [CrossRef]
  25. Haidar, Z.A.; Orfi, J.; Kaneesamkandi, Z. Experimental investigation of evaporative cooling for enhancing photovoltaic panels efficiency. Results Phys. 2018, 11, 690–697. [Google Scholar] [CrossRef]
  26. Alktranee, M.; Bencs, P. Effect of Evaporative Cooling on Photovoltaic Module Performance. Process Integr. Optim. Sustain. 2022, 6, 921–930. [Google Scholar] [CrossRef]
  27. Lago, S.; Giuliano Albo, P.A. Thermodynamic properties of acetone calculated from accurate experimental speed of sound measurements at low temperatures and high pressures. J. Chem. Thermodyn. 2009, 41, 506–512. [Google Scholar] [CrossRef]
  28. Kalogirou, S.A. Solar Energy Engineering: Processes and Systems; Academic Press: Cambridge, MA, USA, 2013. [Google Scholar]
  29. Schott, T. Operation temperatures of PV modules: A theoretical and experimental approach. E. C. Photovolt. Sol. Energy Conf. 1985, 6, 392–396. [Google Scholar]
  30. Holman, J. Heat Transfer; McGraw-Hill: Singapore, 1992. [Google Scholar]
  31. Dubey, S.; Sarvaiya, J.N.; Seshadri, B. Temperature Dependent Photovoltaic (PV) Efficiency and Its Effect on PV Production in the World–A Review. Energy Procedia 2013, 33, 311–321. [Google Scholar] [CrossRef]
Figure 1. (a) Experimental setup, (b) HPT’s arrangement.
Applsci 13 01457 g001
Figure 2. The distribution of the thermocouples that were used to measure the temperature of the cooled and reference PV panels. (a) Reference panel without heat pipe (b) panel with heat pipe.
Applsci 13 01457 g002
Figure 3. Comparison between theoretical and experimental result.
Applsci 13 01457 g003
Figure 4. The temperature reference PV panel and the PV panel with 25 mL acetone.
Applsci 13 01457 g004
Figure 5. The temperature reference PV panel and the PV panel with 50 mL acetone.
Applsci 13 01457 g005
Figure 6. The temperature reference PV panel and the PV panel with 75 mL acetone.
Applsci 13 01457 g006
Figure 7. The temperature reference PV panel and the PV panel with 100 mL acetone.
Applsci 13 01457 g007
Figure 8. Panel temperature efficiency variation with time for different number of heat pipes.
Applsci 13 01457 g008
Figure 9. Effect of heat pipe material on panel temperature and efficiency.
Applsci 13 01457 g009
Figure 10. Effect of PCL boiling point on panel temperature and efficiency.
Applsci 13 01457 g010
Table 1. Specifications of PV panel.
LayerThermal Conductivity (W/mK)Thickness (m)Density
(kg/m3)
Specific Heat
Capacity (J/kg K)
Glass1.80.0033000500
ARC32100 × 10−92400691
PV Cells148225 × 10−62330677
EVA top layer0.35500 × 10−69602090
EVA bottom layer23710 × 10−62700900
Tedlar0.20.000112001250
Table 2. The specification of the WF.
NameBoiling PointVolumeDensity (Liquid)Density (Vapor at 330 K)
Acetone56 °C0.3925 L/tube784 kg/m32.325 kg/m3
Disclaimer/Publisher’s Note: The statements, opinions and data contained in all publications are solely those of the individual author(s) and contributor(s) and not of MDPI and/or the editor(s). MDPI and/or the editor(s) disclaim responsibility for any injury to people or property resulting from any ideas, methods, instructions or products referred to in the content.