Article

Fabrication of Low Electrical Percolation Threshold Multi-Walled Carbon Nanotube Sensors Using Magnetic Patterning

1
CENTI, Centre for Nanotechnology and Smart Materials, 4760-034 Vila Nova de Famalicão, Portugal
2
Department of Metallurgical and Materials Engineering, Faculty of Engineering, University of Porto, 4200-465 Porto, Portugal
3
IPC, Institute for Polymers and Composites, Department of Polymer Engineering, University of Minho, 4804-533 Guimarães, Portugal
4
LAETA/INEGI–Institute of Science and Innovation in Mechanical and Industrial Engineering, 4200-465 Porto, Portugal
*
Author to whom correspondence should be addressed.
Appl. Sci. 2023, 13(3), 1437; https://doi.org/10.3390/app13031437
Submission received: 23 December 2022 / Revised: 14 January 2023 / Accepted: 18 January 2023 / Published: 21 January 2023
(This article belongs to the Special Issue Smart Composites: Design, Manufacturing and Integration)

Abstract

:
Soft robotics is an expanding area with multiple applications; however, building low-cost, soft, and flexible robots requires the development of sensors that can be directly integrated into the soft robotics fabrication process. Thus, the motivation for this work was the design of a low-cost fabrication process of flexible sensors that can detect touch and deformation. The fabrication process proposed uses a flexible polymer nanocomposite with permanent magnets strategically placed where the conductive electrodes should be. The nanocomposite is based on poly(dimethylsiloxane) (PDMS) and multi-walled carbon nanotubes (MWCNTs). The MWCNT contains ferromagnetic impurities remaining from the synthesis process, which can be used for magnetic manipulation. Several electrode geometries were successfully simulated and tested. The magnetic patterning was simulated, allowing the fabrication of conductive patterns within the composite. This fabrication process allowed the reduction of the electrical resistivity of the nanocomposites as compared to the composites with homogeneous MWCNT dispersion. It also allowed the fabrication of piezoresistive and triboelectric sensors at MWCNT concentration as low as 0.5 wt.%. The fabrication process proposed is flexible, allows the development of sensors for soft robotics, as well as monitoring large and unconventional areas, and may be adapted to different mould shapes and polymers at low cost.

1. Introduction

The fabrication of low electrical percolation threshold polymer nanocomposites aims to reduce the weight fraction of electrically conductive nanomaterial necessary to achieve a given level of electrical resistivity of the nanocomposite [1]. There are several strategies to achieve a lower electrical percolation threshold in nanocomposites [2]. Most methods consist of aligning the conductive nanoparticles [3] or constraining the location of carbon nanotubes (CNTs), such as the utilisation of polymer beads during in situ polymerization, forcing the contact between CNTs [4] or the migration to the interface of immiscible polymers [5]. Concerning nanocomposites with aligned nanoparticles, McNally et al. [6] demonstrated that mechanical deformation induced a decrease in nanoparticle contacts, thus decreasing the electrical conductivity of the composite. The use of immiscible polymers to force the nanoparticle’s location at the interface does not allow the control of their position within the nanocomposite. Conversely, magnetic forces may induce the contact between conductive nanoparticles with a ferromagnetic response, making it possible to control their location in the polymer matrix, thus allowing the fabrication of conductive patterns that can be used as sensor electrodes.
The magnetic field can be generated using electromagnets or permanent magnets. During the fabrication process, the strong magnetic field can lead to coil overheating problems that may damage the electromagnets [7], thus making the use of permanent magnets more attractive. The latter is more straightforward to use, but the magnetic field density can be lower. The effective use of lower magnetic fields may be possible by functionalising CNTs with magnetic nanoparticles or using metal plating techniques, as reported by Ariu et al. [8]. Several metal plating methodologies were investigated in their work, including nickel, cobalt, and nickel-iron plating. Still, this is an unnecessary extra step when the MWCNTs can already provide a magnetic response.
The magnetic response of CNTs has been interpreted using different theories. M. Fujiwara et al. [9] interpret it as resulting from the movement of the electrons circling the circumference of the CNTs producing a significant orbital magnetic moment, explaining the anisotropic susceptibility. Other theories are related to vacancies in the CNT structure that induce ferromagnetic behaviour [10]. CNTs produced by the Catalytic Chemical Vapor Deposition (CCVD) method present significant contamination by the catalyst materials used in their fabrication process, which are typically encapsulated in the CNTs, and will undoubtedly be the primary source of their magnetic response [11].
The precise control of the location of the MWCNTs in the polymer matrix may lower the electrical percolation threshold and help sensor fabrication. This technique can be used for the application of piezoresistive sensors [12], triboelectric sensors and generators [13,14,15], capacitive sensors [16], temperature sensors [17], heating bands [18], etc. The present work explores the use of permanent magnets to fabricate low electrical percolation threshold samples by controlling the position of the MWCNTs inside PDMS. The nanocomposites were tested for application as triboelectric and piezoresistive sensors to detect physical contact and mechanical deformation. In the future, this fabrication technique can produce multisensory devices in the same substrate, which may be applicable in soft robotics and wearables [19].

2. Materials and Methods

The workflow adopted in this work is shown in Figure 1, covering three main topics: the characterisation of the MWCNT and its nanocomposites, numerical simulations of the magnetic interactions, and sensor fabrication and testing. The characterisation of the MWCNT and its nanocomposites focused on the study of the MWCNT’s magnetic properties and the influence of the application of magnetic fields upon the electrical percolation threshold of MWCNT/PDMS nanocomposites prepared at different concentrations. Then, the numerical simulations helped to select the best magnet configurations to create linear patterns. The evaluation of the interactions between individual magnets allowed the simulation of more complex sensor electrode patterns. Linear and zig-zag patterns were simulated; however other designs may be simulated according to the application requirements. Finally, the performance of the fabricated sensors was evaluated both as a piezoresistive sensor to detect deformation and as a triboelectric sensor to detect contact and release.

2.1. Materials

The MWCNTs were supplied by Nanocyl (NC7000, Sambreville, Belgium). The nanotubes were analysed by scanning electron microscopy/energy dispersive spectroscopy (SEM/EDS) (FEI, Quanta 400FEG, Hillsboro, Oregon, USA) to observe the morphology and obtain the elemental analysis to identify the catalyst attached to the MWCNTs. The PDMS and the curing agent (SYLGARD™ 184 Silicone Elastomer Kit) were supplied by Dow Corning Co. Ltd Midland, Michigan, USA. The neodymium magnets were bought at K&J Magnetics, Pipersville, USA. The magnets used for the rectangular pattern were N42SH magnets with dimensions of 25.2 × 19.1 × 19.1 cm3, and for the other patterns, N42 magnets were used with dimensions of 0.5 × 0.5 × 0.5 cm3.

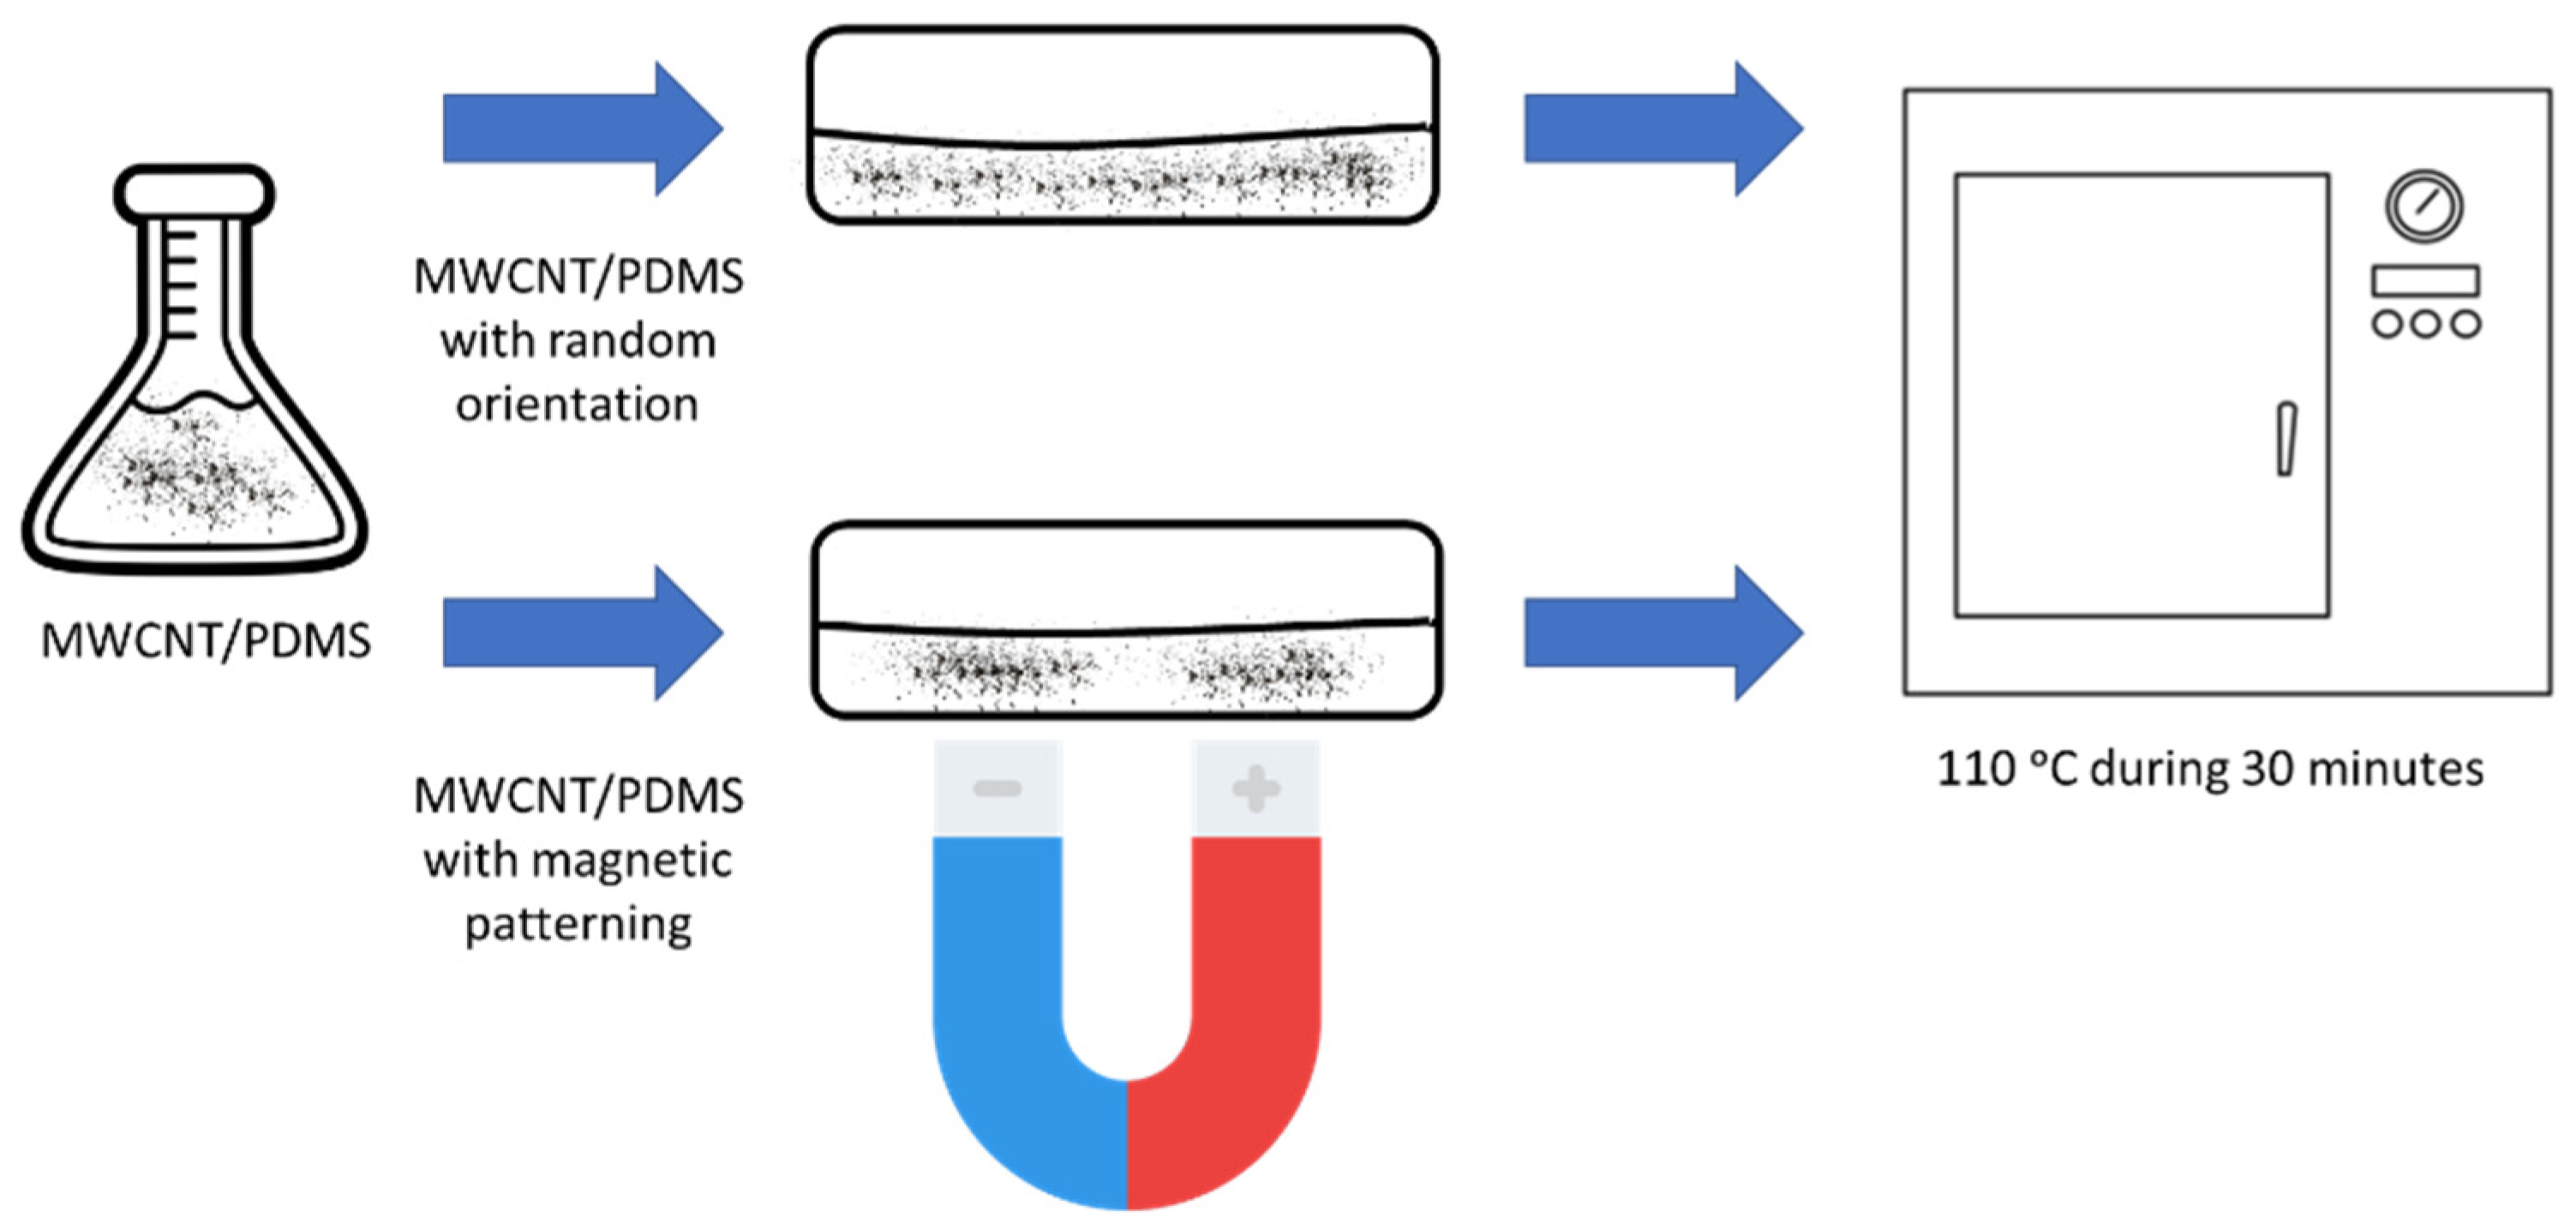
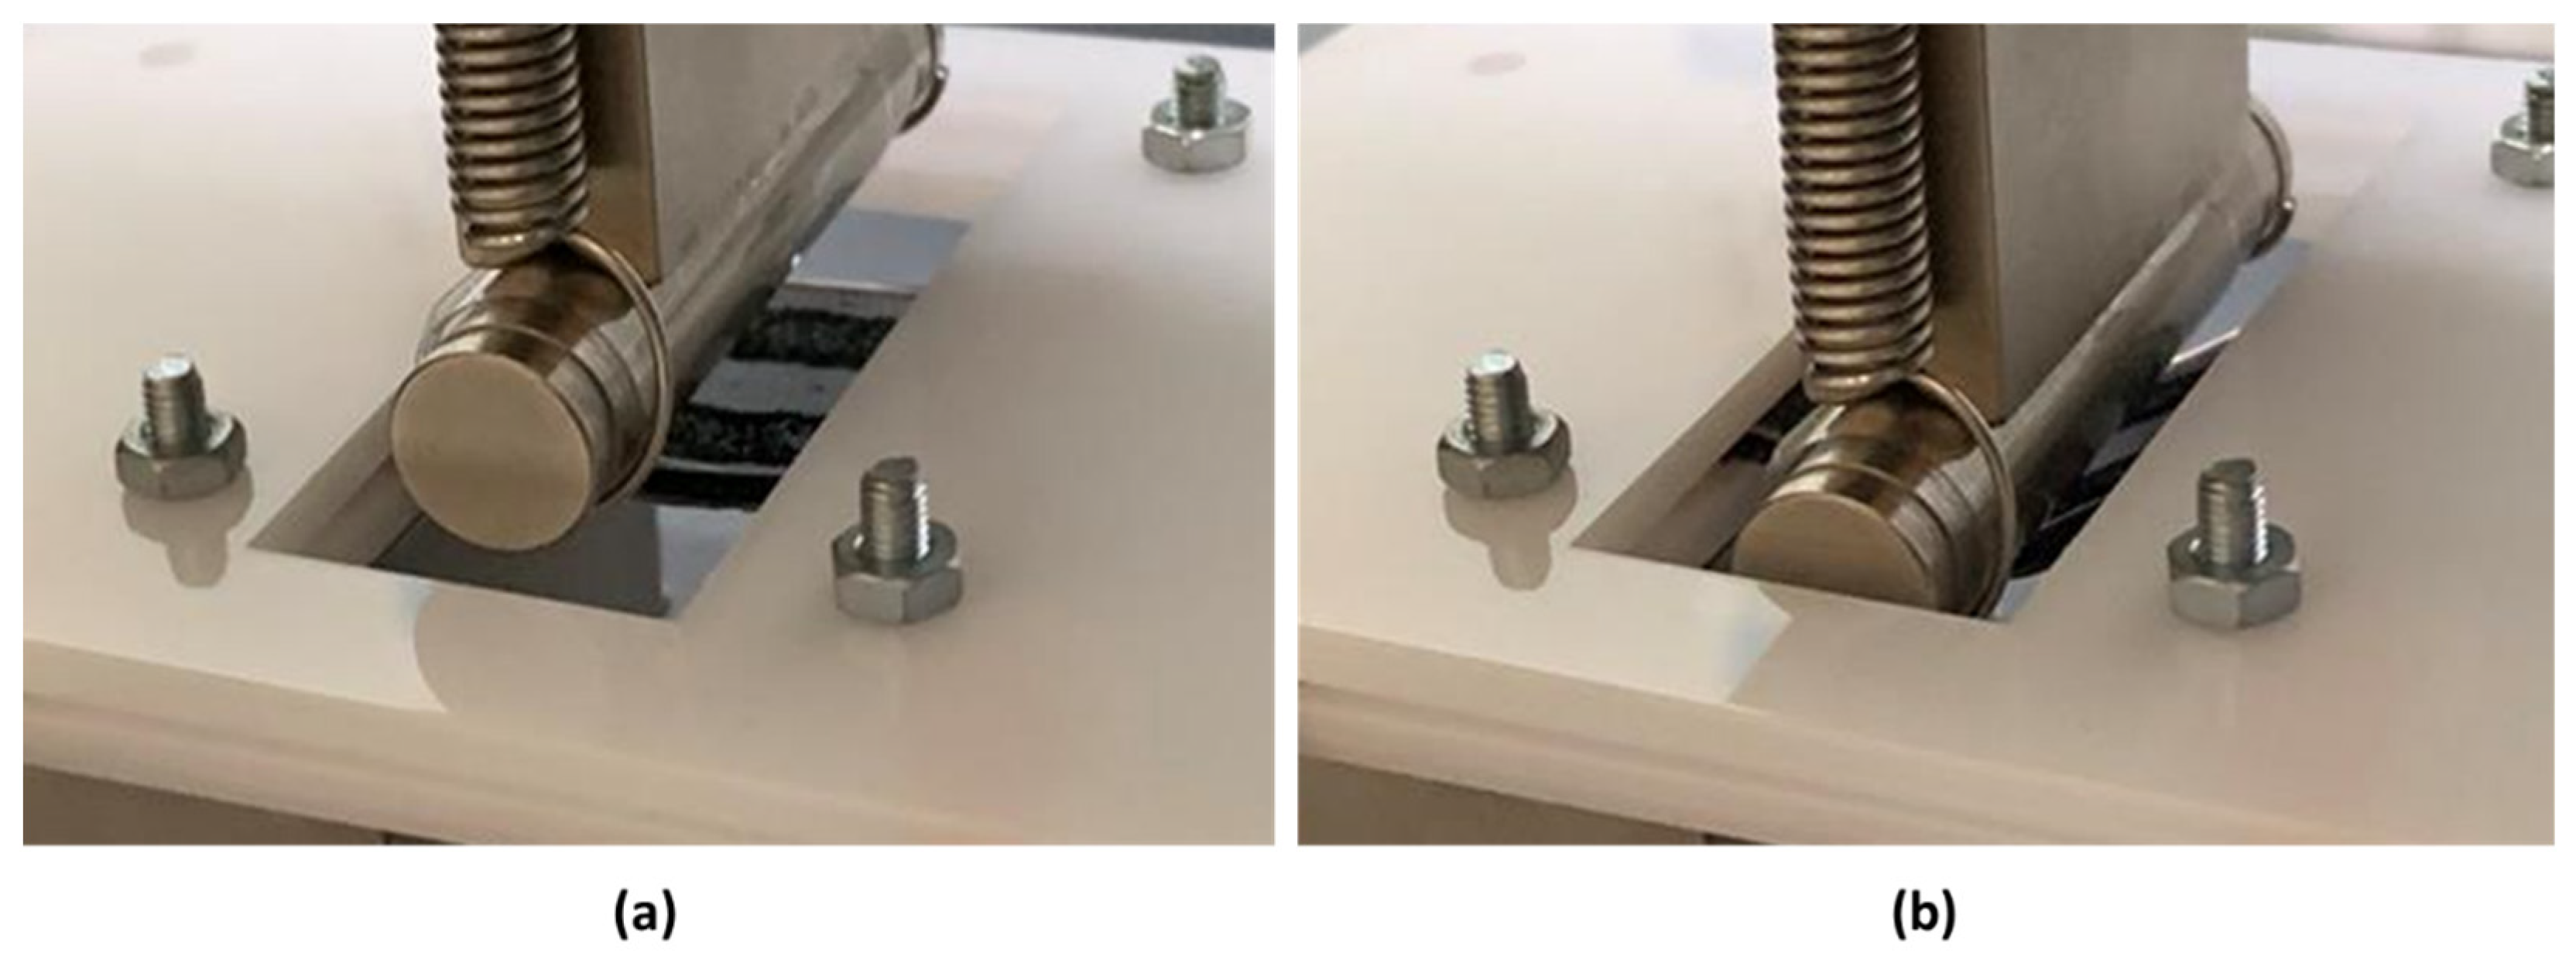
2.2. Numerical Simulation and Fabrication Processes

The fabricated patterns were simulated using Ansys Maxwell software to study the magnetic interactions between permanent magnets. In the first stage, three different patterns were studied. The first pattern consisted of the use of permanent magnets in an alternating configuration; the second pattern consisted of the utilisation of permanent magnets in a design where the surface of the magnets had the same polarity; and finally, the third pattern consisted of a Halbach array.
After observing that the MWCNT response under a static magnetic field compares to the ANSYS simulation, the three different electrode patterns were simulated (rectangle, zig-zag shape, and parallel lines). These three patterns were implemented using permanent magnets in a configuration of alternating polarity to allow the formation of continuous patterns.
The magnetic patterns were fabricated in the laboratory to confirm the simulation results. Tests were carried out to characterise: (1) the electrical percolation threshold of the nanocomposites, (2) the magnetic patterns produced, and (3) the fabrication of the sensor’s electrodes. The samples prepared for each study were rectangular with the following dimensions and MWCNT concentrations: for test (1) 2 × 1 × 0.5 cm3, with MWCNT concentration in the range 0.01–5 wt.%; for test (2) 2 × 1 × 0.5 cm3 and MWCNT concentration of 0.1 wt.%; for test (3) 4 × 2 × 0.2 cm3 with MWCNT concentration of 0.5 and 1 wt.%.
The fabrication process of all the MWCNT/PDMS nanocomposites is schematically illustrated in Figure 2. First, the MWCNTs were dispersed into the PDMS under constant manual stirring for 2 min. Then, the curing agent, in a 1:10 ratio, was added to the MWCNT/PDMS mixture and manually stirred for another 2 min. Then, the mixtures obtained were placed in rectangular laser-cut acrylic moulds, on top of the magnetic patterns, for 15 h. The samples were cured during the 15 h to make sure that the PDMS was solid enough to prevent the movement of the MWCNTs before the final curing process. The final curing process was done in an oven at 110 °C for 30 min without magnetic fields. If the curing process is too fast, there is not enough time for the particles to settle in the right position, affecting the patterning quality.
The electrical contacts were fabricated by cutting a thin layer of MWCNT/PDMS on opposite sides of the sample and by placing silver conductive epoxy (MG Chemicals 8331S Silver Conductive Epoxy) on the MWCNTs’ surface. After curing the conductive epoxy, the electrical contacts were covered with copper tape to facilitate the connection to the measurement equipment.

2.3. Experimental Tests

The magnetic properties of the MWCNTs were analysed using a SQUID magnetometer (Quantum Design at IFIMUP-IN). The magnetisation as a function of the applied magnetic field (M(H)) was performed at temperatures 300, 320, 340, 360, and 380 K for a maximum applied magnetic field of 50 kOe.
The electrical resistivity of the fabricated nanocomposite samples was measured by the two-point electrical resistance measurement technique (Keithley Instruments 6487, Solon, Ohio). Seven samples were analysed for each nanocomposite prepared. The morphological characterisation of the samples was performed using a Digital Microscope (Leica DVM6). The three-point bending tests were carried out on a Shimadzu AGX-V at 150 mm/min speed and with applied forces between 6 and 9 N.
The nanocomposite samples prepared with different magnetic patterning were characterised as piezoresistive and triboelectric sensors using a setup similar to the three-point bending test, as shown in Figure 3.
The piezoresistive sensors were characterised using a Keithley DMM7510 7½ Digital Multimeter, where both sample electrodes were connected to the multimeter terminals. For the triboelectric characterisation, an exact high-speed digital multimeter was used; however, the open circuit output voltage was measured instead of electrical resistance. The triboelectric effect was measured in single electrode configuration mode. One probe was connected to the sample, and the other was connected to the electrical ground, measuring the flow of the accumulated charge between the sample and the electrical ground.

3. Results

3.1. Characterization of the Magnetic Properties of MWCNTs and MWCNT/PDMS Nanocomposite

To better understand the magnetic properties of the MWCNT particles, SEM/EDS was performed on the MWCNTs. This test was useful to analyse the elemental composition and search for contaminants remaining from the fabrication process. Figure 4 presents an SEM-backscattered electron image of the MWCNT, showing contrasting particles identified by EDS as based on aluminium. The fabrication of the NC7000 MWCNT uses alumina substrate for the iron catalyst, which under the MWCNT synthesis conditions (high-temperature environment with carbon-rich gas) may reduce to aluminium carbide, Al4C3 [20].
The SQUID analysis presented in Figure 5 showed that the MWCNTs and the MWCNT/PDMS present both ferromagnetism and diamagnetism. By analysing the magnetisation curve for the MWCNTs, it is noticeable that the ferromagnetic properties dominate at lower fields (between −6000 and 6000 Oe), and the diamagnetism dominates at higher fields. This behaviour could be associated with the ferromagnetic saturation since the diamagnetism keeps changing linearly with the magnetic field. The diamagnetic property could be associated with the different materials; it could be due to the magnetic properties of MWCNTs or the catalysts (alumina or Al4C3). The ferromagnetic response could be related to the presence of iron, a ferromagnetic material that was also identified by SEM/EDS.
Similar behaviour was also reported by Ellis et al. [21], where the authors measured the magnetic properties of MWCNTs and concluded that in their specific case, the particles showed a combination of diamagnetism and ferromagnetism. They concluded that the diamagnetism arose from the multi-walled nanotubes, and the ferromagnetism was due to the presence of iron nanoparticles derived from the fabrication process.
Another example is the work of Zoladz et al., 2020 [22], which reported that CNTs grown from alumina by CVD show significant ferromagnetic properties, even though the catalyst materials showed diamagnetic properties.
By analysing Figure 5b in detail, it is possible to notice a dominant ferromagnetic effect [23]. The measured coercivity (Hc), retentivity (Mr), and saturation magnetisation (Ms) of the MWCNT particles at 300 K were 84.81 Oe, 0.13 emu/g, and 1.07 emu/g, respectively. The results demonstrate that the magnetic properties of the MWCNTs are invariant in the temperature range studied, from 300 to 380 K.
As expected, when compared with the particles, the lower concentration of the MWCNTs (5 wt.%) and the polymeric nature of PDMS decrease the overall ferromagnetic properties in the nanocomposite. Analysing Figure 5d, it is presented a ferromagnetic curve. The measured coercivity (Hc), retentivity (Mr), and saturation magnetisation (Ms) of the nanocomposite at 300 K were 93.02 Oe, 0.004 emu/g, and 0.03 emu/g, respectively. Similar to the MWCNT particles, the 5 wt.% MWCNT/PDMS also shows a dominant ferromagnetic effect at lower fields (between −6000 and 6000 Oe) and a dominant diamagnetic behaviour at fields between 6000 and 50,000 Oe.
It is also noticeable that the nanocomposite has a stronger diamagnetic behaviour than the MWCNT particles. This increase in the diamagnetic behaviour could be associated with the PDMS matrix. In the work of Hamidi et al. [24], it was possible to observe a similar behaviour. When the authors tested samples with and without the PDMS matrix, a dominant diamagnetism was also present for higher fields.

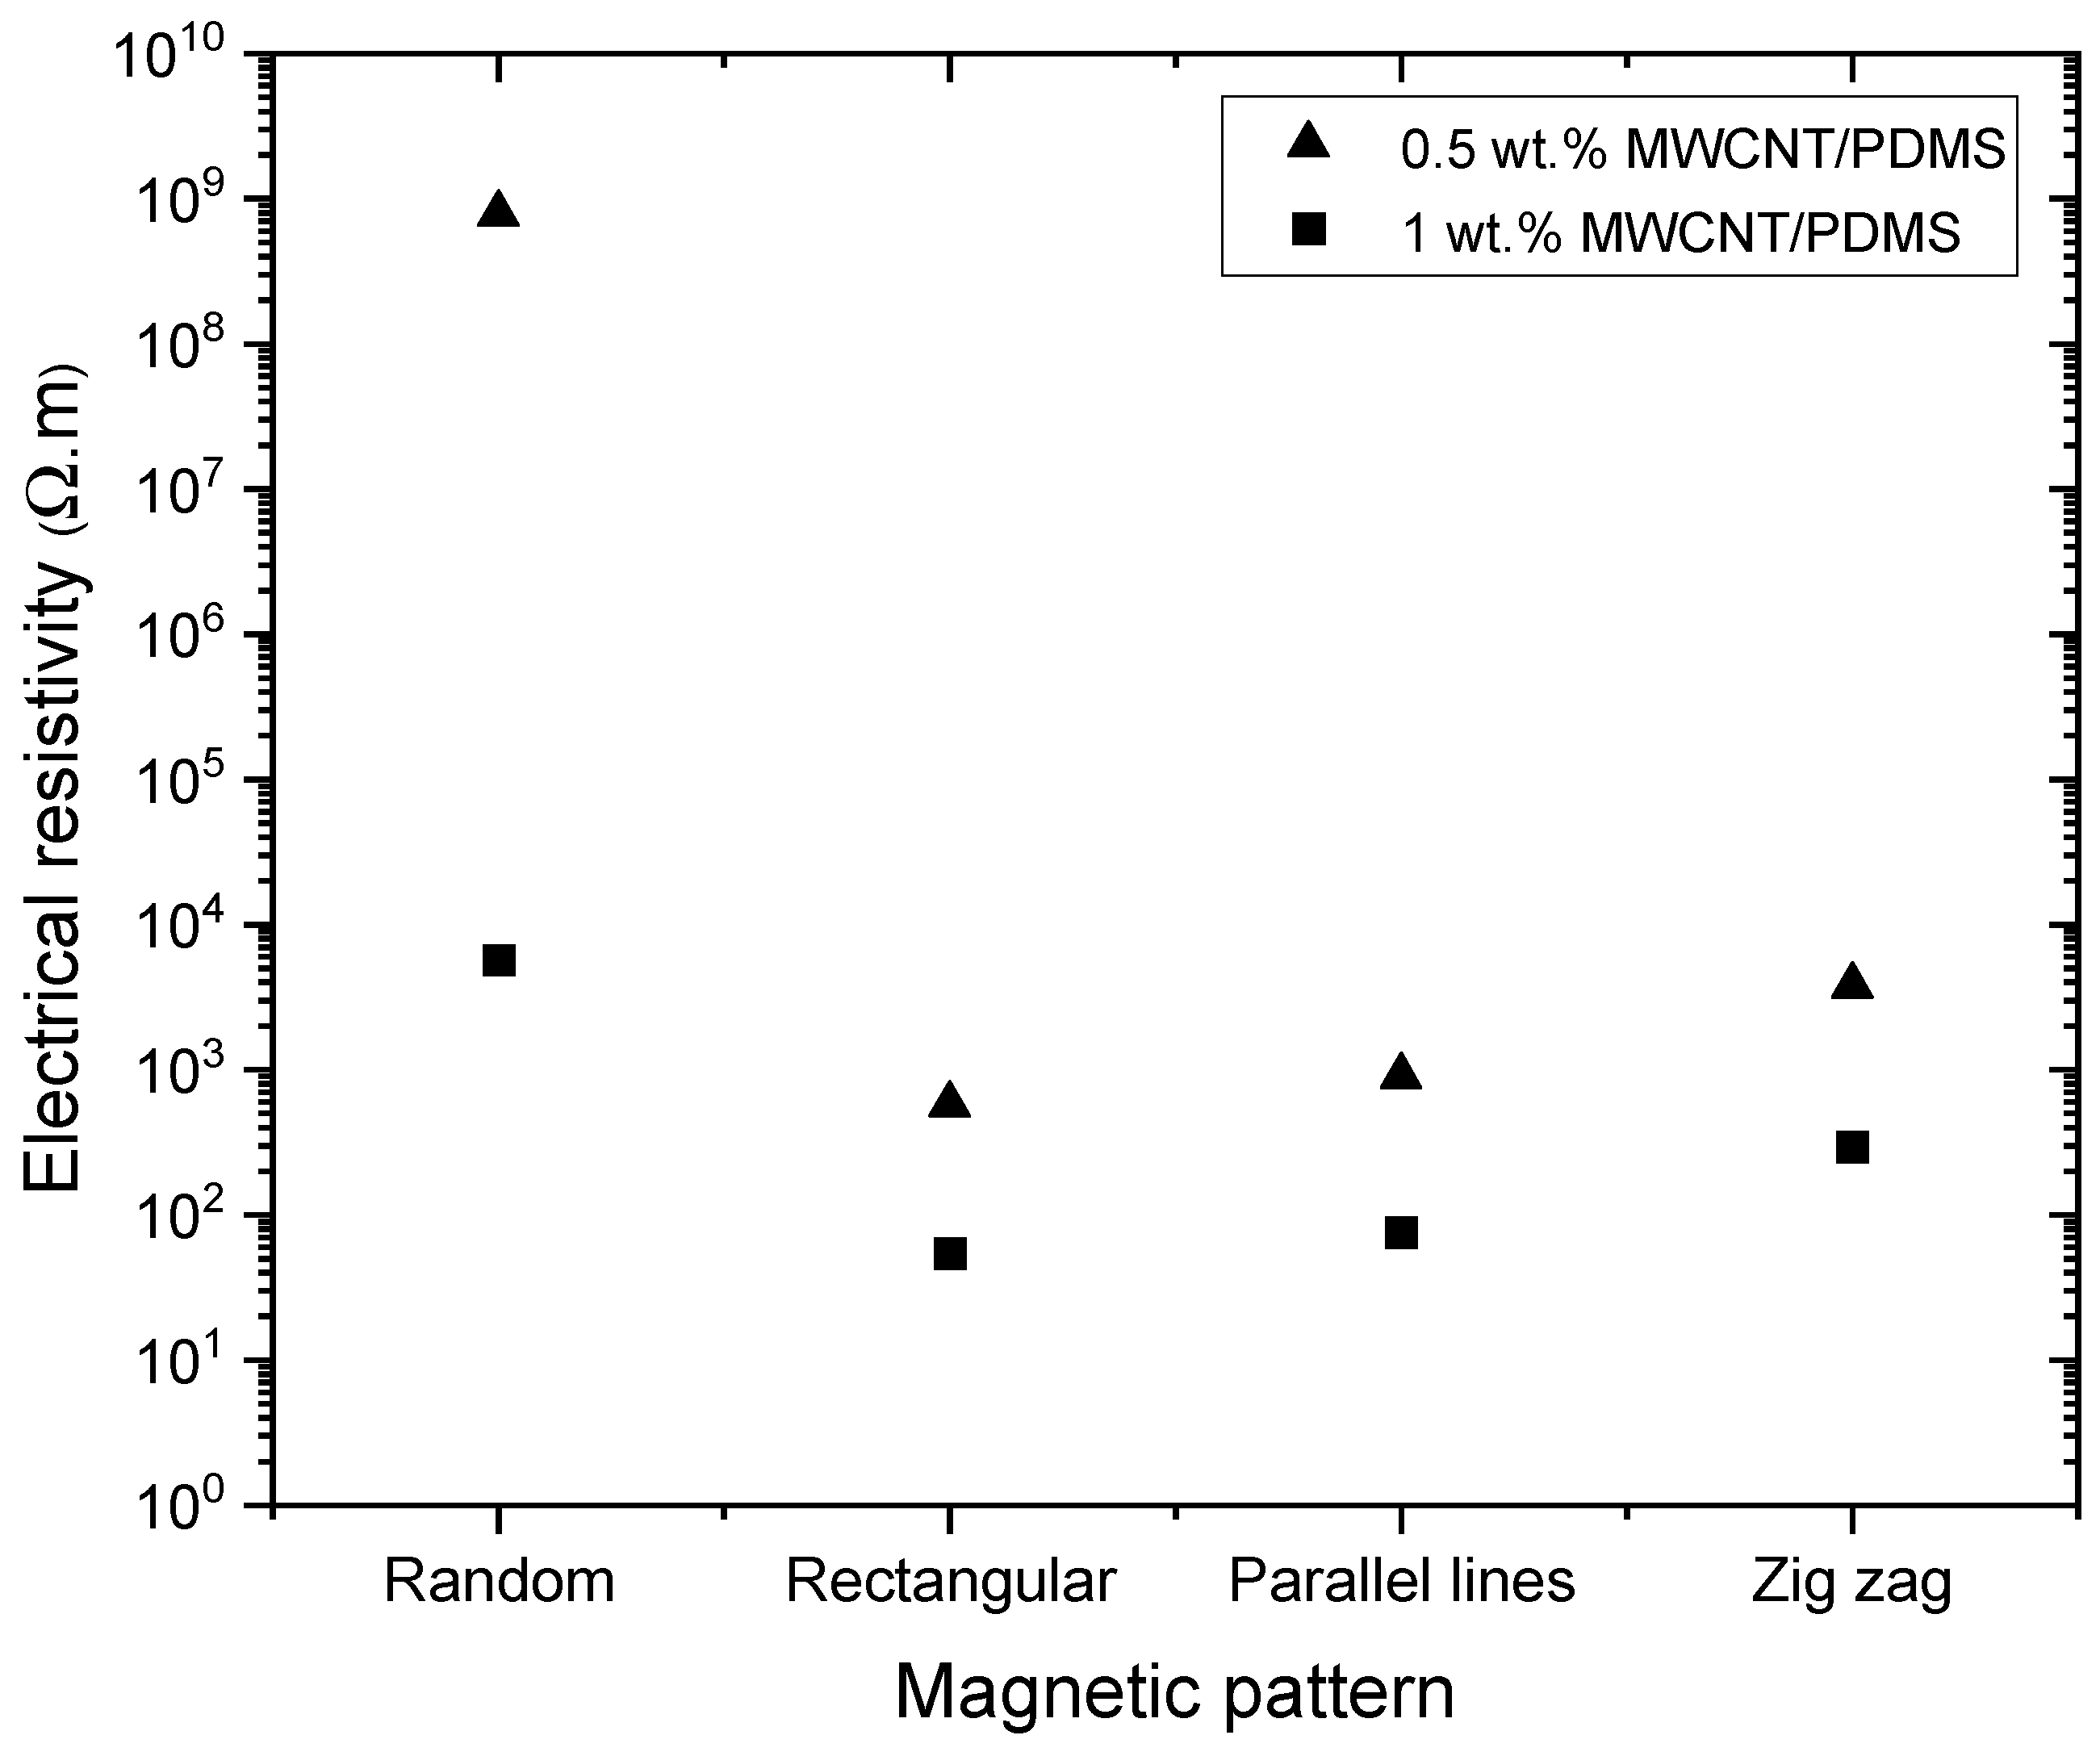
3.2. Electrical Percolation Threshold of MWCNT/PDMS under Magnetic Forces

MWCNT/PDMS nanocomposites were prepared with MWCNT concentrations ranging from 0.01 to 5 wt%. The impact of applying a magnetic field upon the MWCNT distribution in the nanocomposite, and thus on the nanocomposite’s electrical conductivity, was evaluated. The electrical resistivity of the samples was determined using Equation (1):
ρ = R × A/l
where ρ is the electrical resistivity of the nanocomposite sample, R is the electrical resistance between electrodes, A is the cross-sectional area of the sample, and l is the distance between the electrodes.
The nanocomposites’ electrical resistivity, prepared with the magnetic field (magnetic orientation) and without magnetic field (random distribution), is presented in Figure 6, defining the electrical percolation threshold obtained in each case.
Figure 6 depicts the impact of the magnetic field’s application on the nanocomposites’ electrical resistance. The magnetic field application reduces the MWCNT concentration at the electrical percolation threshold from 0.85–1 wt.% to 0.01–0.1 wt.% MWCNT. The longitudinal images of the nanocomposites obtained by digital microscopy show the effect of the magnetic field on the nanocomposite morphology, as illustrated in Figure 7a,b. The magnetic field forces the localisation of the nanoparticles near the magnet, increasing the contact between conductive particles. A numerical simulation was performed to predict the localisation of the MWCNTs relative to the magnet. The simulation was performed using ANSYS Maxwell software to illustrate the effect of the magnetic field on two stacked permanent magnets. Figure 7c,d show that magnetic flux density is predicted to be greater at the magnet’s edges.
To confirm the magnetic flux variation between the edges and centre of the magnet, the magnetic flux density along the black line drawn in Figure 7c was calculated and represented in Figure 7d. The magnetic flux density is observed to decrease from the edges to the centre of the magnet, which coincides with the MWCNT localisation on the PDMS matrix, showing that the MWCNT are attracted to the locations with higher magnetic flux.
The curves depicting the electrical percolation threshold for the nanocomposites in Figure 6 show that at 5 wt.% MWCNTs, the nanocomposite’s electrical resistivity is similar with and without applying a magnetic field. At this concentration and above, the conductivity of the nanomaterial is so high that its distribution in the nanocomposite does not affect the overall electrical resistivity.

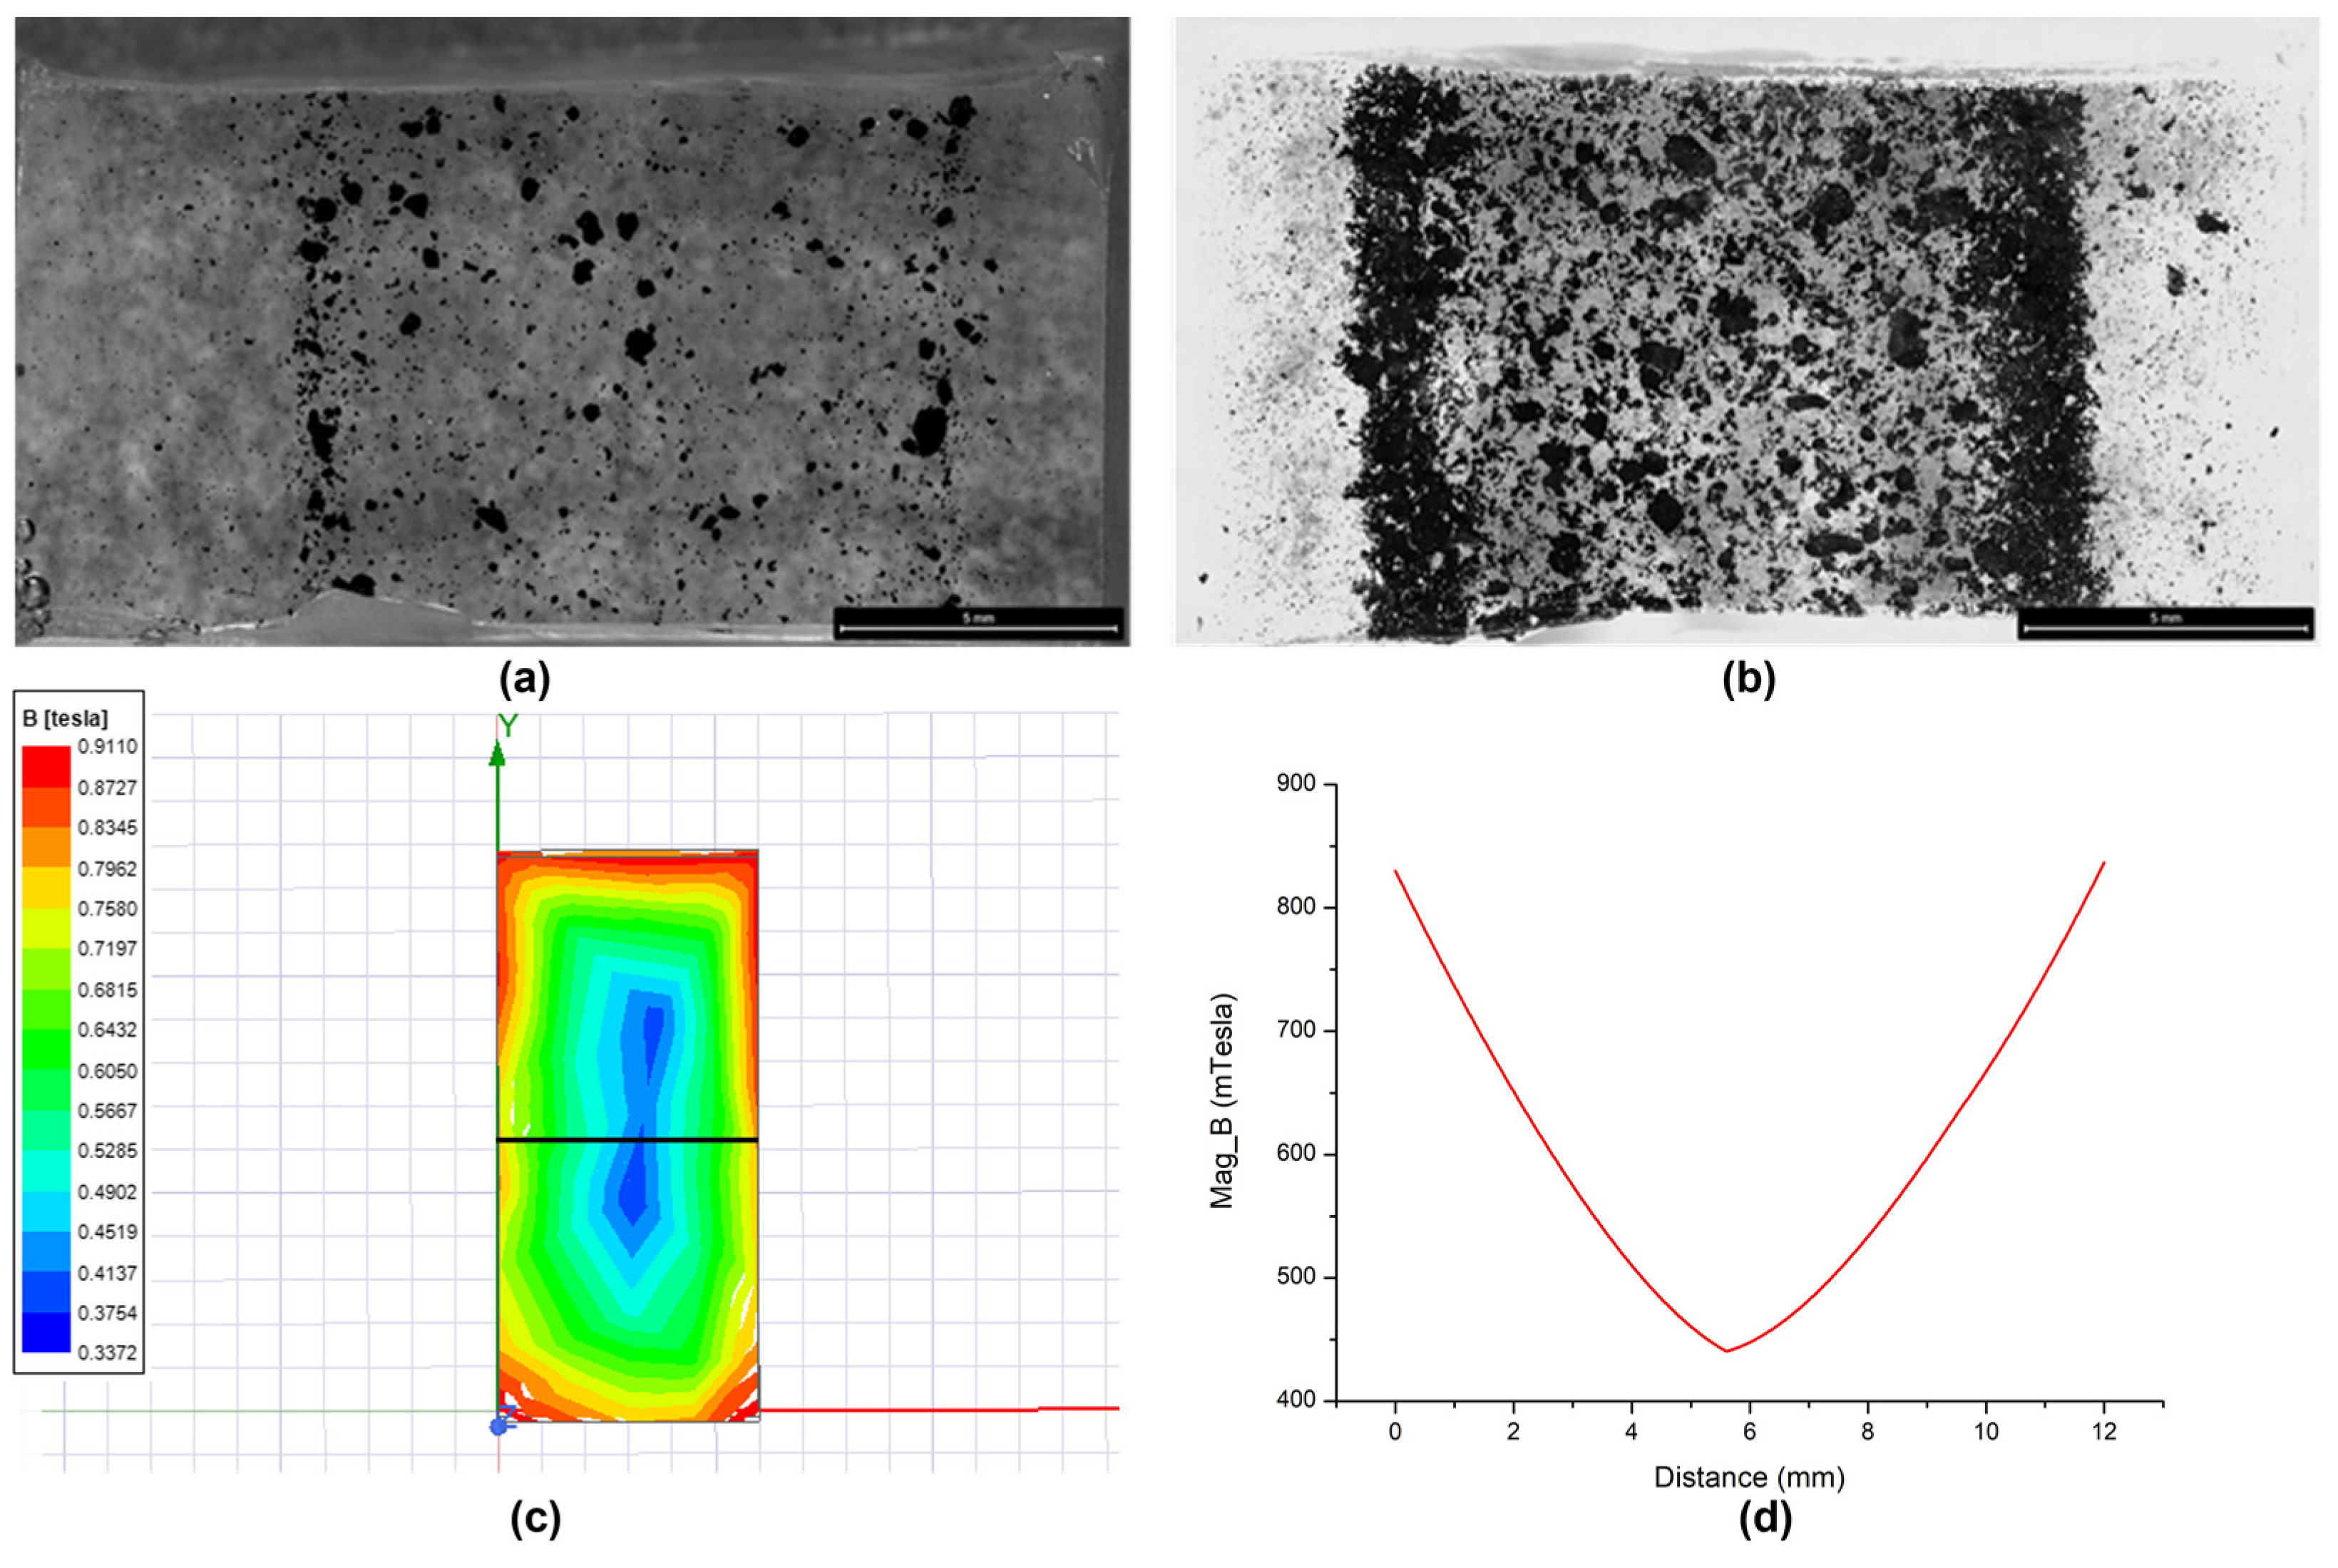
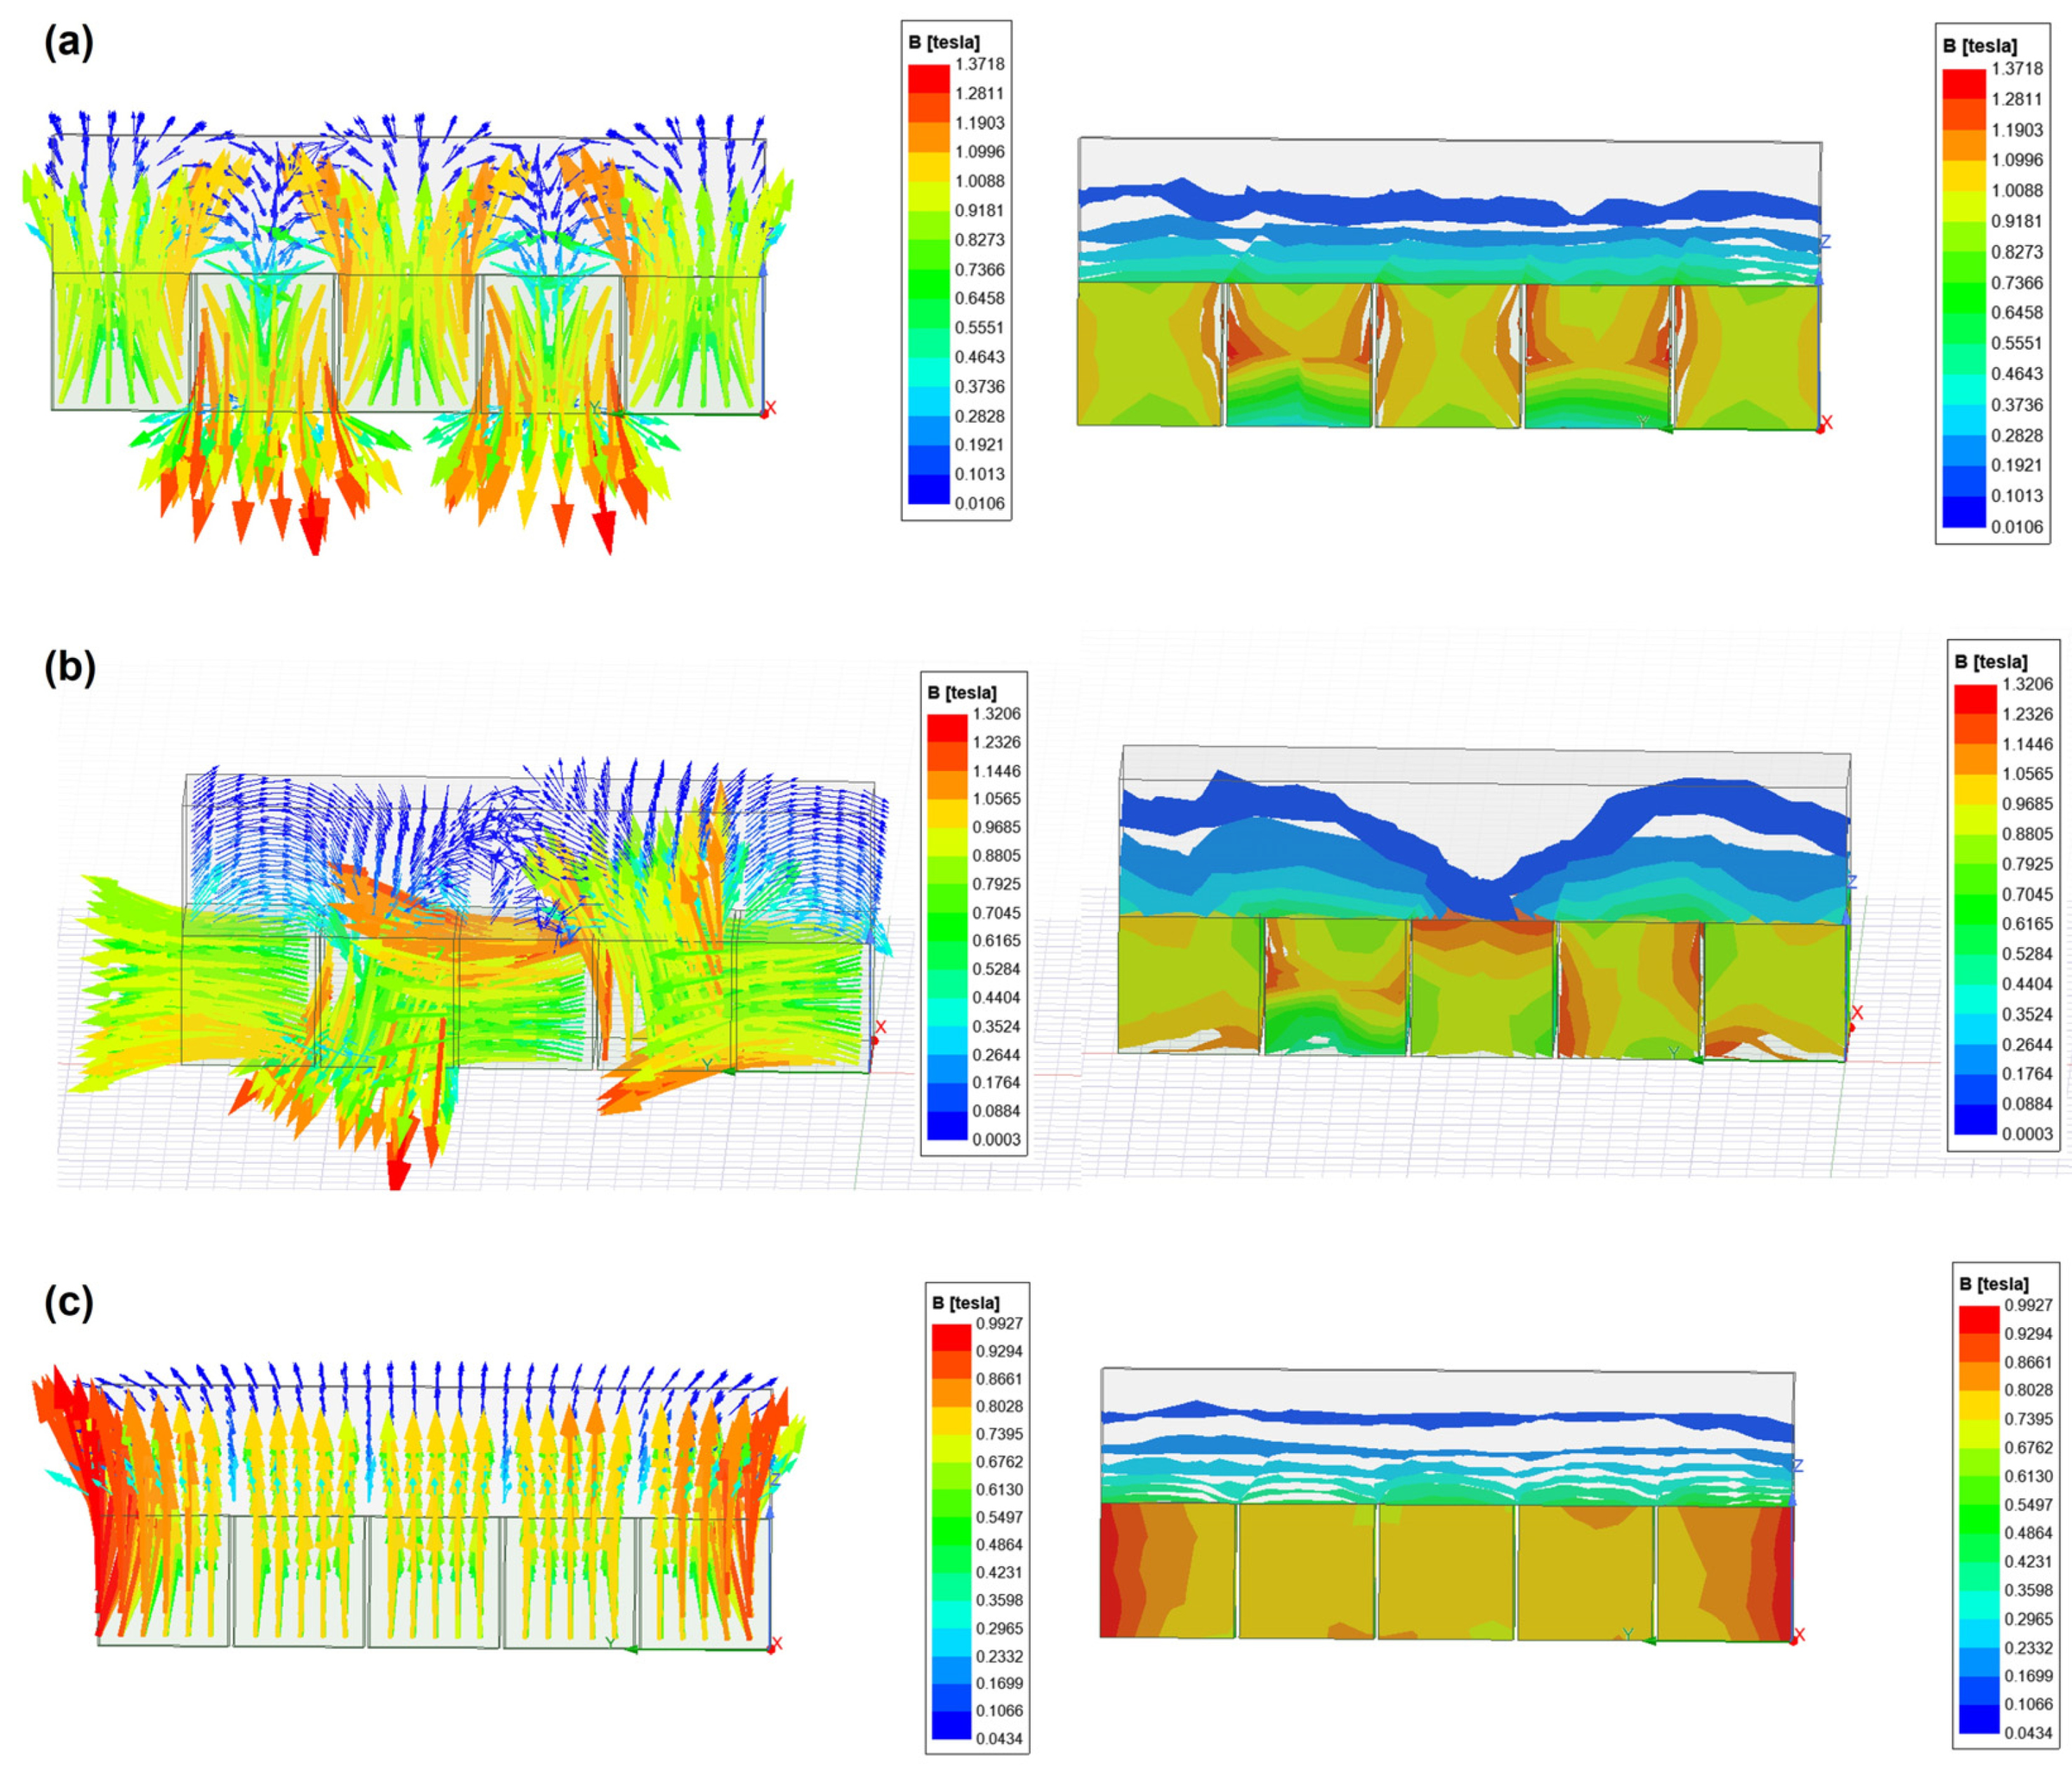
3.3. Numerical Simulations and MWCNT/PDMS Magnetic Patterning

To propose low electrical percolation threshold designs for the fabrication of sensors, MWCNT interaction with more than one magnet was simulated. Three different configurations of permanent magnets were studied. The first pattern consisted of the use of permanent magnets in an alternating configuration; the second pattern consisted of a Halbach array; and finally, the third pattern consisted of the utilisation of permanent magnets in a design where the surface of the magnets had the same polarity. The configurations were first simulated using ANSYS software and then replicated in the laboratory. The magnets were placed under MWCNT/PDMS nanocomposites with a concentration of 0.1 wt.% before the cure of the polymer. Figure 8 represents the simulation results for the magnetic field distribution and the magnetic flux lines for the three different configurations.
Figure 9 shows the magnetic patterns achieved using the three magnetic configurations (Figure 8a–c), compared with a randomly distributed nanocomposite (Figure 9a). The top line of Figure 9 represents the 3D image obtained in the micrographs, while the bottom line shows optical micrographs of the nanocomposites prepared. The 3D images reinforce the location of the MWCNT agglomerates on the polymeric matrix. A comparison of the simulation and experimental results shows the similarity between the MWCNT location and the simulation predictions, the latter showing the density of the magnetic field of permanent neodymium magnets in the air.
As demonstrated in Figure 8 and Figure 9, the MWCNT localisation replicates the magnetic pattern of the permanent magnets, accumulating in the regions of higher magnetic flux and following the magnetic field patterns of the interaction between multiple permanent magnets. Figure 9b illustrates the effect of using alternate polarity magnets, showing that it generates a continuous pattern, such as continuous lines. Using magnets aligned with the same polarity (Figure 9d) creates discontinuities due to the low magnetic field in the region between the magnets. Finally, the utilisation of Halbach arrays (Figure 9c) also creates discontinuities due to the non-uniform field at the surface of the magnets.
Lastly, sensor electrodes were developed using MWCNT patterns in PDMS generated with permanent magnets. The first step consisted in simulating the patterns using ANSYS software and then replicating the patterns in the laboratory, as shown in Figure 10.
Figure 10 illustrates that, as demonstrated before, the pattern generated by the simulation for the magnetic field intensity is replicated by the MWCNT localisation inside the PDMS matrix. While analysing the electrical resistivity of the nanocomposites prepared with different magnetic patterning, shown in Figure 11, it is observed that the random distribution nanocomposite with 0.5 wt.% MWCNTs has a high electrical resistivity due to a lack of contact between conductive particles. The nanocomposites prepared with magnetic patterning presented lower electrical resistivity compared with randomly distributed nanocomposites, either for 0.5 or 1 wt.% MWCNT concentration. The zig-zag pattern produced higher electrical resistivity nanocomposites than the other patterns, probably due to the increase in length of the electrically conductive path. This increase in resistivity may help to adjust the electrical resistance of a sensor if needed.

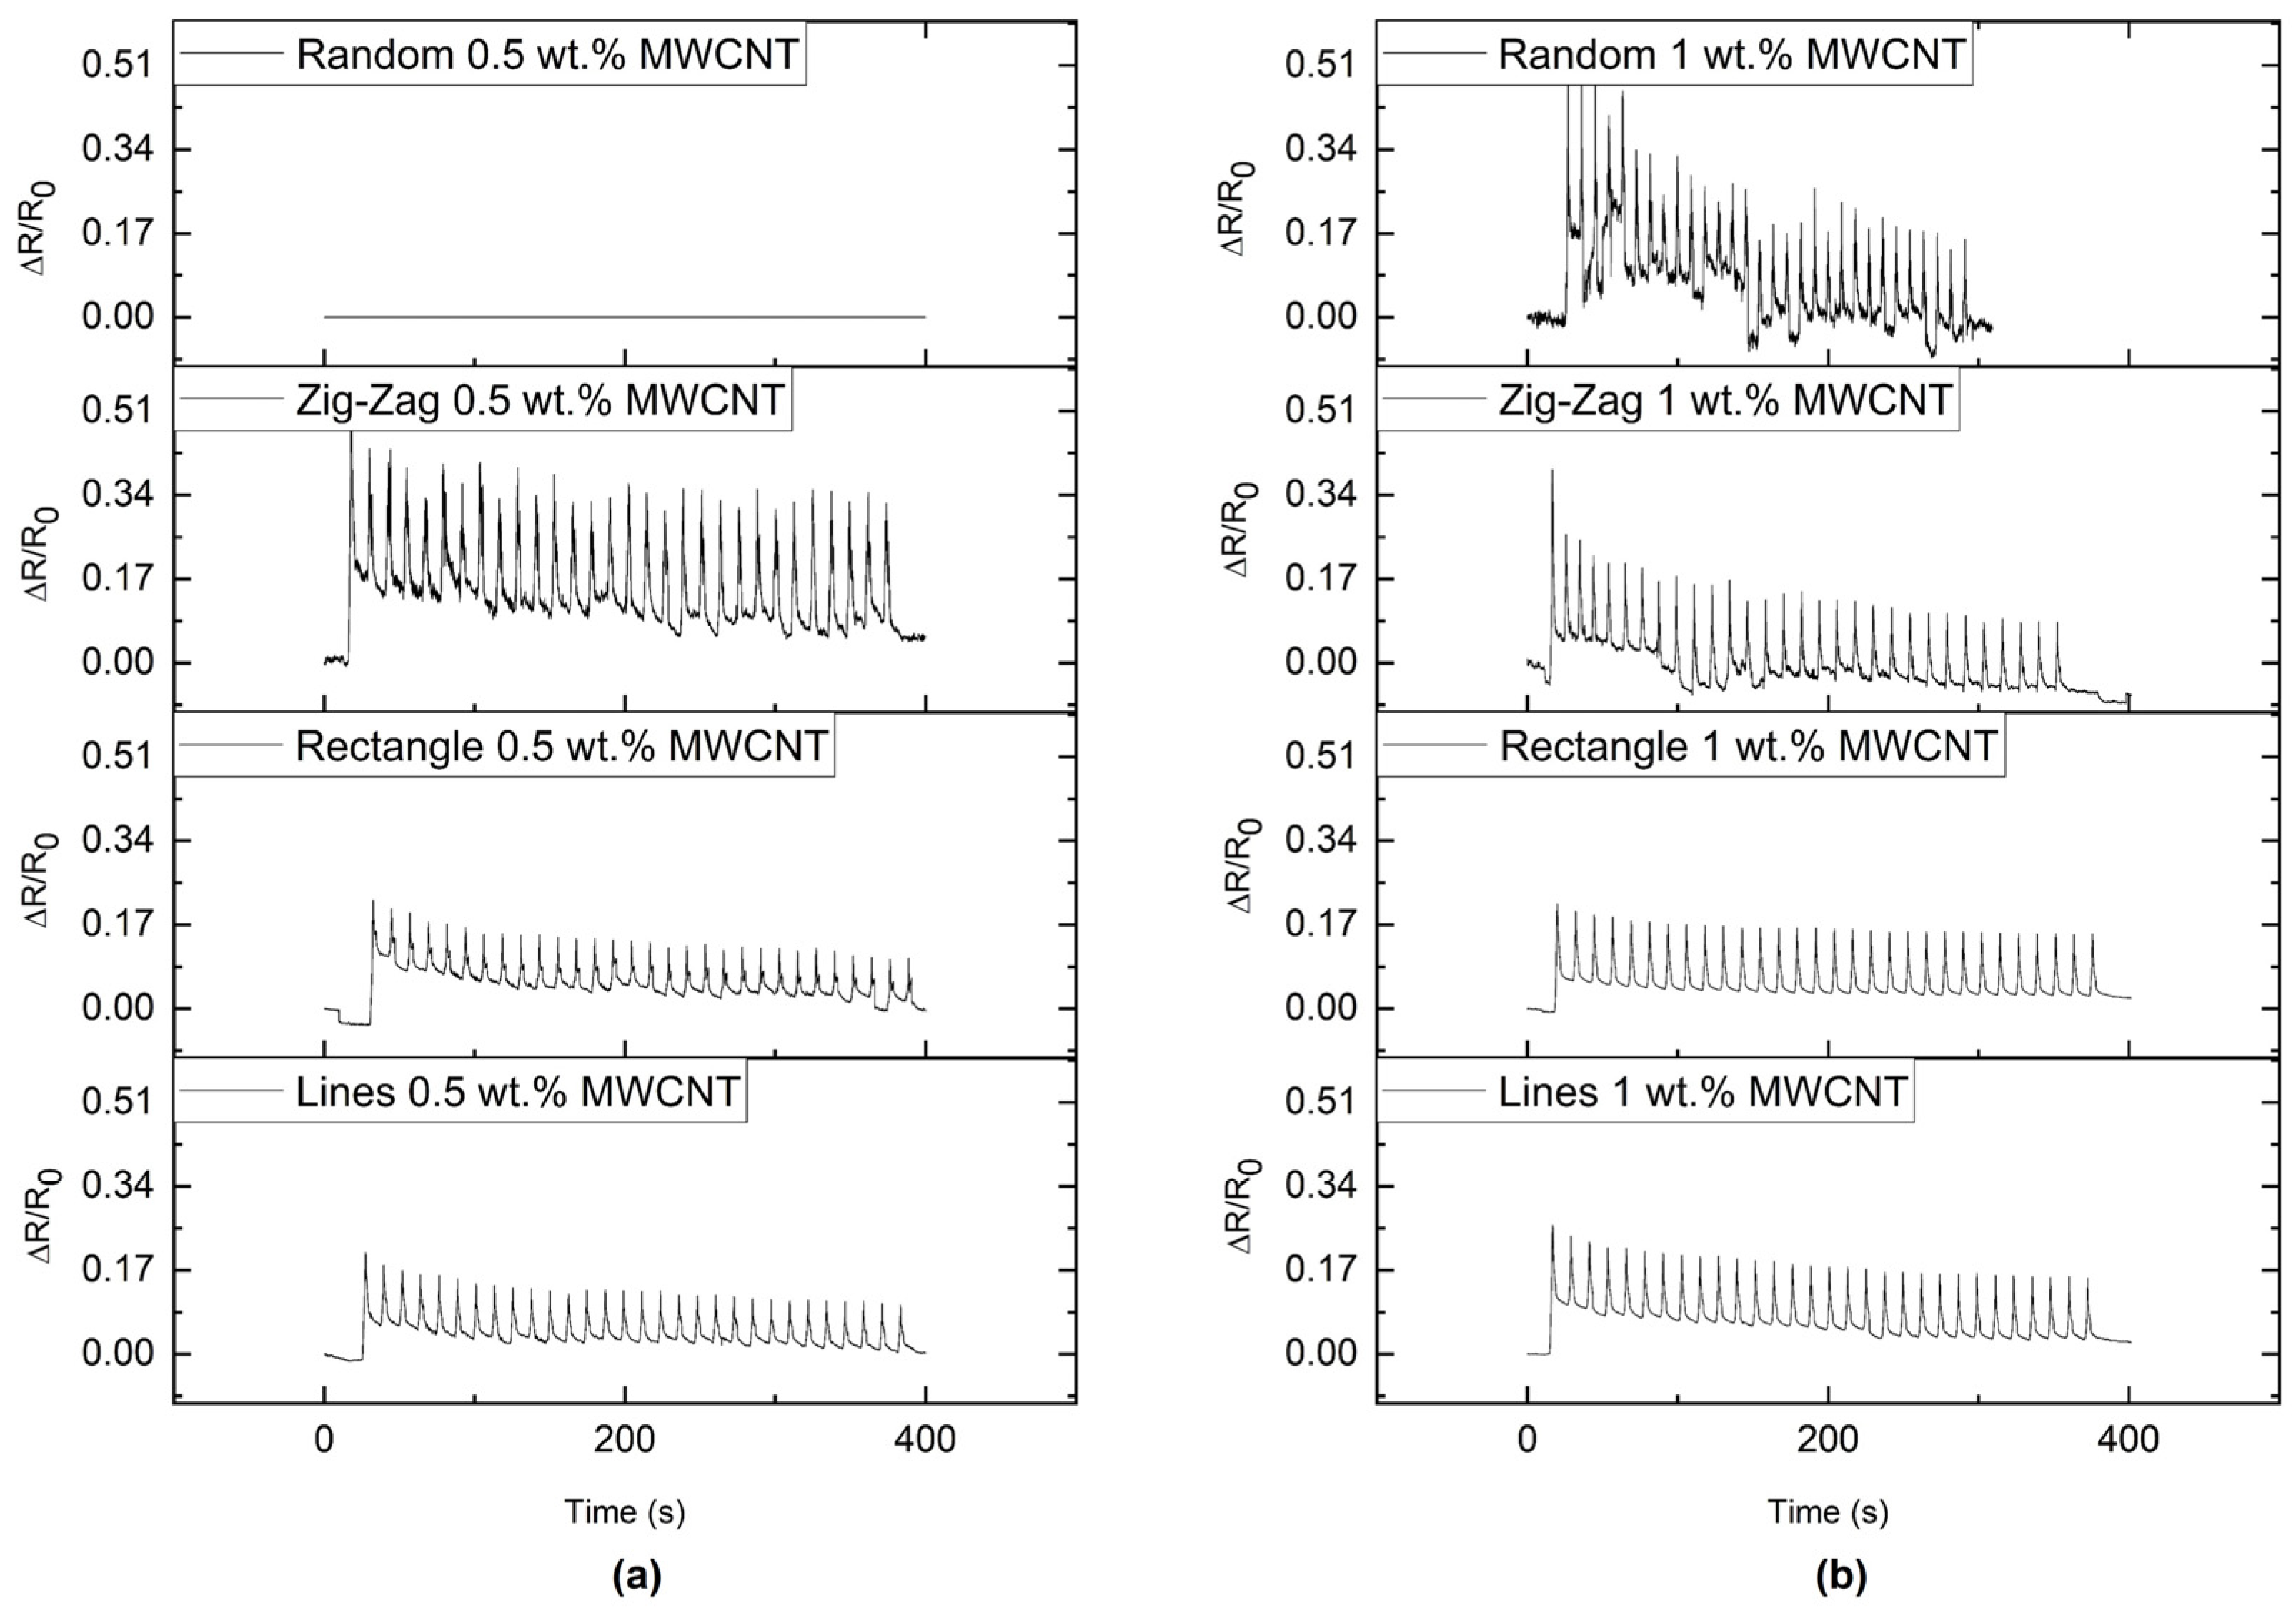
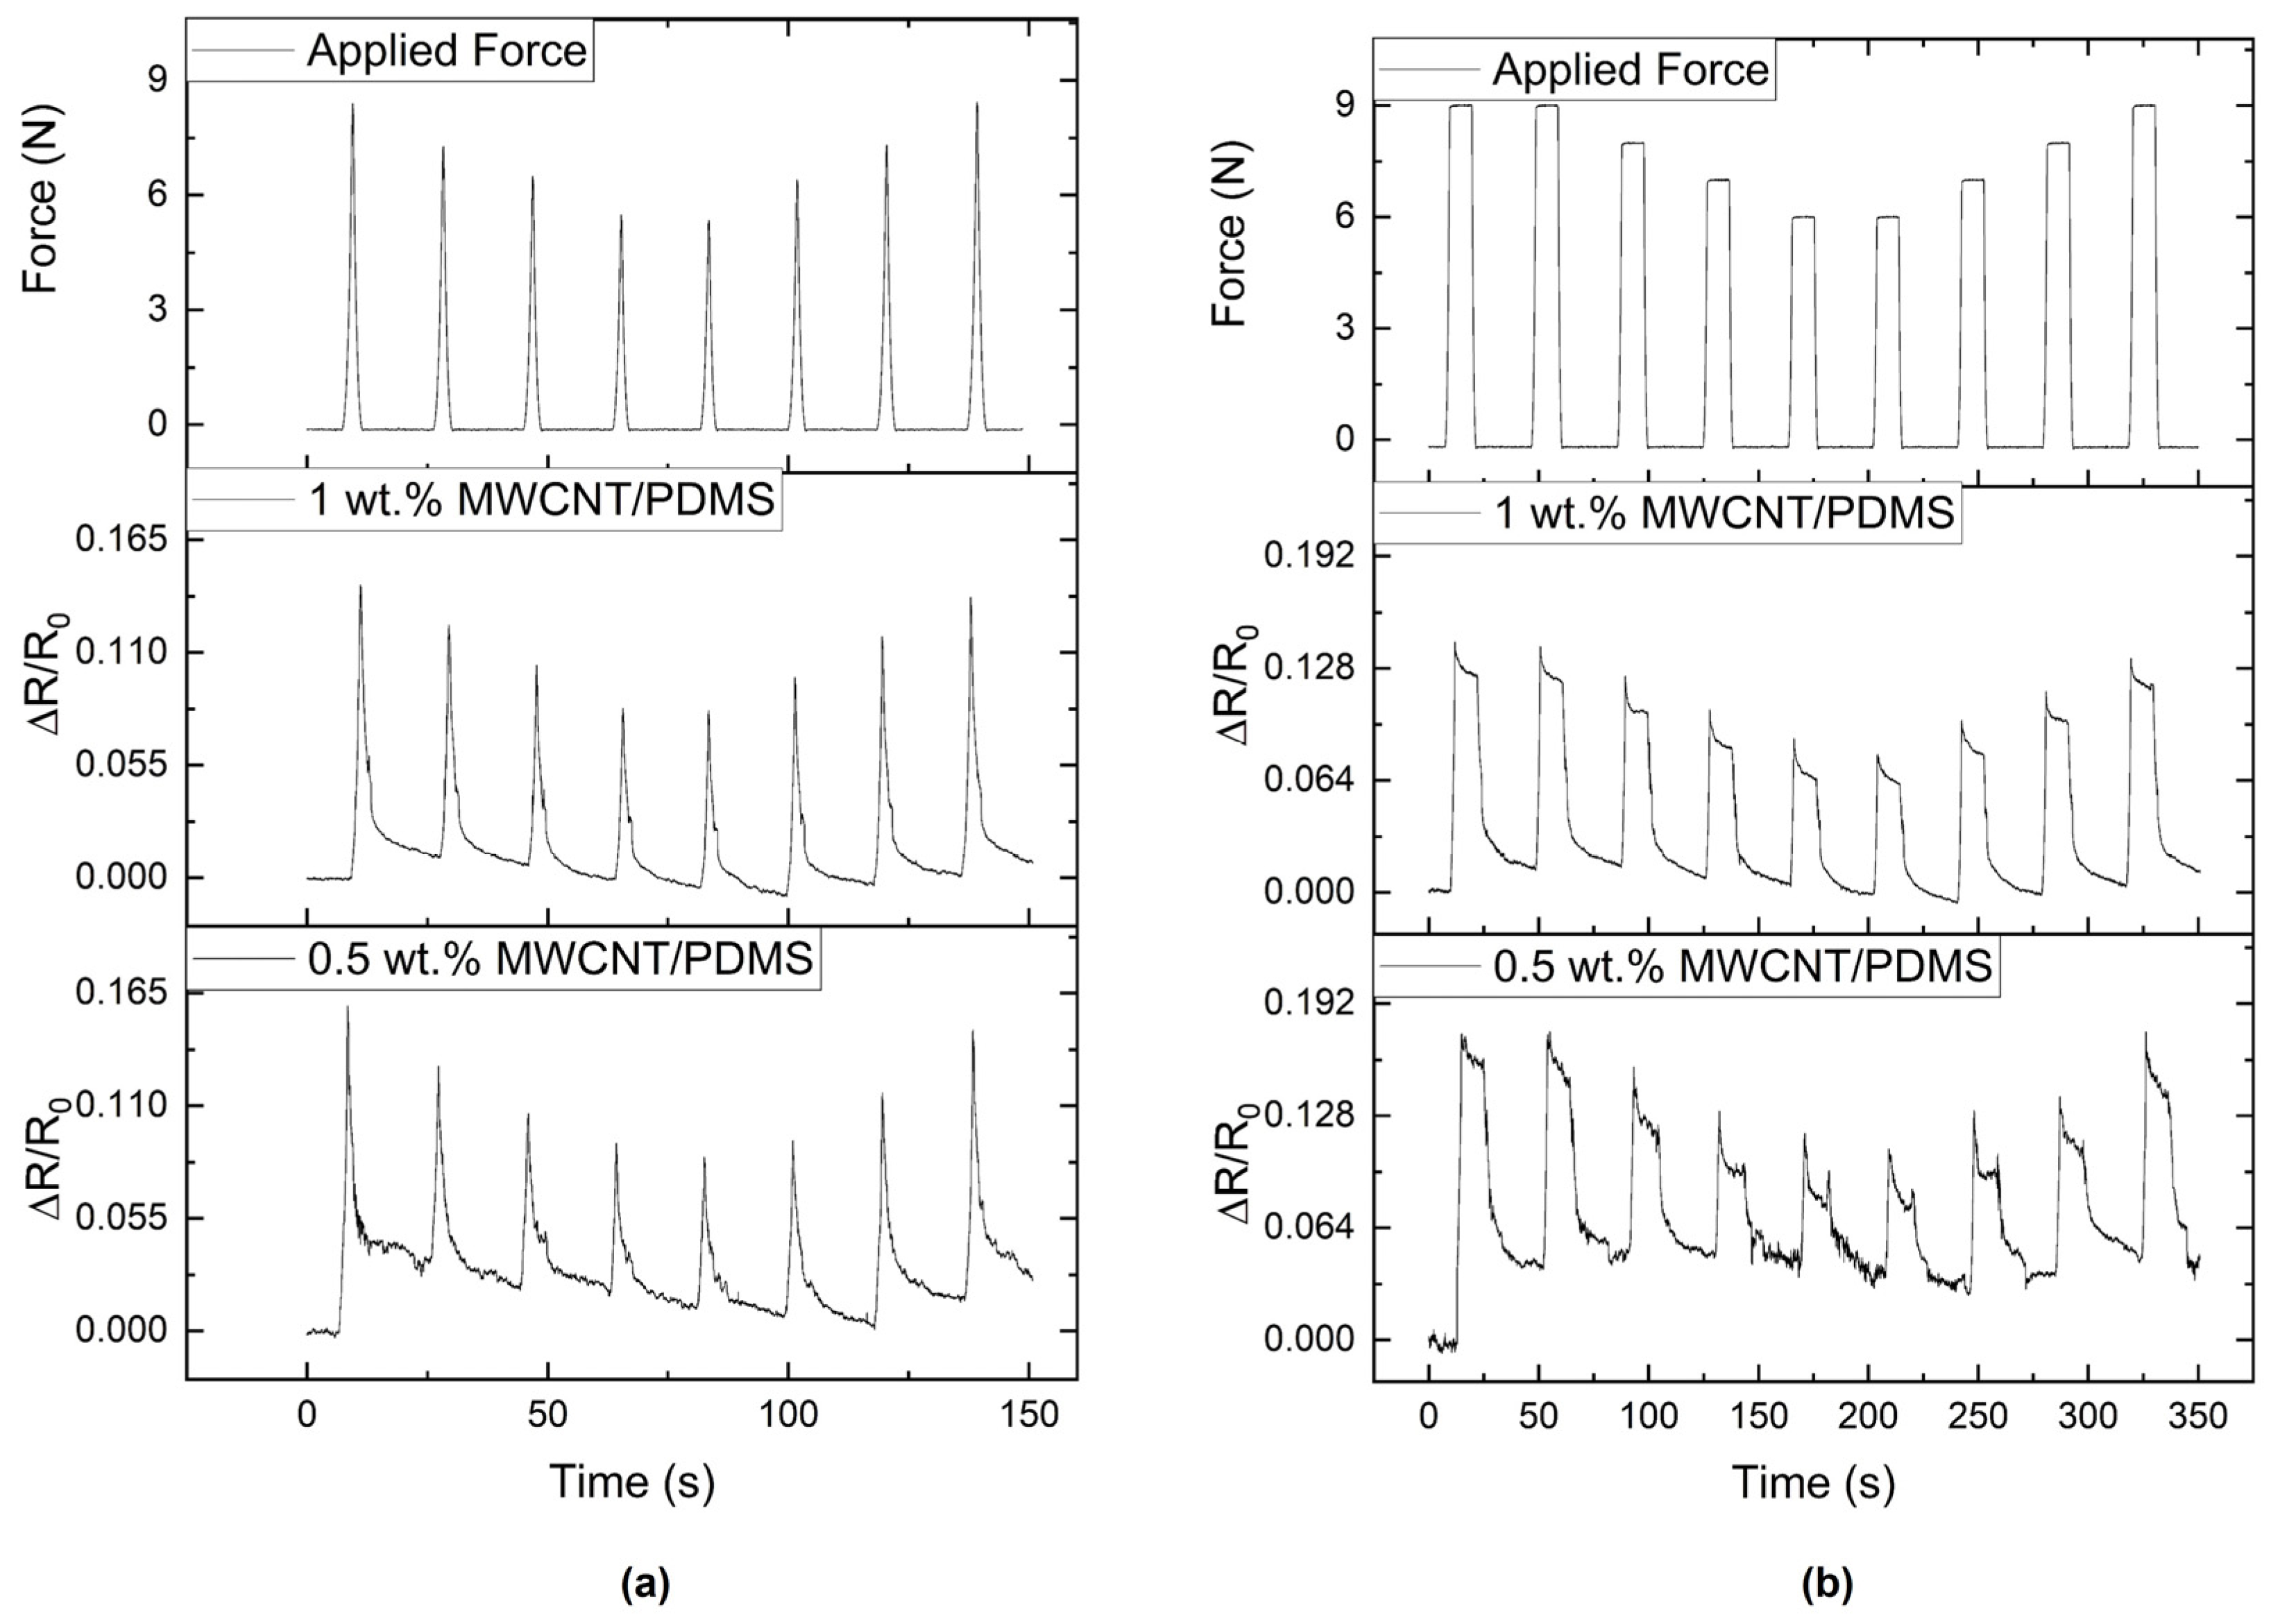
3.4. Low Electrical Percolation Threshold Piezoresistive Sensors

The piezoresistive effect can be used to detect different stimuli. When compression, tension, or bending is applied to these flexible sensors, the location and morphology of the fillers in the sensors change, causing a change in electrical resistance. The magnitude of the piezoresistive effect and the electrical properties vary depending on the filler’s dimensions, content, and morphology [18]. The resistance change rate for the piezoresistive sensors is defined in Equation (2):
ΔR/R0 = (R − R0)/R0
where R is the measured electrical resistance and R0 is its initial resistance before the application of force [25].
All the samples were tested during 30 cycles of 3-point bending to evaluate the piezoresistive effect,. The piezoresistive effect was measured for 0.5 and 1 wt.% concentrations of MWCNTs, all the magnetic patterns, and random distribution nanocomposites. Figure 12 shows that the nanocomposites with a random distribution for 0.5 wt.% of MWCNTs did not present a piezoresistive response due to their high electrical resistance. Conversely, all the nanocomposites prepared with magnetic patterning presented a piezoresistive response. It was observed that, for an MWCNT concentration of 1 wt.%, the random distribution provides a more unstable response than the magnetically patterned nanocomposites. After analysis of the piezoelectric response obtained for all the magnetically-induced patterns, the parallel line pattern was selected for dynamic tests.
As shown in Figure 13, both concentrations are adequate to develop piezoresistive sensors and offer good stability under the application of decreasing and increasing forces. The nanocomposites respond when the force is applied instantaneously, as well as when it is maintained for 10 s before release. The samples show good stability since the electrical resistance is similar during the application of decreasing and increasing force. In the future, a deeper analysis of the sensor performance can be carried out, including the evaluation of the use of pre-strain since the first deformation appears to have a different response compared to the deformations that follow.

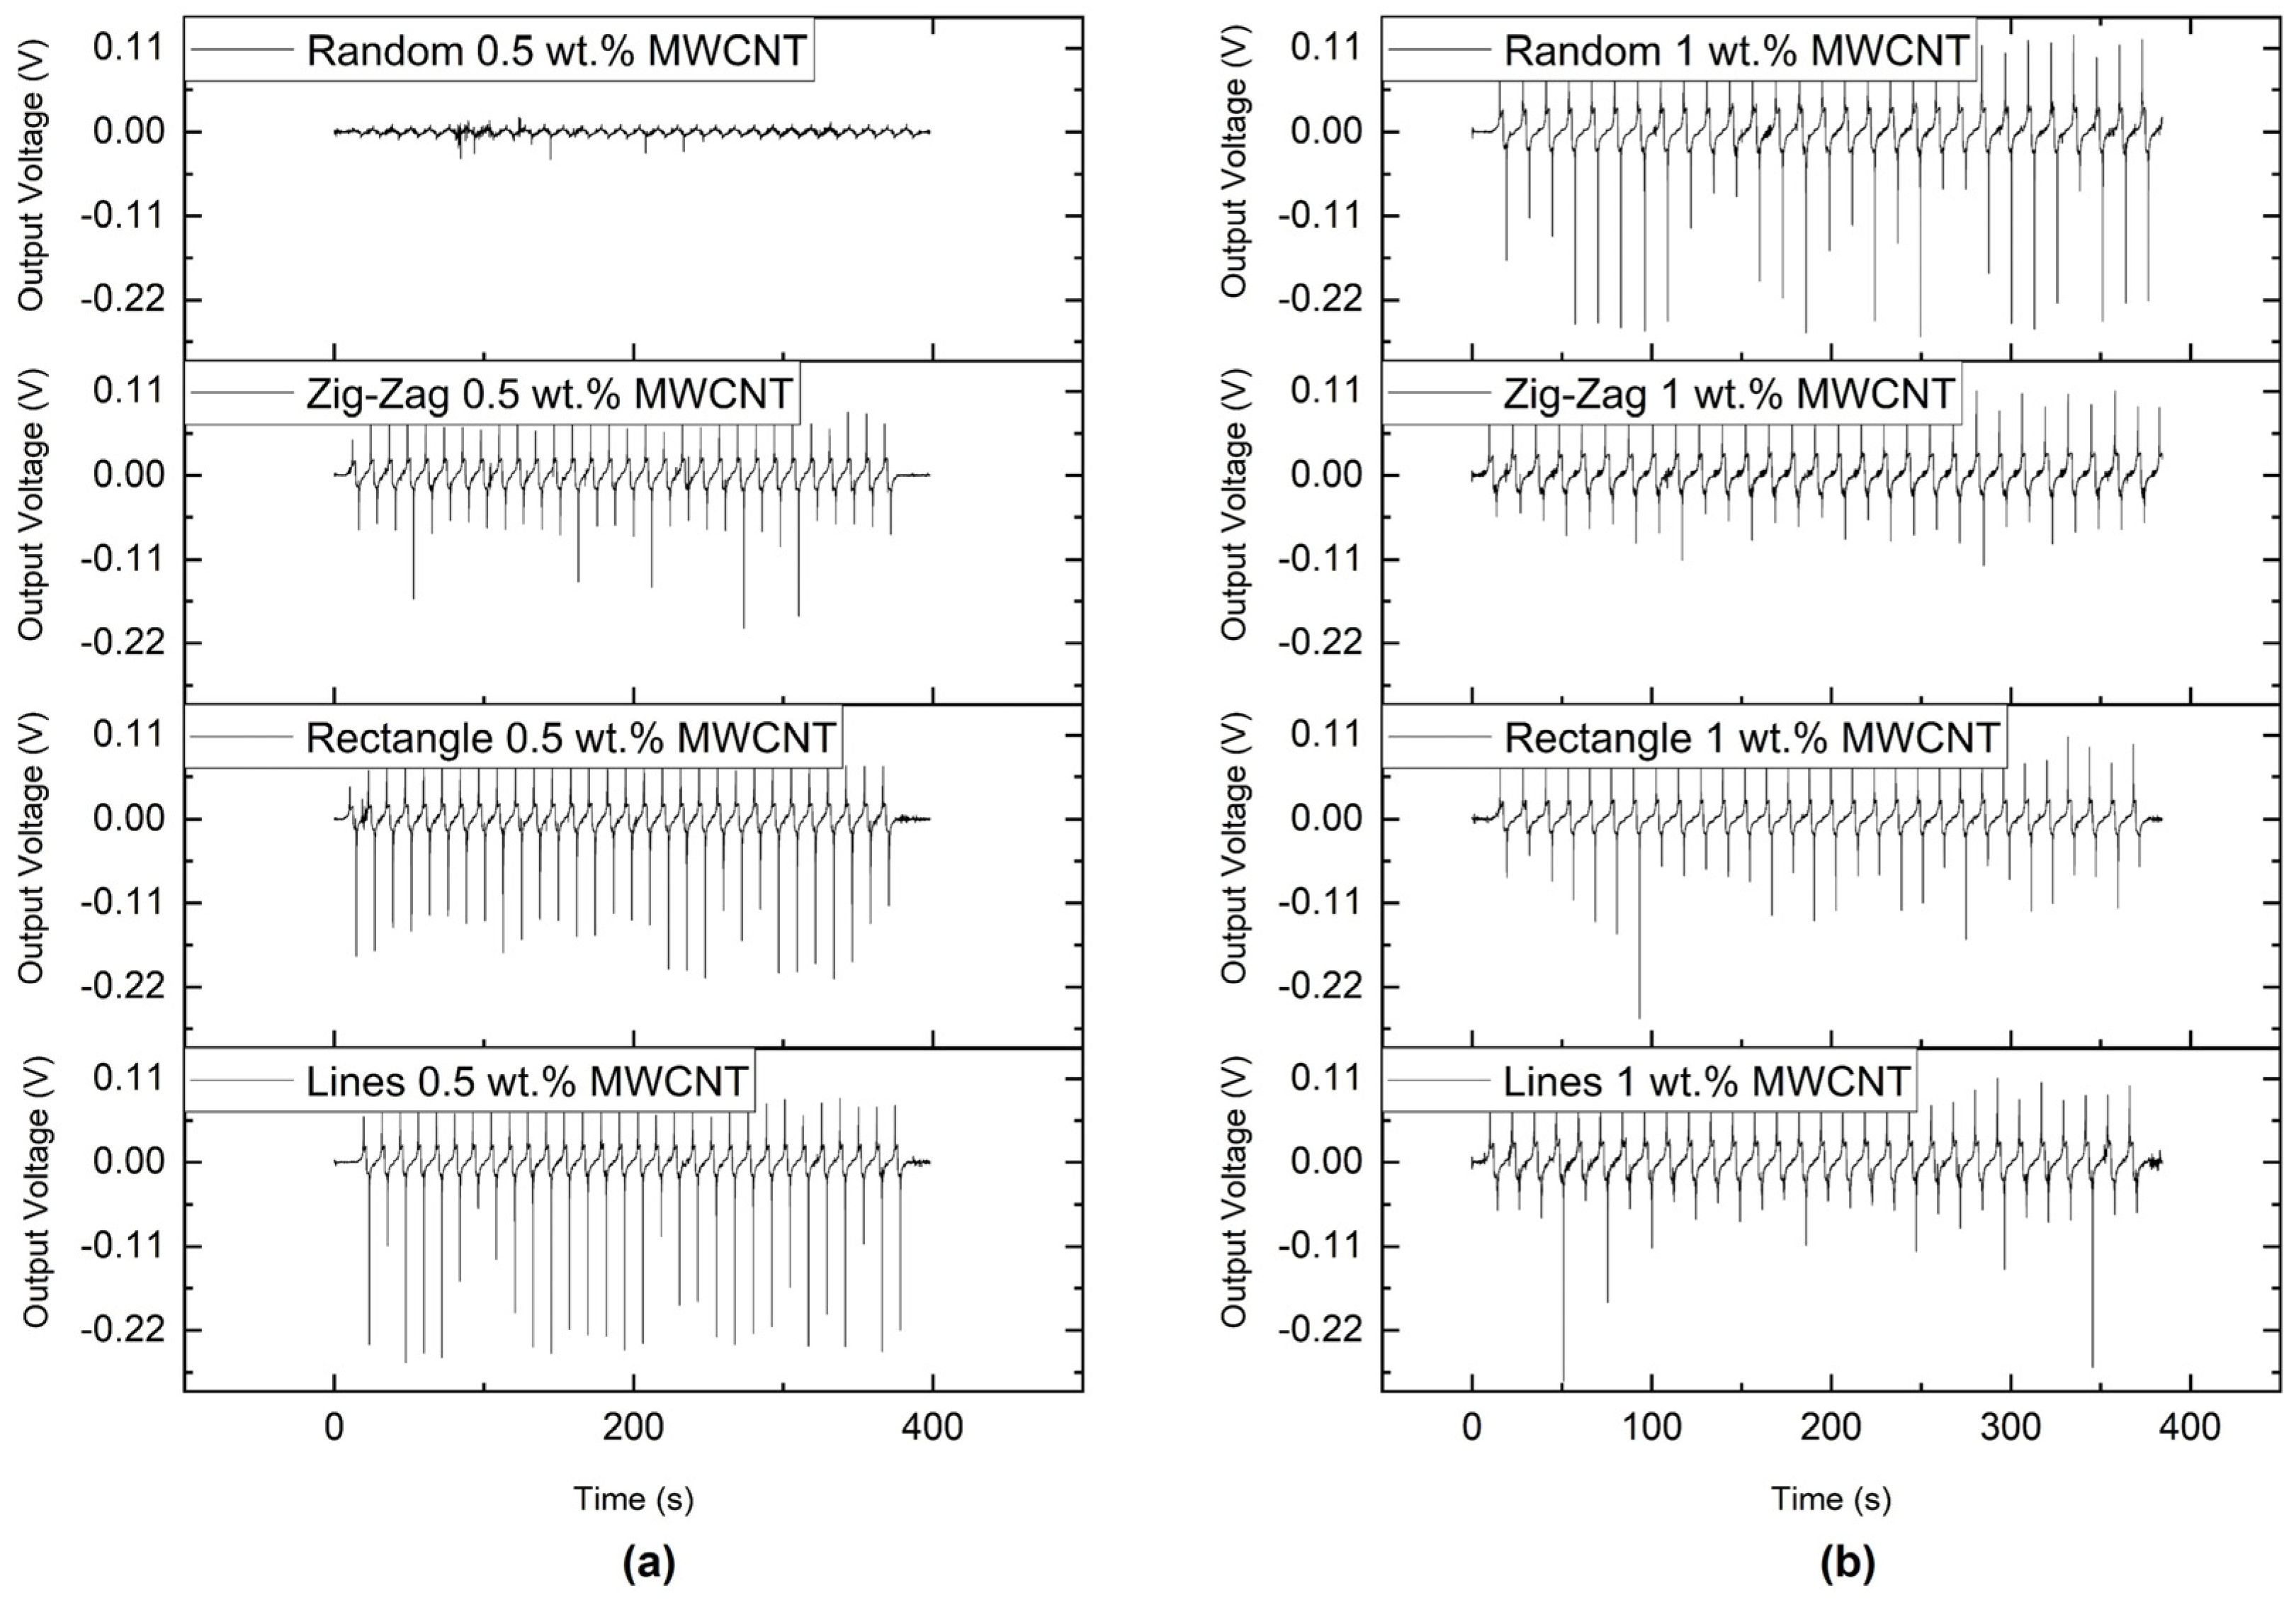
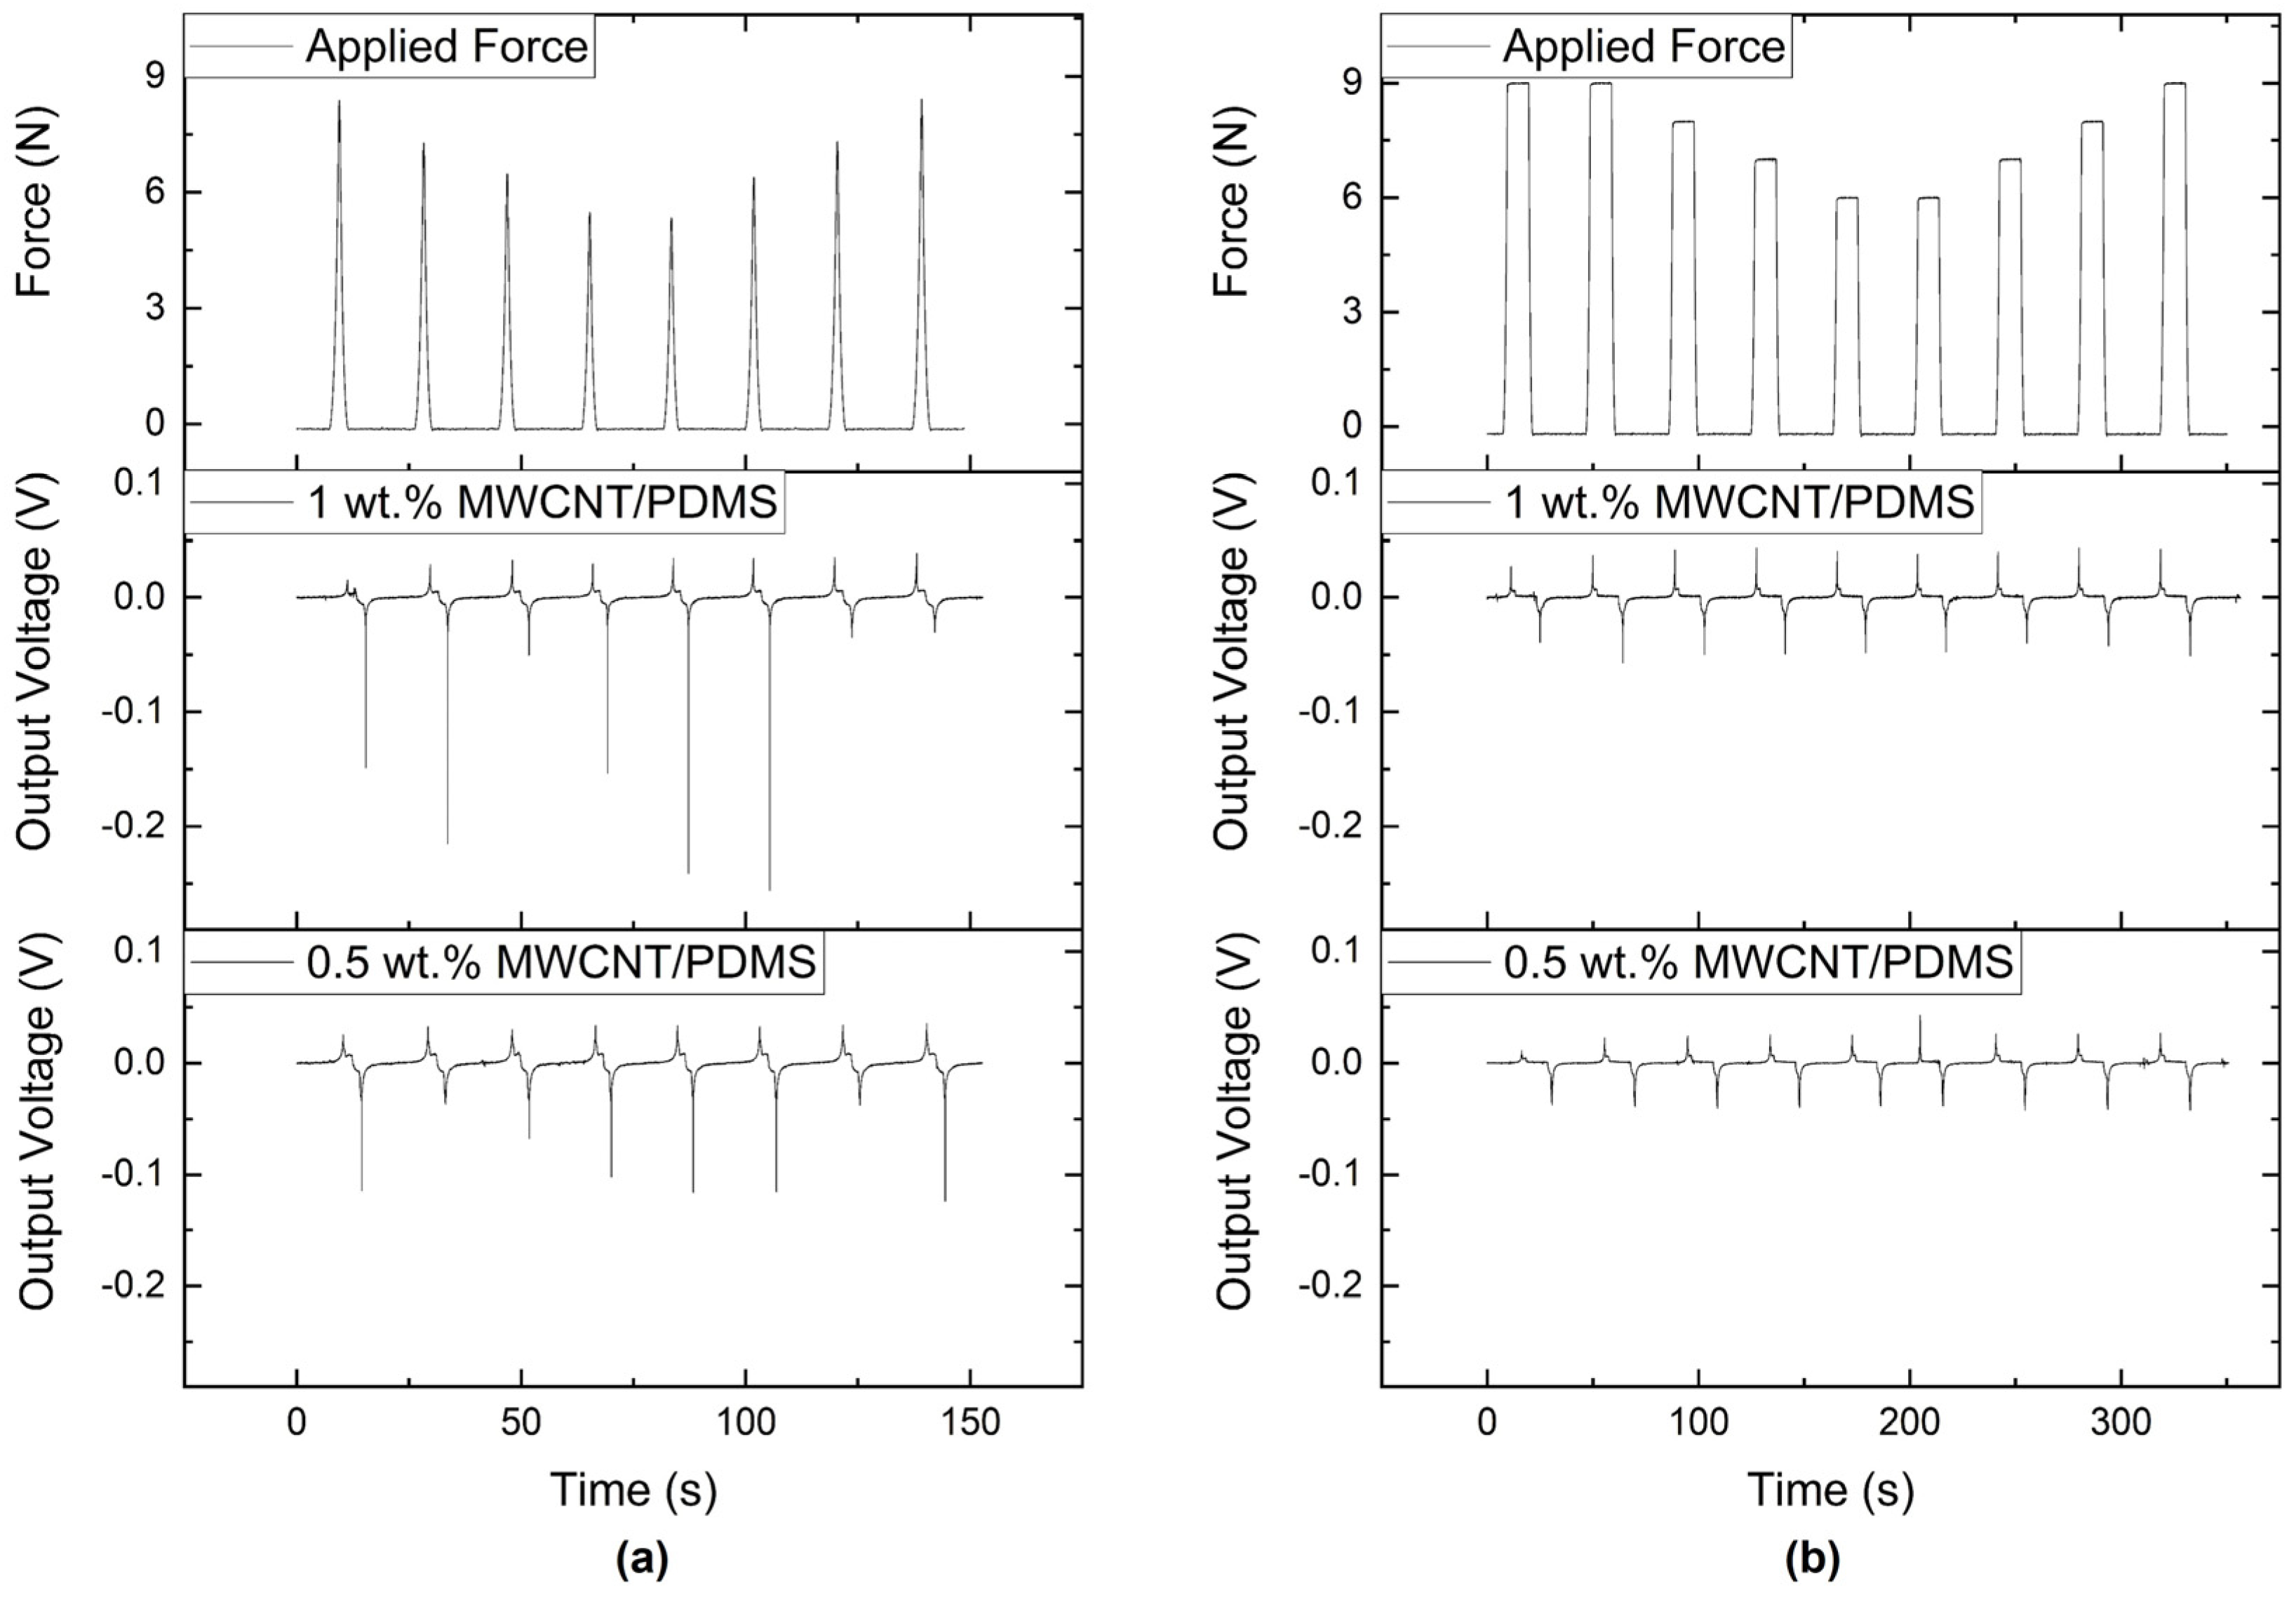
3.5. Low Electrical Percolation Threshold Triboelectric Sensors

The triboelectric effect is a combination of contact electrification and electrostatic induction; the static polarised charges, resulting from the contact between the two friction surfaces with different charge affinities, are generated on the friction surfaces, causing different surface potentials, inducing charges among the two attached electrodes [26,27,28]. In this specific case, the PDMS nanocomposites present a high triboelectric charge density. When the mechanical testing equipment touches the surface of the PDMS, the flow of electrons generates a measurable electrical voltage. The same happens at release, but the output voltage measured has an opposite sign since the electrons are leaving the surface of the PDMS [29]. When the materials are in contact, the output voltage is zero since there is no significant exchange of electrons between the materials. Therefore, triboelectric sensors help detect instantaneous contact and release. Even for applied forces lower than 6 N, a generated output voltage may be detected, indicating that these sensors have a fast response and are relatively sensitive. Figure 14 shows that all the nanocomposites generate output voltage under contact and release. The signal is low for the random distribution nanocomposite with 0.5 wt.% due to the low electrical conductivity across the sample. The magnetic-patterned nanocomposites and the randomly-distributed nanocomposite with 1 wt.% MWCNT, which have lower electrical resistance, generate a considerable output voltage that may be used to detect instantaneous impact and release.
When analysing the triboelectric response of the nanocomposite produced with a magnetic pattern of parallel lines, represented in Figure 15, it is observed that the contact and release are detected within different applied force ranges. When the applied force is maintained for 10 s, the output voltage is zero due to the lack of interaction between the two surfaces; however, the output voltage is visible at the moment of release.
The piezoresistive sensors detect the moment the force is applied to the material, as shown in Figure 16; however, it does not detect the touch if the sensor contacts a surface without deforming the sensor. The triboelectric effect, however, can detect contact without bending the sensor. Therefore, the two sensor types can complement each other by having a high sensitivity to touch due to the triboelectric properties and stable monitoring of the applied force or deformation due to the piezoresistive properties.
Figure 16 shows in detail the difference between the response of the sensors for fast (Figure 16a) and slow movements (Figure 16b). When analysing the presented results, it is possible to confirm that the triboelectric sensors work well to detect the contact and release of objects on the sensor’s surface, independently of the time frame and applied force. The piezoresistive effect works better for monitoring the deformation of the sensor, being capable of monitoring both fast and slow deformations.

4. Discussion

This work reports a new low-cost fabrication technique for developing low electrical percolation threshold sensors based on magnetically oriented MWCNT/PDMS nanocomposites. Compared with randomly distributed MWCNT composites, these sensors originate electrodes with low electrical resistance, suitable for developing flexible piezoresistive and triboelectric sensors.
The MWCNTs were observed to present a magnetic response due to impurities remaining from their fabrication process. SEM/EDS analysis detected the presence of aluminium and iron. SQUID analysis confirmed the ferroelectric properties of the MWCNT powder. The magnetic response of the MWCNTs was used to control their localisation inside a polymer matrix, PDMS, using magnetic fields. The use of magnetic fields to localise the MWCNTs decreased the electrical percolation threshold compared to the nanocomposites prepared with a random distribution of the MWCNTs, thus reducing the concentration of conductive nanomaterial necessary while creating patterned electrodes that can be used for the fabrication of flexible sensors.
The different interactions between permanent magnets were simulated and tested in the lab, showing that the use of an alternating polarity configuration allowed the fabrication of continuous conductive lines of MWCNTs. Finally, nanocomposites with three different electrode designs were simulated and fabricated. Although all designs produced electrodes with an adequate response, the pattern obtained with parallel lines was produced and tested for piezoelectric and triboelectric properties. The nanocomposites were tested under bending forces between 6 and 9 N, showing a stable response under fast and slow deformation. The developed sensors proved to be stable for touch detection and deformation under the range of forces.
Future work can include the scale-up of this fabrication technique and its extension using different polymer matrices. A detailed analysis of the stability of the sensors and their application as multi-sensors will be carried out. The fabrication process presented may be used in the near future to develop sensors for soft robotics applications. It may be applied to monitor large and unconventional areas; it can be adapted to different moulds and polymer matrices since it is an adaptable, low-cost solution that does not require expensive equipment or materials.

Author Contributions

Conceptualization, D.S.E. and N.D.; methodology, D.S.E., E.W.S., R.P. and A.M.; software, D.S.E.; validation, D.S.E., E.W.S. and N.D.; formal analysis, D.S.E.; investigation, D.S.E. and E.W.S.; resources, N.D. and E.W.S.; writing—original draft preparation, D.S.E.; writing—review and editing, D.S.E., E.W.S., M.C.P. and N.D.; supervision, E.W.S., M.C.P. and N.D.; project administration, E.W.S. and N.D. All authors have read and agreed to the published version of the manuscript.

Funding

This research received no external funding.

Institutional Review Board Statement

Not applicable.

Informed Consent Statement

Not applicable.

Acknowledgments

This research is part of the PhD project at the Doctoral Program in Advanced Materials and Processing—FEUP. We would like to thank CeNTI for providing resources (labs, equipment and consumables) to perform the fabrication and characterisation of the samples. The authors thank CEMUP for expert assistance (Rui Rocha) with SEM-EDS. IPC acknowledges the support of FCT through National Funds References UIDB/05256/2020 and UIDP/05256/2020.

Conflicts of Interest

The authors declare no conflict of interest.

References

  1. Liu, H.; Thostenson, E.T. 6.11 Conductive Nanocomposites for Multifunctional Sensing Applications; Elsevier: Amsterdam, The Netherlands, 2018; pp. 315–351. [Google Scholar]
  2. Kausar, A.; Taherian, R. Effect of External Fields on Electrical Conductivity of Polymer-Based Composites. Electr. Conduct. Polym. Compos. Exp. Model. Appl. 2018, 275–295. [Google Scholar] [CrossRef]
  3. Xie, X.-L.; Mai, Y.-W.; Zhou, X.-P. Dispersion and alignment of carbon nanotubes in polymer matrix: A review. Mater. Sci. Eng. R. Rep. 2005, 49, 89–112. [Google Scholar] [CrossRef]
  4. Shrivastava, N.K.; Khatua, B.B. Development of electrical conductivity with minimum possible percolation threshold in multi-wall carbon nanotube/polystyrene composites. Carbon N. Y. 2011, 49, 4571–4579. [Google Scholar] [CrossRef]
  5. Salehiyan, R.; Ray, S.S. Tuning the Conductivity of Nanocomposites through Nanoparticle Migration and Interface Crossing in Immiscible Polymer Blends: A Review on Fundamental Understanding. Macromol. Mater. Eng. 2018, 304, 1800431. [Google Scholar] [CrossRef]
  6. McNally, T.; Pötschke, P.; Halley, P.; Murphy, M.; Martin, D.; Bell, S.E.; Brennan, G.P.; Bein, D.; Lemoine, P.; Quinn, J.P. Polyethylene multiwalled carbon nanotube composites. Polymer 2005, 46, 8222–8232. [Google Scholar] [CrossRef]
  7. Rudnev, V.I. Systematic analysis of induction coil failures. Heat Treat. Prog. 2006, 19, 21–26. [Google Scholar]
  8. Ariu, G.; Hamerton, I.; Ivanov, D. Positioning and aligning CNTs by external magnetic field to assist localised epoxy cure. Open Phys. 2016, 14, 508–516. [Google Scholar] [CrossRef] [Green Version]
  9. Fujiwara, M.; Oki, E.; Hamada, M.; Tanimoto, Y.; Mukouda, I.; Shimomura, Y. Magnetic Orientation and Magnetic Properties of a Single Carbon Nanotube. J. Phys. Chem. A 2001, 105, 4383–4386. [Google Scholar] [CrossRef]
  10. Ma, Y.; O Lehtinen, P.; Foster, A.S.; Nieminen, R.M. Magnetic properties of vacancies in graphene and single-walled carbon nanotubes. New J. Phys. 2004, 6, 68. [Google Scholar] [CrossRef]
  11. Lipert, K.; Ritschel, M.; Leonhardt, A.; Krupskaya, Y.; Büchner, B.; Klingeler, R. Magnetic properties of carbon nanotubes with and without catalyst. J. Physics Conf. Ser. 2010, 200, 72061. [Google Scholar] [CrossRef]
  12. Fu, X.; Ramos, M.; Al-Jumaily, A.M.; Meshkinzar, A.; Huang, X. Stretchable strain sensor facilely fabricated based on multi-wall carbon nanotube composites with excellent performance. J. Mater. Sci. 2018, 54, 2170–2180. [Google Scholar] [CrossRef]
  13. Zhao, Z.; Wu, C.; Zhou, Q. A Self-Powered Basketball Training Sensor Based on Triboelectric Nanogenerator. Appl. Sci. 2021, 11, 3506. [Google Scholar] [CrossRef]
  14. Rasel, M.S.; O Cho, H.; Kim, J.W.; Park, J.Y. A self-powered triboelectric sensor for wide-range pressure detection in wearable application. J. Phys. Conf. Ser. 2018, 1052, 012029. [Google Scholar] [CrossRef]
  15. Liu, P.; Sun, N.; Mi, Y.; Luo, X.; Dong, X.; Cai, J.; Jia, X.; Ramos, M.A.; Hu, T.S.; Xu, Q. Ultra-low CNTs filled high-performance fast self-healing triboelectric nanogenerators for wearable electronics. Compos. Sci. Technol. 2021, 208, 108733. [Google Scholar] [CrossRef]
  16. Yoon, S.G.; Chang, S.T. Microfluidic capacitive sensors with ionic liquid electrodes and CNT/PDMS nanocomposites for simultaneous sensing of pressure and temperature. J. Mater. Chem. C 2017, 5, 1910–1919. [Google Scholar] [CrossRef]
  17. Kwon, M.; Hong, Y. Flexible temperature sensor array of PDMS-encapsulated conductive CNT thin films fabricated by solution process. In Proceedings of the 2009 International Semiconductor Device Research Symposium, College Park, MD, USA, 9–11 December 2009; pp. 1–2. [Google Scholar]
  18. Jang, S.-H.; Park, Y.-L. Carbon nanotube-reinforced smart composites for sensing freezing temperature and deicing by self-heating. Nanomater. Nanotechnol. 2018, 8, 1847980418776473. [Google Scholar] [CrossRef] [Green Version]
  19. Souri, H.; Banerjee, H.; Jusufi, A.; Radacsi, N.; Stokes, A.A.; Park, I.; Sitti, M.; Amjadi, M. Wearable and stretchable strain sensors: Materials, sensing mechanisms, and applications. Adv. Intell. Syst. 2020, 2, 2000039. [Google Scholar] [CrossRef]
  20. Paiva, M.C.; Simon, F.; Novais, R.M.; Ferreira, T.; Proença, M.F.; Xu, W.; Besenbacher, F. Controlled Functionalization of Carbon Nanotubes by a Solvent-free Multicomponent Approach. ACS Nano 2010, 4, 7379–7386. [Google Scholar] [CrossRef] [PubMed]
  21. Ellis, A.; Ingham, B. Magnetic properties of multiwalled carbon nanotubes as a function of acid treatment. J. Magn. Magn. Mater. 2005, 302, 378–381. [Google Scholar] [CrossRef]
  22. Zoladz, F.; Rhodes, S.; Patterson, D.; Cribb, W.; Chapagain, P.; Seifu, D.; Taufour, V.; Kamali, S.; Neupane, S. Enhanced magnetic properties of aluminum oxide nanopowder reinforced with carbon nanotubes. J. Nanoparticle Res. 2020, 22, 157. [Google Scholar] [CrossRef]
  23. Elsi, S.; Pushpanathan, K. Role of Cu and Mn dopants on d0 ferromagnetism of ZnS nanoparticles. J. Mater. Sci. Mater. Electron. 2019, 30, 10792–10807. [Google Scholar] [CrossRef]
  24. Hamidi, S.; Sobhani, A.; Aftabi, A.; Najafi, M. Optical and magneto-optical properties of aligned Ni nanowires embedded in polydimethylsiloxane. J. Magn. Magn. Mater. 2015, 374, 139–143. [Google Scholar] [CrossRef]
  25. Huang, K.; Ning, H.; Hu, N.; Liu, F.; Wu, X.; Wang, S.; Liu, Y.; Zou, R.; Yuan, W.; Wu, L. Ultrasensitive MWCNT/PDMS composite strain sensor fabricated by laser ablation process. Compos. Sci. Technol. 2020, 192, 108105. [Google Scholar] [CrossRef]
  26. Wu, J.; Zheng, Y.; Li, X. Recent Progress in Self-Powered Sensors Based on Triboelectric Nanogenerators. Sensors 2021, 21, 7129. [Google Scholar] [CrossRef]
  27. Kao, F.-C.; Ho, H.-H.; Chiu, P.-Y.; Hsieh, M.-K.; Liao, J.; Lai, P.-L.; Huang, Y.-F.; Dong, M.-Y.; Tsai, T.-T.; Lin, Z.-H. Self-assisted wound healing using piezoelectric and triboelectric nanogenerators. Sci. Technol. Adv. Mater. 2022, 23, 1–16. [Google Scholar] [CrossRef]
  28. Xu, J.; Zou, Y.; Nashalian, A.; Chen, J. Leverage Surface Chemistry for High-Performance Triboelectric Nanogenerators. Front. Chem. 2020, 8, 577327. [Google Scholar] [CrossRef] [PubMed]
  29. Hwang, H.; Lee, K.Y.; Shin, D.; Shin, J.; Kim, S.; Choi, W. Metal-free, flexible triboelectric generator based on MWCNT mesh film and PDMS layers. Appl. Surf. Sci. 2018, 442, 693–699. [Google Scholar] [CrossRef]
Figure 1. Overview of the workflow carried out.
Applsci 13 01437 g001
Figure 2. Fabrication process of the composite sensors under magnetic field.
Applsci 13 01437 g002
Figure 3. Bending tests with an applied force of 6.6 N, (a) press and (b) release motion.
Applsci 13 01437 g003
Figure 4. Detection of particles based on aluminium and iron as some of the impurities of the CCVD fabrication process of the MWCNT NC 7000. (a) SEM image and regions where the SEM/EDS was performed. (b) regions with higher amounts of aluminium oxide impurities, and (c) regions with lower impurities.
Applsci 13 01437 g004
Figure 5. Magnetisation curve for the MWCNT (a,b), and 5 wt.% MWCNT/PDMS with random distribution (c,d).
Applsci 13 01437 g005
Figure 6. Electrical resistivity of MWCNT/PDMS nanocomposites prepared with and without magnetic alignment.
Applsci 13 01437 g006
Figure 7. Magnetic pattern in MWCNT/PDMS samples with concentrations of (a) 0.01 and (b) 0.1 wt.% and (c) magnetic flux density profile on the surface of a permanent neodymium magnet, with (d) magnetic flux density in the region of the black line.
Applsci 13 01437 g007
Figure 8. Magnet configuration to create linear and discontinuous patterns, using (a) alternated polarity, (b) Halbach array, and (c) same polarity configurations.
Applsci 13 01437 g008
Figure 9. Magnetic patterns and 3D reconstruction of the samples (a) randomly distributed, (b) magnetic pattern with alternate polarity, (c) magnetic pattern with Halbach array, and (d) magnetic pattern with the same polarity.
Applsci 13 01437 g009
Figure 10. Magnetic patterns in Ansys Maxwell and magnetic patterns of MWCNT/PDMS achieved in the laboratory, (a) Rectangular; (b) Parallel lines; and (c) Zig zag shape.
Applsci 13 01437 g010
Figure 11. Electrical resistivity of the nanocomposites fabricated with different magnetic patterns.
Applsci 13 01437 g011
Figure 12. Piezoresistive effect for samples with (a) 0.5 and (b) 1 wt.% of MWCNTs with different magnetic patterns, from top to bottom: random, zig-zag, rectangular and parallel lines.
Applsci 13 01437 g012
Figure 13. Piezoresistive effect for the sample with the parallel lines pattern with 0.5 and 1 wt.% of MWCNT/PDMS. (a) unloading-loading peaks, (b) unloading-loading delayed peaks.
Applsci 13 01437 g013
Figure 14. Triboelectric effect for nanocomposites with (a) 0.5 and (b) 1 wt.% of MWCNT with random distribution and with different magnetic patterns (zig-zag, rectangle, and parallel lines).
Applsci 13 01437 g014
Figure 15. Triboelectric effect obtained for the nanocomposites prepared with the parallel line magnetic pattern with 0.5 and 1 wt.% of MWCNT; (a) unloading-loading peaks, (b) unloading-loading delayed peaks. The top images represent the applied force by the testing machine.
Applsci 13 01437 g015
Figure 16. Piezoresistive and triboelectric effects under a deformation force for the nanocomposite prepared with the parallel lines magnetic pattern. (a) 0.5 wt%. of MWCNT/PDMS under a peak force of 6.6 N (b) 1 wt%. Of MWCNT/PDMS sample under a force of 8.1 N for 10 s.
Applsci 13 01437 g016
Disclaimer/Publisher’s Note: The statements, opinions and data contained in all publications are solely those of the individual author(s) and contributor(s) and not of MDPI and/or the editor(s). MDPI and/or the editor(s) disclaim responsibility for any injury to people or property resulting from any ideas, methods, instructions or products referred to in the content.

