Abstract
To evaluate the reservoir characteristics of siliceous shale in the Dalong Formation within the late Permian intra-platform rift trough in Western Hubei (China), we studied a drill core from well ED-2 in Western Hubei. To analyze the physical characteristics, pore structure, methane adsorption performance, and their influences on the siliceous shale reservoir, we performed X-ray diffraction, total organic carbon (TOC) content, vitrinite reflectance (Ro, indicating thermal evolution), total porosity and permeability, field emission scanning electron microscopy, CO2 and N2 physical adsorption, and methane isothermal adsorption analyses, among others. Our results show that the Dalong Formation in Western Hubei is an organic-rich (2.6–14.3 wt.%), highly thermally evolved (Ro = 2.59–2.76%), siliceous shale containing mainly type-I and type-II1 organic matter. The Dalong siliceous shale has low porosity and permeability and belongs to a larger reservoir with low horizontal permeability (0.002–335.209 mD) and porosity (1.2–7.8%). Pores in the shale are mainly organic, inorganic, and microfractures; the organic pores are very developed. The pore volume and specific surface area of the shale are mainly due to micropores and mesopores and are positively correlated with TOC and clay mineral contents and weakly negatively correlated with quartz and carbonate contents. The micropores and mesopores are well developed, improving the methane adsorption capacity, which, in turn, is strongly positively correlated with TOC content. Comprehensive analysis shows that the high organic matter content of the Dalong siliceous shale has the greatest influence on its pore structure; the many organic pores generated after hydrocarbon generation have controlled the development of micropores and mesopores, which is conducive to the adsorption and storage of shale gas. The development of brittle minerals resistant to compaction, such as siliceous minerals, helps preserve organic pores. This study is informative for basin-scale petroleum system investigations, which are essential for understanding oil and gas exploration possibilities and regional petroleum systems.
1. Introduction
In recent years, significant research into the lower Silurian Longmaxi Formation shales in the Sichuan Basin and its periphery in China has facilitated breakthroughs in commercial shale gas development [1,2,3,4,5,6,7,8]. Numerous studies showed that clarifying the characteristics of shale oil and gas reservoirs and identifying factors controlling the development of high-quality reservoirs are necessary to identify shale oil and gas ‘sweet spots’ accurately [9].
The Permian interval is important for shale oil and gas exploration in South China. However, the exploration and development of Permian shale gas are still at the preliminary stage, and our understanding of its shale gas reservoir characteristics is not advanced [10,11,12]. The latest research indicates that, compared to the shale in the Sichuan Basin, the Dalong Formation shale in Western Hubei has the following particularities detailed below. (1) Whereas the main producing layers of the Longmaxi Formation in the Sichuan Basin are shelf deposits [13,14,15], the dominant layers being explored in the Dalong Formation are in the rifted platform basin facies [16,17]. (2) The total organic carbon (TOC) content of the Longmaxi Formation in the Sichuan Basin is mainly within the range of 0.5-6.0 wt.% [18,19], whereas that of the Dalong Formation in Western Hubei is in the range 2.6–14.3 wt.%, which may impact the formation of organic matter pores. (3) Compared to shale gas resources in the Sichuan Basin (60% of which are buried to >3500 m depth), the Calong shale is shallowly buried (mostly 0–2000 m depth, except in the Lichuan region where it is buried to a 4000 m depth) and widely distributed. The Dalong Formation has undergone a moderate degree of thermal evolution (Ro = 2.6–2.8%) [20], slightly less than the Longmaxi Formation (Ro = 2.3–3.1%) [21].
Exploration efforts have demonstrated Permian rocks in Western Hubei to be good prospects for shale gas exploration [22,23], and shale gas reservoirs have been discovered in many wells there. In 2021, a test of well Hongye 1HF in the Ongxing area of Enshi, Hubei, produced 89,000 m3 of industrial gas flow per day, setting off a boom in Permian shale gas exploration in Western Hubei. Recently, studies on Dalong Formation shale reservoirs in the Western Hubei trough have found these reservoirs to have poor physical properties, with total porosities of less than 3% [24]. Pores are mainly organic pores with parallel plate and ink bottle shapes. Micropores and mesopores are important components of a shale’s pore structure, which is also influenced by the organic matter content and shale lithofacies [25,26]. At present, our understanding of the basic geological characteristics of the organic-rich shale in the Western Hubei Dalong Formation, as well as the characteristics and pore structure of the shale gas reservoir, remains relatively limited. Because gas reservoirs are strongly heterogeneous, research into the factors influencing reservoir development is of great significance for the evaluation and prediction of high-quality reservoirs. Furthermore, such reservoir characterizations are informative for basin-scale petroleum system investigations [27,28,29,30], which are often critical to oil and gas exploration activities and our understanding of regional petroleum systems [30,31].
In this study, we first analyzed the mineral composition and organic geochemical characteristics of siliceous shales of the upper Permian Dalong Formation in the Western Hubei trough. Then, we measured their total porosities and permeabilities, observed the samples under a field-emission scanning electron microscope (FE-SEM), conducted CO2 and N2 adsorption tests to analyze the physical properties of the siliceous shale reservoirs, qualitatively evaluated pore types, morphologies, and sizes of pores, quantitatively characterized pore-structure parameters such as pore volume and specific surface area, and determined the effects of mineral composition and organic matter content on pore development. Finally, we performed isothermal methane adsorption experiments to characterize the adsorption capacity of the shales and identify factors influencing it, aiming to provide a basis for the geological evaluation and exploration of shale gas in the upper Permian Dalong Formation.
Our results on the factors influencing reservoir development can be used to improve the evaluation and prediction of shale reservoirs and, more broadly, inform petroleum systems and exploration science, e.g., [27,28,30]. Future testing of other drill-core samples in the Western Hubei trough and a lateral comparison of the results will benefit the development of shale gas resources in Western Hubei.
2. Geological Setting
The Western Hubei region is in the Western Hunan-Hubei fold belt in the central Yangtze platform of the South China plate. Through numerous orogenies, including the Caledonian, Hercynian, Indosinian, Yanshanian, and Himalayan, this region developed with two sets of basin-controlling faults trending NNE and NW. The basin is actually a residual basin formed by the modification and superposition of several prototype basins [32,33,34,35]. The Western Hubei region is adjacent to the Sichuan Basin in the northwest (with the Qiyueshan fault as its border), the Huangling anticline–Yichang slope belt to the northeast (with the Tianyangping–Jianli fault as its border), and the Jiangnan–Xuefeng overthrust belt to the southeast (with the Cili–Baojing fault as their boundary) [34,36]. It contains four secondary tectonic units: the Lichuan complex syncline, Central complex anticline, Huaguoping complex syncline, and Yidu–Hefeng complex anticline (Figure 1c).
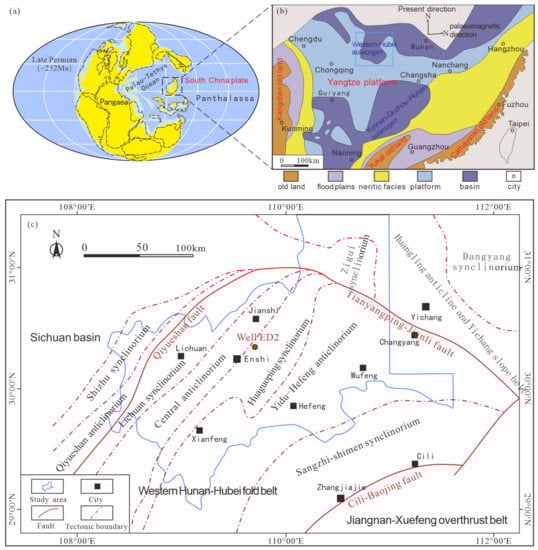
Figure 1.
(a) Global paleogeographic map at the end of the late Permian (modified from [37]), (b) Paleogeography of late Permian lithofacies of the South China plate (modified from [30]), (c) Present-day tectonic map of Western Hubei.
In the Changxing period (late Permian), the South China plate was near the paleo-equator and adjacent to the Paleo-Tethys Ocean in the west and Panthalassa in the east, with numerous small land masses along its periphery and thus exhibiting a multi-island ocean basin framework overall [37] (Figure 1a). Most of the Yangtze region of the South China plate was a carbonate platform, and the Dalong Formation, dominated by deep-water siliceous facies, was distributed on the northern and southern edges of the Yangtze platform [38]. Late Permian strata in Western Hubei were deposited in a secondary rift basin within a platform on the northern edge of the central Yangtze region; this basin was surrounded by the platform on three sides and connected to the vast ocean to the north, with a semi-enclosed sedimentary environment (Figure 1b). Dalong Formation shales are mainly developed in the rift trough, which hosts deep-water deposits, whereas the Changxing Formation limestone is deposited on the platform around the trough [25]. Frequent sea-level fluctuations during the deposition of the Dalong Formation produced siliceous mudstones, carbonaceous mudstones, calcareous mudstones, siliceous rocks, and bioclastic limestones.
In well ED-2 in the Enshi area of Western Hubei, the deposition of the Dalong Formation occurred in a sedimentary rift trough within the platform. There, the Dalong Formation is entirely composed of siliceous shales, and the inter-platform basin facies mainly control the shales’ thicknesses, mineral compositions, and depositional environments [22,39,40,41,42]. From bottom to top, the stratigraphic column of well ED-2 can be subdivided into three intervals based on lithological changes (Figure 2): (1) Bioclastic limestones interlayered with grayish-black siliceous shales, (2) Grayish-black carbonaceous-siliceous shales interlayered with thinly bedded marls and dolostones, (3) Marls interlayered with thinly bedded grayish-black siliceous shales. The well logs show that the mudstone interval has high natural gamma ray (GR) values and low deep (RD) and shallow (RS) lateral resistivities; the limestone interval has low GR values and high RD and RS, and the resistivity of the siliceous mudstone interval in the middle gradually increases from deep to shallow.
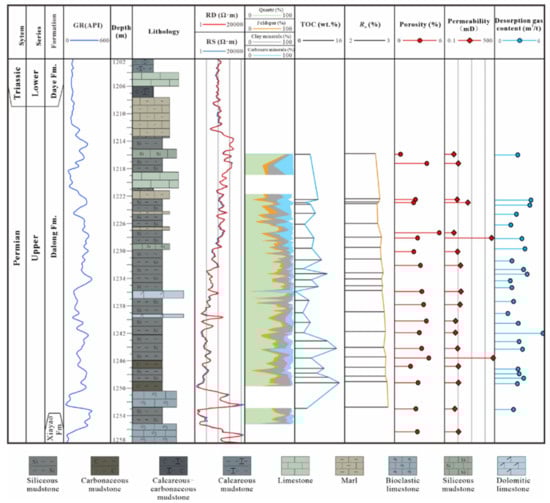
Figure 2.
Comprehensive stratigraphic column of the upper Permian Dalong Formation in well ED-2.
3. Materials and Methods
All the samples were analyzed at the Laboratory of Wuhan Xinshengji Technology Co., Ltd. Whole-rock X-ray diffraction (XRD) analyses were performed on 120 shale samples collected from depths of 1215.9–1255.15 m in the well using a SmartLab SE X-ray diffractometer (Rigaku) operating at 40 kV and 40 mA, according to the national standard SY/T 5163-2018. Twenty-six samples from depths of 1215.9–1252.95 m were selected for organic geochemical analyses: TOC analyses were performed on all 26 samples using a TOC-L CPH SM5000 analyzer (Shimadzu) following the national standard GB/T19145-2003, Ro analyses were performed on 20 of the 26 samples using an MPM-80 stereomicroscope (Leica) according to the national standard SY/T5124-2012, and the microstructure of kerogen was investigated in all 26 samples using a DMLD microscope (Leica) following the national standard SY/T 5125-1996.
We assessed three aspects of the shale reservoirs: shale total porosity and permeability, shale pore structure, and shale adsorption capacity. Shale total porosity and permeability were analyzed in 18 samples collected from 1215.9–1256.35 m depth in the well using a KXD-II combined porosity and permeability meter manufactured by Huaxing Petroleum Devices Co., Ltd., following the national standard GB/T 29172-2012. Eleven samples were selected from depths of 1215.9–1252.9 m in the well for shale pore structure characterization. Six of those eleven samples were used to analyze pore types in the Dalong Formation shales qualitatively; after polishing using an argon ion beam, the nano–microscale pores on the polished surfaces were directly observed by secondary electron imaging using an EVO LS15 SEM (Zeiss). The other seven samples were subjected to CO2 and N2 adsorption tests to quantify their pore structures. Low-temperature and low-pressure CO2 and N2 adsorption tests were performed using an Autosorb iQ3 volumetric adsorption analyzer (Quantachrome). In the first adsorption test, we used CO2 as the adsorbate to determine adsorption under different relative pressures, which refers to test pressure/saturated steam pressure (P/P0) in the range of 0–0.03. The density functional theory (DFT) model was applied to process the data and obtain micropore volumes and specific surface areas. For N2 adsorption tests, the adsorption and desorption of N2 under different pressures were measured at the temperature of liquid N2 (77.4 K), and the Barret-Joyner-Halenda (BJH) model was adopted to calculate pore volumes and specific surface areas. The shale adsorption capacity was determined by isothermal methane adsorption experiments using seven representative samples with evenly distributed TOC contents from depths of 1215.9–1249.2 m in the well. These samples were from the same horizons as those selected for gas adsorption tests and were used to analyze the influence of pore structure parameters on shale adsorption capacity. A high-pressure magnetic suspension balance-based gravimetric adsorption analyzer was used for the experiments, and methane adsorption by the shale samples was measured under a constant temperature of 30 °C in the pressure range 0–32 MPa.
4. Results and Discussion
4.1. Mineral Compositions and Lithofacies Classification of the Shales
XRD analyses of the Dalong Formation shales from well ED-2 returned extremely high contents of brittle minerals (averaging 85.5%). Brittle minerals mainly include quartz, feldspar, calcite, dolomite, and pyrite (Table 1, Figure 3). Quartz contents were the highest (36.4–87.2%, averaging 62.2%), followed by carbonates (0–17.9% calcite, averaging 5.1%; 0–17.9% dolomite, averaging 5.1%), clay minerals (4.7–36.4%, averaging 13.7%), plagioclase (4.7–36.4%, averaging 13.7%), and pyrite (0.8–6.6%, averaging 3.0%). The samples also contained minor amounts of hematite and potassium feldspar (Figure 3).

Table 1.
Basic characteristics of the Dalong Formation shale samples selected from well ED-2 in Western Hubei.
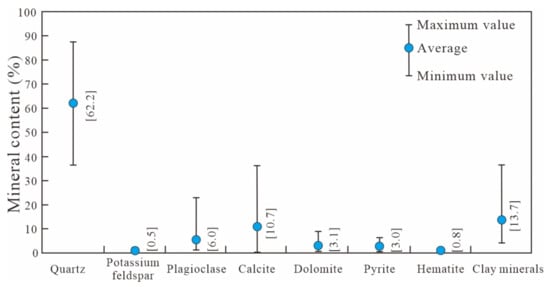
Figure 3.
Mineral content of the Dalong Formation shales in well ED-2 in Western Hubei.
According to the shale lithofacies classification scheme, based on a ternary diagram with siliceous (quartz + feldspar), clay, and carbonate (calcite + dolomite) mineral endmembers [16], the Dalong Formation shales in well ED-2 include siliceous rocks (S), carbonate-rich siliceous shales (S-1), siliceous shales (S-2), and clay-rich siliceous shales (S-3), all of which are siliceous shales (Figure 4). Siliceous shales are mainly deposited in inter-platform basin environments. The siliceous shale from well ED-2 is black or gray-black and relatively hard. Small high-angle fractures havedeveloped and filled with calcite (Figure 5).
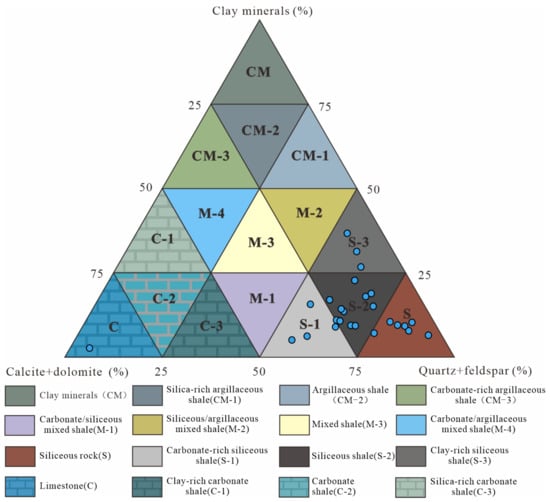
Figure 4.
Lithofacies of the Dalong Formation shales in well ED-2 in Western Hubei (based on the classification of [16]).
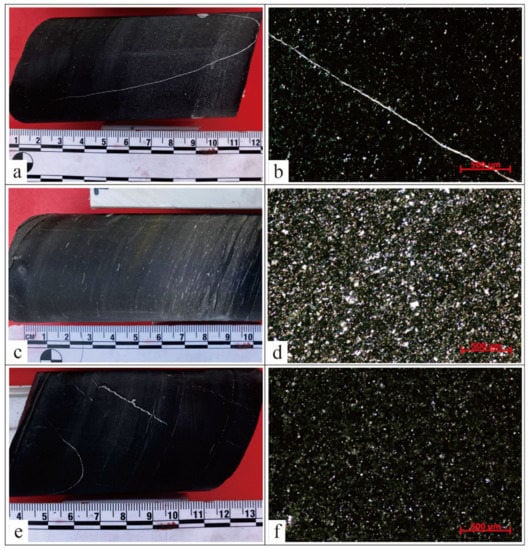
Figure 5.
Characteristics of (a,b) Siliceous rock, (c,d) Carbonate-rich siliceous shale, and (e,f) Clay-rich siliceous shale from well ED-2. (a) Photograph of black siliceous rock from 1232.9 m depth. (b) Microphotograph of black siliceous rock from 1233.1 m depth, rich in organic matter and contains calcite-filled fractures. (c) Gray-black carbonate-rich siliceous shale from 1221.9 m depth. (d) Microphotograph of carbonate-rich siliceous shale from 1222.2 m depth, with calcite, quartz, and organic matter distributed throughout. (e) Black clay-rich siliceous shale from 1242.0 m depth. (f) Microphotograph of clay-rich siliceous shale from 1242.2 m depth, rich in organic matter.
4.2. Organic Geochemical Characteristics of the Shales
The organic carbon content and bitumen reflectance results obtained for the upper Permian Dalong Formation shale samples from well ED-2 are shown in Figure 2. Among the 26 selected samples, one limestone sample had a low TOC content of 0.25 wt.%, whereas the other 25 siliceous shale samples had TOC contents of 2.6–14.27 wt.%, averaging 6.66 wt.%. These TOC contents are relatively high, especially those with >10 wt.% TOC. The organic matter contents of the Dalong shales were positively correlated with clay mineral and pyrite contents and weakly negatively correlated with quartz and carbonate mineral contents (Figure 6). Solid bitumen reflectances measured in 20 shale samples were in the range Ro = 2.56–2.79%, averaging 2.68%, indicating that the organic matter had entered the over-maturation stage of dry gas generation with a high degree of thermal evolution [43] and the thermal maturity of the shales increased with increasing burial depth. In addition, kerogen microstructures indicated that Dalong shales contain rich sapropelite (86–97%), predominantly type I (sapropelic type) with a small proportion of type II1 (humic-sapropelic type) [44,45,46]. This organic matter was mainly derived from primary marine producers such as algae.
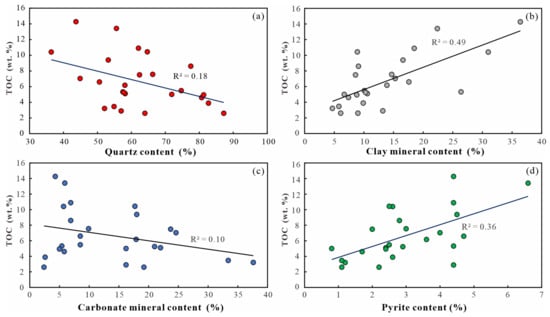
Figure 6.
Correlations between TOC content and (a) quartz, (b) clay mineral, (c) carbonate mineral, and (d) pyrite contents in the Dalong Formation shales.
4.3. Characteristics of the Shale Reservoirs and Their Influencing Factors
4.3.1. Physical Characteristics of the Shale Reservoirs
Sample porosities ranged from 1.17–7.8%, averaging 3.13%; most (71.4%) had porosities of 2.0–4.0% (Figure 7a). The horizontal permeabilities of shale reservoir intervals ranged between 0.002 and 335.209 mD, with an average of 23.785 mD. All samples containing microfractures had permeabilities >1 mD, including the highest-permeability sample. In comparison, samples free of microfractures generally had permeabilities around 1 mD. The porosities and permeabilities of the Dalong shales in well ED-2 are positively correlated (Figure 7b). There is no apparent correlation between TOC and porosity (Figure 7c). Quartz content showed a weak negative correlation with porosity, whereas clay mineral content showed a weak positive correlation with porosity; carbonate mineral content showed no apparent correlation (Figure 7d).
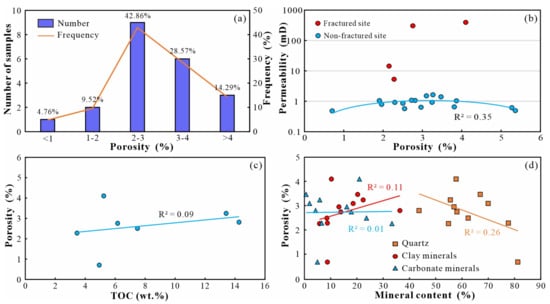
Figure 7.
(a) Porosity distribution, (b) Permeability vs. porosity, (c) Porosity vs. TOC, (d) Porosity vs. mineral contents in the Dalong Formation shales.
4.3.2. Shale Pore Types
Pore types and structural features are the main factors influencing the physical properties of shale reservoirs. Here, we investigated the pore structure characteristics of 11 shale samples (Table 1). Based on systematic studies of pore types in the Barnett Shale, previous studies have classified shale reservoir pores into three types based on the relationship between mineral matrix pores and particles [25,47]: interparticle pores, intraparticle pores, and organic pores. Subsequent researchers further classified microfractures as a type of shale pore [48,49]. Here, based on our microscopic observations, we classified pores of the Dalong shales from well ED-2 as organic pores, non-organic pores, or microfractures. Pore types, morphologies, sizes, and connectivities in the Dalong Formation shales vary significantly due to differences in organic matter type, TOC content, and mineral composition.
- (1)
- Organic pores
Organic pores are nanoscale pores formed within organic grains after hydrocarbon generation and expulsion [24]. Our SEM observations revealed that many organic pores had developed in the siliceous shale samples of the Dalong Formation. These pores were bubble-like, elliptical, or slit-shaped, spanned a wide range of sizes, and showed obvious differences between samples. We studied the development of organic pores in three sets of samples, summarized individually here.
Shales in the first set contained 5–6 wt.% TOC and had moderate quartz contents of 56–75% (Figure 8a–d). In these samples, organic pores were mostly bubble-like or elliptical, evenly distributed within the organic particles, and generally smaller than 50 nm. Those that developed at the edge of an organism retained their original biomorphology, and some are connected to form relatively large, slit-shaped pores (Figure 8a). Others developed from solid bitumen, either within intercrystalline pores of pyrite framboids (Figure 8b) or in the interparticle pores between rigid mineral grains (Figure 8c). Finally, organic pores also developed from mixtures of organic matter and clay minerals (Figure 8d).
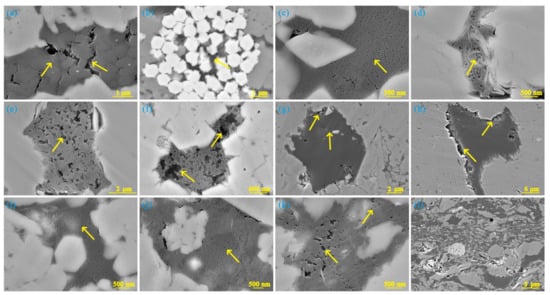
Figure 8.
Organic matter distributions, pore morphologies, and pore development characteristics of Dalong Formation shales with (a–d) Moderate TOC and quartz contents, (e–h) Low TOC and high quartz contents, (i–l) High TOC and low quartz contents. (a) Isolated and interconnected organic pores (yellow arrow) developed within organic matter (1229.6 m depth in well ED-2). (b) Organic pores (yellow arrow) developed from solid bitumen filling the intercrystalline pores of a pyrite framboid (1229.6 m depth). (c) Organic pores (yellow arrow) developed from solid bitumen filling interparticle pores (1234.2 m depth). (d) Organic pores (yellow arrow) developed from organic matter and clay mineral assemblages (1234.2 m depth). (e) Elliptical to worm-like organic pores (yellow arrow) (1237.2 m depth). (f) Collapsed and interconnected organic pores (yellow arrow) (1237.2 m depth). (g) Organic pores (yellow arrow) are not developed within organic matter but at its edge (1252.9 m depth). (h) Organic matter (yellow arrow) without internal pores but with contracted slit pores at its edge (1252.9 m depth). (i,j) Small organic pores (yellow arrow) are evenly distributed throughout organic matter (1244.2 m depth). (k) Organic pores of heterogeneous sizes (yellow arrow) are unevenly distributed throughout organic matter (1249.2 m depth). (l) Oriented organic matter and mineral particles, showing fluid shapes (1249.2 m depth).
Shales in the second set contained <5 wt.% TOC and >80% quartz (Figure 8e–h). In these samples, organic pores were interconnected or collapsed to form elliptical or worm-like pores, mostly sized 50–600 nm, though a few were as small as 20–50 nm (Figure 8e,f). These pores formed when the organic matter reached an over-mature stage (2.56–2.79% Ro) and began producing large amounts of hydrocarbons, thus resulting in abundant organic pores. Some organic pores supported by siliceous mineral particles were well preserved, retaining uncompressed elliptical shapes (Figure 8f). Organic pores developed from humic kerogen in type-II1 organic matter developed along the edge of the organic matter, rather than within it (Figure 8g,h).
Shales in the third set contained >10 wt.% TOC and <56% quartz (Figure 8i–l). These shales had well-developed bubble-like or elliptical organic pores, generally smaller than 50 nm. Due to the varieties of organic micro-components and different hydrocarbon generation capacities, the development of organic pores within different organic particles of these Dalong Formation shales varied significantly. Organic pores were unevenly distributed within the organic matter (Figure 8j), and pore sizes were varied (Figure 8k). Moreover, the high organic matter content, the relatively low amounts of brittle minerals such as quartz, and the large amounts of organic matter mixed with rigid minerals and clay minerals in fluid shapes (Figure 8l) indicate that these shales were affected by compaction or tectonic stress, which may have impacted the organic pores.
- (2)
- Non-organic pores
Non-organic pores in the Dalong Formation shale samples were less developed than organic pores; intraparticle, intercrystalline, and interparticle pores were identifiable. Intraparticle pores were typically formed within brittle minerals such as quartz, feldspar, calcite, and dolomite via dissolution during diagenesis [50]. The Dalong Formation shales contain small amounts of carbonate minerals; the large amount of acidic fluid produced from the organic matter during hydrocarbon generation dissolved calcite particles to form numerous dissolution pores (Figure 9a). The intraparticle pores formed by the dissolution of brittle minerals were then filled by migrating solid bitumen, forming a film of homogeneous thickness on the pore surfaces (Figure 9b). Intraparticle pores were circular and quadrilateral and generally around 300 nm in size. Intercrystalline pores were mainly formed in pyrite framboids or unfilled pore spaces between recrystallized minerals during diagenesis (Figure 9c); these pores had irregular polygonal or elongated shapes and typical diameters of 100–500 nm. Intergranular pores mainly include interparticle pores between rigid minerals (Figure 9d), interparticle pores between minerals and organic matter (Figure 9e), and interlayer pores in clay minerals (Figure 9f,g). Intergranular pores are mostly irregular and polygonal, triangular, or parallel-plate shaped, are well connected, and are 50–500 nm in size.
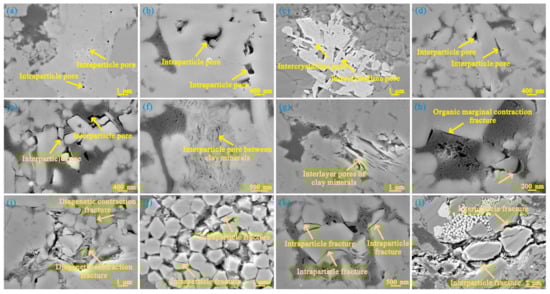
Figure 9.
Characteristics of non-organic pores and microfractures in the Dalong Formation shale samples from well ED-2. (a) Intraparticle pores developed within calcite (1244.2 m depth). (b) Intraparticle pores filled with a bitumen layer of homogeneous thickness (1249.2 m depth). (c) Interparticle pores developed between recrystallized dolomite grains (1234.2 m depth). (d) Interparticle pores developed between quartz and feldspar grains (1229.6 m depth). (e) Interparticle pores developed between quartz and organic matter (1229.6 m depth). (f) Slit pores between clay minerals (1244.2 m depth). (g) Elongated and parallel-plate pores between clay minerals (1252.9 m depth). (h) Contraction fractures developed at the edge of organic matter (1229.6 m depth). (i) Diagenetic fractures developed between rigid minerals and clay mineral grains (1234.2 m depth). (j) Intraparticle fractures developed within a pyrite framboid (1244.2 m depth). (k) Intraparticle fractures developed within quartz grains (1237.2 m depth). (l) Interparticle fractures developed between mineral grains (1249.2 m depth).
- (3)
- Microfractures
Shale microfractures can form during deposition, hydrocarbon generation, diagenesis, the maturation of organic matter, and late-stage tectonic movements [25]. The Dalong Formation shale samples from Western Hubei contain microfractures of different origins and scales, including nanoscale fractures due to contraction along the margins of organic matter, diagenetic fractures between mineral grains, and relatively large-scale structural fractures nanometers to micrometers wide, observed under the field-emission SEM. Organic marginal contraction fractures form along organic-mineral grain boundaries during the thermal evolution of organic matter and hydrocarbon generation. Their fracture lengths are related to the size of the organic matter and its peripheral mineral aggregates; in this case, they were generally ~200 nm wide (Figure 9h). Diagenetic fractures form during diagenetic processes such as shale compaction, clay mineral dehydration, and recrystallization. As revealed by the SEM images, such microfractures were distributed along the edges of mineral grains with limited connectivity, and they were typically ~500 nm wide (Figure 9i). Structural fractures form by the mutual extrusion and crushing of mineral grains under tectonic stresses, e.g., the cross-cutting intraparticle fractures in the pyrite framboid (Figure 9j) and the triangular interparticle fractures in strained quartz (Figure 9k). Such intraparticle fractures usually have limited connectivity, with smooth and planar fracture surfaces and fracture widths of 100–300 nm. Structural fractures can also form between particles. Here, these interparticle fractures were characteristically long and had curved fracture surfaces, with many crushed and broken fine grains visible on the particle edge. Some fractures had widths reaching the microscale (Figure 9l). These structural fractures indicate that the brittle minerals in siliceous shales of the Dalong Formation resist compaction and late-stage tectonic stresses, preventing the collapse of organic pores.
4.4. Characteristics of the Shales’ Pore Structures
We quantitatively characterized the pore structure of the Dalong siliceous shale by low-temperature CO2 and N2 adsorption tests. Sampling depths and measured pore structure parameters are listed in Table 2, and CO2 and N2 adsorption isotherms of selected samples are presented in Figure 10.
Table 2.
Pore structure parameters of Dalong Formation shale samples from well ED-2.
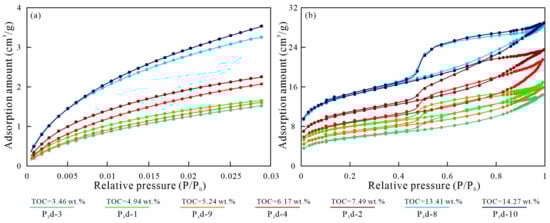
Figure 10.
(a) CO2 (b) N2 adsorption-desorption isotherms of Dalong Formation shale samples from well ED-2.
The CO2 adsorption isotherms of all samples rose sharply as the relative pressure (P/P0) increased from 0 to 0.03 (Figure 10a), indicating the strong CO2 adsorption capacity of the Dalong shales, with maximum adsorption amounts of 1.52–3.53 cm3/g (averaging 2.26 cm3/g). These experiments were primarily conducted to determine the structural parameters of shale micropores with diameters <1.5 nm. Non-local density functional theory (NLDFT) model calculations showed that the micropores (diameter <2 nm) accounted for volumes of 3.58–11.85 × 10⁻³ cm3/g (averaging 7.31 × 10⁻³ cm3/g) in the different shale samples. Micropore-specific surface areas were 11.87–37.89 m2/g (averaging 23.4 m2/g) (Table 2). Pore volume increase and cumulative pore volume distribution plots (Figure 11a,b, respectively) demonstrate three dominant intervals of the pore size distribution at 0.3 nm, 0.4–0.7 nm, and 0.8 nm.
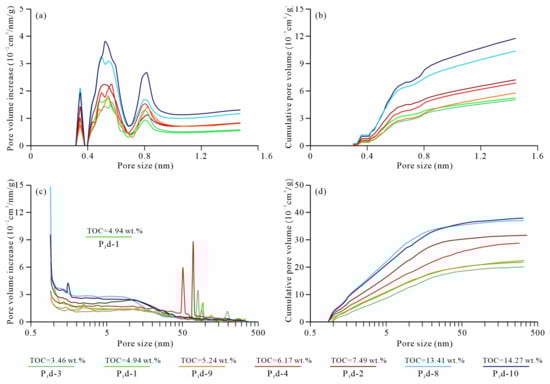
Figure 11.
Pore size distributions were obtained by (a,b) CO2 and (c,d) N2 adsorption tests of the Dalong Formation shale samples from well ED-2. Correlations are shown between pore size and (a,c) pore volume increase and (b,d) Cumulative pore volume. Different curves (colors) represent different samples.
The N2 adsorption-desorption isotherms showed that N2 adsorption gradually increased with increasing pressure. At P/P0 > 0.45, the desorption curves of all samples exhibited desorption hysteresis; the desorption curves were separated from the adsorption curves to form obvious hysteresis loops (Figure 10b). The hysteresis loops of the Dalong Formation shale samples had narrow openings, similar to type-H4 hysteresis loops. They also exhibited type-H3 characteristics because the adsorption curves rose slowly at P/P0 < 0.9 and then rapidly at P/P0 = 0.9–1.0, suggesting that the Dalong Formation shales contain a large proportion of slit pores and few parallel-plate pores. The shale samples had a strong N2 adsorption capacity, reaching maxima of 14.39–28.91 cm3/g (averaging 21.35 cm3/g) (Figure 10b). The N2 adsorption experiments were primarily conducted to determine the structural parameters of mesopores with diameters >1.5 nm; our BJH model calculations showed that mesopores of 2–50 nm diameter accounted for volumes of 15.8–28.2 × 10⁻³ cm3/g (averaging 21.4 × 10⁻³ cm3/g) and specific surface areas of 10.05–20.83 m2/g (averaging 14.75 m2/g), whereas large mesopores with diameters >50 nm accounted for volumes of 1.7–4.0 × 10⁻³ cm3/g (averaging 2.4 × 10⁻³ cm3/g) and specific surface areas of 0.07–0.18 m2/g (averaging 0.1 m2/g) (Table 2). Pore volume increase and cumulative pore volume distribution plots (Figure 11c,d, respectively) reveal that the Dalong Formation shales contain a significant amount of mesopores in the size range of 2–50 nm. The cumulative pore volume curves increased slowly at pore sizes >50 nm, indicating a low proportion of macropores in the shales.
Based on the results of our CO2 and N2 adsorption tests (Table 2), we conclude that the pore volume of the Dalong Formation shales is dominated by mesopores (68.9% of the total pore volume), followed by micropores (23.5%) and macropores (7.6%). In contrast, micropores dominate the specific surface area of pores (61.2% of the total specific surface area), followed by mesopores (38.6%) and macropores (0.3%).
A shale’s pore structure can be influenced by the development of different interparticle and intraparticle pore types. Micropore volumes and specific surface areas in our shale samples (Figure 12 and Figure 13, respectively) are positively correlated with clay mineral content, negatively correlated with quartz content, and weakly negatively correlated with carbonate content. Similarly, mesopore volumes and specific surface areas are positively correlated with clay mineral content and weakly negatively correlated with quartz and carbonate content. In contrast, the volumes and specific surface areas of large pores were low and were not correlated with any mineral content. These results indicate that clay minerals favor the development of pore volume and specific surface area, whereas quartz and carbonate minerals resist pore development.
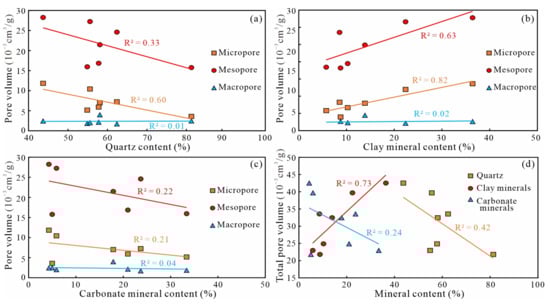
Figure 12.
Correlations between pore volumes and mineral contents in the Dalong Formation. Correlations are shown between pore volume, separated by pore size class, and (a) quartz, (b) clay mineral, (c) carbonate mineral contents, as well as (d) between total pore volume and individual mineral contents.
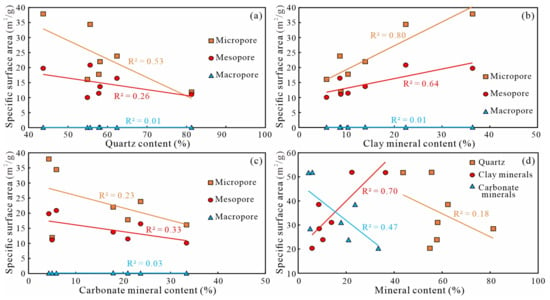
Figure 13.
Correlations between pore-specific surface areas and mineral contents in the Dalong Formation. Correlations are shown between pore-specific surface area, separated by pore size class, and (a) Quartz, (b) Clay mineral, (c) Carbonate mineral contents, and (d) Between overall pore-specific surface area and individual mineral contents.
Many nanoscale organic pores were formed during the thermal evolution of organic matter and hydrocarbon generation in the Dalong shales (Figure 8). The development of organic pores generates significant pore volumes and specific surface areas that can provide storage space and adsorption sites for shale gas enrichment. Organic pore development in shales is thus closely related to organic matter content, type, and maturity. Most organic matter in the Dalong Formation shales in well ED-2 were type I and overmatured (Ro = 2.56–2.79%) (Table 1). Thus, the organic matter content in the Dalong Formation shales had the greatest influence on organic pore development. The volumes (Figure 14a) and specific surface areas (Figure 14b) of both micropores and mesopores were highly correlated with organic matter content. Therefore, organic pores mainly contributed to the micro- and mesoscale porosity in the shales, and the organic matter content was the main factor controlling the pore structures. Indeed, the average pore size of the shales decreased with increasing organic matter content (Figure 14c). Our SEM analysis of pore types (Section 4.3.2) indicated that high organic matter contents might favor compaction (e.g., Figure 8l), thus reducing the size of many organic pores.
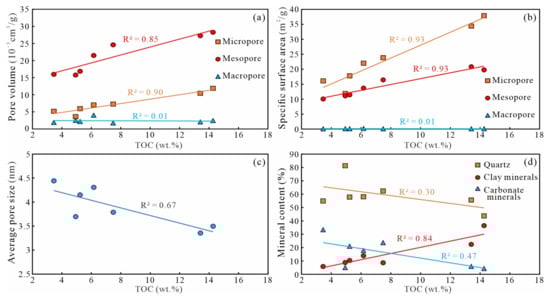
Figure 14.
Correlations between pore structure parameters, mineral contents, and organic matter contents in the Dalong Formation shales: (a) Pore volume, (b) Pore specific surface area (both separated by pore size class), (c) Average pore size, (d) Mineral content vs. TOC content.
The correlations between the mineral and organic matter contents of the shales can be summarized as follows. Clay mineral contents were highly correlated with organic matter content but weakly negatively correlated with quartz and carbonate contents. This suggests that a large amount of organic matter might have been adsorbed by clay minerals during the deposition of the Dalong Formation shales, resulting in the observed positive correlations between clay mineral content and shale pore volume and specific surface area. In general, the pore structure was influenced by the organic matter content.
4.5. Shale Adsorption Capacity
In shale reservoirs, gas is preserved in free or adsorbed states, with the adsorbed gas fraction forming a large proportion of the total weight. The adsorbed gas content of a shale reservoir is known to be affected by external factors, such as formation temperature and pressure, as well as internal factors, such as TOC content, organic matter maturity, clay mineral content, and pore structure [51,52]. A quantitative assessment of shale adsorption capacity, typically through isothermal methane adsorption experiments, is thus essential when evaluating shale reservoirs.
Here, we selected seven shale samples with uniform organic carbon contents from well ED-2 for isothermal methane adsorption tests using the mass balance method to obtain both their absolute and excess methane adsorption isotherms (Figure 15a,b, respectively). We took the absolute methane adsorption at 32 MPa as the maximum adsorption capacity of these samples.
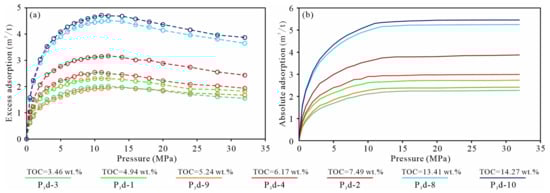
Figure 15.
(a) Excess and (b) Absolute methane adsorption isotherms for the Dalong Formation shale samples from well ED-2.
The samples had maximum methane adsorptions of 2.21–5.41 m3/t (averaging 3.53 m3/t) at 30 °C and 32 MPa. The sample TOC content was positively correlated with both excess and absolute methane adsorption (Figure 15 and Figure 16c), and the two samples containing >10 wt.% TOC adsorbed much more methane than the others. The methane adsorption capacity of the siliceous shales was also positively correlated with the volume and specific surface area of micropores and mesopores, but not macropores (Figure 16a,b). Thus, mesopores and micropores provide adsorption sites and storage space for methane and are the factors that directly control these shales’ adsorption capacities. Methane adsorption was also positively correlated with clay mineral content and weakly negatively correlated with quartz and carbonate contents (Figure 16d).
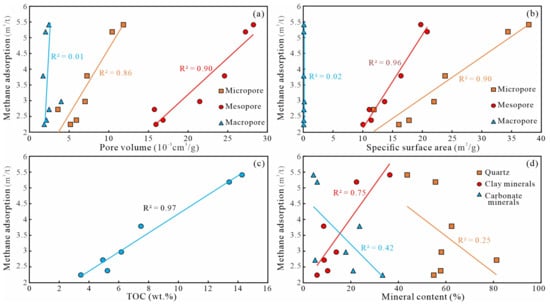
Figure 16.
Correlations between methane adsorption capacity and (a) Pore volume, (b) Pore-specific surface area, (c) Organic matter content, (d) Mineral contents in the Dalong Formation shales.
Because the volumes and specific surface areas of micropores and mesopores in Dalong siliceous shales are strongly positively correlated with organic matter content (Figure 14a,b), and because most micropores and mesopores are of organic origin, the methane adsorption sites and amounts must be related to the development of organic micropores and mesopores. Indeed, organic matter content is the main factor controlling the adsorption capacity of these shales. Although clay mineral contents are also positively correlated with methane adsorption, we conclude that methane adsorption capacity is dominantly controlled by organic matter content because TOC is also positively correlated with clay mineral content. The high TOC contents of these siliceous shales are conducive to the development of micropores and mesopores, and the associated increase in pore volume and specific surface area results in stronger methane adsorption capacities. These trends have strong implications for exploration in western Hubei and may also contribute to our understanding of methane adsorption in shales in general [53,54], as well as to our understanding of methane adsorption in less conventional natural gas systems, such as biogenic gas hydrates [55].
4.6. Comparison with Other Typical Shale Gas Reservoirs
In North America, the commercial development of shale gas was first achieved in the Woodford, Barnett, and Haynesville shale reservoirs [56]. China has made significant breakthroughs in shale gas exploration in the Sichuan Basin and its periphery, with the largest shale gas field in China having been built in the Jiaoshiba area of the eastern Sichuan Province [38]. Studies on the reservoir characteristics and the main factors controlling shale gas enrichment in these areas are relatively complete and can thus be used as a reference for shale gas exploration and development in the Dalong Formation in Western Hubei.
Comparing the characteristics of shale reservoirs in the Dalong Formation with those of the other typical shale reservoirs (Table 3) reveals that the Dalong Formation shales are currently buried at relatively shallow depths and contain more mature organic matter, generally at the over-maturation stage. This suggests that the Dalong shales experienced deep burial during early diagenesis. Compared to the organic matter contents of the Woodford and Barnett Shales in North America and the Longmaxi Formation shales in eastern Sichuan, those of the Dalong siliceous shales are twice as high. The brittle mineral contents of the Dalong shales are also higher than those of the other reservoirs, which is favorable for later exploitation by hydraulic fracturing. Although the total porosity of the Dalong Formation shales is relatively low, its micropore volume and combined mesopore + macropore volume are comparable to those of the Longmaxi Formation shales and are higher than those of the Woodford and Barnett Shales.
Table 3.
Shale reservoir characteristics of the Dalong Formation in Western Hubei compared to other typical shale reservoirs.
Moreover, the desorption gas content of the Dalong Formation shales is slightly higher than that of the Longmaxi Formation shales. These comparisons reveal that siliceous shales are characterized by favorable hydrocarbon generation and enrichment conditions, making them a desirable target for shale gas exploration.
5. Conclusions
(1) Shales of the Dalong Formation in the Western Hubei trough are dominated by siliceous shale lithofacies, with an average quartz content of 62.2%. Bioclastic limestones and marls are developed at the bottom and top of the formation. The Dalong Formation shales contain much type-I organic matter (averaging 6.66 wt.% TOC) at a stage of over-maturity (Ro = 2.56–2.79%). Organic matter content is positively correlated with clay mineral content and weakly negatively correlated with quartz and carbonate mineral contents.
(2) The total porosity and permeability of the Dalong shales are low. The shales have diverse types of pores. Shale porosities range between 1.2 and 7.8% (averaging 3.13%). The horizontal permeability of the shale reservoir intervals varies between 0.002 and 335.209 mD (averaging 23.785 mD). Bubble-like and elliptical organic pores are the most developed, mostly occurring as micropores and mesopores <50 nm in diameter. Non-organic pores account for only a small proportion of the total porosity, mainly including intraparticle dissolution pores and interparticle pores; some interparticle pores are well interconnected. Organic marginal contraction, diagenetic, and structural fractures are also developed. Brittle minerals in the shales resist compaction, preventing the collapse of organic pores.
(3) Mesopores in the Dalong siliceous shales dominate the total porosity, accounting for 68.9% of the total pore volume. The contributions of micropores and macropores to porosity are subordinate, although micropores contributed the most to the specific surface area, accounting for 61.2% of the total specific surface area (compared to 38.6% for mesopores). The pore volumes and specific surface areas of the shales are positively correlated with clay and organic matter contents and weakly negatively correlated with quartz and carbonate mineral contents. The pore structure of the Dalong Formation shales was influenced by organic matter and clay mineral contents.
(4) The Dalong siliceous shales have a strong methane adsorption capacity, which is positively correlated with the volumes and specific surface areas of micropores and mesopores, as well as clay mineral content, and strongly positively correlated with TOC content. These findings demonstrate that Dalong siliceous shales with higher organic carbon contents have more developed micropores and mesopores, larger pore volumes and specific surface areas, and stronger methane adsorption capacities.
(5) Compared to shale gas reservoirs in other regions, the siliceous shales in the Western Hubei Dalong Formation have high organic matter contents, high brittle mineral contents, good storage conditions, and high desorption gas contents. In conclusion, the Dalong Formation in Western Hubei is characterized by superior hydrocarbon generation conditions, good storage conditions, and lithologies favorable to later hydraulic fracturing.
Author Contributions
Conceptualization, K.D. and T.X.; methodology, K.D., Y.W. and Y.L.; investigation, K.D., T.X., Y.W., Y.Z., W.S.; resources, K.D., T.X., Y.W. and Y.Z.; writing—original draft preparation, K.D.; writing—review and editing, T.X., Y.W., W.S. and Y.L.; visualization, K.D. and T.X.; supervision, Y.Z.; project administration, K.D. All authors have read and agreed to the published version of the manuscript.
Funding
This research was funded by the Natural Science Foundation of Hubei Province, funding numbers WHCG2020C032 and WHCG2020C033, and Science and Technology Projects of Hubei Geological Bureau, funding numbers KJ2022-49 and KCDZ2022-13.
Data Availability Statement
Data available within the article.
Conflicts of Interest
The authors declare no conflict of interest.
References
- Hao, F.; Zou, H.; Lu, Y. Mechanisms of shale gas storage: Implications for shale gas exploration in China. AAPG Bull. 2013, 97, 1325–1346. [Google Scholar] [CrossRef]
- Ma, Y.; Cai, X.; Zhao, P. China’s shale gas exploration and development: Understanding and practice. Pet. Explor. Dev. 2018, 45, 561–574. [Google Scholar] [CrossRef]
- Guo, T.; Zhang, H. Formation and enrichment mode of Jiaoshiba shale gas field, Sichuan Basin. Pet. Explor. Dev. 2014, 41, 28–36. [Google Scholar] [CrossRef]
- Han, S.B.; Zhang, J.C.; Wang, C.S.; Tang, X. Elemental geochemistry of lower Silurian Longmaxi shale in southeast Sichuan Basin, South China: Constraints for Paleoenvironment. Geol. J. 2018, 53, 1458–1464. [Google Scholar] [CrossRef]
- Hu, Z.; Du, W.; Sun, C.X.; Wu, J.; Zhu, T.; Zhao, J.; Yan, C. Evolution and migration of shale facies and their control on shale gas: A case study from the Wufeng-Longmaxi Formations in the Sichuan Basin and its surroundings. Interpretation 2019, 64, SN57–SN70. [Google Scholar] [CrossRef]
- Li, H.; Zhou, J.L.; Mou, X.Y.; Guo, H.X.; Wang, X.X.; An, H.Y.; Mo, Q.W.; Long, H.Y.; Dang, C.X.; Wu, J.F.; et al. Pore structure and fractal characteristics of the marine shale of the Longmaxi Formation in the Changning Area, Southern Sichuan Basin, China. Front. Earth Sci. 2022, 10, 1018274. [Google Scholar] [CrossRef]
- Li, J.; Li, H.; Yang, C.; Wu, Y.J.; Gao, Z.; Jiang, S.L. Geological characteristics and controlling factors of deep shale gas enrichment of the Wufeng-Longmaxi Formation in the southern Sichuan Basin, China. J. Pet. Sci. Eng. 2022, 2022, 4737801. [Google Scholar] [CrossRef]
- Fan, C.H.; Li, H.; Qin, Q.R.; He, S.; Zhong, C. Geological conditions and exploration potential of shale gas reservoir in Wufeng and Longmaxi Formation of southeastern Sichuan Basin, China. J. Pet. Sci. Eng. 2020, 191, 107138. [Google Scholar] [CrossRef]
- Rani, S.; Padmanabhan, E.; Prusty, B.K. Review of gas adsorption in shales for enhanced methane recovery and CO2 storage. J. Pet. Sci. Eng. 2019, 175, 634–643. [Google Scholar] [CrossRef]
- Wu, Z.R.; He, S.; He, Z.L.; Li, X.C.; Zhai, G.Y.; Huang, Z.Q. Petrographical and geochemical characterization of the Upper Permian Longtan formation and Dalong Formation in the Lower Yangtze region, South China: Implications for provenance, paleoclimate, paleoenvironment and organic matter accumulation mechanisms. Mar. Pet. Geol. 2022, 139, 105580. [Google Scholar] [CrossRef]
- Zhu, W.B.; Zhang, X.H.; Zhou, D.R.; Fang, C.G.; Li, J.Q.; Huang, Z.Q. New cognition on pore structure characteristics of Permian marine shale in the Lower Yangtze region and its implications for shale gas exploration. Nat. Gas Ind. B 2021, 8, 562–575. [Google Scholar] [CrossRef]
- Yu, Y.M.; Li, P.P.; Guo, R.X.; Zhao, Y.Z.; Li, S.; Zou, H.Y. Upwelling-induced organic matter enrichment of the Upper Permian Dalong Formation in the Sichuan Basin, SW China and its paleoenvironmental implications. Palaeogeogr. Palaeoclimatol. Palaeoecol. 2021, 576, 110510. [Google Scholar] [CrossRef]
- Chen, S.; Zhu, Y.; Qin, Y.; Wang, H.; Liu, H.; Fang, J. Reservoir evaluation of the Lower Silurian Longmaxi Formation shale gas in the southern Sichuan Basin of China. Mar. Pet. Geol. 2014, 57, 619–630. [Google Scholar] [CrossRef]
- Wang, S.; Dong, D.; Wang, Y.; Li, X.; Huang, J.; Guan, Q. Sedimentary geochemical proxies for paleoenvironment interpretation of organic-rich shale: A case study of the Lower Silurian Longmaxi Formation, Southern Sichuan Basin, China. J. Nat. Gas Sci. Eng. 2015, 28, 691–699. [Google Scholar] [CrossRef]
- Shi, X.; Kang, S.; Create, C.; Wu, W.; Zhao, S.; Zhu, D.; Zhang, H.; Which, Y.; Xiao, Z.L.; Li, Y. Shale gas exploration potential and reservoir conditions of the Longmaxi Formation in the Changning area, Sichuan Basin, SW China: Evidence from mud gas isotope logging. J. Asian Earth Sci. 2022, 233, 105239. [Google Scholar] [CrossRef]
- Wu, L.; Hu, D.; Lu, Y.; Liu, R.; Liu, X. Advantageous Shale Lithofacies of Wufeng Formation-Longmaxi Formation in Fuling Gas Field of Sichuan Basin, SW China. Pet. Explor. Dev. 2016, 43, 208–217. [Google Scholar] [CrossRef]
- Zheng, B.; Mou, C.; Wang, X.; Xiao, Z.; Chen, Y. Sedimentary record of the collision of the North and South China cratons: New insights from the Western Hubei Trough. Geol. J. 2019, 54, 3335–3348. [Google Scholar] [CrossRef]
- Ma, Y.; Fan, M.; Lu, Y.; Guo, X.; Hu, H.; Chen, L.; Wang, C.; Liu, X. Geochemistry and sedimentology of the Lower Silurian Longmaxi mudstone in southwestern China: Implications for depositional controls on organic matter accumulation. Mar. Pet. Geol. 2016, 75, 291–309. [Google Scholar] [CrossRef]
- Xie, W.; Wang, M.; Chen, S.; Vandeginste, V.; Yu, Z.; Wang, H. Effects of gas components, reservoir property and pore structure of shale gas reservoir on the competitive adsorption behavior of CO2 and CH4. Energy 2022, 254, 124242. [Google Scholar] [CrossRef]
- Ma, Y. Major Source Rocks and Distribution. In Marine Oil and Gas Exploration in China; Springer: Berlin/Heidelberg, Germany, 2020; pp. 61–79. [Google Scholar]
- Guo, X.; Li, Y.; Borjigen, T.; Wang, Q.; Yuan, T.; Shen, B.; Ma, Z.; Wei, F. Hydrocarbon generation and storage mechanisms of deep-water shelf shales of Ordovician Wufeng Formation–Silurian Longmaxi Formation in Sichuan Basin, China. Pet. Explor. Dev. 2020, 47, 204–213. [Google Scholar] [CrossRef]
- Liu, W.; Yao, J.; Tong, J.; Qiao, Y.; Chen, Y. Organic matter accumulation on the Dalong Formation (Upper Permian) in Western Hubei, South China: Constraints from multiple geochemical proxies and pyrite morphology. Palaeogeogr. Palaeoclimatol. Palaeoecol. 2019, 514, 677–689. [Google Scholar] [CrossRef]
- Wu, W.; Liu, W.; Mou, C.; Liu, H.; Qiao, Y.; Pan, J.; Ning, S.; Zhang, X.; Yao, J.; Liu, J. Organic-rich siliceous rocks in the upper Permian Dalong Formation (NW middle Yangtze): Provenance, paleoclimate and paleoenvironment. Mar. Pet. Geol. 2021, 123, 104728. [Google Scholar] [CrossRef]
- Chen, F.W.; Lu, S.F.; Ding, X. Pore Types and Quantitative Evaluation of Pore Volumes in the Longmaxi Formation Shale of Southeast Chongqing, China. Acta Geol. Engl. Ed. 2018, 92, 342–353. [Google Scholar] [CrossRef]
- Loucks, R.G.; Reed, R.M.; Ruppel, S.C.; Hammes, U. Spectrum of pore types and networks in mudrocks and a descriptive classification for matrix-related mudrock pores. AAPG Bull. 2012, 96, 1071–1098. [Google Scholar] [CrossRef]
- Wu, L.; Lu, Y.; Jiang, S.; Lu, Y.; Liu, X.; Hu, H. Pore structure characterization of different lithofacies in marine shale: A case study of the Upper Ordovician Wufeng-Lower Silurian Longmaxi formation in the Sichuan Basin, SW China. J. Nat. Gas Sci. Eng. 2018, 57, 203–215. [Google Scholar] [CrossRef]
- Burton, Z.F.M.; Moldowan, J.M.; Magoon, L.B.; Sykes, R.; Graham, S.A. Interpretation of source rock depositional environment and age from seep oil, east coast of New Zealand. Int. J. Earth Sci. 2019, 108, 1079–1091. [Google Scholar] [CrossRef]
- Thompson-Butler, W.; Peters, K.E.; Magoon, L.B.; Scheirer, A.H.; Moldowan, J.M.; Blanco, V.O.; Gonzalez, R.E.; Graham, S.A.; Zumberge, J.E.; Wavrek, D.A. Identification of genetically distinct petroleum tribes in the Middle Magdalena Valley, Colombia. AAPG Bull. 2019, 103, 3003–3034. [Google Scholar] [CrossRef]
- Li, H.; Tang, H.M.; Qin, Q.R.; Zhou, J.L.; Qin, Z.J.; Fan, C.H.; Su, P.D.; Wang, Q.; Zhong, C. Characteristics, formation periods and genetic mechanisms of tectonic fractures in the tight gas sandstones reservoir: A case study of Xujiahe Formation in YB area, Sichuan Basin, China. J. Pet. Sci. Eng. 2019, 178, 723–735. [Google Scholar] [CrossRef]
- Magoon, L.B.; Dow, W.G. The petroleum system. In The Petroleum System—From Source to Trap; Magoon, L.B., Dow, W.G., Eds.; American Association of Petroleum Geologists Memoir 60: Tulsa, OR, USA, 1994; pp. 3–24. [Google Scholar]
- Li, H. Research progress on evaluation methods and factors influencing shale brittleness: A review. Energy Rep. 2022, 8, 4344–4358. [Google Scholar] [CrossRef]
- Yang, W.; He, S.; Iglauer, S.; Guo, X.; Zhai, G.; Zhou, Z.; Dong, T.; Tao, Z.; Wei, S. Porosity Characteristics of Different Lithofacies in Marine Shale: A Case Study of Neoproterozoic Sinian Doushantuo Formation in Yichang Area, China. J. Pet. Sci. Eng. 2019, 187, 106856. [Google Scholar] [CrossRef]
- Xiao, B.; Li, X.; Zhao, Z.H.; Fu, X. Sedimentary tectonic pattern of Wufeng and Longmaxi Formations in the northern margin of Sichuan Basin, South China. Int. Geol. Rev. 2021, 64, 2166–2185. [Google Scholar] [CrossRef]
- Chen, K.Q.; Zhang, D.Z.; Tuo, X.S. Relationship between geological structure and marine shale gas preservation conditions in the western Middle Yangtze Block. Nat. Gas Ind. B 2020, 7, 583–593. [Google Scholar] [CrossRef]
- He, W.G.; Zhou, J.X.; Yuan, K. Deformation evolution of Eastern SichuaneXuefeng foldethrust belt in South China: Insights from analogue modeling. J. Struct. Geol. 2018, 109, 74–85. [Google Scholar] [CrossRef]
- Xu, L.L.; Huang, S.P.; Liu, Z.X.; Zhang, Y.L.; Wen, Y.R.; Zhou, X.H.; Chen, W.; Ren, Z.J.; Wen, J.H. Paleoenvironment Evolutionary Characteristics of Niutitang Shale in Western Hubei, Middle Yangtze, China. ACS Omega 2022, 7, 24365–24383. [Google Scholar] [CrossRef]
- Yin, H.F.; Song, H.J. Mass extinction and Pangea integration during the Paleozoic–Mesozoic transition. Sci. China Earth Sci. 2013, 56, 1791–1803. [Google Scholar] [CrossRef]
- Yin, H.; Jiang, H.; Xia, W.; Feng, Q.; Zhang, N.; Shen, J. The end-Permian regression in South China and its implication on mass extinction. Earth-Sci. Rev. 2014, 137, 19–33. [Google Scholar] [CrossRef]
- Liu, L.; Wu, Y.S.; Li, Y.; Liu, Q.S.; Jiang, H.X.; Liu, H. Microfacies of a Permian calcisponge reef in Lichuan, western Hubei, South China. Palaeoworld 2018, 27, 90–106. [Google Scholar] [CrossRef]
- Liu, W.Q.; Zhang, X.X.; Qiao, Y.; Xu, Y.; Mou, C.L.; Wu, W.; Yao, J.X. Climate-driven paleoceanography change controls on petrology and organic matter accumulation in the upper Permian Dalong Formation, western Hubei Province, southern China. Sediment. Geol. 2022, 440, 106259. [Google Scholar] [CrossRef]
- Zheng, B.S.; Mou, C.L.; Wang, X.P.; Chen, H.D.; Xiao, Z.H. Paleoclimate and paleoceanographic evolution during the Permian-Triassic transition (western Hubei area, South China) and their geological implications. Palaeogeogr. Palaeoclimatol. Palaeoecol. 2021, 564, 110166. [Google Scholar] [CrossRef]
- Cai, Q.S.; Hu, M.Y.; Kane, O.I.; Yang, Z.; Wen, Y.R.; Luo, Q.; Li, M.T.; Hu, Z.G.; Deng, Q.J. Petrological and geochemical characteristics of the Ordovician–Silurian black shale in eastern Sichuan and western Hubei, South China: Differential sedimentary responses to tectonism and glaciation. J. Palaeogeogr. 2022. [Google Scholar] [CrossRef]
- Li, X.M.; Wang, Y.R.; Lin, W.; Ma, L.H.; Liu, D.X.; Liu, J.R.; Zhang, Y. Micro-pore structure and fractal characteristics of deep shale from Wufeng Formation to Longmaxi Formation in Jingmen exploration area, Hubei Province, China. J. Nat. Gas Geosci. 2022, 7, 121–132. [Google Scholar] [CrossRef]
- Espitalié, J.; Madec, M.; Tissot, B.; Mennig, J.J.; Leplat, P. Source rock characterization method for petroleum exploration. In Proceedings of the Offshore Technology Conference, Houston, TX, USA, 2–5 May 1977. [Google Scholar]
- Peters, K.E. Guidelines for evaluating petroleum source rock using programmed pyrolysis. AAPG Bull. 1986, 70, 318–329. [Google Scholar]
- Vandenbroucke, M.; Largeau, C. Kerogen origin, evolution and structure. Org. Geochem. 2007, 38, 719–833. [Google Scholar] [CrossRef]
- Loucks, R.G.; Reed, R.M.; Ruppel, S.C.; Jarvie, D.M. Morphology, genesis, and distribution of nanometer-scale pores in siliceous mudstones of the Mississippian Barnett Shale. J. Sediment. Res. 2009, 79, 848–861. [Google Scholar] [CrossRef]
- Xu, S.; Gou, Q.; Hao, F.; Zhang, B.; Shu, Z.; Lu, Y.; Wang, Y. Shale pore structure characteristics of the high and low productivity wells, Jiaoshiba shale gas field, Sichuan Basin, China: Dominated by lithofacies or preservation condition. Mar. Pet. Geol. 2020, 114, 104211. [Google Scholar] [CrossRef]
- Gou, Q.; Xu, S.; Hao, F.; Lu, Y.; Shu, Z.; Wang, Z.; Wang, Y. Evaluation of the exploration prospect and risk of marine gas shale, southern China: A case study of Wufeng-Longmaxi shales in the Jiaoshiba area and Niutitang shales in the Cen’gong area. GSA Bull. 2022, 134, 1585–1602. [Google Scholar] [CrossRef]
- Xie, W.; Wang, M.; Wang, H.; Ma, R.; Duan, H. Diagenesis of shale and its control on pore structure, a case study from typical marine, transitional and continental shales. Front. Earth Sci. 2021, 15, 378–394. [Google Scholar] [CrossRef]
- Curtis, J.B. Fractured shale-gas systems. AAPG Bull. 2002, 86, 1921–1938. [Google Scholar]
- Jarvie, D.M.; Hill, R.J.; Ruble, T.E.; Pollastro, R.M. Unconventional shale-gas systems: The Mississippian Barnett Shale of north-central Texas as one model for thermogenic shale-gas assessment. AAPG Bull. 2007, 91, 475–499. [Google Scholar] [CrossRef]
- Ji, L.; Zhang, T.; Milliken, K.L.; Qu, J.; Zhang, X. Experimental investigation of main controls to methane adsorption in clay-rich rocks. Appl. Geochem. 2012, 27, 2533–2545. [Google Scholar] [CrossRef]
- Zhang, T.; Ellis, G.S.; Ruppel, S.C.; Milliken, K.; Yang, R. Effect of organic-matter type and thermal maturity on methane adsorption in shale-gas systems. Org. Geochem. 2012, 47, 120–131. [Google Scholar] [CrossRef]
- Burton, Z.F.M.; Dafov, L.N. Testing the sediment organic contents required for biogenic gas hydrate formation: Insights from synthetic 3-D basin and hydrocarbon system modelling. Fuels 2022, 3, 555–562. [Google Scholar] [CrossRef]
- Chalmers, G.R.; Bustin, R.M.; Power, I.M. Characterization of gas shale pore systems by porosimetry, pycnometry, surface area, and field emission scanning electron microscopy/transmission electron microscopy image analyses: Examples from the Barnett, Woodford, Haynesville, Marcellus, and Doig units. AAPG Bull. 2012, 96, 1099–1119. [Google Scholar]


Disclaimer/Publisher’s Note: The statements, opinions and data contained in all publications are solely those of the individual author(s) and contributor(s) and not of MDPI and/or the editor(s). MDPI and/or the editor(s) disclaim responsibility for any injury to people or property resulting from any ideas, methods, instructions or products referred to in the content. |
© 2023 by the authors. Licensee MDPI, Basel, Switzerland. This article is an open access article distributed under the terms and conditions of the Creative Commons Attribution (CC BY) license (https://creativecommons.org/licenses/by/4.0/).