Abstract
The main intake shaft in the mine serves as the main intake and return air shaft and also serves as a lifting shaft. The piston wind effect caused by the frequent operation of large and efficient hoisting cages in the shaft will disturb the normal flow of airflow in the transport lane connected to the shaft and affect the underground ventilation effect. Therefore, based on the SST k-ω turbulence model, this paper uses the dynamic mesh to simulate the air-fluid in the cage running in the shaft and verifies the simulation data through field measurement to study the influence of piston effect on the airflow field in the transport lane. The results show that the piston effect caused by cage operation in the shaft will disturb the flow of normal airflow in the transportation lane and affect the ventilation effect in the mine. The 1765.0 m transport lane is closest to the position of the shaft inlet, which is most significantly affected by the piston wind effect. The low-speed eddy current zone generated at the tail of the cage in the upwind operation has a large area and strong adsorption force, which causes the gas at the local position in the transportation lane to generate eddy current and reverse flow, hindering the flow of fresh air in the lane. The influence distance and strength of the piston effect on each measuring point in the transportation lane are limited. When the measuring point distance increases from 21.7 m to 71.7 m, the differential pressure of measuring points in 1414.0 m, 1584.0 m and 1765.0 m transport lanes decreases by 11.08 Pa, 9.62 Pa and 8.58 Pa, respectively.
1. Introduction
In the mine production system, the movement of mine equipment will produce a lot of induced airflow, such as the middle transport equipment (rail or trackless equipment), mine lifting equipment (skip or cage), mine or ore funnel or drawing. Among them, the piston airflow generated by the operation of the middle transportation equipment and the mine hoisting equipment has the greatest influence on the stability of the mine ventilation system.
With the continuous improvement of mine mechanization and mine production capacity, the development of underground lifting equipment tends to be large-scale and efficient [1]. Cage in the wellbore operation, the speed is usually up to 6~12 m/s, and underground ore lifting, material decentralization, personnel and equipment transportation are inseparable from the cage or skip in the shaft lifting [2]. The frequent lifting and lowering of cages and skips in the well will lead to the continuous change of the effective cross-sectional area of the wind in the limited space of the well, which will produce the transient change of the piston airflow and the wellbore pressure, and the piston wind problem becomes prominent. The main intake shaft in the mine is often connected with multiple transportation lanes. The piston effect caused by the wellbore is bound to affect the airflow field and lane pressure in the lane. The transportation lane also undertakes the transportation of underground fresh air flow and leads to the main production area. The piston effect causes the normal air to flow in the lane to be destroyed, and the impact on the stability of the mine ventilation system cannot be ignored. Xie [3] measured typical lanes in suburban coal mines in Henan Province, China. It was found that the piston wind generated by different operating states of the mine car has a great influence on the ventilation resistance of the lane, which will affect the stability of the ventilation system in the difficult period of ventilation. Tian [4] measured the local resistance of the auxiliary shaft of Gequan Mine in Hebei Province, China. It was found that the transient local resistance caused by the piston effect of the lifting container accounts for 47.64% of the ventilation resistance of the whole auxiliary shaft, which seriously hinders the air flow.
At present, research on piston wind mainly focuses on subways and tunnels. In 2007, Kim J Y et al. [5] studied the unsteady three-dimensional flow caused by train operation in subway tunnels for the first time through 1:20 train and tunnel model tests and CFX4 and analyzed the changes of pressure and wind speed with time. The piston wind of trains in the tunnel is of great significance to tunnel ventilation and fire rescue. Based on the sliding mesh technique, Li et al. [6] established a three-dimensional computational model of high-speed trains and tunnels and studied the piston wind effect caused by two trains passing each other in the tunnel. The results show that the piston effect is more obvious when the train is limited by multiple trains in the same space, and the difference in the maximum peak at different positions is 34% larger than that of the single train. Based on a three-dimensional compressible turbulence model, Chu et al. [7] studied the pressure waves generated by two trains passing each other in the tunnel. The simulation results show that the train pressure and resistance coefficient reach the maximum when the two trains intersect in the tunnel. Due to the interaction between the train and the tunnel, the pressure and drag coefficients increase with the increase in train speed and blockage ratio. Izadi et al. [8] simulated the movement of trains in subway tunnels and stations on a side subway platform based on a 3D computational model. The results show that when the train just enters the station and brakes, some particles are transported and spread to different platform areas. When the train stops, these particles enter the station due to the continuous influence of the piston effect and spread within the platform, penetrating into the stairwell and ticket hall. The results also show that due to the influence of piston wind, some particles generated from the train braking system will penetrate the train through the ventilation system.
Mine piston wind research is less and mainly concentrated in the country. On the basis of summarizing the variation law of piston wind and taking the actual transportation platform of a mine as the engineering background, Wang [9] established the physical model and mathematical calculation model of piston wind for the operation of my car in my transport lane and the lifting equipment in the ventilation shaft. The influence law and significance of the influencing factors of each piston wind in the transport lane are analyzed by theoretical calculation, and the air flow field of the equipment in the transport lane and the lifting shaft is simulated by CFD software. Wang et al. [10] used Fluent to simulate the space vector distribution of the air flow field in the lane when the movement direction of the transport vehicle in the mine was consistent with the direction of the air flow based on the k-Ɛ turbulence model of the moving reference frame. The simulation results show that the airflow organization in the roadway changes complicatedly under the influence of piston wind, and the flow velocity in different regions varies greatly, which is closely related to the selection of various parameters. Based on numerical simulation software, Li [11] studied the change of roadway piston wind under different influencing factors and the influence law of each factor and used the processing software SPSS to study and analyze the correlation between each influencing factor and obtained the influence degree of each influencing factor. Finally, the influence of piston wind on tunnel ventilation resistance and wind resistance was studied by field measurement. Based on the theory of fluid mechanics, Wang et al. [12] established a two-dimensional RNG k-Ɛ turbulence model of cage flow and used Fluent to simulate the changes in the flow field and pressure field in the wellbore when the cage is running. The results show that the piston effect caused by cage operation will cause the transient change of pressure in the shaft and the dynamic change of airflow in the shaft, which has a certain influence on the stability of the ventilation system.
In summary, the research on piston wind in subways and tunnels mainly includes the theoretical modeling of piston wind, the influencing factors of piston wind and the influence of piston wind on subway environmental control system and tunnel environment [13,14,15,16,17,18,19]. At present, there are few studies on piston wind and mainly focusing on the formation mechanism of piston wind, theoretical modeling and analysis of influencing factors [20,21,22]. Most scholars‘ research on piston wind is based on a simplified single-lane flow field. That is to say, based on an independent shaft or transport lane, the piston effect caused by cage lifting or mine truck transportation is studied and discussed. However, most of the shafts, as the main intake and return air shafts, are connected with one or more transport lanes. The study of the piston effect in a single tunnel flow field is difficult to reflect the real distribution of the piston wind in the mine, and the study is limited to the formation mechanism and influencing factors of the piston wind, lacking the specific impact on the ventilation flow in the mine.
Based on the above research, the main objective of this paper is to discuss the influence of the piston effect caused by the operation of the double cages in the main inlet shaft on the airflow in the transportation lane connected to it. The Section 2 of the article, a three-dimensional calculation model is established according to the actual section size of the main intake shaft and the transportation lane in a mine in Yunnan, China, and the accuracy of the established model is verified by mesh independence test and actual measurement. Set reasonable simulation conditions and calculate the basis of verification. According to the simulation results, Section 3 of the article mainly analyzes the disturbance of the airflow structure in the transportation lane under the influence of the piston effect, the change of the pressure and velocity of each measuring point and the characteristics of the probability density distribution of the wind speed in the lane. Section 4 is the main conclusion of this study.
2. Numerical Method
2.1. Mathematical Model
Using Fluent simulation software, the piston effect caused by the cage running in the shaft is calculated by dynamic mesh, and the calculation is solved based on SST k-ω two-equation model. The general governing equations are as follows [23,24,25,26]:
In the above formula, = min(P,10k), , , , , . Table 1 is the constant coefficient of the constitutive relation equation of the SST k-ω model.

Table 1.
Constant coefficient of the constitutive equation of the SST model.
2.2. Geometric Model
Based on the cross-sectional dimensions of the main air intake shaft and the associated transport lane in a mine in Yunnan, China, a geometric model was established. The fresh air flow of the deep resource ventilation system of the mine enters from the main intake shaft and reaches the stop through each middle transport lane. The air inlet shaft is a combined shaft and a floor lifting method. The shaft is located outside the boundary of mining movement, with a diameter of 6.5 m, a bottom elevation of 854.0 m, and a depth of 1526.5 m. A lifting system is set up in the shaft, which is equipped with double-layer double cages. The two cages are a counterweight to each other. The speed of the cage can reach 6~12 m/s when it runs at a uniform speed in the shaft. Taking into account the distribution of the piston wind in the mine shaft and the simulation should be consistent with the principles of the site. In this paper, the main intake shaft elevation of 1374.0–1854.0 m and the elevation of 1765.0 m, 1584.0 m and 1414.0 m are selected to establish and calculate the model.
The model size is shown in Figure 1. The simulated length of the main intake shaft is 480.0 m. The simulated lengths of the three transport lanes are determined to be 434.0 m, 426.0 m and 252.0 m according to the distance to the working face. The shaft is equipped with double cages. Cage A is in downwind operation, and cage B is in upwind operation. The cage size is 3.1 m × 2.0 m × 5.0 m (length × width × height). In Figure 1, the top of the shaft is the airflow inlet, and the right side of the transportation lane is the airflow outlet. The blue arrow represents the direction of the fresh airflow. PT1-PT18 are the simulation data points of pressure and velocity in the transport lane. The Design Modeler preprocessor is used to establish a 3D geometric model according to the size sketch at 1:1, and then the model is imported into Meshing for meshing. The results are shown in Figure 2.
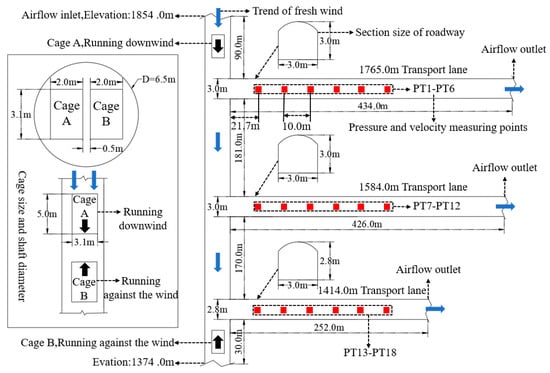
Figure 1.
Model size diagram.
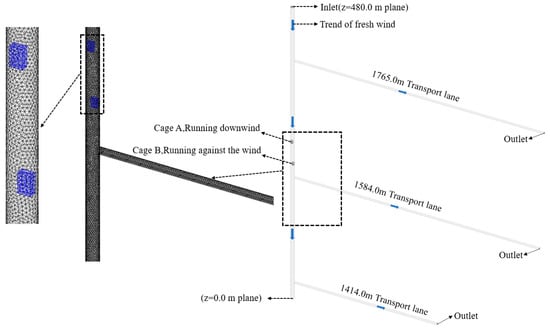
Figure 2.
3D geometric model and meshing diagram of double cage hoisting in the shaft.
2.3. Model Setting
The divided mesh model is imported into Fluent for calculation, and the pressure-based solver is selected. Because of the need to analyze the wind flow field in the shaft in terms of time, the transient calculation is selected, and the calculation model is the SST k-ω turbulence model. The inlet boundary type of the wellbore is set to the velocity inlet, and the inlet wind speed is constant at 4.4 m/s. The export boundary type of the transportation lane is set to free pressure export. The boundary type of cage and lane wall is uniformly set to the wall. The mesh type selects the dynamic mesh, and the mesh generation method is fairing and reconstruction. The connection attributes between the mesh nodes of the smoothing method are unchanged, there is no generation and elimination of nodes, and the topology of the mesh cannot be changed. If the displacement is too large, it will lead to the mesh deformation rate being too large and an updated failure. The reconstruction rule will automatically update the mesh near the moving boundary layer according to the distortion rate and mesh size set by the user. Therefore, this paper uses a combination of smoothing methods and reconstruction methods to generate dynamic meshes. Write a Profile file and import it into Fluent to specify the movement direction and speed of the two cages. The two cages run at a uniform speed of 10.0 m/s. The specific parameters of the simulation calculation are set as shown in Table 2 below, and the remaining parameters remain default.

Table 2.
Calculation model parameter setting.
2.4. Model Verification
2.4.1. Mesh Verification
In order to ensure the accuracy of the simulation results, the model mesh is tested for independence. Three different mesh number division schemes of 1055156, 1418251, and 1755415 (A, B, C) were used to simulate the cage operation in the shaft. Figure 3 shows the change of airflow velocity at the outlet of the 1584.0 m transport lane when the wind speed at the entrance of the shaft is 4.4 m/s, and the cage runs at a constant speed of 10.0 m/s for 48.5 s (half cycle). From the figure, we can see that the simulation results of three different meshing schemes have little difference, which satisfies the independence test. Considering the calculation amount and accuracy of the simulation, it is decided to use the B scheme for subsequent simulation analysis.
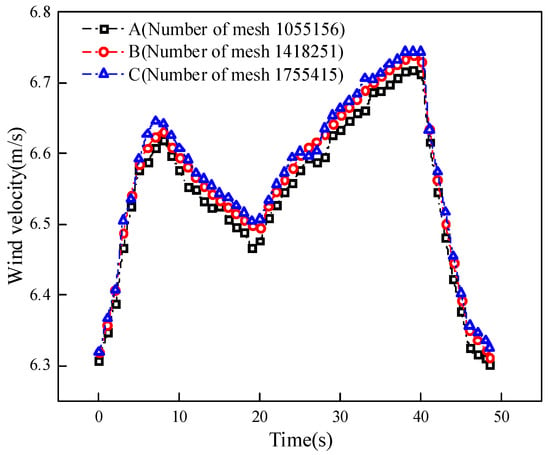
Figure 3.
Time-varying curve of wind speed at the outlet of 1584.0 m transport lane with different mesh schemes.
2.4.2. Experimental Verification
In order to verify the accuracy of the model, the piston wind velocity in the transport lane under the operation of double cages in the shaft was measured. The measured location is arranged in a 1584.0 m transport lane. The 1584.0 m lane is the main transportation lane and is used to connect the upper and lower middle sections and the new and old ventilation systems. The lane also leads to the main production area and is one of the most important air supply lines. This measurement is to obtain the wind speed changes of some representative measuring points in the lane caused by the piston wind of cage operation. Taking the intersection surface of the 1584.0 m transport lane and main intake shaft as the starting measurement point, a measuring point is set every 10.0 m along the horizontal center line of the 1584.0 m lane to the direction of production area, a total of 6 measuring points, and the location of measuring points is shown in Figure 4.
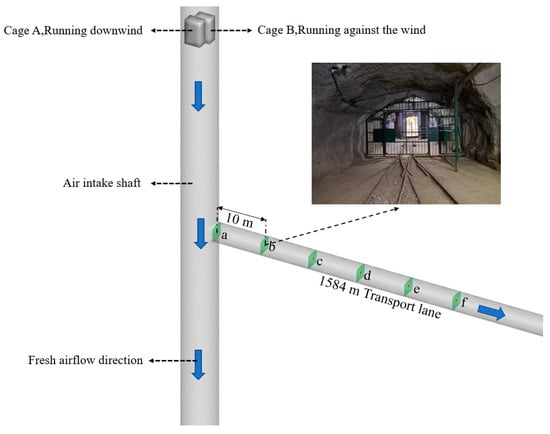
Figure 4.
Diagram of measured and simulated wind speed.
Only shaft ventilation was measured velocity of 4.4 m/s, cage at a speed of 10 m/s, uniform operation of 48.5 s through the main intake shaft elevation 1374.0~1854.0 m, 1584.0 m transport lane wind speed. The wind speed measurement of each measuring point is carried out simultaneously by the point measurement method. The measuring instruments mainly include the ventilation multi-parameter detector (JYF-4), my electronic anemometer (DFA-2), handheld laser range finder (HT-307) and mechanical stopwatch (JM-504).
The measured wind speed values and simulated wind speed values of 6 measuring points are dimensionless [27,28] and compared respectively, and the results are shown in Figure 5. From the figure, we can see that the error of the measuring point closer to the shaft is large, and the error of the measuring point farther away from the shaft is decreasing. After calculation, the average velocity coefficient error between the simulated value and the measured value at each measuring point of a, b, c, d, e and f is 14.40%, 10.36%, 9.06%, 8.07%, 6.29% and 5.75% respectively. The average velocity coefficient error of each measuring point is less than 15.0%, which can verify the accuracy of the model. It shows that it is feasible to use the SST k-ω turbulence model to simulate the change of piston wind with time series and its influence on the air flow of transport lanes.


Figure 5.
Comparison of simulated and measured piston wind speed: (a) Verify the value point a, (b) Verify the value point b, (c) Verify the value point c, (d) Verify the value point d, (e) Verify the value point e, (f) Verify the value point f.
3. Simulation Analysis
3.1. Influence of Piston Effect on Airflow Structure of Transport Lane
Figure 6 shows the change of airflow structure in the drift caused by two cages running in the shaft. Because the three transport alleys have similar changes in airflow structure under the influence of piston wind. Therefore, only a 1765.0 m transport lane is taken as an example for a specific explanation. When the cage has not yet begun to run, the shaft and the transport lane in the smooth flow of air, the ventilation effect is good. When the cage runs for 7.7 s, the cage reaches a 1765.0 m transport lane. The high-speed airflow in front of and around the cage running along the wind causes the wind speed in the transport lane to increase sharply, and the eddy current zone is generated in the upper part of the lane. When the cage runs, the air flows in the alley and returns to normal. When the cage runs for 39.0 s, the cage runs against the wind to reach the 1765.0 m transport lane, causing the vortex zone in the lane. Moreover, the eddy current influence area is expanding. When the cage runs for 40.6 s, the tail of the cage runs against the wind through the 1765.0 m transportation lane. The tail of the cage is a negative pressure area, which will adsorb the surrounding air. As shown in the diagram, a small part of the gas in the transport lane has been affected by the cage running against the wind to form a reverse flow. The low-speed vortex area caused by the tail of the cage running against the wind is large, and the adsorption force is strong. It not only affects the ventilation effect of the shaft but also hinders the airflow in the transportation lane. With the continuous improvement of cage running speed, the influence of the piston wind effect will not be ignored.
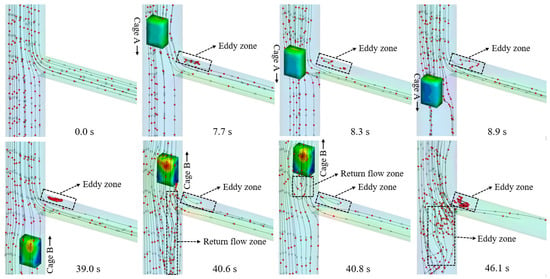
Figure 6.
Trace diagram of airflow structure in 1765.0 m lane under piston effect.
3.2. Influence of Piston Effect on Air Velocity in Transport Lane
3.2.1. Influence of Piston Effect on Velocity Field of Transport Lane
In order to analyze the influence of the piston effect caused by cage operation in the shaft on airflow in the transportation lane. In this paper, the velocity field distribution cloud images of different transportation lanes on two sections, x = −1 m (left side of the lane) and x = 1 m (right side of the lane), are intercepted according to time series values.
Figure 7 shows the effect of the cage running against the wind on the airflow field of each lane. When the cage does not reach the transport lane before. The cage runs in the shaft, resulting in the increase of shaft blockage ratio and the decrease of effective cross-sectional area. High-speed airflow is generated in the shaft and diverted into each transport lane. At this time, the piston wind in the shaft can promote the air flow in the transport lane and improve the ventilation effect when the cage runs against the wind through each transportation lane. The high-speed piston airflow generated around the cage and the ventilation airflow in the shaft are squeezed and merged into the transport lane at the same time. It will lead to a significant increase in the airflow velocity in the lane, and a high-speed eddy current zone will be formed between the cage and the lane mouth. Under the influence of a high-speed vortex area, the airflow velocity into the transport lane is higher. However, the decrease in ventilation area will lead to a decrease in ventilation volume in lanes when the cage runs against the wind after passing through each transport lane. The large-area low-speed eddy current zone generated at the tail of the cage obviously hinders the airflow in the lane and has a great influence on the ventilation effect in the lane.
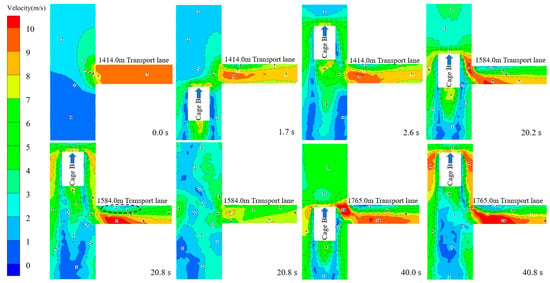
Figure 7.
Velocity field distribution of each transport lane in x = −1 m section.
Figure 8 shows the effect of a cage running along the wind on the airflow field of each lane. From the diagram, we can see that the piston flow caused by the cage running along the wind is smaller, and the influence on the flow field in the transport lane is smaller. The cage runs along the wind, and the front and rear are high-speed piston wind areas, increasing the airflow velocity in the transport lane and promoting airflow circulation.
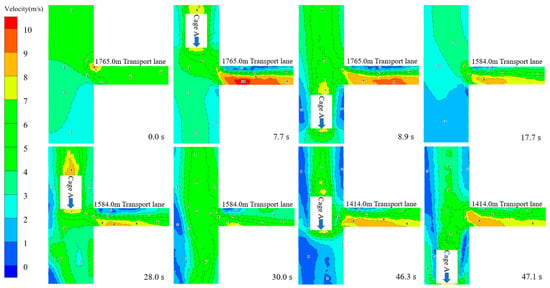
Figure 8.
Velocity field distribution of each transport lane in x = 1 m section.
Figure 7 and Figure 8 show that whether it is downwind or upwind of the operation cage, the piston wind speed generated by the cage during operation is always changing, which will cause transient changes in the airflow field in the transport lane. When the air flow velocity increases, it will greatly impact the ventilation effect in the transportation lane, which needs to be paid attention to. In addition, the piston wind caused by cages has the greatest influence on the air flow in the 1765.0 m transport lane. The main reason is that the 1765.0 m transportation lane is the closest to the air inlet of the shaft, and the inflow velocity is higher, so it is more affected.
3.2.2. Influence of Piston Effect on Wind Speed of Measuring Points in Transport Lane
As shown in Figure 9, under the influence of the piston wind of cage operation in the shaft, the relationship between the wind speed of each measuring point in the transport lane and time is shown. The position of each measuring point is shown in Figure 1. Assuming that the positive direction of the extended x-axis is the direction of the downwind operation, otherwise, it is the direction of the upwind operation, cage A is the downwind operation cage, and cage B is the upwind operation cage. The influence of different running states of the cage on the wind speed of each measuring point is marked in the figure.
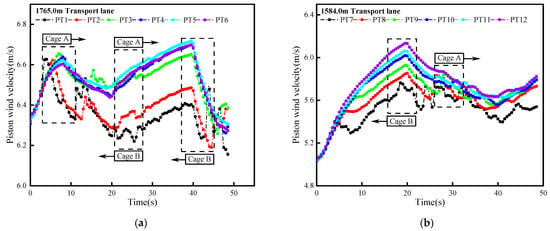
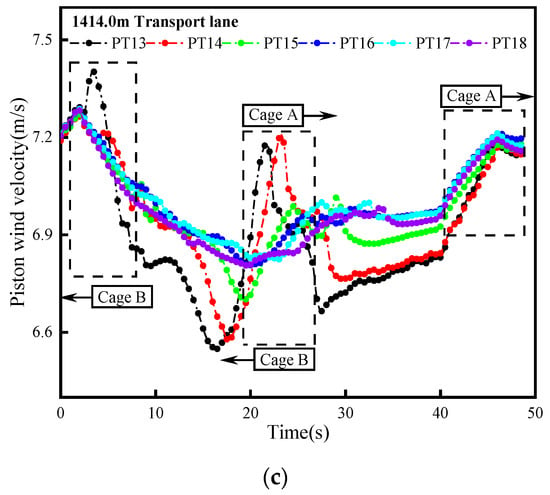
Figure 9.
The time-varying curve of piston wind speed at each measuring point in different transport lanes: (a) 1765.0 m transport lane, (b) 1584.0 m transport lane, (c) 1414.0 m transport lane.
As shown in the figure, the piston wind generated by the cage operation has a significant impact on the measuring points in each transport lane. The time-varying curves of wind speed at each measuring point in the same transport lane are essentially the same, and there is a similarity. However, the measuring points closer to the shaft are more affected by piston wind, and the variation trend and fluctuation range are more complex. The wind speed curves of each measuring point in different transport lanes vary greatly, mainly because each measuring point will be affected by cages in different operating states at different times. Among them, the cage running against the wind has the greatest influence on the wind speed in the transport lane, and the cage running along the wind has the least. The wind speed fluctuation is the most complicated when the two cages intersect.
In the 1765.0 m transport lane, the maximum and minimum piston wind speed difference of measuring points PT1-PT6 during the whole operation of the cage is 0.47 m/s, 0.43 m/s, 0.40 m/s, 0.44 m/s, 0.41 m/s and 0.42 m/s, respectively. In the 1584.0 m transportation lane, the piston wind speed difference of the measuring points PT7-PT12 is 0.74 m/s, 0.83 m/s, 0.91 m/s, 0.99 m/s, 1.03 m/s and 1.11 m/s respectively. In the 1414.0 m transport lane, the piston wind speed difference of measuring points PT13-PT18 are 0.85 m/s, 0.69 m/s, 0.57 m/s, 0.48 m/s, 0.46 m/s, 0.47 m/s. The greater the difference in the piston wind speed, the greater the fluctuation of the ventilation volume in the transportation lane, which will seriously affect the air flow transportation in the transportation lane and reduce the ventilation effect.
3.3. Influence of Piston Effect on Pressure in Transport Lane
3.3.1. Influence of Piston Effect on Pressure Field of Transport Lane
In order to analyze the piston effect on the pressure in the transport lane. According to the time series value, the pressure field distribution cloud maps of different transportation lanes on two sections of x = −1 m (left side of the lane) and x = 1 m (right side of the lane) are intercepted.
Figure 10 shows the effect of the cage running against the wind on the pressure in each transport lane. Positive pressure is formed in front of the cage, running against the wind, and negative pressure is generated in the rear and on both sides. Therefore, when the cage reaches each transport lane, it will cause a sudden increase in pressure on the line. When the cage passes through, the induced wind pressure at the tail of the cage will cause the pressure in the transportation lane to drop sharply.
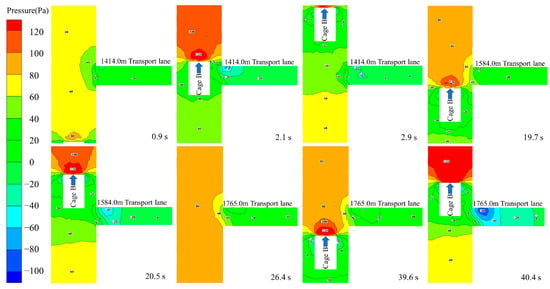
Figure 10.
Pressure field distribution of each transport lane in x = −1 m section.
Figure 11 shows the effect of a cage running along the wind on the pressure in each transport lane. The front and rear of the cage in downwind operation are both positive pressure, and the influence is small. The pressure change caused is not obvious, but the front and rear pressure differences also exist. With the increase in running speed, the impact of the pressure on the transport lanes will also increase.
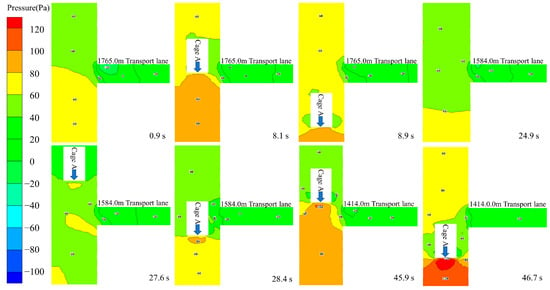
Figure 11.
Pressure field distribution of each transport lane in x = 1 m section.
Taken together from Figure 10 and Figure 11. Whether the cage is running along the wind or against the wind, the cage operation will cause a sudden increase and a sudden drop in the pressure in the shaft, which has a certain impact on the ventilation effect in the shaft. Moreover, the disturbance of the piston wind generated by the cage running against the wind to the pressure field in the shaft is far greater than the influence of the cage running along the wind. The 1765.0 m transport lane is closest to the shaft inlet, and the initial pressure is larger, so the affected area and degree in the lane are also larger.
3.3.2. Influence of Piston Effect on Measuring Point Pressure in Transport Lane
Figure 12 shows the relationship between the pressure of measuring points in each transport lane and time under the influence of the piston effect. The position of each measuring point is shown in Figure 1. It is also assumed that the positive direction of the x-axis is the downwind direction and vice versa.
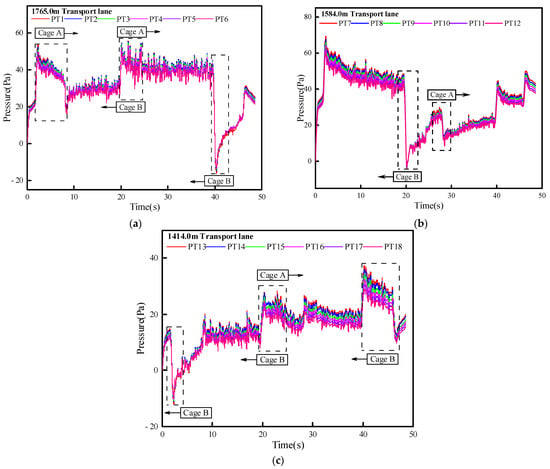
Figure 12.
The time-varying curve of pressure at each measuring point in different transport lanes: (a) 1765.0 m transport lane, (b) 1584.0 m transport lane, (c) 1414.0 m transport lane.
From the diagram, we can see that in the same lane, the trend of the pressure change curve is essentially the same. Under the influence of a running cage, the pressure curve has a high pulsation frequency and large pulsation amplitude. The operation of the cage will cause a transient change in the pressure in the transport lane. In particular, the pressure difference caused by the cage passing through each transport lane is the largest, and the minimum pressure is generated in the lane. The piston wind area interacts with each other under the intersection of two cages, and the pressure field distribution in the transport lane is the most complex. As the cage is away from each transport lane, the pressure of the measuring points in the lane gradually recovers.
Figure 13 shows the difference between the maximum and minimum pressure caused by the piston effect in each transport lane. From the figure, we can see that the pressure difference of each measuring point is linearly decreasing with the distance from the measuring point to the shaft. That is, the farther away from the shaft measuring point, the less affected by the piston effect, and the smaller the pressure difference. The measuring point distance increased from 21.7 m to 71.7 m, and the pressure in 1414.0 m, 1584.0 m and 1765.0 m transport lanes decreased by 11.08 Pa, 9.62 Pa and 8.58 Pa, respectively.
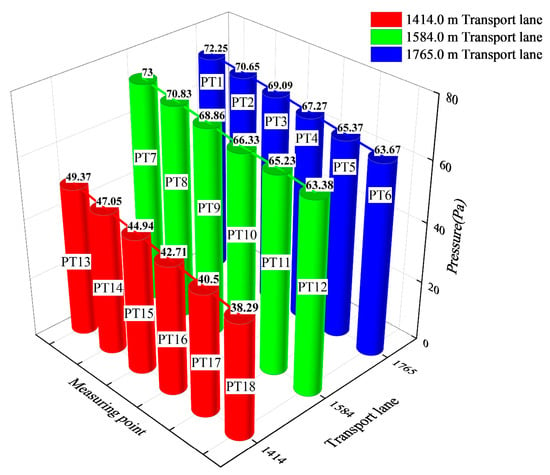
Figure 13.
The pressure difference of measuring points in each transport lane.
The airflow in the transport lane belongs to turbulent flow. Under the influence of piston wind, the airflow particles collide, mix and exchange with each other. Turbulence is a random motion process that changes irregularly in time, but it has a regular probability distribution. Therefore, this paper uses probability density distribution to analyze the statistical characteristics of the piston air flow in each transport lane [29]. Three feature points with different distances from the entrance of the lane were selected along the central axis of the three transport lanes of 1765.0 m, 1584.0 m and 1414.0 m, respectively, for wind speed probability density statistics, and they were compared with the probability density distribution of normal distribution function by Formula (3). The results are shown in Figure 14, Figure 15 and Figure 16.

Figure 14.
Probability density of characteristic points of 1765.0 m transport lane: (a) Point one, (b) Point two, (c) Point three.

Figure 15.
Probability density of characteristic points of 1584.0 m transport lane: (a) Point one, (b) Point two, (c) Point three.

Figure 16.
Probability density of characteristic points of 1414.0 m transport lane: (a) Point one, (b) Point two, (c) Point three.
In the formula, p(x) is the probability density; x is the instantaneous airflow velocity of a point; μ is the sample average; is the standard deviation of the sample size.
From the diagram, we can see that the probability density curve of the feature points in each transport lane is basically consistent with the trend of the normal distribution curve, but it does not completely coincide. The main reason is that the airflow field in the transport lane is affected by the piston wind in the cage running in the shaft, and the airflow pattern becomes very complicated. The vortex structure generated by the entrainment of the local high-speed piston flow along the path has a large disturbance to the air flow in the transport lane, which will cause changes in the size and direction of the air flow velocity in the area. Therefore, the probability density distribution curve of each feature point has a certain deviation from the normal distribution.
4. Conclusions
- The piston wind generated by the operation of double cages in the shaft seriously affects the stability of the airflow structure in the transport lane. The high-speed vortex area in front of the cage can promote the ventilation effect in the lane, and the low-speed vortex area in the tail hinders airflow transportation in the lane. During the intersection of the two cages, the blockage ratio of the wellbore increases, the ventilation area decreases, and the ventilation volume in the whole lane decrease.
- The piston effect has a transient effect on the pressure and velocity in each transportation lane. The high- and low-speed airflow generated continuously disturbs the airflow transportation in the lane, causing the airflow distribution to be disordered and reducing the ventilation effect. Each transport lane is affected by the piston wind at different degrees, and the most serious is the 1765.0 m lane. The influence intensity of piston wind in the same transportation lane decreases with the increase of influence distance.
- Under the influence of the piston effect, there is a deviation between the probability density distribution curve of wind speed in the transportation lane and the normal distribution. The entrained flow caused by piston wind causes the velocity and direction of airflow in the local area of the lane to change greatly, which will hinder the normal transportation of fresh airflow.
Author Contributions
Conceptualization, D.H.; methodology, D.H. and X.W.; software, C.G. and H.L.; validation, D.H.; data curation, Y.Z. and D.H.; writing—original draft preparation, D.H.; writing—review and editing, D.H., X.W. and C.G.; visualization, H.L. and Y.Z.; funding acquisition, X.W. All authors have read and agreed to the published version of the manuscript.
Funding
This research was funded by the Kunming University of Science and Technology Introduced Talent Research Startup Fund Project (Funding Number KKSY201721032).
Institutional Review Board Statement
Not applicable.
Informed Consent Statement
Not applicable.
Data Availability Statement
Provide relevant data upon request.
Conflicts of Interest
The authors declare no conflict of interest.
References
- Du, B.; Zhang, B.; Feng, H. Development Status and Tendency of Mine Hoisting Equipments. Mine Mach. 2016, 44, 1–7. [Google Scholar] [CrossRef]
- He, M. Study on Lifting Dynamics of Deep Well. Adv. Mech. 2021, 51, 702–728. [Google Scholar]
- Xie, Z. Study on Stability of Complex Mine Ventilation System; China University of Mining and Technology: Beijing, China, 2015. [Google Scholar]
- Tian, F. Study on Operation Effect and Aerodynamic Characteristics of Wellbore Lifting Container; Hunan University of Science and Technology: Xiangtan, China, 2007. [Google Scholar]
- Kim, J.Y.; Kim, K.Y. Experimental and Numerical Analyses of Train-Induced Unsteady Tunnel Flow in Subway. Tunn. Undergr. Sp. Technol. 2007, 22, 166–172. [Google Scholar] [CrossRef]
- Li, W.; Liu, T.; Chen, Z.; Guo, Z.; Huo, X. Comparative Study on the Unsteady Slipstream Induced by a Single Train and Two Trains Passing Each Other in a Tunnel. J. Wind Eng. Ind. Aerodyn. 2020, 198, 104095. [Google Scholar] [CrossRef]
- Chu, C.R.; Chien, S.Y.; Wang, C.Y.; Wu, T.R. Numerical Simulation of Two Trains Intersecting in a Tunnel. Tunn. Undergr. Sp. Technol. 2014, 42, 161–174. [Google Scholar] [CrossRef]
- Izadi, T.; Mehrabian, M.A.; Ahmadi, G.; Abouali, O. Numerical Analysis of the Mirco-Particles Distribution inside an Underground Subway System Due to Train Piston Effect. J. Wind Eng. Ind. Aerodyn. 2021, 211, 104533. [Google Scholar] [CrossRef]
- Wang, D. Study on Piston Wind Characteristics of Underground Mine Transportation Shaft; Central South University: Changsha, China, 2010. [Google Scholar]
- Wang, C.; Wu, C. Numerical Simulation of Piston Wind Due to Mine Conveyance Based on Motion Reference Frame. J. China Coal Soc. 2007, 32, 838–841. [Google Scholar]
- Li, Y. Study on Characteristics of Piston Wind in Underground Mine Tunnel and Its Influence on Stability of Ventilation System; Jiangxi University of Science And Technology: Ganzhou, China, 2018. [Google Scholar]
- Wang, H.; Tian, F.; Huang, J.; Chen, T. Numerical Simulation of Flow around Mine Shaft Hoisting Equipment. China Saf. Sci. 2006, 16, 29–33+147. [Google Scholar]
- He, D.; Teng, X.; Chen, Y.; Liu, B.; Wu, J. Piston Wind and Energy Saving Based on the Analysis of Fresh Air in the Subway System. Sustain. Energy Technol. Assess. 2022, 50, 101805. [Google Scholar] [CrossRef]
- Bell, J.R.; Burton, D.; Thompson, M.C.; Herbst, A.H.; Sheridan, J. Moving Model Analysis of the Slipstream and Wake of a High-Speed Train. J. Wind Eng. Ind. Aerodyn. 2015, 136, 127–137. [Google Scholar] [CrossRef]
- Wang, K.; Zhang, X.; Wang, L.; Li, L.; Zhang, M.; Zhou, A. Experimental Study on Propagation Law of Shock Wave and Airflow Induced by Coal and Gas Outburst in Mine Ventilation Network. Process Saf. Environ. Prot. 2021, 151, 299–310. [Google Scholar] [CrossRef]
- Cross, D.; Hughes, B.; Ingham, D.; Ma, L. A Validated Numerical Investigation of the Effects of High Blockage Ratio and Train and Tunnel Length upon Underground Railway Aerodynamics. J. Wind Eng. Ind. Aerodyn. 2015, 146, 195–206. [Google Scholar] [CrossRef]
- Moreno, T.; Pérez, N.; Reche, C.; Martins, V.; de Miguel, E.; Capdevila, M.; Centelles, S.; Minguillón, M.C.; Amato, F.; Alastuey, A.; et al. Subway Platform Air Quality: Assessing the Influences of Tunnel Ventilation, Train Piston Effect and Station Design. Atmos. Environ. 2014, 92, 461–468. [Google Scholar] [CrossRef]
- Zhang, H.; Zhu, C.; Liu, M.; Zheng, W.; You, S.; Li, B.; Xue, P. Mathematical Modeling and Sensitive Analysis of the Train-Induced Unsteady Airflow in Subway Tunnel. J. Wind Eng. Ind. Aerodyn. 2017, 171, 67–78. [Google Scholar] [CrossRef]
- Yao, Z.; Zhang, N.; Li, X.; Liu, Z. Simulation on Unsteady Crosswind Forces of a Moving Train in a Three-Dimensional Stochastic Wind Field. Appl. Sci. 2022, 12, 12183. [Google Scholar] [CrossRef]
- Sun, Y.; Xu, C.; Hao, R.; Du, G. Lateral Aerodynamic Force Research on Double Skips Operating Characteristics Based on CFD Moving Mesh Grid. J. Xian Univ. Sci. Technol. 2016, 36, 127–131. [Google Scholar]
- Wu, C.; Deng, Q.; Li, N. Numerical Simulation of Laneway Piston Pind under Different Influence Factors Based on Dynamic Mesh. China Min. Mag. 2015, 24, 110–114. [Google Scholar]
- Wang, W.; Gui, D.; Xu, Z. Study on Piston Wind Power Effect of Mine Shaft Hoisting Equipment. China Coal 2017, 43, 74–78. [Google Scholar]
- Sridharan, S.J.; Sastry, B.S. New Prediction Models for Estimation of Aerodynamic Pressure Loss Due to a Train of Mine Cars in an Underground Airway. Min. Metall. Explor. 2020, 37, 1571–1582. [Google Scholar] [CrossRef]
- Moshfeghi, M.; Song, Y.J.; Xie, Y.H. Effects of Near-Wall Grid Spacing on SST-K-ω Model Using NREL Phase VI Horizontal Axis Wind Turbine. J. Wind Eng. Ind. Aerodyn. 2012, 107–108, 94–105. [Google Scholar] [CrossRef]
- You, Y.; Seibold, F.; Wang, S.; Weigand, B.; Gross, U. URANS of Turbulent Flow and Heat Transfer in Divergent Swirl Tubes Using the K-ω SST Turbulence Model with Curvature Correction. Int. J. Heat Mass Transf. 2020, 159, 120088. [Google Scholar] [CrossRef]
- Luo, C.; Wei, Z.; Chen, J.; Liu, L.; Yu, Y. Influence of Vibration Dampers on the Vortex-Induced Force and Flow Characteristic of Deep-Water Jacket Pipe. Appl. Sci. 2022, 12, 10219. [Google Scholar] [CrossRef]
- Gilbert, T.; Baker, C.J.; Quinn, A. Gusts Caused by High-Speed Trains in Confined Spaces and Tunnels. J. Wind Eng. Ind. Aerodyn. 2013, 121, 39–48. [Google Scholar] [CrossRef]
- Wang, F.; Liu, F.; Han, J.; Jin, H.; Weng, M.; Zeng, Z. Study on the Train-Induced Unsteady Airflow in a Metro Tunnel with Multi-Trains. Tunn. Undergr. Sp. Technol. 2020, 106, 103565. [Google Scholar] [CrossRef]
- Zhong, L.; Jiang, T.; Zhang, J.; Liu, J. PIV Experimental Study on Velocity Fluctuations of Turbulent Flow in Open Channel. Adv. Eng. Sci. 2019, 51, 84–93. [Google Scholar] [CrossRef]
Disclaimer/Publisher’s Note: The statements, opinions and data contained in all publications are solely those of the individual author(s) and contributor(s) and not of MDPI and/or the editor(s). MDPI and/or the editor(s) disclaim responsibility for any injury to people or property resulting from any ideas, methods, instructions or products referred to in the content. |
© 2023 by the authors. Licensee MDPI, Basel, Switzerland. This article is an open access article distributed under the terms and conditions of the Creative Commons Attribution (CC BY) license (https://creativecommons.org/licenses/by/4.0/).