Abstract
The free-piston engine is a type of none-crank engine that could be operated under variable compression ratio, and this provides it flexible fuel applicability and low engine emission potential. In this work, several 1-D engine models, including conventional gasoline engines, free-piston gasoline engines and free-piston hydrogen engines, have been established. Both engine performance and emission performance under engine speeds between 5–11 Hz and with different equivalent ratios have been simulated and compared. Results indicated that the free-piston engine has remarkable potential for NOx reduction, and the largest reduction is 57.37% at 6 Hz compared with a conventional gasoline engine. However, the figure of NOx from the hydrogen free-piston engine is slightly higher than that of the gasoline free-piston engine, and the difference increases with the increase of engine speed. In addition, several factors and their relationships related to hydrogen combustion in the free-piston engine have been investigated, and results show that the equivalent ratio is a vital point that affects NOx production, and the ignition advance timing could also affect combustion duration, the highest in-cylinder temperature and NOx production to a large extent.
1. Introduction
1.1. Background and Recent Research
NOx emissions are known as one of the most important engine emission components that not only affect the atmospheric environment but also do harm to the human body. NOx that is produced from internal combustion engines is comprised of , and , and when the combustion temperature is higher than 1800 K, some of the nitrogen in the air would become liable to be oxidised into NOx. Moreover, under the severe energy shortage, conventional internal combustion engines are on the verge of being eliminated [1,2], and in the meantime, the free-piston engine has been taken as an excellent substitute for conventional internal combustion engines thanks to its higher efficiency, lower emissions and adaptability to all types of fuel [3]. For the free-piston engine, the elimination of the crankshaft system and the reduction of mechanical components significantly reduce the complexity of the engine [4]. This brings plenty of advantages: high piston speed around top dead centre (TDC) and a fast power stroke expansion enhance fuel-air mixing and reduces the time available for heat transfer losses and the formation of temperature-dependent emissions, such as nitrogen oxides (NOx). The frictional losses should be reduced due to the simplified mechanism and the elimination of the piston side force in conventional reciprocating engines, potentially lower maintenance costs due to a compact design and a multi-fuel/combustion mode operation due to the possibility of a variable compression ratio [5].
Thanks to the multi-fuel/combustion mode operation, hydrogen, which is considered to be one of the most economically viable and high-functioning clean energies of the future, could be successfully applied in the free-piston engine. In recent years, hydrogen application on the FPE has attracted considerable research interest, and a great deal of research work has been conducted by scholars and research institutions around the world.
Yuan et al. investigated the performance of a spark-ignited hydrogen-fuelled FPEG (free-piston engine generator) at Chongqing Jiaotong University [6]. Their results indicated that the hydrogen engine moves with higher velocity and acceleration around the top dead centre (TDC), compared to a corresponding conventional hydrogen engine, which induces lower heat transfer loss and less NO production due to the limited time available. They also found that the combustion rate of hydrogen fuel in the new engine is slower and the combustion duration lasts longer than that in the conventional engine, leading to more intense post-combustion and a lower level of isochoric heat release. They pointed out that the indicated thermal efficiency of the new hydrogen engine is disadvantageous, and it requires proper combustion to accommodate its special piston motion. Feng et al. compared the performance of a spark-ignited gasoline-fuelled FPEG with a conventional gasoline engine at the Beijing Institute of Technology [7]. The results found that the gasoline fuel combusting in the FPEG reacts slower and has a lower peak heat release rate than that in the conventional engine. The thermal efficiency was lower because less heat was released around the TDC. In addition, the diesel fuel combustion in FPEG was experimentally studied by Yuan et al. [8,9]. The features of diesel FPEG are similar to those of hydrogen FPEG. The slow heat release process, intense post-combustion and low thermal efficiency also occur in the diesel FPEG.
Globally, several studies have reported the shortcomings of combustion and the efficiency of hydrogen FPEG. Therefore, effectively avoiding the shortcomings is the key issue to advancing the technological progress of the hydrogen FPEG. As a widely used technique in a natural gas engine to improve the combustion of natural gas, diesel pilot-ignition (DPI) technology has the potential to realise the purpose of accelerating combustion through the application of “multi-point ignition” [10,11]. The engine in which natural gas acts as the main fuel and diesel acts as the small pilot-ignition fuel is called the diesel pilot-ignited natural gas engine. In the intake stroke, the homogeneous mixture of natural gas and air enters the cylinder, and in the compression stroke, when the piston approaches the TDC, the injector sprays a small amount of ignition diesel.
Moreover, in 2018, Yuan et al. tried adding different proportions of hydrogen to the FPE (free-piston engine) through intake ports; the different piston displacements and boundary conditions would be obtained by multiple iterations [12]. Hydrogen can accelerate the combustion speed of the mixture in the cylinder; on the other hand, the compression ratio, movement frequency and residual exhaust gas coefficient that vary with hydrogen content also make the mixing and combustion processes change. These factors have different effects on the combustion and emissions of the FPE. Adding some hydrogen to the diesel FPE has an impact on the evaporation, breakup, collision and wall interaction processes of diesel fuel, which change the combustion process in the cylinder. Moreover, the pressure, temperature and oxygen concentrations change accordingly due to the combustion of hydrogen, which eventually leads to different emission performances under the conditions of variable RH2 compared with the condition of pure diesel. In diesel engines, the emissions of CO and HC are very limited. In addition, because of the high diffusivity of hydrogen fuel, the mixture of diesel and air would be more uniform, and the combustion condition in the cylinder would be further improved. As a result, the emissions of CO and HC are further reduced, and the main emissions would be NO and soot production only.
Ugochukwu Ngwaka, Dr. Smallbone and their research team have conducted a comprehensive experiment globally for the first time: a first-of-its-kind hydrogen-fuelled dual-piston FPEG is experimentally investigated in both two-stroke and four-stroke thermodynamic cycles [13]. They found that the four-stroke cycle mode exhibits slightly higher peak in-cylinder pressure and higher overall in-cylinder pressure from the peak pressure position to the BDC (bottom dead centre) when compared to the two-stroke cycle mode. It can be observed that combustion is longer in four-stroke cycle compared to the two-stroke cycle, and the reason for higher in-cylinder combustion pressure and longer combustion time observed in the four-stroke cycle is because of the superior charge mixture capability and higher scavenging efficiency inherited in the four-stroke cycle process. In four-stroke mode, the FPEG produced 13% more indicated efficiency as compared to the two-stroke mode of operation. For the emission section, the nitrogen oxide emission analysis from the FPEG at an operating frequency of 5 Hz and an equivalence ratio of 0.4365. The two-stroke mode of FPEG produces NOx emissions of 44 ppm, which are less than the four-stroke mode NOx emission of 84 ppm. This is mainly due to the in-cylinder temperature, which is higher in the four-stroke cycle than in the two-stroke cycle.
1.2. Aims and Objectives
Existing research on the NOx emission of a hydrogen free-piston engine and its influence factors is relatively limited; thus, the major aim of this work is to deeply investigate the NOx emission performance of the hydrogen free-piston engine and investigate the relationships and regulation of some other factors (e.g., equivalent ratio, ignition advance timing) that affect NOx as well and how they affect NOx. The results can reveal part of the regulation of NOx emissions as long as the combustion characteristics of hydrogen-fuelled engines, help effectively predict and control NOx emissions in the future.
2. Simulation Work
2.1. Method Description
The schematic configuration of the FPEG prototype shown in Figure 1 and Figure 2 shows the actual prototype developed at Newcastle University [13]. There are two main components: an internal combustion engine, which is comprised of two opposed cylinders that are located at opposite ends, each with its corresponding combustion chamber; and a linear generator. The linear electric machine continues to run as a motor until stable operation is achieved. However, once the engine is operating at steady state, the “motor” mode will be switched to “generator” mode. A detailed description and engine theory have been presented by Dr. Ngwaka et al. [13].
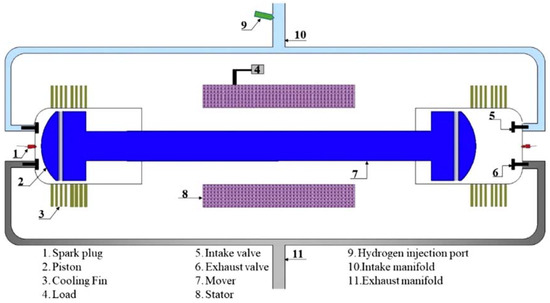
Figure 1.
Prototype schematic configuration [13].
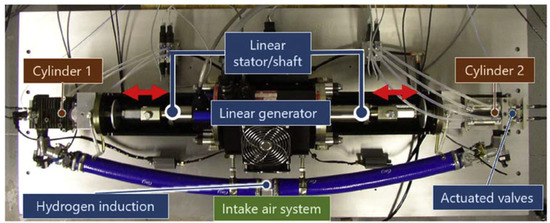
Figure 2.
Actual FPEG prototype in Newcastle University [13].
Modelling and simulation in the Ricardo WAVE programme flow module are carried out using three programme segments: WAVEBuild (pre-processor), WAVE (solver) and WAVEPost (post-processor). WaveBuild is a key preparatory handler flow used to simulate the original settings. The programme uses its graphical interface design to define the geometric properties and initial conditions of the model, which is then transformed into a key in a file format suitable for the solver. WAVE is the solver used in this analysis to obtain all one-dimensional dynamics and thermodynamic time-dependent equations. Finally, after applying WavePost, the CPU can query and express the results in the form of 2D or 3D graphics, photos, text reports or other news media.
The prototype in the laboratory is a 65-cc free-piston engine, so using Ricardo WAVE to obtain the final model of the free piston engine requires three steps, as shown in Figure 3 below. Initially, a baseline mock-up of a 31-cc four-stroke engine was certified for the findings reported by Knaus et al. [14]. Since there is no baseline characteristic curve for a 65-cc crankshaft car engine, this certification is essential before a 65-cc physical model is developed and designed.
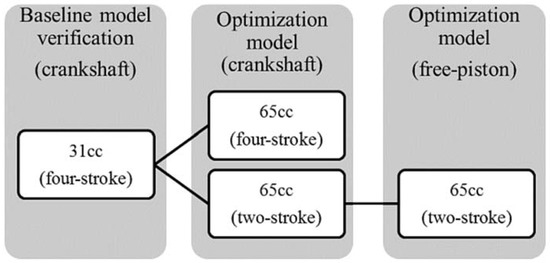
Figure 3.
Types of models developed for the research.
Changes to the baseline mock-up allowed for the development and design of a mock-up of a 65-cc engine crankshaft engine. Since the 65-cc version numbers usually have a similar design, it is assumed that the baseline engine model can be resized appropriately from the 31-cc car engine version number. In order to better ensure that this assumption is reasonable, the maximum power of the car engine in the manufacturer’s specification model is compared with the output power curve shown in Figure 4, which is obtained from simulation research. The maximum power and corresponding efficiency are found to be closely paired with the manufacturer-spec model (2.3 kW at 7200 rpm).

Figure 4.
The 31 cc-baseline model.
This kind of 65-cc automobile engine, with a four-stroke engine crankshaft model, is converted to the two-stroke cycle system version number according to the following method:
- Simply change the 4 strokes to 2 for each circulatory system in the WAVE equipment (indicating a 2-stroke circulatory system);
- Change and adjust intake and exhaust engine timing;
- Lift crankcase and scavenging sub-entity models.
The mock-up was then tuned to achieve the highest braking system thermal efficiency and power output in the lower vehicle speed range (i.e., from 600 to 3600 rpm). This particular speed range was chosen because the standby speed of the free piston engine is estimated to be 10 Hz (equivalent to 600 rpm), while the maximum power generation capacity is estimated to be around 50~60 Hz (equivalent to 3000~3600 rpm). The choice of this operating rate lies in the motor design reported by Arshad [15]. Therefore, it was rated as the basic policy of this scientific research.
Finally, the lifted 65-cc two-stroke crankshaft car engine model was transformed into a free piston engine operation based on the mandatory piston sprout model.
2.2. Baseline Gasoline Engine Modelling and Validation Process
2.2.1. 31-cc Baseline Modelling
The baseline model was developed from the information obtained in the paper by Knaus et al. [14] for a 31-cc version of the Stihl 4-MIX engine, which inherited a similar design to the 65-cc version selected for the prototype. The engine specifications are shown in Table 1, and the model is shown in Figure 3. The engine uses a carburettor while in the model a proportional fuel injector was used instead, enabling air-fuel ratio control to be implemented. A proportional injector will always inject sufficient fuel into the intake air stream to match a targeted air-fuel ratio, similar to the carburettor principle.

Table 1.
The engine specifications of the 31-cc version of the Stihl 4MIX engine.
2.2.2. Validation with Data from Literature
The model was validated using the reported power curve by Knaus et al. [14], and the results are shown in Figure 1, which show excellent correlation between the simulation and experimental for the engine speed from 5000 to 8000 rpm.
The error between the reported experimental results and the simulation using WAVE was less than 2% for engine speeds below 9000 rpm, while at speeds beyond 8500 rpm, the error increased sharply to 8%.
The HC + NOx emission between the 31-cc baseline WAVE model and the experimental data from Knaus et al. [14] are illustrated in Figure 5. The errors are constantly less than 5%, and the emission result is a vital factor in this research; therefore, this baseline model could be considered suitable and reliable.
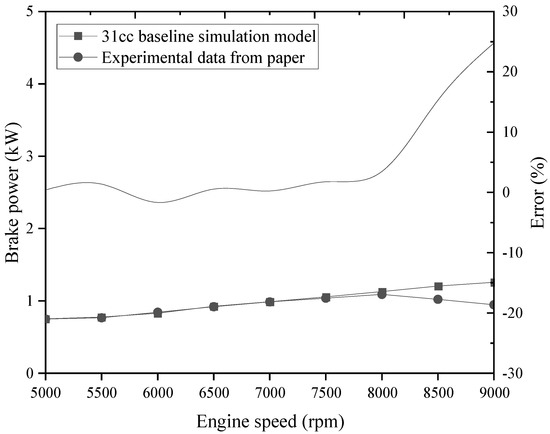
Figure 5.
Power curves comparison from experimental results as obtained from the Ricardo WAVE simulation.
2.2.3. 65-cc Engine Modelling
Generally speaking, the 31-cc model becomes larger to the 65-cc model due to the similar design of the car engine in these two categories. In addition, the ratio of the total cylinder area of the two engines is in line with the data information of the design scheme based on the work experience of Taylor [16] for the flat cylinder head. The experience with the cylinder geometry values for the two engine types is given in Table 2 for a small to medium-sized four-stroke engine with 2 cylinders and a flat head design, and the specifications of the 65-cc engine model are given in Table 3.

Table 2.
Empirical design data for valve capacity and head design in relation to the actual design for the 31-cc and 65-cc Stihl 4MIX engines.

Table 3.
The 65 cc version of the Stihl 4MIX engine selected for the design.
The reciprocating sub-entity model imposed on is used to cover the gear/roller sub-entity model to simulate automotive engines with novel reciprocating motion profiles, such as rotary, opposed or in this case free piston engines. After being defined, this piston part is used to measure the volume of the combustion chamber of the engine. To apply this sub-entity model in this way, it is important to define a set of gear angle values with corresponding piston parts in the configuration file editor shown in Figure 6.
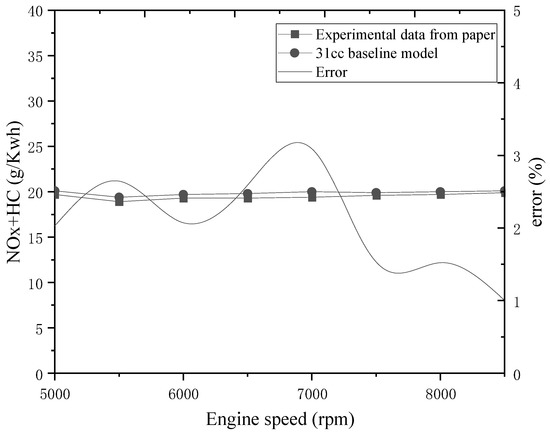
Figure 6.
HC + NOx emissions comparison from experimental results as obtained from the Ricardo WAVE simulation.
The applied gear angle value must encompass the full cycle system of the car engine while taking care not to exceed the large scale allowed (721 points) and not exceed the four-stroke defined for the car engine to make the results more meaningful.
2.2.4. Validation with Data from Literature
The experimental data is the result of the 31-cc engine obtained above, the 65-cc version number of the mock-up enlargement, and the characteristic investigation certification. In addition to this, the initial 65 cc Stihl 4MIX has a peak output of 2.3 kW at 7200 rpm based on the manufacturer’s data, which can be used to certify the physical model. The output power curve of a 65-cc car engine obtained from the simulation is shown in Figure 7 below, which outlines a typical output power curve. In addition to this, the maximum power is 2.4 kW and occurs around 6500 rpm, which is almost consistent with the manufacturer’s data as shown in Figure 8. After another series of parametric studies and valve timing optimization, this 65-cc free-piston engine baseline model was successfully established and validated.
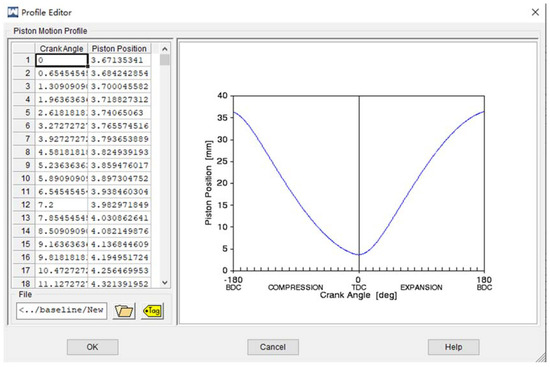
Figure 7.
Profile editor for piston motion profile to model free-piston engine.
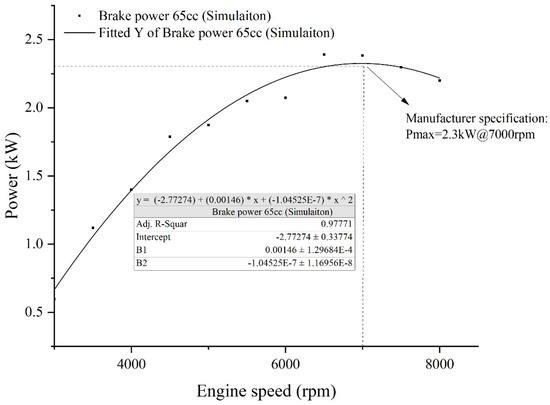
Figure 8.
Fitted power curve of the four-stroke 65-cc engine as obtained from the Ricardo WAVE simulation.
2.3. Hydrogen Free-Piston Engine Modelling and Validation
2.3.1. Engine Modelling
In this work, the experiment conducted by Dr. Ugo et al. is taken as the base of all simulation experiments; the development and validation work are presented in the following section, and the specifications of this FPE prototype are given in Table 4. The engine scale is the same as the baseline model presented above. On the basis of this, a hydrogen free-piston engine model was established by Ricardo WAVE based on the 65-cc gasoline free-piston engine baseline model by amending several parameters such as the compression ratio, the equivalent ratio and the valve timing.

Table 4.
Hydrogen FPE prototype specifications.
2.3.2. Validation with Prototype in the Group
The effects of operational frequency on peak pressure, peak pressure timing, indicated work, indicated power and indicated efficiency at an equivalence ratio of 0.4365 (at 11 STL/min hydrogen flowrate and 60 STL/min air flowrate) are all investigated separately in Ugo’s experiment, and this research will take the indicated power results [13], as control data to validate the WAVE model.
As the indicated power result from Ugo is obtained in four-stroke cycle mode, an amendment of the two-stroke free-piston engine WAVE model to a four-stroke one is inevitable. Once the model is perfectly changed into a four-stroke model, the indicated power results in WAVEpost can be used for validation, and through the validation work conducted between two four-stroke engine data, the two-stroke FPE engine WAVE model is also validated on the indicated power aspect. The comparison between the indicated power results from the experiment by Ugo and the WAVE model is shown in Figure 9. The indicated power increased with increase in operational frequency for both sources, and the error between them, which is constantly lower than 5% (the biggest error, 4.85%, occurs at the operational frequency of 8 Hz). So far, the indicated power obtained from WAVE is highly consistent with that obtained from the experiment of Ugo, and this is an important part of the validation process.
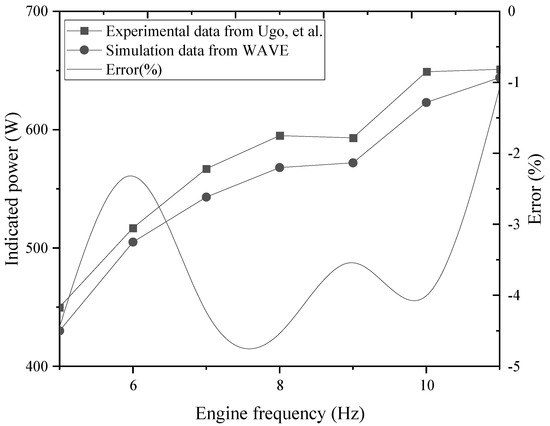
Figure 9.
Indicated power comparison between the WAVE model and experimental data.
2.3.3. Validation of Heat Release Model
Heat release rate is a function of viscosity, density, calorific value, latent heat of fuels, burning velocity of fuels and combustion temperature. The heat release rate consists of premixed combustion, controlled combustion and late combustion. The heat release rate is derived from the first law of thermodynamics, assuming it to be an open system. As the heat release rate and cumulative heat release describe the details of the combustion process, it is necessary to calculate these two figures for the two-stroke free-piston engine of Ugo. According to the parameters and data profile provided, the calculation procedure is as follows.
The starting point for calculating the heat release rate and cumulative heat release from the indicator diagram is the first law of thermodynamics. When calculating the heat release rate and cumulative heat release, the zero-dimensional combustion model is adopted, and the mixture is considered to be evenly distributed in the cylinder. Part of the heat released by fuel combustion is used to improve the internal energy of the gas in the cylinder and to do external work. Part of the heat is transmitted to the wall of the combustion chamber to form heat dissipation loss. The formula for the heat balance at any moment in the combustion process is:
where is heat released by fuel before this instant; is heat absorbed by in-cylinder gas before this instant; is heat transferred to the cylinder wall before this instant; , where is the internal energy of the in-cylinder gas at the beginning of calculation; is the work done by the gas from the beginning of calculation to this instant.
Within the step length of crank angle: , in order to calculate the heat release , it could be calculated from the practise test indicator diagram and obtain internal energy change , the work done and heat dissipation .
The goal in defining heat capacity is to relate changes in the internal energy to measured changes in the variables that characterise the states of the system. For a system consisting of a single pure substance, the only kind of work it can do is atmospheric work, and so the first law reduces to:
Suppose now that U is regarded as a function U (T, V) of the independent pair of variables T and V. The differential quantity dU can always be expanded in terms of its partial derivatives according to:
where the subscripts denote the quantity being held constant when calculating derivatives. Substituting this equation into then yields the general expression:
for the path-dependent heat. The path can now be specified in terms of the independent variables T and V. For a temperature change at constant volume, dV = 0, by definition of heat capacity,
The above equation then immediately gives
for the heat capacity at constant volume, showing that the change in internal energy at constant volume is entirely due to the heat absorbed.
According to the above, for the internal energy change in this model,
where and are the amount of substance in the in-cylinder working medium(kmol)at the instant and the starting point of compression; and are the average constant-volume specific heat (kJ/kmolK) at the instant and the starting point of compression; and are the temperature of the in-cylinder working medium (K) at the instant and the starting point of compression.
where r is the coefficient of residual gas; is the amount of fuel injected per cycle; is the theoretical needed amount of air for fuel combustion; a is the coefficient of excess air; is the percentage of burned fuel until this crank angle; is the kilogram molecular weight of fuel,
where , and are the weights of C, H and O in 1 kg fuel, and in this research,
Within the compression and expansion processes, the models for both side cylinders are identical. The in-cylinder gas pressure is calculated by applying the First Law of Thermodynamics to the cylinder charge:
where U is the internal energy of the in-cylinder gas (J); V is the volume of the cylinder (); is the heat released from the combustion process (J); is the heat transferred to the cylinder wall (J); is the enthalpy of the intake air (J); is the enthalpy of the exhaust air (J); is the enthalpy of the air leaked from the piston rings (J).
When the intake and exhaust ports are both closed, the energy conservation equation can be written as:
As the in-cylinder charge is assumed to be an ideal gas, its internal energy is a function of temperature only, giving
The differential form of the equation above is derived as
where is the mass of the in-cylinder gas (kg); is the specific heat capacity at constant volume (J/kg K) that is considered constant through the temperature range; T is the temperature of the in-cylinder gas (K).
As the in-cylinder gas follows the ideal gas equation,
The ideal gas state equation is formulated in its differential form for further deriving the model.
Using Mayer’s relation for the ideal gas;
where is the heat capacity at constant pressure, which is again considered constant through the temperature range.
The ratio of heat capacity is expressed as
where is the ratio of heat capacities.
The following correlation can be derived from Equation (20), which can be used to calculate the in-cylinder gas pressure during the compression, combustion and expansion processes.
The average constant-volume specific heat could be calculated according to the average molar specific heat at constant volume ; molar specific heat at constant volume of pure combustion products and the percentage of pure combustion products in mix gas .
where:
where is the theoretical molecular change coefficient of complete combustion when fuel and air are mixed according to chemical reaction equivalence ratio;
where , and are pure combustion products; , and are air coefficients; T is the temperature of the in-cylinder working medium.
According to the in-cylinder pressure in the indicator diagram:
The in-cylinder charge temperature and the flow pattern vary enormously through the cycle. Both of these variables have a major influence on heat transfer. During the intake process, the intake charge is usually cooler than the walls and the flow velocity is high. During compression, the charge temperature rises above the wall temperature and the gas velocity decreases; therefore, heat is then transferred from the cylinder gas to the chamber walls. The heat transfer between the cylinder walls and the in-cylinder gas is modelled according to Hohenber [17]:
where is heat flow rate (J/s); is the coefficient of heat transfer (W/); Acylis area of the in-cylinder surface in contact with the gas (); Tw is the average surface temperature of the cylinder wall (K).
The heat transfer coefficient is given:
where V is the instantaneous cylinder volume (); is the average piston speed (m/s).
Figure 10 and Figure 11 illustrate the comparison of heat release rate and cumulative heat release calculation results between the MATLAB model and the WAVE model, and the MATLAB simulation model was built based on the experimental data from Ugo and the above equations, and the WAVE model was developed from the two-stroke 65-cc gasoline free-piston engine model, which is presented above. If the WAVE hydrogen free-piston model is adequately validated, the subsequent simulation work towards emission performance can be proceeded.
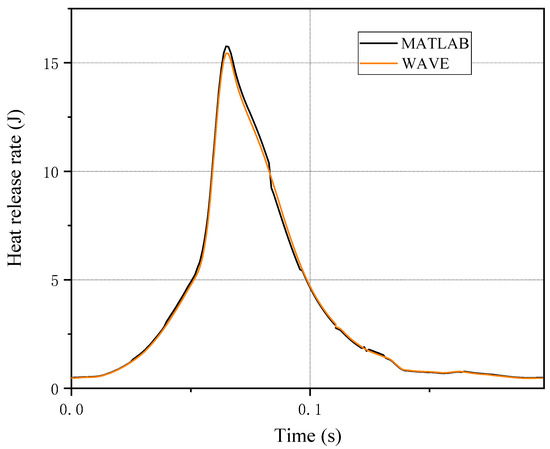
Figure 10.
Heat release rate comparison between MATLAB and WAVE.
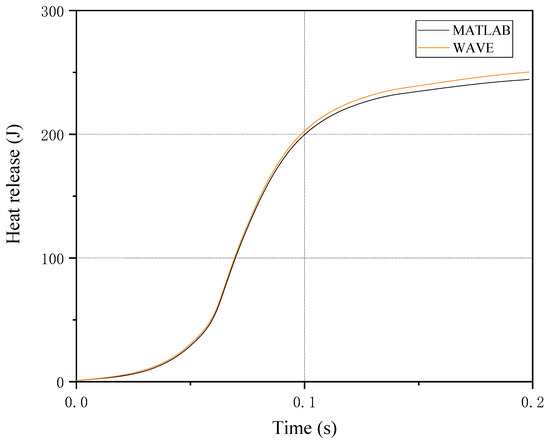
Figure 11.
Cumulative heat release comparison between MATLAB and WAVE.
As illumination, the heat release rate obtained from the MATLAB model is highly consistent with that obtained from the WAVE model, and the highest error value occurs at the top point before TDC. After calculation, the biggest error between the heat release rate of both simulation models is 2.34%. The same situation appears in cumulative heat release comparison: two heat release curves almost coincide in the first half of the operation process and the figure simulated by WAVE begins slightly higher than that simulated by MATLAB, but the eventual value of the cumulative heat release is also nearly the same. The highest error value of 2.46% occurs at the end of the whole cycle. Therefore, this two-stroke hydrogen free-piston engine model developed by Ricardo WAVE has been adequately validated by previous experimental experience, and emission performance can be further investigated and presented in the following section.
3. Simulation Results
3.1. NOx Emission Comparison
Thanks to the fuel specialty of hydrogen (which contains H only), the only type of emission that requires concern is NOx. Figure 12 illuminates NOx emission from the two-stroke and four-stroke hydrogen free-piston engine WAVE model under the equivalence ratio of 0.4365 and compression ratio of 3.7, and the engine frequency from 5 Hz to 11 Hz.
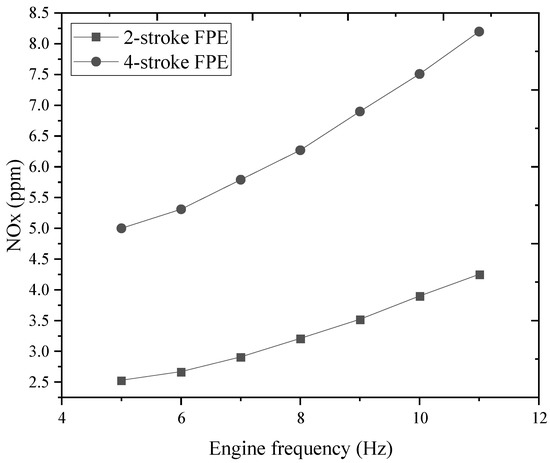
Figure 12.
NOx emission comparison between 2- and 4-stroke hydrogen FPE.
NOx is a type of high temperature emission, and the formation of NOx emission increases with the increase of the combustion temperature when the in-cylinder temperature is higher than 1800 K.
Therefore, when the engine speed (frequency) increases, the value of NOx emission increases simultaneously. The NOx emission of the four-stroke FPE model is nearly doubled compared to the two-stroke FPE model, and this result is slightly lower than what was obtained by Ugo.
A comparison between the NOx emissions of this two-stroke hydrogen FPE model, the baseline two-stroke gasoline FPE model and the baseline two-stroke gasoline conventional engine model is presented in Figure 13. The equivalent ratios of the engines shown in Figure 13 are pre-set as 1.0, as the stoichiometric air/fuel ratio of gasoline is 14.7 and that of hydrogen is 34.3, so the air/fuel ratio that is pre-set in Ricardo WAVE: , . It is obvious in Figure 13 that conventional spark-ignition gasoline engines produce the largest amount of NOx, and the NOx emissions produced from gasoline free-piston engines and hydrogen free-piston engines are quite similar. Comparing with a conventional spark-ignition gasoline engine and free-piston engine, the NOx reduction potential is remarkable for the FPE; the reduction ranges are all higher than 51% from the engine frequency of 5 Hz to 11 Hz, and the largest reduction of 57.37% occurs at 6 Hz. It is worth mentioning that in the free-piston engine, gasoline produces less NOx emissions compared with hydrogen, but the difference is relatively small. The difference of NOx emissions of gasoline and hydrogen FPE increases with the increasing engine frequency, and the figure reaches 10.97% at 11 Hz.
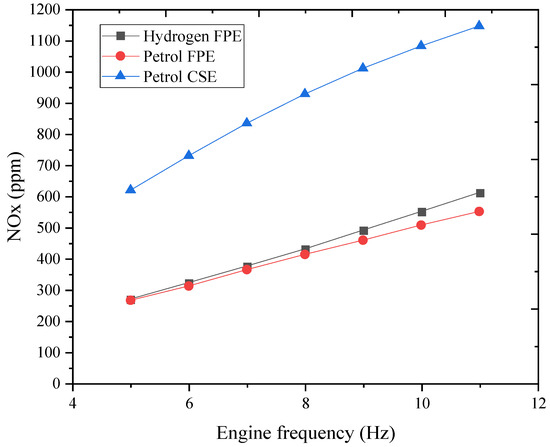
Figure 13.
NOx emission comparison between three models.
The reason that NOx emissions from hydrogen free-piston engines are higher than gasoline free-piston engine can be seen in Figure 14. As shown in Figure 14, the highest in-cylinder temperature in the gasoline FPE and hydrogen FPE is under the air/fuel ratio of ,. For each engine frequency, the highest in-cylinder temperature of hydrogen FPE is slightly higher than that of gasoline FPE, and the temperatures are all higher than 2000 K, which has been mentioned above; NOx emission is strongly affected by temperature.
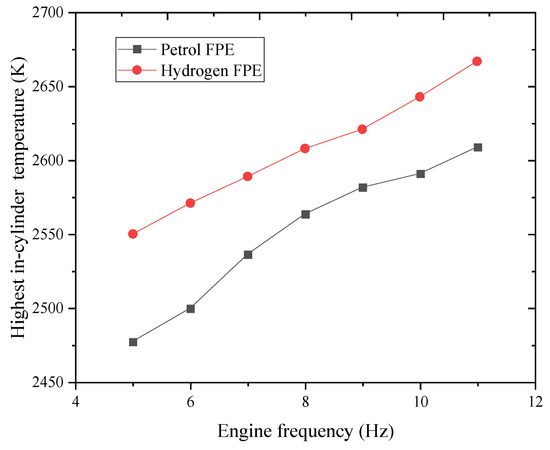
Figure 14.
Highest in-cylinder temperature of gasoline FPE and hydrogen FPE.
3.2. Regulation between NOx Emission and Equivalent Ratio
Figure 15 shows the relationship between NOx emission and the equivalent ratio () when the ignition advance angle (time) is fixed at 10 °CA (0.00583 s) and the engine frequency is fixed at 5 Hz. As shown, when , NOx increases with the increase of , but the range is relatively small and the contribution rate of is small as well; when , NOx increases with the increase of , but the range is large and the contribution rate of is relatively large as well; and when , NOx sharply decreases with the increase of . NOx emissions reach their highest point at , and this regulation is highly in agreement with what has been mentioned by Safari H, etc. [18,19,20].
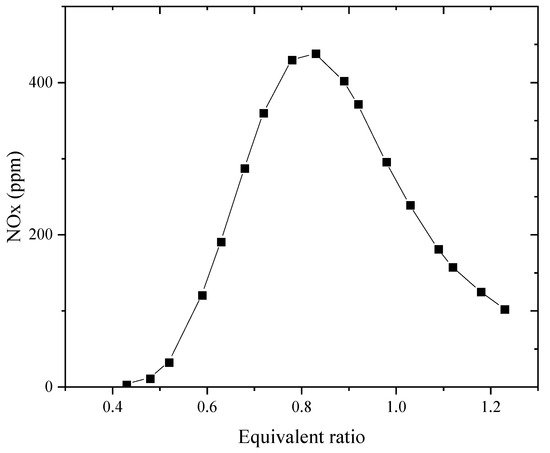
Figure 15.
NOx emission with different equivalent ratio.
Thermal NOx is the staple NOx emission category in a hydrogen internal combustion engine, and the formation of NOx is mainly determined by three factors: high temperature, oxygen enrichment and duration of high temperature, while temperature affects the most. The stagnation temperature of the formation of thermal NOx is 1800 K; when the temperature is higher than 1800 K, the formation of NOx increases exponentially with increasing temperature. When the in-cylinder temperature is higher than 2000 K, the contribution rate of temperature will become extremely obvious. The highest mean in-cylinder temperature in this thesis was calculated by Ricardo WAVE.
Figure 16 illustrates the highest mean in-cylinder temperature under different equivalent ratios. It could be seen that: when is between the range of 0.33–0.5, the highest mean in-cylinder temperature increases from 1412 K to 1972 K and reaches the stagnation temperature of the formation of NOx; moreover, part of the in-cylinder temperature could be higher than 1800 K; therefore, NOx emission slightly increases with the increase of temperature, but generally, the effect of on NOx formation is small; when , the highest in-cylinder temperature is 2109 K, which is obviously higher than the stagnation temperature of NOx formation, and the temperature contribution rate becomes extremely high; when increases from 0.48 to 0.52, NOx increases with temperature from 10.76 ppm to 31.82 ppm.
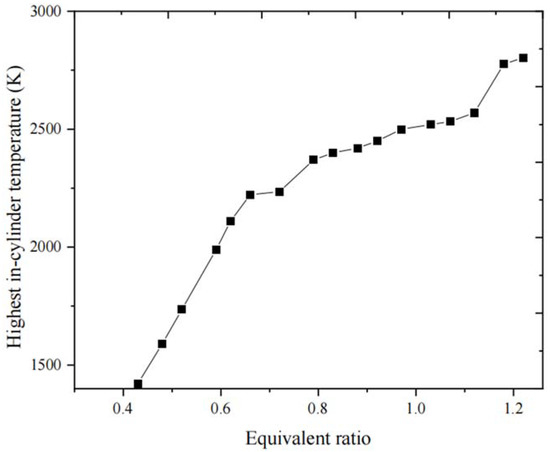
Figure 16.
Highest mean in-cylinder temperature with equivalent ratio.
In the range of from 0.52 to 1.2, the highest mean in-cylinder temperature increases with the increase of , but NOx does not constantly increase but reaches its highest point at and decreases with the increase of afterwards. The reason for this phenomenon is that, in the range of from 0.52 to 0.88, there is sufficient oxygen in the mixture, which makes temperature the most important factor that affects NOx formation; the higher the in-cylinder temperature is, the more NOx is produced, and high temperature causes the formation of a large amount of NOx. When , with the increase of , the highest mean in-cylinder temperature increases continuously, but the amount of air in the cylinder is becoming less and less, and there’s less and less oxygen to bond with nitrogen. Moreover, due to the higher burning speed of hydrogen, the retention time of high-temperature gas in the cylinder is shortened, resulting in less oxygen, and the shorter retention time restricted the formation of NOx together. When , excess hydrogen will not only reduce some of the NO but also absorb heat in the cylinder and decrease the in-cylinder temperature, lower in-cylinder temperature and insufficient oxygen restrict the formation of NOx simultaneously.
3.3. Regulation between NOx Emission and Ignition Advance Timing
Figure 17 shows the relationship between NOx production and ignition advance timing (which is converted from the corresponding ignition advance angle). From Figure 17: when , there’s no apparent effect brought by the ignition advance time on NOx production; when > 0.5, NOx production rises with the enlargement of the ignition advance time, and the range sharply increases with the increase of .
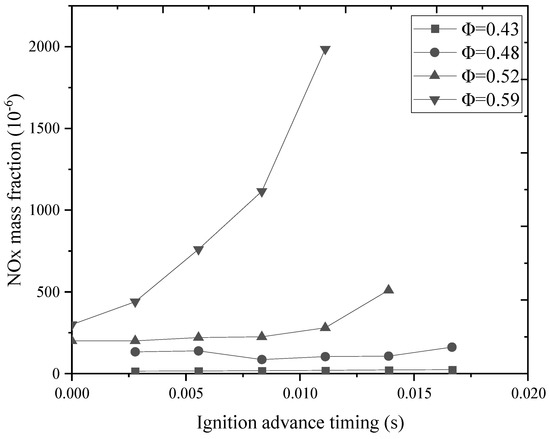
Figure 17.
NOx production changes with ignition advance timing.
Figure 18 shows relationships between the combustion duration and CA50 and the ignition advance angle, where CA50 represents the specific time of 50% heat release. As shown in Figure 18, for different equivalent ratios, the combustion duration shortens with an increase in ignition advance timing. In addition, because of the increased combustion speed of hydrogen, the CA50 point becomes closer to TDC. When , the effect of ignition advance timing on the combustion duration is greater than that of , which means that the leaner the mixture is, the greater the contribution of ignition advance timing to shortening the combustion duration would be.
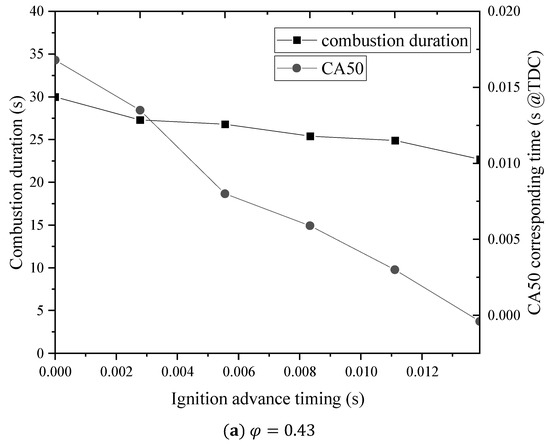
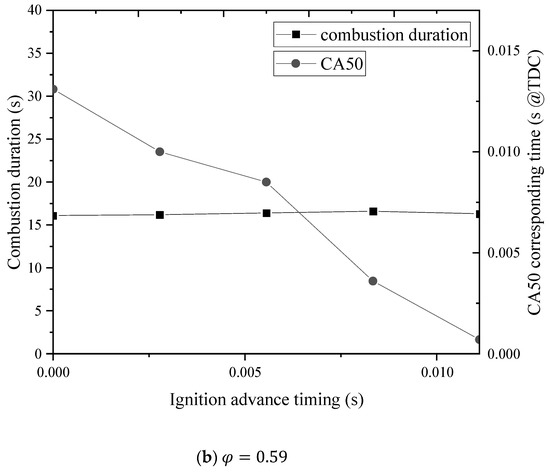
Figure 18.
CA50 changes with the combustion duration.
Under a fixed engine frequency and condition of , temperature is the major factor that affects NOx generation. According to Figure 19, the highest in-cylinder temperature increases with the increase in ignition advance timing, and when , with the increase in ignition advance timing, the average highest in-cylinder temperature increases from the stagnation temperature of NOx production to a higher level, and in the meantime, the highest in-cylinder temperature reaches 1986 K; thus, the ignition advance timing contributes relatively little to NOx production for lean mixture. When , the average highest in-cylinder temperature increases from 2119 K to 2349 K with the increase in ignition advance timing, a slight increase in temperature would cause an exponential increase in NOx production within this temperature range.
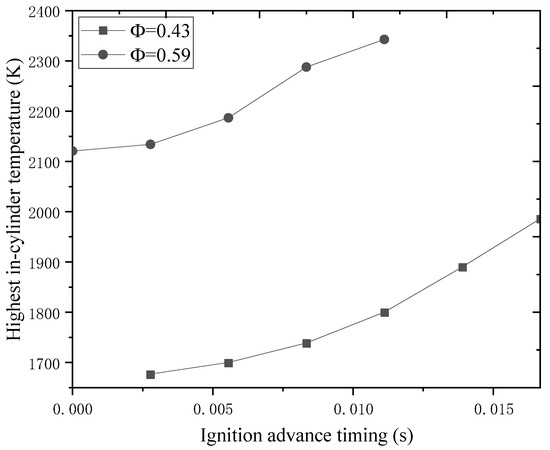
Figure 19.
Highest in-cylinder temperature with ignition advance timing.
4. Conclusions
Through the analysis of the NOx emission performance of each engine model, it could be concluded that the free-piston engine possesses remarkable NOx reduction potential compared with a conventional spark-ignition engine.
The highest NOx reduction could reach 57.37% at an engine frequency of 6 Hz. However, hydrogen, which is considered a high-functioning, environmentally friendly renewable fuel, produces more NOx than gasoline in the free-piston engine, though the range is relatively small, especially at the low engine frequency stage (1.4% at 5 Hz and 10.97% at 11 Hz). Above all, thanks to the fuel specialty of hydrogen, NOx is the only emission that requires consideration in hydrogen engines. Though hydrogen produces more NOx than gasoline, the range is not considerable, and in addition, the engine characteristics of a hydrogen free-piston engine are as good as those of a gasoline free-piston engine.
The relationship between NOx formation and the equivalent ratio obtained by simulation is as follows: is the obvious demarcation point of the formation of NOx; when , it does not affect NOx much; when , NOx increases with the increase of and reaches the highest point at ; when , NOx sharply decreases with the increasing .
For lean mixtures , the contribution of ignition advance timing to NOx production is relatively small; when , ignition advance timing could apparently affect NOx production, and the amount increased with the increase in ignition advance timing. With the increased ignition advance timing, the combustion duration is shortened, the 50% heat release point gets closer to TDC, combustion velocity rises and the average highest in-cylinder temperature increases simultaneously.
Author Contributions
Conceptualization, A.R. and Y.W.; methodology, C.L. and B.J.; software, C.L. and B.J.; writing—original draft preparation, C.L.; writing—review and editing, Z.Z. All authors have read and agreed to the published version of the manuscript.
Funding
This research received no external funding.
Institutional Review Board Statement
Not applicable.
Informed Consent Statement
Not applicable.
Data Availability Statement
Not applicable.
Conflicts of Interest
The authors declare no conflict of interest.
References
- Bae, C.; Kim, J. Alternative fuels for internal combustion engines. Proc. Combust. Inst. 2017, 36, 3389–3413. [Google Scholar] [CrossRef]
- Dimitriou, P.; Tsujimura, T. A review of hydrogen as a compression ignition engine fuel. Int. J. Hydrogen Energy 2017, 42, 24470–24486. [Google Scholar] [CrossRef]
- Mikalsen, R.; Roskilly, A.P. A review of free-piston engine history and applications. Appl. Therm. Eng. 2007, 27, 2339–2352. [Google Scholar] [CrossRef]
- Jia, B.; Smallbone, A.; Zuo, Z.; Feng, H.; Roskilly, A.P. Design and simulation of a two-or four-stroke free-piston engine generator for range extender applications. Energy Convers. Manag. 2016, 111, 289–298. [Google Scholar] [CrossRef]
- Goto, S.; Moriya, K.; Kosaka, H.; Akita, T.; Hotta, Y.; Umeno, T.; Nakakita, K. Development of Free Piston Engine Linear Generator System Part 2—Investigation of Control System for Generator; SAE Technical Paper; SAE International: Detroit, MI, USA, 2014. [Google Scholar]
- Yuan, C.; Xu, J.; He, Y. Performance characteristics analysis of a hydrogen fueled free-piston engine generator. Int. J. Hydrogen Energy 2016, 41, 3259–3271. [Google Scholar] [CrossRef]
- Miao, Y.; Zuo, Z.; Feng, H.; Guo, C.; Song, Y.; Jia, B.; Guo, Y. Research on the combustion characteristics of a free-piston gasoline engine linear generator during the stable generating process. Energies 2016, 9, 655. [Google Scholar] [CrossRef]
- Yuan, C.; Feng, H.; He, Y. An experimental research on the combustion and heat release characteristics of a free-piston diesel engine generator. Fuel 2017, 188, 390–400. [Google Scholar] [CrossRef]
- Yuan, C.; Feng, H.; He, Y.; Xu, J. Combustion characteristics analysis of a free-piston engine generator coupling with dynamic and scavenging. Energy 2016, 102, 637–649. [Google Scholar] [CrossRef]
- Aksu, C.; Kawahara, N.; Tsuboi, K.; Kondo, M.; Tomita, E. Extension of PREMIER combustion operation range using split micro pilot fuel injection in a dual fuel natural gas compression ignition engine: A performance-based and visual investigation. Fuel 2016, 185, 243–253. [Google Scholar] [CrossRef]
- Wang, Z.; Zhao, Z.; Wang, D.; Tan, M.; Han, Y.; Liu, Z.; Dou, H. Impact of pilot diesel ignition mode on combustion and emissions characteristics of a diesel/natural gas dual fuel heavy-duty engine. Fuel 2016, 167, 248–256. [Google Scholar] [CrossRef]
- Yuan, C.; Feng, H.; He, Y.; Xu, J. Effect of hydrogen addition on the combustion and emission of a diesel free-piston engine. Int. J. Hydrogen Energy 2018, 43, 13583–13593. [Google Scholar] [CrossRef]
- Ngwaka, U.; Smallbone, A.; Jia, B.; Lawrence, C.; Towell, B.; Roy, S.; Shivaprasad, K.V.; Roskilly, A. Evaluation of performance characteristics of a novel hydrogen-fuelled free-piston engine generator. Int. J. Hydrogen Energy 2021, 46, 33314–33324. [Google Scholar] [CrossRef]
- Knaus, K.; Häberlein, J.; Becker, G.; Rosskamp, H. A New High-Performance Four-Stroke Engine for All-Position Use in Hand-Held Power Tools; SAE Technical Paper, No. 2004-32-0075; SAE International: Detroit, MI, USA, 2004. [Google Scholar]
- Arshad, W. A Low-Leakage Linear Transverse-Flux Machine for a Free-Piston Generator; Elektrotekniska System: Stockholm, Sweden, 2003. [Google Scholar]
- Taylor, C.F. The Internal Combustion Engine in Theory and Practice: Combustion, Fuels, Materials, Design; The MIT Press: Cambridge, MA, USA, 1985; Volume 2. [Google Scholar]
- Hohenberg Günter, F. Advanced Approaches for Heat Transfer Calculations; SAE technical paper, No. 790825; SAE International: Detroit, MI, USA, 1979. [Google Scholar] [CrossRef]
- Tang, X.; Kabat, D.M.; Natkin, R.J.; Stockhausen, W.F.; Heffel, J. Ford P2000 Hydrogen Engine Dynamometer Development; SAE International: Detroit, MI, USA, 2002; Volume 111, pp. 631–642. Available online: http://www.jstor.org/stable/44743090 (accessed on 10 June 2021).
- Safari, H.; Jaza Yeri, S.; Ebrahimi, R. Potentials of NOX emission reduction methods in SI hydrogen engines: Simulation study. Int. J. Hydrogen Energy 2009, 34, 1015–1025. [Google Scholar] [CrossRef]
- Subramanian, V.; Mallikarjuna, J.; Ramesh, A. Intake charge dilution effects on control of nitric oxide emission in a hydrogen fuelled SI engine. Int. J. Hydrogen Energy 2007, 32, 2043–2056. [Google Scholar] [CrossRef]
Disclaimer/Publisher’s Note: The statements, opinions and data contained in all publications are solely those of the individual author(s) and contributor(s) and not of MDPI and/or the editor(s). MDPI and/or the editor(s) disclaim responsibility for any injury to people or property resulting from any ideas, methods, instructions or products referred to in the content. |
© 2023 by the authors. Licensee MDPI, Basel, Switzerland. This article is an open access article distributed under the terms and conditions of the Creative Commons Attribution (CC BY) license (https://creativecommons.org/licenses/by/4.0/).