1. Introduction
It is well recognised in soil mechanics [
1,
2,
3,
4,
5,
6] that granular soils can be prepared into different densities characterised by the mean pressure
and solid fraction
(solid fraction is equivalent to the void ratio or specific volume, and solid fraction is used in this study). Two densities are distinguished—dense or loose, depending on the distance between the state (
and
) and a critical
-
relationship. Dense and loose soil elements have different responses when sheared [
7,
8,
9,
10,
11]. These phenomena are also reproduced in discrete element simulations [
12,
13,
14,
15,
16,
17]. Some researchers noticed that there is a possible range of
for a fixed pressure
[
18], and it is impossible to prepare samples outside this range. Researchers use empirical equations to define such a range of possible
-
combinations.
Parallelly in the field of condensed-matter physics, researchers are also interested in granular materials and they use the name jammed granular matters for solid-state granular assembly [
19,
20,
21,
22,
23,
24]. Physicists tried to explain this range of possible
-
combinations theoretically. In 1989, Sir Sam Edwards made the proposition to treat jammed granular materials using a volume ensemble of equiprobable jammed states in analogy to thermal equilibrium statistical mechanics. Song et al. [
25] followed this pathway and proposed a phase diagram to explain the jamming limit of granular assemblies of uniform spherical grains. Their theoretical phase diagram is also validated by simulations with the discrete element method (DEM), in which the possible range of jammed
-
combinations is studied by isotropic compression simulations. In other studies, researchers found that shearing is also important and can cause unjamming [
24]. The critical state is the ultimate flowing state under continuous shearing and is an important reference state for shear deformation. How the range of jammed
-
combinations found in isotropic compression and extension is related to the important reference state (the critical state) for shear deformation is not studied in the literature. Rather than give a theoretical examination, this short communication aims to answer this question by conducting DEM simulations.
The paper is organised as follows: in
Section 2, the discrete element model (DEM) and the used parameters are briefly explained, and then the method used to study the jamming limit and to prepare specimens is explained in
Section 3, i.e., the isotropic compression tests for a periodic cuboidal domain. In
Section 4, another method (varying-friction method) for generating specimens is explained and it is found that this method can generate specimens with a larger range of
-
combinations. A large number of specimens are prepared with different
-
combinations and conducted continuous isochoric shear tests to find the critical
-
line, and find that this line is also the loosest jammed state line.
2. Discrete Element Modelling
Discrete element simulations are used to study the jamming, shearing, and critical state of granular materials. The commercial software PFC3D is used, and the studied granular assembly is made of spherical grains with a uniform diameter D of 0.17 mm. The motion of grains is calculated with Newton’s law for rigid bodies.
A linear Coulomb-type model is used for the contacts between grains. Given a spherical grain g and one of its neighbouring grain b, they have position vectors (, ), velocities (, ), angular velocities (, ), and diameters (, ). If the penetration depth is positive, they are in contact (the contact point is denoted as c) and grain g experiences a force from grain b, where is the normal contact force, and is the tangential contact force. The contact forces components are also divided into an elastic part and a viscous part ().
The normal contact force is in the direction of contact normal
. Its elastic part is represented by a spring and its viscous part is represented by a dashpot. The equation for the normal contact force is:
where
is the effective mass, and
and
are the elastic stiffness and viscous damping constants. The tangential contact force is first calculated as
where
is the relative tangential velocity at the contact
c, and
and
are the tangential elastic stiffness and viscous damping constants. There is a slider in the tangential contact force model, which means that the tangential contact force has a Coulomb-type limit, which is imposed as
.
The normal stiffness
is calculated as
, where
is the elastic modulus of grains and
is the effective diameter. The ratio between the normal and tangential stiffness
is fixed for all contacts. If not otherwise stated, the DEM parameters are used as in
Table 1.
3. Jamming
Song et al. [
25] set up a protocol by conducting isotropic compression tests in DEM to investigate the jamming of granular materials and proved their theoretical phase diagram. The following protocol to prepare specimens is used (it will show later that this method can only generate dense specimens): All following simulations in this study are performed in 3D periodic domains.
(1) Grains are randomly inserted within a cuboidal domain (each side is 4 mm long) with the possibility of overlap until an initial solid fraction (simply called density in this study) is achieved. The solid fraction is the volume of grains over the total volume. i.e., . Depending on the initial density, the number of grains ranges from 13,800 to 15,000.
(2) Set the friction coefficient to zero (i.e., ) and grains are left to reach equilibrium.
(3) Set the friction coefficient back to 0.5 (i.e., ) until equilibrium is reached again. The jamming, shearing, and critical state of granular soil with surface friction of are studied.
(4) The periodic domain shrinks isotopically, mimicking the isotropic compression tests. The deformation rate is fixed at a small value of 1 s−1, making sure that the quasi-static deformation condition is met.
During simulations, the stress is estimated from grains with Love’s equation as in the literature [
13]
Here V is the volume of the representative element volume (REV), the contact vector is the vector pointing from the centre of gravity of grain g to the contact point c. The summation is performed over all contacts () of every grain () in RVE. In the present study, compressive stress and strain are defined as positive. Moreover, this study focuses on normalised stress, i.e., .
The is the average number of contacts per grain, i.e.,
, where
is the total number of grains, and
is the total number of contacts (two grains in contact have two contacts belonging to each grain). For granular assembly with uniform spherical grains, some grains are rattlers (having less than 4 contacts), and they do not contribute to the contact force chain [
26], therefore, a corrected coordination number
is used, where
is the total number of non-rattler grains, and
is the total number of non-rattler contacts.
During each isotropic compression test, the normalised pressure
, corrected the coordination number
, and the density
are recorded.
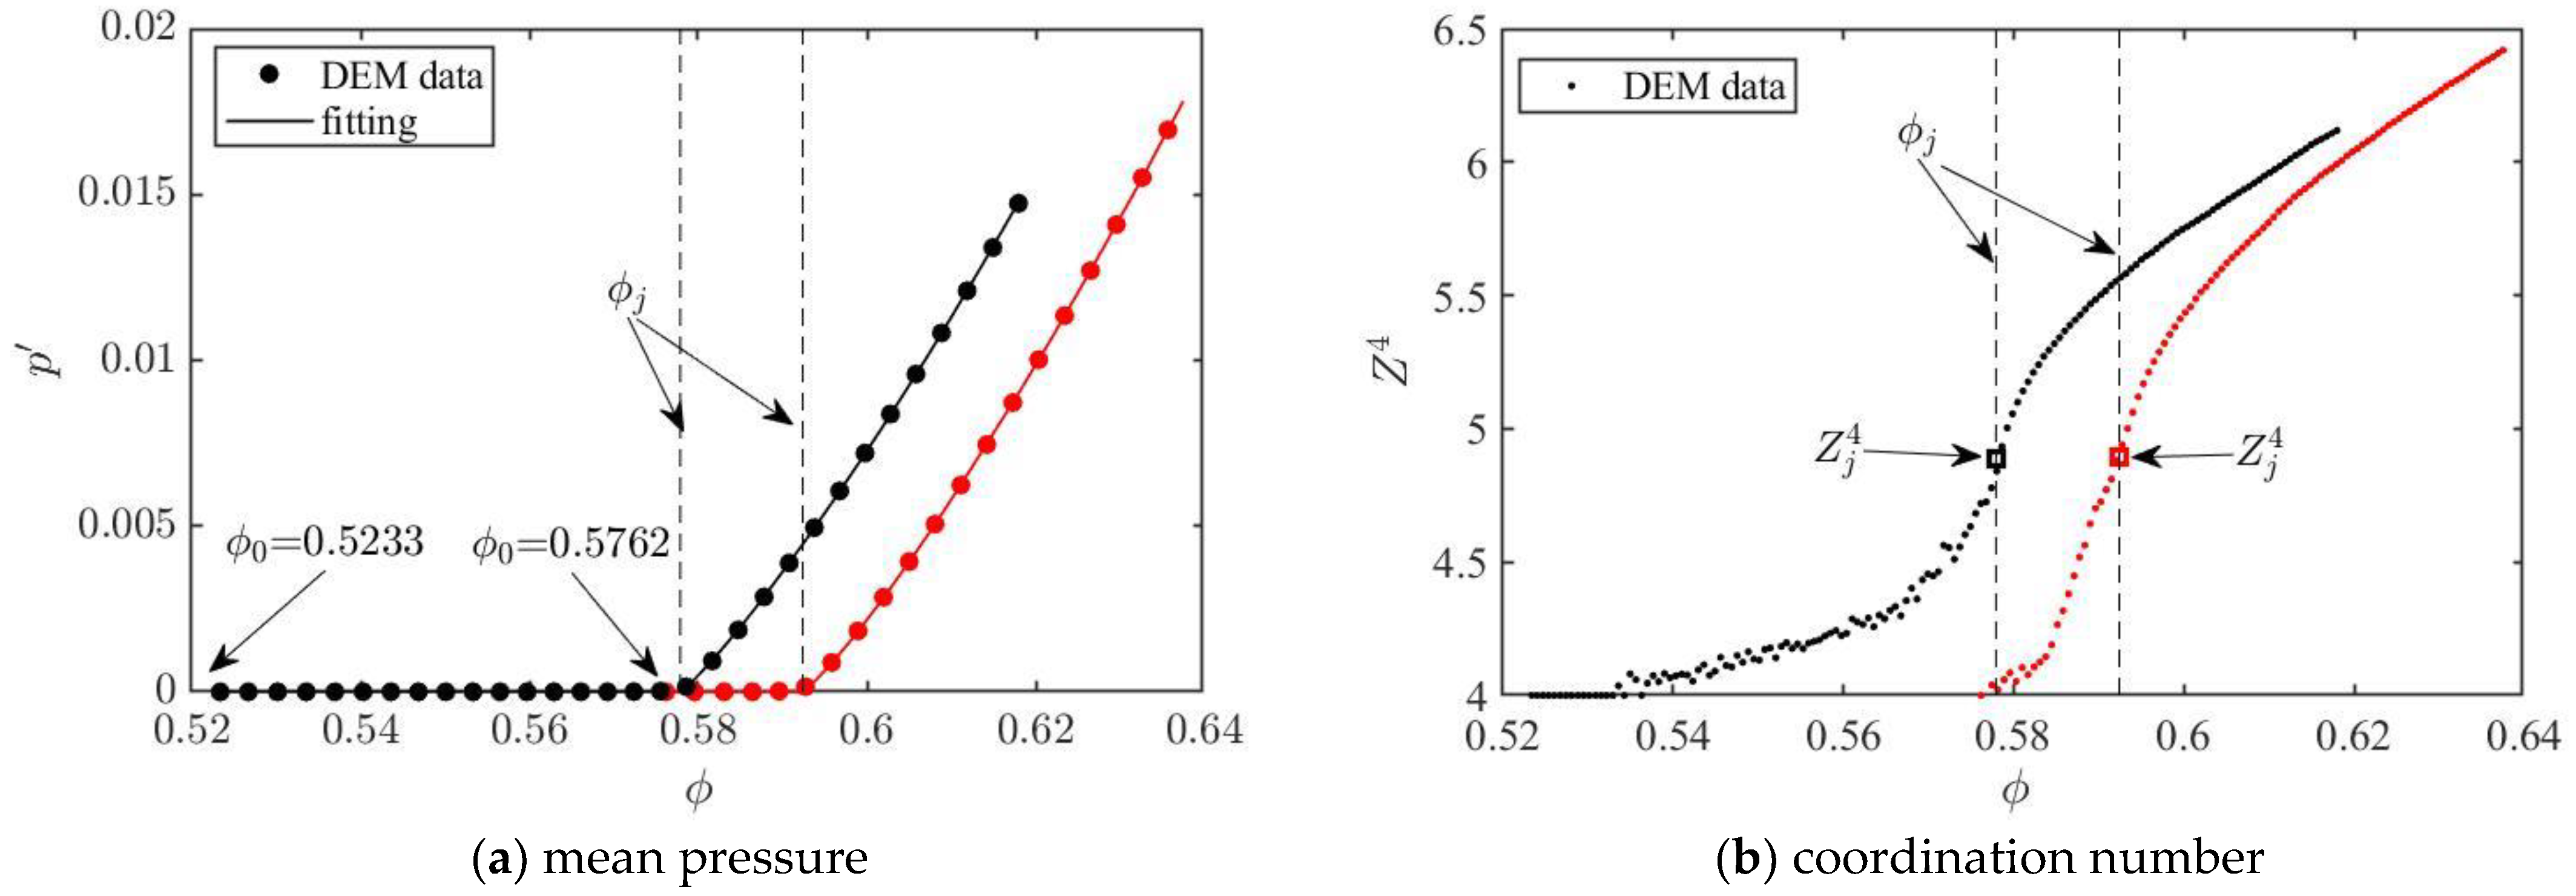
Figure 1 gives two examples. A first assembly starts with an initial density of
= 0.5233. Initially, the assembly is unjammed with
= 0 and
= 4. After it is compressed until larger than a jamming density of
= 0.5779, it becomes a jammed matter and then the pressure increases continuously with the increase of density.
Figure 1b shows that the corrected coordination number also increases with density.
To determine the jamming density, the normalised pressure
and the density
are assumed to follow an equation [
26] as
where
,
, and the jamming density
are fitting parameters.
Figure 1a shows that the DEM data are well-fitted by this equation. The assembly starting with
= 0.5233 has a jamming density of
= 0.5779. The other assembly starting with
= 0.5762 has a larger jamming density of
= 0.5924. The jamming coordination number
can also be determined as in
Figure 1b.
The jamming density
is highly related to the initial density
in the above protocol of isotropic compression tests. Therefore, 330 tests are conducted with initial density
ranging from 0.45 to 0.63 (0.63 is the maximum possible density for assemblies of a uniform size mentioned by Song et al. [
25], and the corresponding jamming density
is found. The data are shown in
Figure 2a. The jamming density increases with the increase of initial density. It is also suggested that no matter how small the initial density
is, there is a minimal possible jamming density
= 0.575. Therefore, the possible
-
combinations can be identified (
Figure 2b) for specimens prepared by isotropic compression tests, which must be between a compression line for a jamming density of
= 0.575 and a compression line for a jamming density of
= 0.63. The compression line for
= 0.575 also represents the loosest jammed state. A total of 250 specimens are prepared by first randomly choosing an initial density
between 0.5 and 0.63, and compressing them to a target normalised pressure
between 0.0001 and 0.02. The
-
combinations for these specimens are shown in
Figure 2b.
4. Loose Specimens
The isotropic compression can only prepare dense specimens; another method (varying-friction method) can be used to generate both dense and loose specimens. The protocol is:
(1) Similarly, grains are randomly inserted within a cuboidal domain until a density is reached.
(2) Set the friction coefficient to an initial value and grains are left to reach equilibrium.
(3) Set the friction coefficient back to 0.5 (i.e., the friction coefficient of the studied gains) until equilibrium is reached again, and the assembly may enter a state with positive pressure ( > 0).
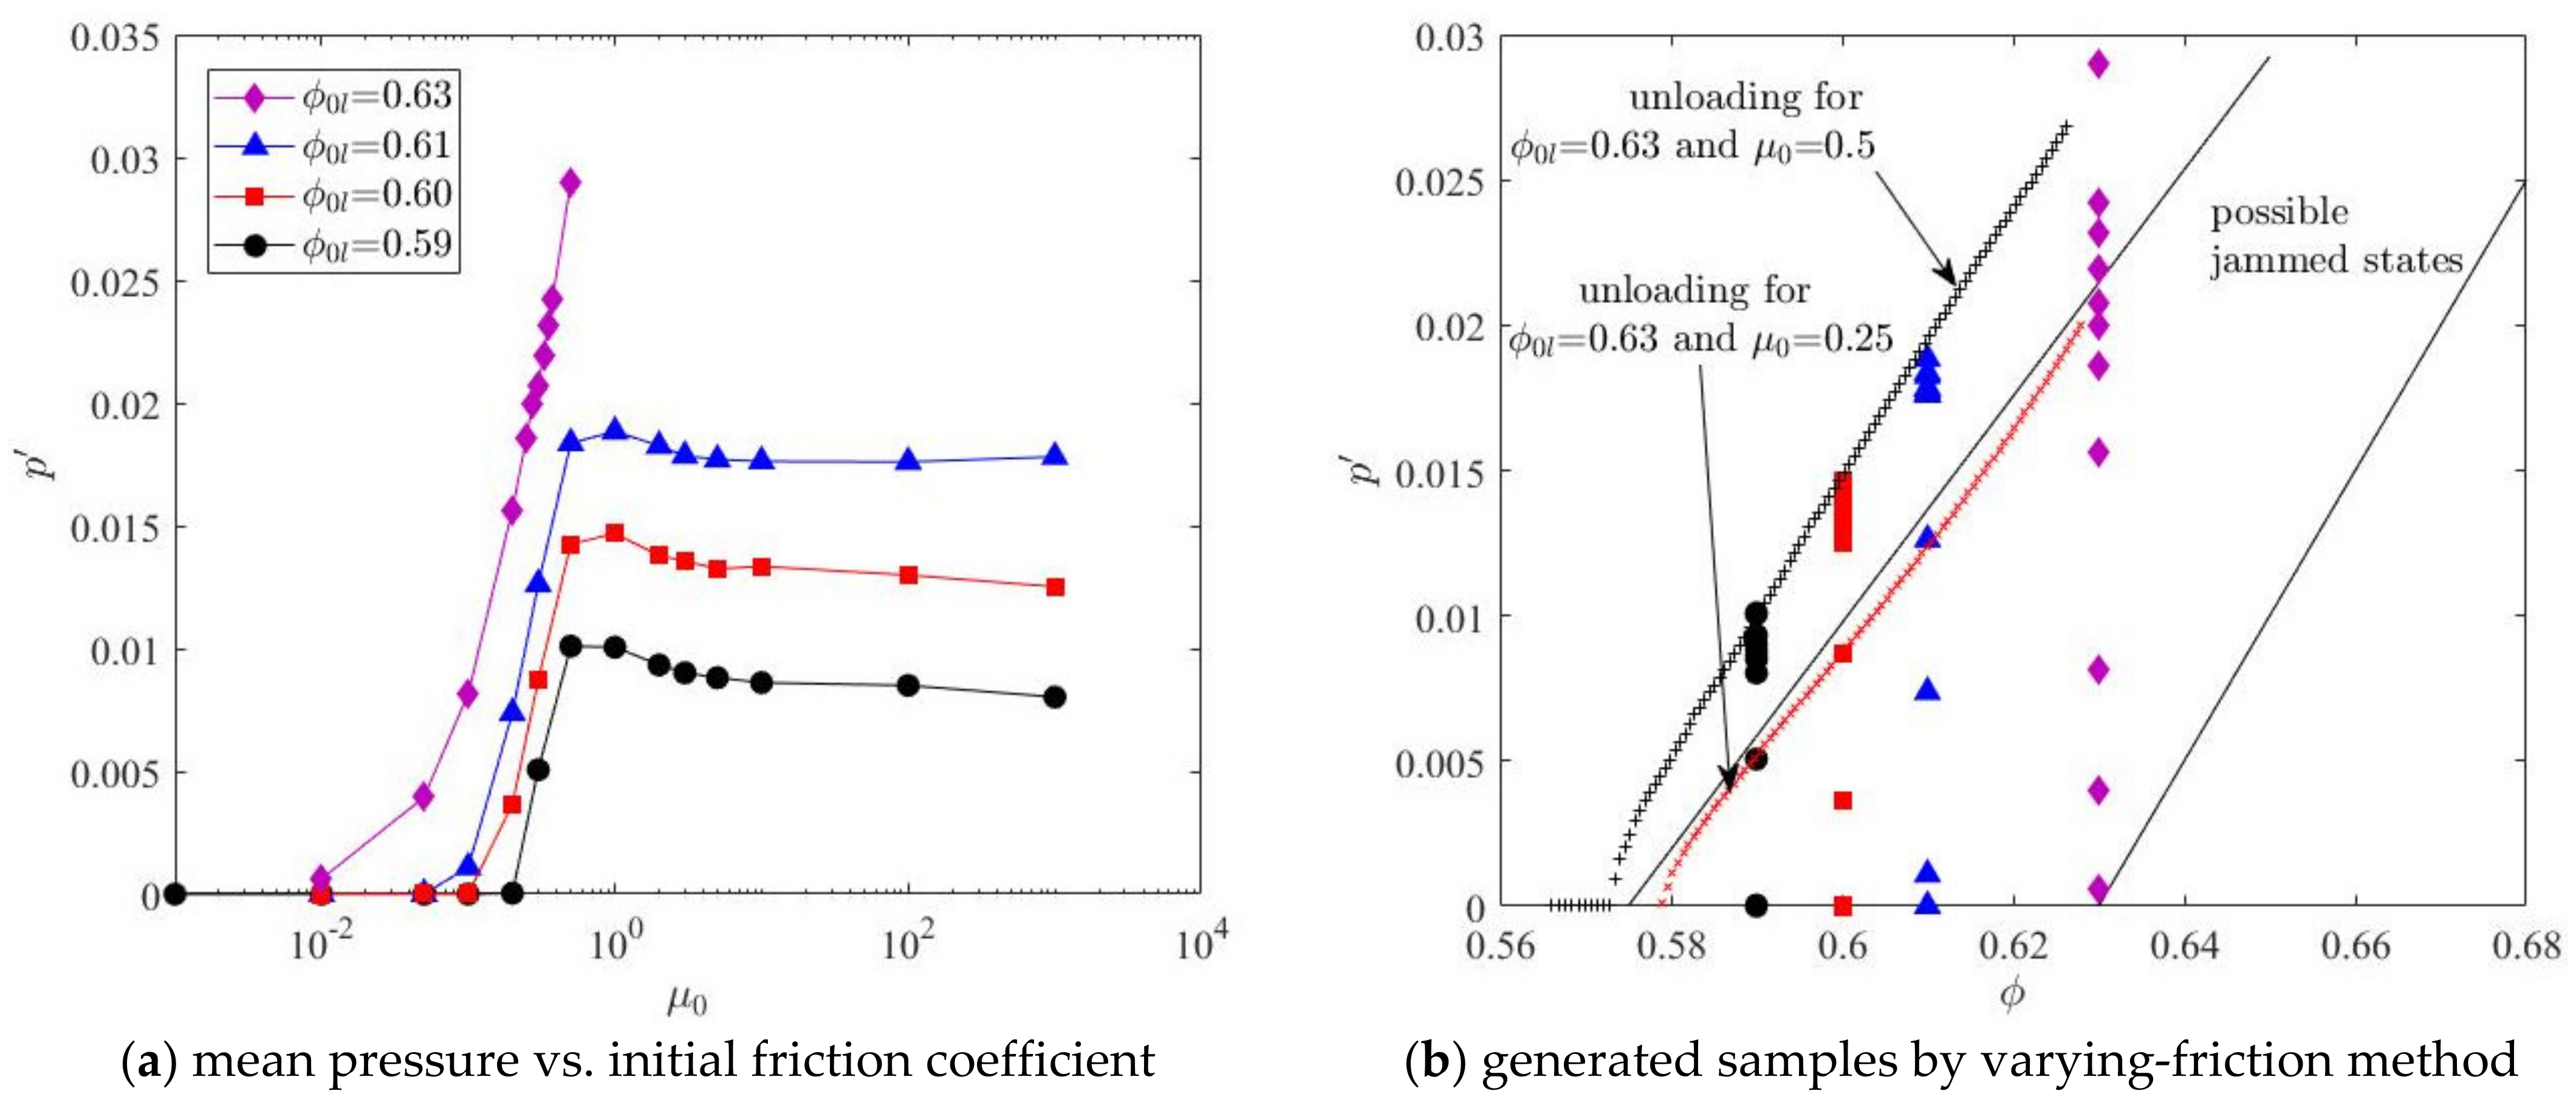
Some simulations are conducted for
= 0.59, 0.60, 0.61, and 0.63. When the initial friction
ranges from 0.001 to 1000, the equilibrium normalised pressure
after step (3) is shown in
Figure 3a. When the initial friction is small, the equilibrium pressure is zero. After a critical value, the pressure starts to increase with greater initial friction. Peak pressure is achieved at
= 0.5. When the initial friction
is larger than 0.5, the equilibrium pressure
is the same. The achieved
-
combinations for these specimens are shown in
Figure 3b, from which, this varying-friction method can generate specimens falling within the possible jammed states. Additionally, loose specimens (greater pressure at the same density) can also be generated.
From
Figure 3a, it is seen that at a fixed
, the maximum possible pressure is obtained with
= 0.5 and is related to
. So the loosest possible specimens that can be generated with this varying-friction method are around the black dotted line in
Figure 3b (with cross markers). This dotted line is the unloading curve (isotropic expansion) for the specimen obtained after step (3) with
= 0.63 and
= 0.5. The red dotted line is the unloading curve for the specimen with
= 0.63 and
= 0.25. Therefore, to only generate loose specimens, the following varying-friction unloading method is used in this study:
(1) Grains are randomly inserted within a cuboidal domain until the density of = 0.63 is reached.
(2) Set the friction coefficient to an initial value (0.25 0.5) and grains are left to reach equilibrium.
(3) Set the friction coefficient back to 0.5 and the assembly is left to reach equilibrium.
(4) The periodic domain expands isotopically until a target normalised pressure (0.0001 0.02) is achieved.
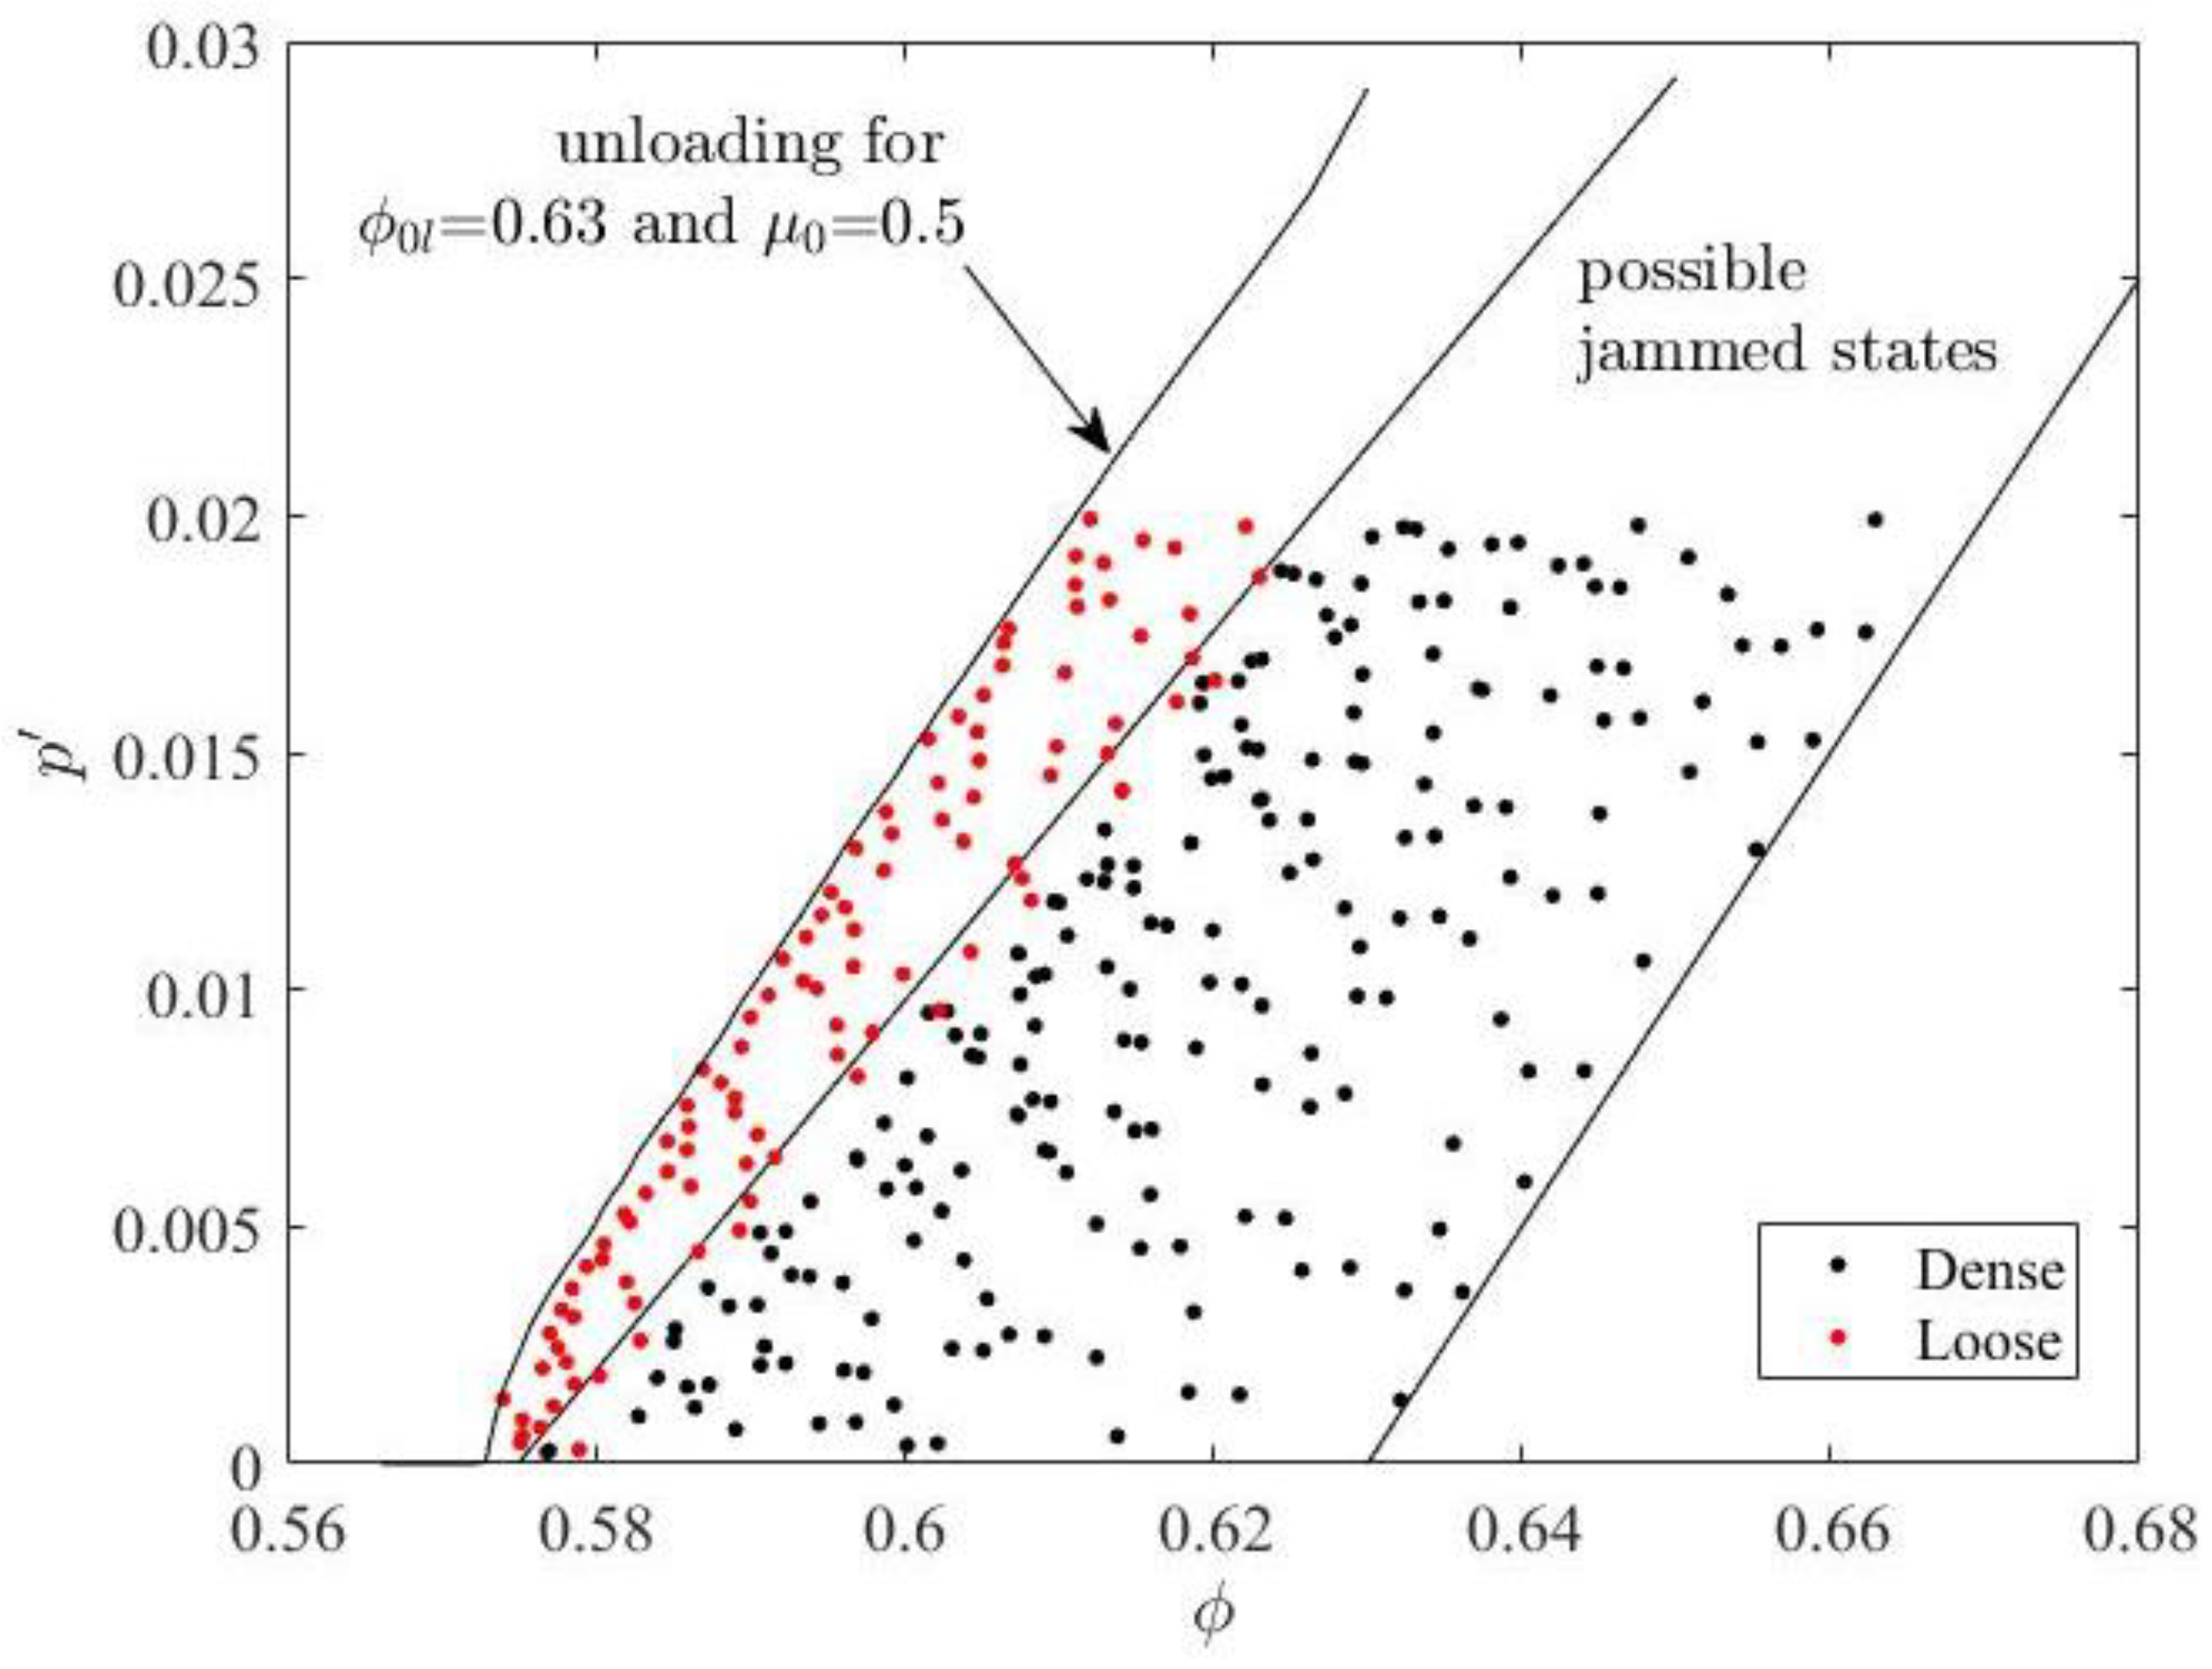
A total of 100 loose specimens are generated by this method by randomly choosing
between 0.25 and 0.5, and randomly choosing
between 0.0001 and 0.02. The
-
combinations for these specimens are shown in
Figure 4 along with the specimens at jammed states.
5. Continuous Isochoric Shear
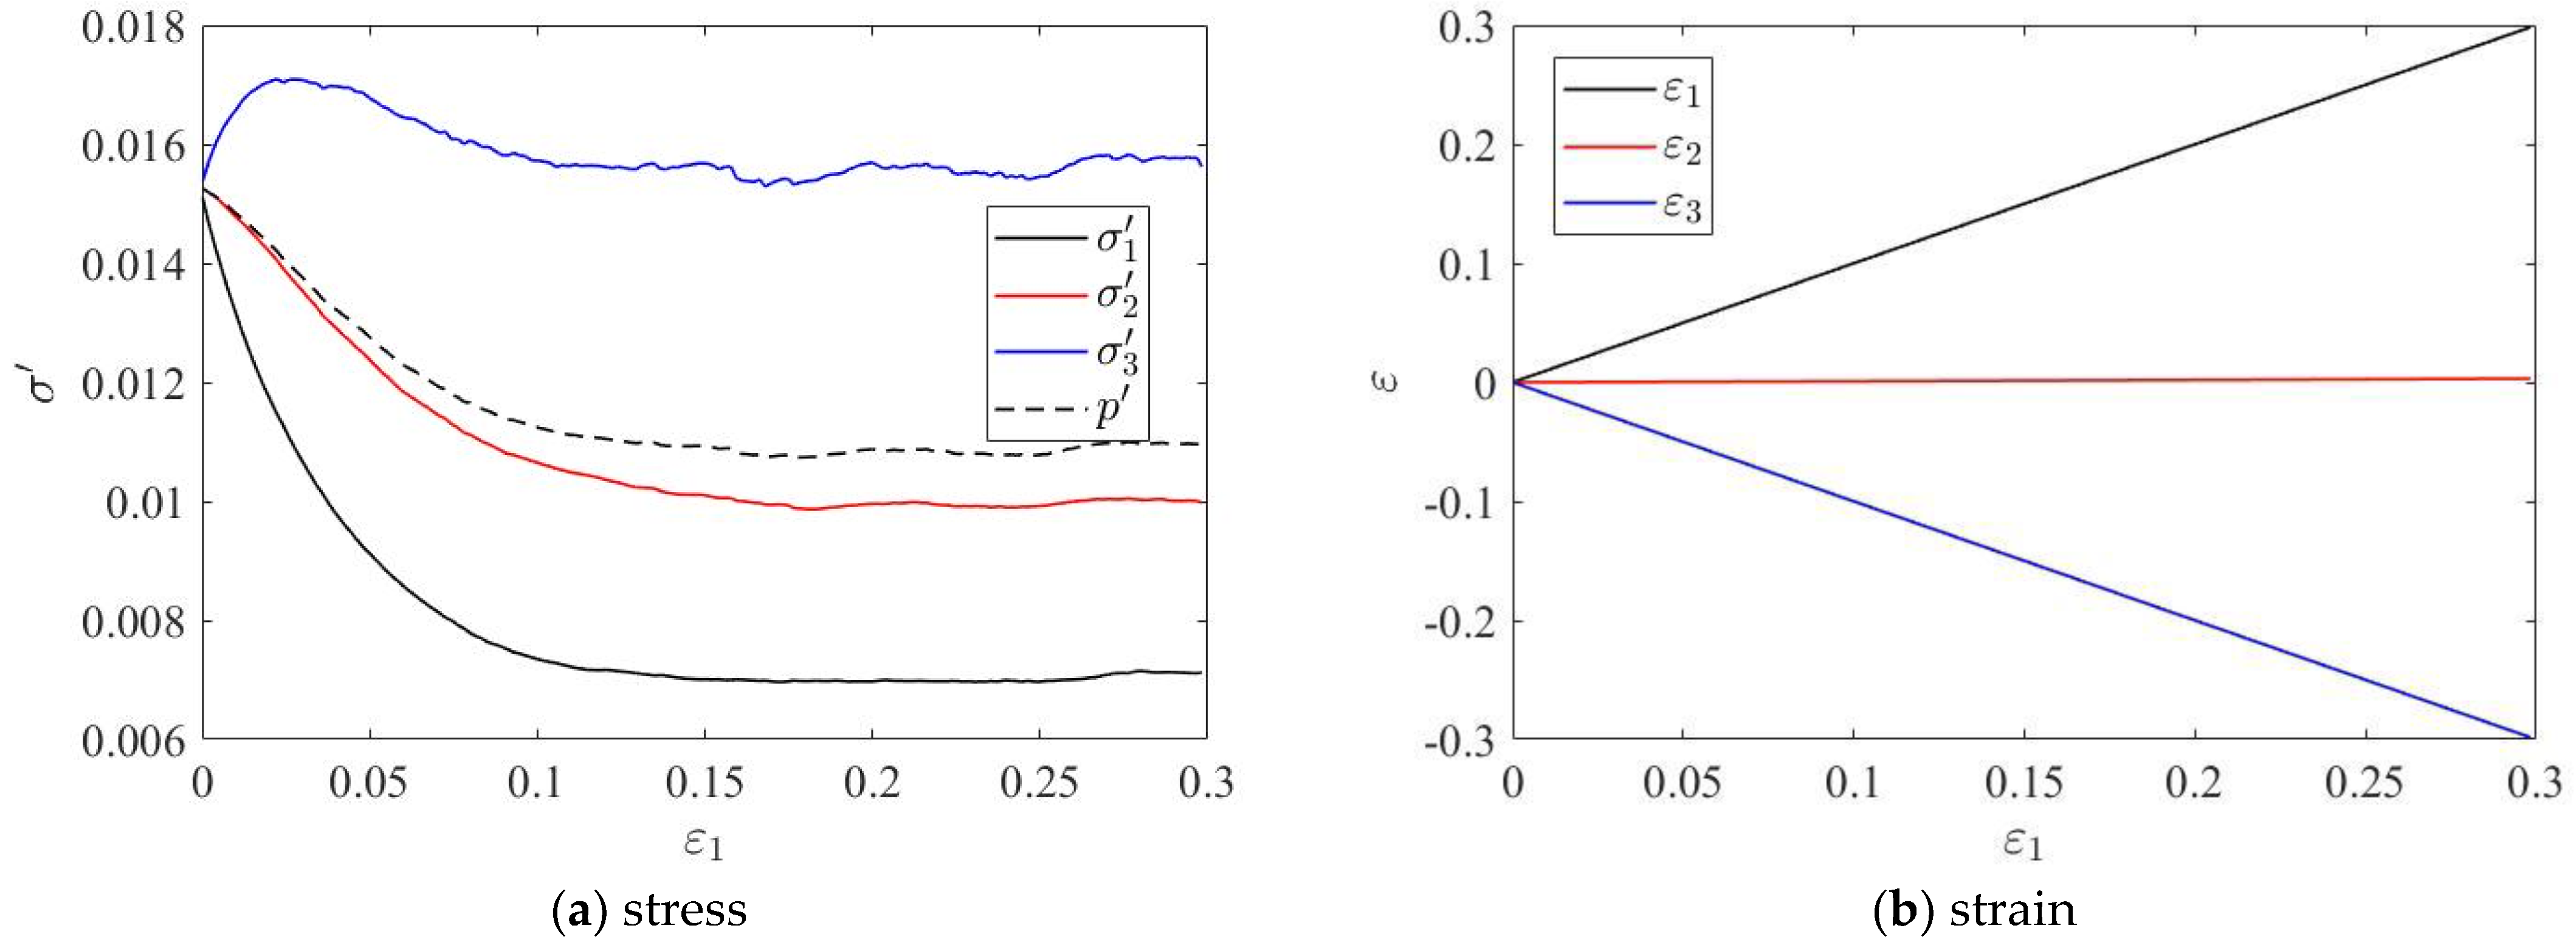
Next, isochoric (volume preserving) shear tests are conducted on 50 of the 250 dense specimens and 30 of the 100 loose specimens. The tests are strain-rate controlled. The principal strain rates are . Firstly, the intermediate principal strain rate ratio is randomly chosen between 0 and 1, is fixed at 1 s−1, thus and can be calculated from and the volume-preserving condition (). The simulations are conducted until the largest principal strain is at least 30%.
Figure 5 gives the evolution of stress and strain for a loose specimen (
= 0.6016 and
= 0.01529) when sheared with
= 0.5. From the plot of stress components (
Figure 5a), it can be seen that the mean stress
will decrease first, the specimen reaches the critical state after about
= 15%, and the stress components keep constant at the critical state even with continuous shear deformation (
Figure 5).
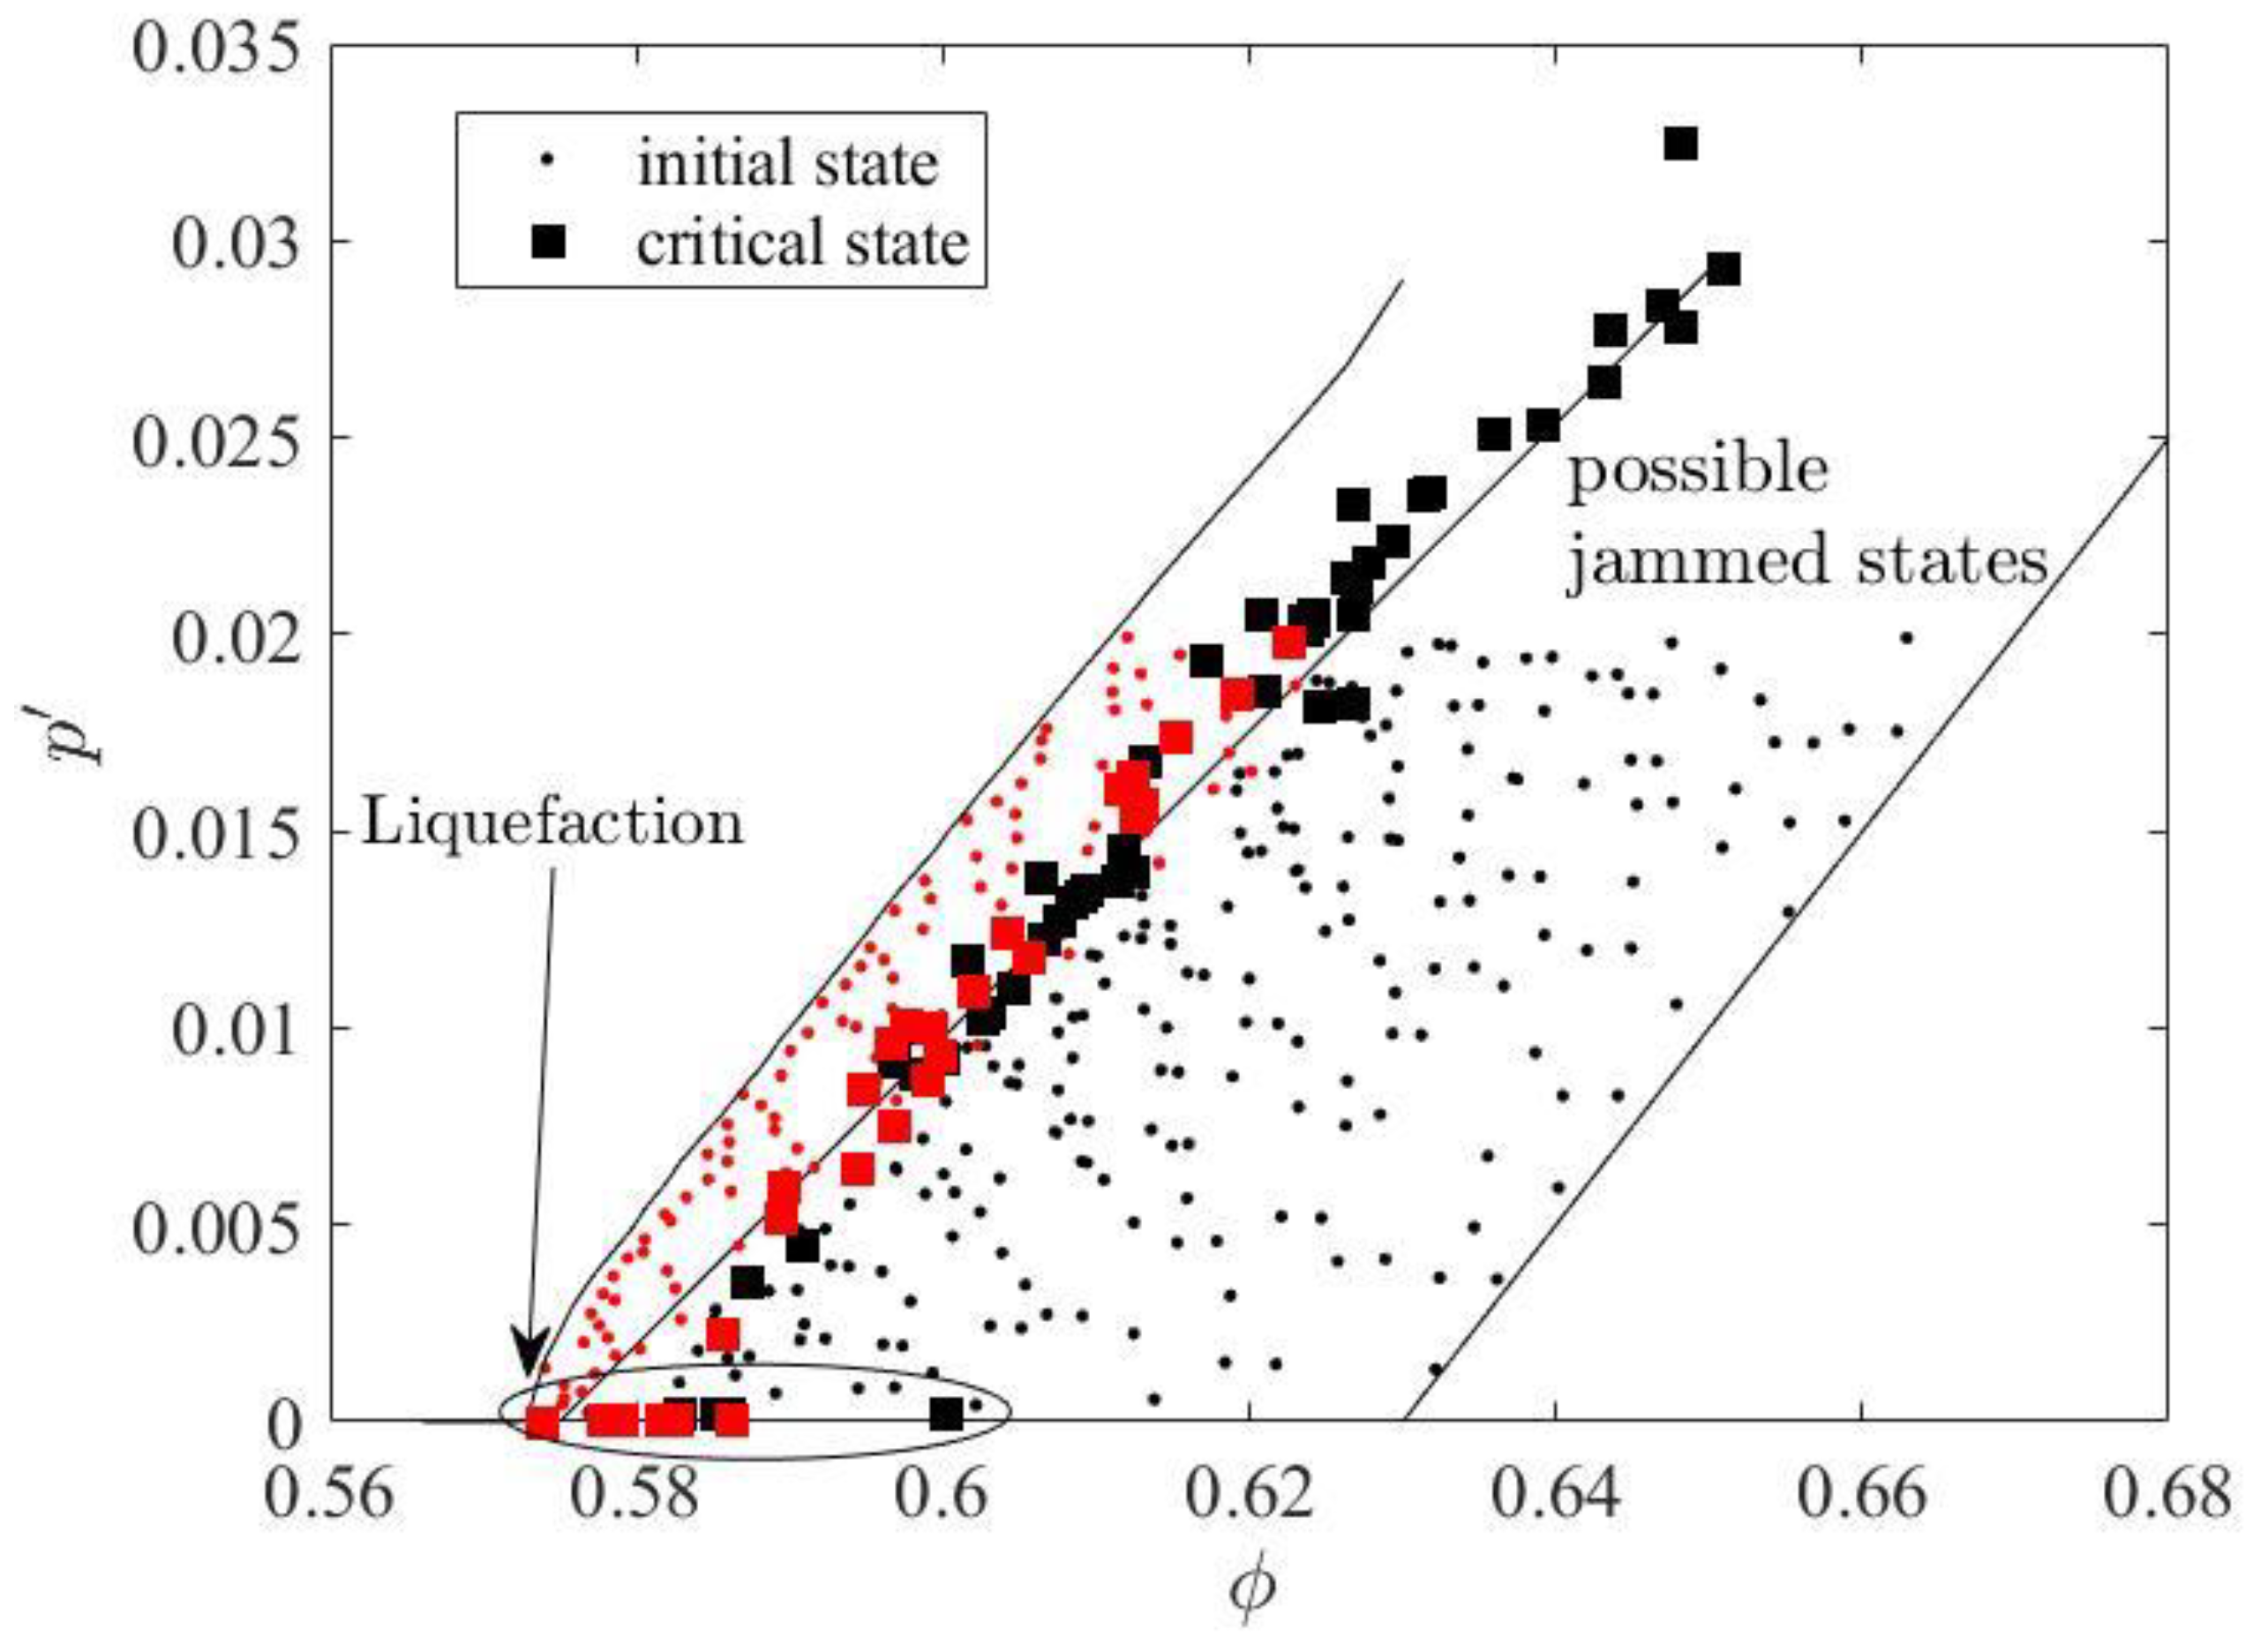
The critical state density and pressure for these 80 specimens are shown in
Figure 6. Some specimens reach liquefaction (
0) before reaching the critical state. The density and pressure of other specimens lie on a line called the critical state line in soil mechanics. From
Figure 6, this critical state line collapses with the loosest possible jammed state line from isotropic compression tests. Therefore, it is concluded that shearing will cause the rearrangement of grains, contacts and fabric, after sufficient deformation, which will finally lead to a critical
-
relationship, which is also the loosest jammed state from isotropic compression tests. More theoretical studies are required to explore what affects the relationship between density and pressure.
The stress state of specimens at the critical state is plotted on the octahedral profile in
Figure 7. It is shown that the critical state stress state is well described by a Coulomb-type equation and the corresponding bulk internal friction angle is about 21° for the studied granular material (diameter = 0.17 mm and surface friction
= 0.5).
6. Conclusions
It is well recognised in soil mechanics that granular soils can be prepared into different densities, and soil elements of different densities show distinctive behaviour. It is also noticed that there is a possible range for soil densities, which is often modelled empirically and included in constitutive models. Recently, physicists tried to explain this range of jammed - combinations theoretically, and the results are validated with discrete element simulations of isotropic compression tests.
Shearing also causes unjamming, and the critical state is an important reference state for shear deformation. In this study, how the jammed state limit is related to the critical state is examined by discrete element simulations, and the focus is on granular assemblies of spherical grains (uniform diameter = 0.17 mm). A linear Coulomb-type contact model is used for grains, and grain surface friction is = 0.5.
Jamming is studied by conducting isotropic compression of periodic domains. It is found that the jamming density is highly related to the initial density when inserting grains, but no matter how small the initial density is, there is a minimal possible jamming density = 0.575. The maximal possible jamming density is 0.63. The possible jammed states lie between two compression lines with these jamming densities (i.e., 0.575 and 0.63).
Next, varying-friction methods are used to prepare specimens. This method can not only generate specimens falling within the possible jammed states from isotropic compression tests, but also loose specimens (greater pressure at the same density). Another method—the varying-friction unloading method, is thus developed to generate only loose specimens.
Isochoric shear tests are next conducted on both dense and loose specimens. The tests are strain-rate controlled and the intermediate principal strain rate ratio ranges from 0 to 1. Some specimens reach liquefaction ( 0) before reaching the critical state. The density and pressure of other specimens lie on the critical state - line, which is found the same as the loosest possible jammed state line. Additionally, the critical state stress state is also well described by a Coulomb-type equation in the octahedral profile.
