Next Article in Journal
Advances in Engineering Geology of Rocks and Rock Masses
Next Article in Special Issue
Dual-Tracer PET Image Separation by Deep Learning: A Simulation Study
Previous Article in Journal
Location Adaptive Motion Recognition Based on Wi-Fi Feature Enhancement
Previous Article in Special Issue
A Deep Learning Approach to Upscaling “Low-Quality” MR Images: An In Silico Comparison Study Based on the UNet Framework
 
 
applsci-logo
Article Menu

Article Menu

Article

Inter-Rater Variability in the Evaluation of Lung Ultrasound in Videos Acquired from COVID-19 Patients

by
Joaquin L. Herraiz
1,2,
Clara Freijo
1,
Jorge Camacho
3,
Mario Muñoz
3,
Ricardo González
4,
Rafael Alonso-Roca
5,
Jorge Álvarez-Troncoso
6,
Luis Matías Beltrán-Romero
7,8,
Máximo Bernabeu-Wittel
7,8,
Rafael Blancas
9,
Antonio Calvo-Cebrián
10,
Ricardo Campo-Linares
11,
Jaldún Chehayeb-Morán
12,
Jose Chorda-Ribelles
13,
Samuel García-Rubio
14,
Gonzalo García-de-Casasola
15,
Adriana Gil-Rodrigo
16,
César Henríquez-Camacho
17,
Alba Hernandez-Píriz
18,
Carlos Hernandez-Quiles
7,
Rafael Llamas-Fuentes
19,
Davide Luordo
18,
Raquel Marín-Baselga
6,
María Cristina Martínez-Díaz
20,
María Mateos-González
18,
Manuel Mendez-Bailon
21,
Francisco Miralles-Aguiar
22,
Ramón Nogue
23,
Marta Nogué
23,
Borja Ortiz de Urbina-Antia
24,
Alberto Ángel Oviedo-García
25,
José M. Porcel
26,
Santiago Rodriguez
7,
Diego Aníbal Rodríguez-Serrano
20,
Talía Sainz
27,28,29,
Ignacio Manuel Sánchez-Barrancos
30,
Marta Torres-Arrese
15,
Juan Torres-Macho
31,
Angela Trueba Vicente
32,
Tomas Villén-Villegas
33,
Juan José Zafra-Sánchez
34 and
Yale Tung-Chen
6,28,35,*
add Show full author list remove Hide full author list
1
Nuclear Physics Group, EMFTEL and IPARCOS, Universidad Complutense de Madrid, 28040 Madrid, Spain
2
Health Research Institute (IdISSC), Hospital Clinico San Carlos, 28040 Madrid, Spain
3
Group of Ultrasound Systems and Technologies, Institute of Physical and Information Technologies (ITEFI), Spanish National Research Council (CSIC), 28040 Madrid, Spain
4
Dasel SL, Arganda del Rey, 28500 Madrid, Spain
5
Centro de Salud Mar Báltico, 28040 Madrid, Spain
6
Internal Medicine Department, Hospital University La Paz, 28046 Madrid, Spain
7
Internal Medicine Department, Hospital Virgen del Rocío, 41013 Sevilla, Spain
8
Department of Medicine, University of Seville, 41009 Seville, Spain
9
Department of Medicine, Universidad Alfonso X El Sabio. Intensive Care Unit, Hospital Universitario del Tajo, 28300 Aranjuez, Spain
10
Centro de Salud de Robledo de Chavela, 28294 Robledo de Chavela, Spain
11
Emergency Department, Hospital Santa Bárbara, 13500 Puertollano, Spain
12
Emergency Department, Hospital Universitario Clínico de Valladolid, 47003 Valladolid, Spain
13
Internal Medicine Department, Hospital Universitario General de Valencia, 46014 Valencia, Spain
14
Internal Medicine Department, Hospital Santa Marina, 48004 Bilbao, Spain
15
Emergency Department, Hospital Fundación de Alcorcón, 28922 Madrid, Spain
16
Emergency Department, Dr. Balmis General University Hospital, Alicante Institute for Health and Biomedical Research (ISABIAL), 03010 Alicante, Spain
17
Internal Medicine Department, Hospital Universitario Rey Juan Carlos, 28933 Móstoles, Spain
18
Internal Medicine Department, Hospital Infanta Cristina, 28981 Parla, Spain
19
Emergency Department, Hospital Reina Sofia, 14004 Córdoba, Spain
20
Intensive Care Medicine Department, Hospital Universitario Príncipe de Asturias, 28805 Alcalá de Henares, Spain
21
Internal Medicine Department, Hospital Universitario Clínico San Carlos, 28040 Madrid, Spain
22
Anesthesiology Department, Hospital Universitario Puerta del Mar, 11009 Cádiz, Spain
23
Department of Medicine, Universitat de Lleida, 25008 Lleida, Spain
24
Pneumology Department, Hospital Universitario de Cruces, 48903 Barakaldo, Spain
25
Emergency Department, Hospital de Valme, 41014 Sevilla, Spain
26
Internal Medicine Department, Hospital Universitario Arnau de Vilanova, 25198 Lleida, Spain
27
General Pediatrics and Infectious and Tropical Diseases Department, Hospital Universitario La Paz, 28046 Madrid, Spain
28
Instituto de Investigación Hospital Universitario La Paz-IdiPAZ, 28046 Madrid, Spain
29
Área de Enfermedades Infecciosas del Centro de Investigación Biomédica en Red del Instituto de Salud Carlos III (CIBERINFEC), Instituto de Salud Carlos III, 28029 Madrid, Spain
30
Centro de Salud Pío XII (Ciudad Real I), 13002 Ciudad Real, Spain
31
Internal Medicine Department, Hospital Universitario Infanta Leonor-Virgen de La Torre, 28031 Madrid, Spain
32
Internal Medicine Department, Hospital de Emergencias Enfermera Isabel Zendal, 28055 Madrid, Spain
33
Department of Medicine, Universidad Francisco de Vitoria, 28223 Madrid, Spain
34
Emergency Department, Hospital San Eloy, 48902 Barakaldo, Spain
35
Department of Medicine, Universidad Alfonso X El Sabio, 28055 Madrid, Spain
*
Author to whom correspondence should be addressed.
Appl. Sci. 2023, 13(3), 1321; https://doi.org/10.3390/app13031321
Submission received: 22 November 2022 / Revised: 11 January 2023 / Accepted: 16 January 2023 / Published: 18 January 2023
(This article belongs to the Special Issue Biomedical Imaging: From Methods to Applications)

Abstract

:
Lung ultrasound (LUS) allows for the detection of a series of manifestations of COVID-19, such as B-lines and consolidations. The objective of this work was to study the inter-rater reliability (IRR) when detecting signs associated with COVID-19 in the LUS, as well as the performance of the test in a longitudinal or transverse orientation. Thirty-three physicians with advanced experience in LUS independently evaluated ultrasound videos previously acquired using the ULTRACOV system on 20 patients with confirmed COVID-19. For each patient, 24 videos of 3 s were acquired (using 12 positions with the probe in longitudinal and transverse orientations). The physicians had no information about the patients or other previous evaluations. The score assigned to each acquisition followed the convention applied in previous studies. A substantial IRR was found in the cases of normal LUS (κ = 0.74), with only a fair IRR for the presence of individual B-lines (κ = 0.36) and for confluent B-lines occupying < 50% (κ = 0.26) and a moderate IRR in consolidations and B-lines > 50% (κ = 0.50). No statistically significant differences between the longitudinal and transverse scans were found. The IRR for LUS of COVID-19 patients may benefit from more standardized clinical protocols.

1. Introduction

Lung ultrasound (LUS) is used to quickly and precisely differentiate between the most common causes of respiratory problems. It has been extensively studied as a bedside diagnostic tool and is now universally included in point-of-care ultrasound (PoCUS) guidelines with high-quality supporting evidence [1]. LUS has the potential to refashion healthcare delivery as it enables an augmented clinical interpretation of a patient’s status in real time, which could have an immediate impact on clinical decisions, and even be used to monitor response to therapy and evolution [2,3,4]. Moreover, LUS imaging is typically less expensive than conventional chest X-ray or computed tomography (CT), making it convenient for locations with limited access to these resources [5,6].
LUS has demonstrated an ability to provide immediate information on the condition of COVID-19 patients [4,7]. There are multiple pulmonary manifestations of COVID-19 that can be observed with LUS, such as the presence of pleural effusion, B-line artifacts, or consolidations [8,9,10].
LUS allows physicians to perform a complete bedside chest exam on both mild and severe COVID-19 patients. It is a useful imaging technique for detecting and monitoring the lung involvement as well as prognosis of the disease, and predicting admission to an intensive care unit (ICU) and mortality [3,4,7,11,12]. Furthermore, LUS reduces the risk of environment cross-infection compared to other imaging modalities as these devices can be more easily cleaned and disinfected after use [6,13].
However, LUS is an operator-dependent imaging technique, and its utility depends on accurate acquisition and interpretation by bedside physicians [14,15,16,17]. Poor image acquisition and incorrect identification and interpretation of artifacts are potential sources of error in its clinical application [1]. In previous studies (most of which were conducted before the pandemic), LUS findings showed moderate to fair inter-rater agreement. However, as the observed agreement in the interpretation of frequently occurring events may be due to some extent to chance, more studies with a controlled environment are required to determine the accuracy with which physicians can interpret LUS acquisitions.
Furthermore, to the best of our knowledge, there are no published studies to date that specifically evaluate the best orientation of the transducer (i.e., transverse or longitudinal) in an LUS acquisition in COVID-19 patients (see Figure 1).
Our aim was to first characterize the inter-rater agreement of LUS experts when evaluating the main findings for COVID-19. Our hypothesis was that kappa agreement in ultrasound artifacts and diagnostic interpretation would be substantial, based on the high agreement in other clinical scenarios. We also evaluated the impact of the transducer orientation in LUS acquisitions in COVID-19 patients on the observed findings.

2. Materials and Methods
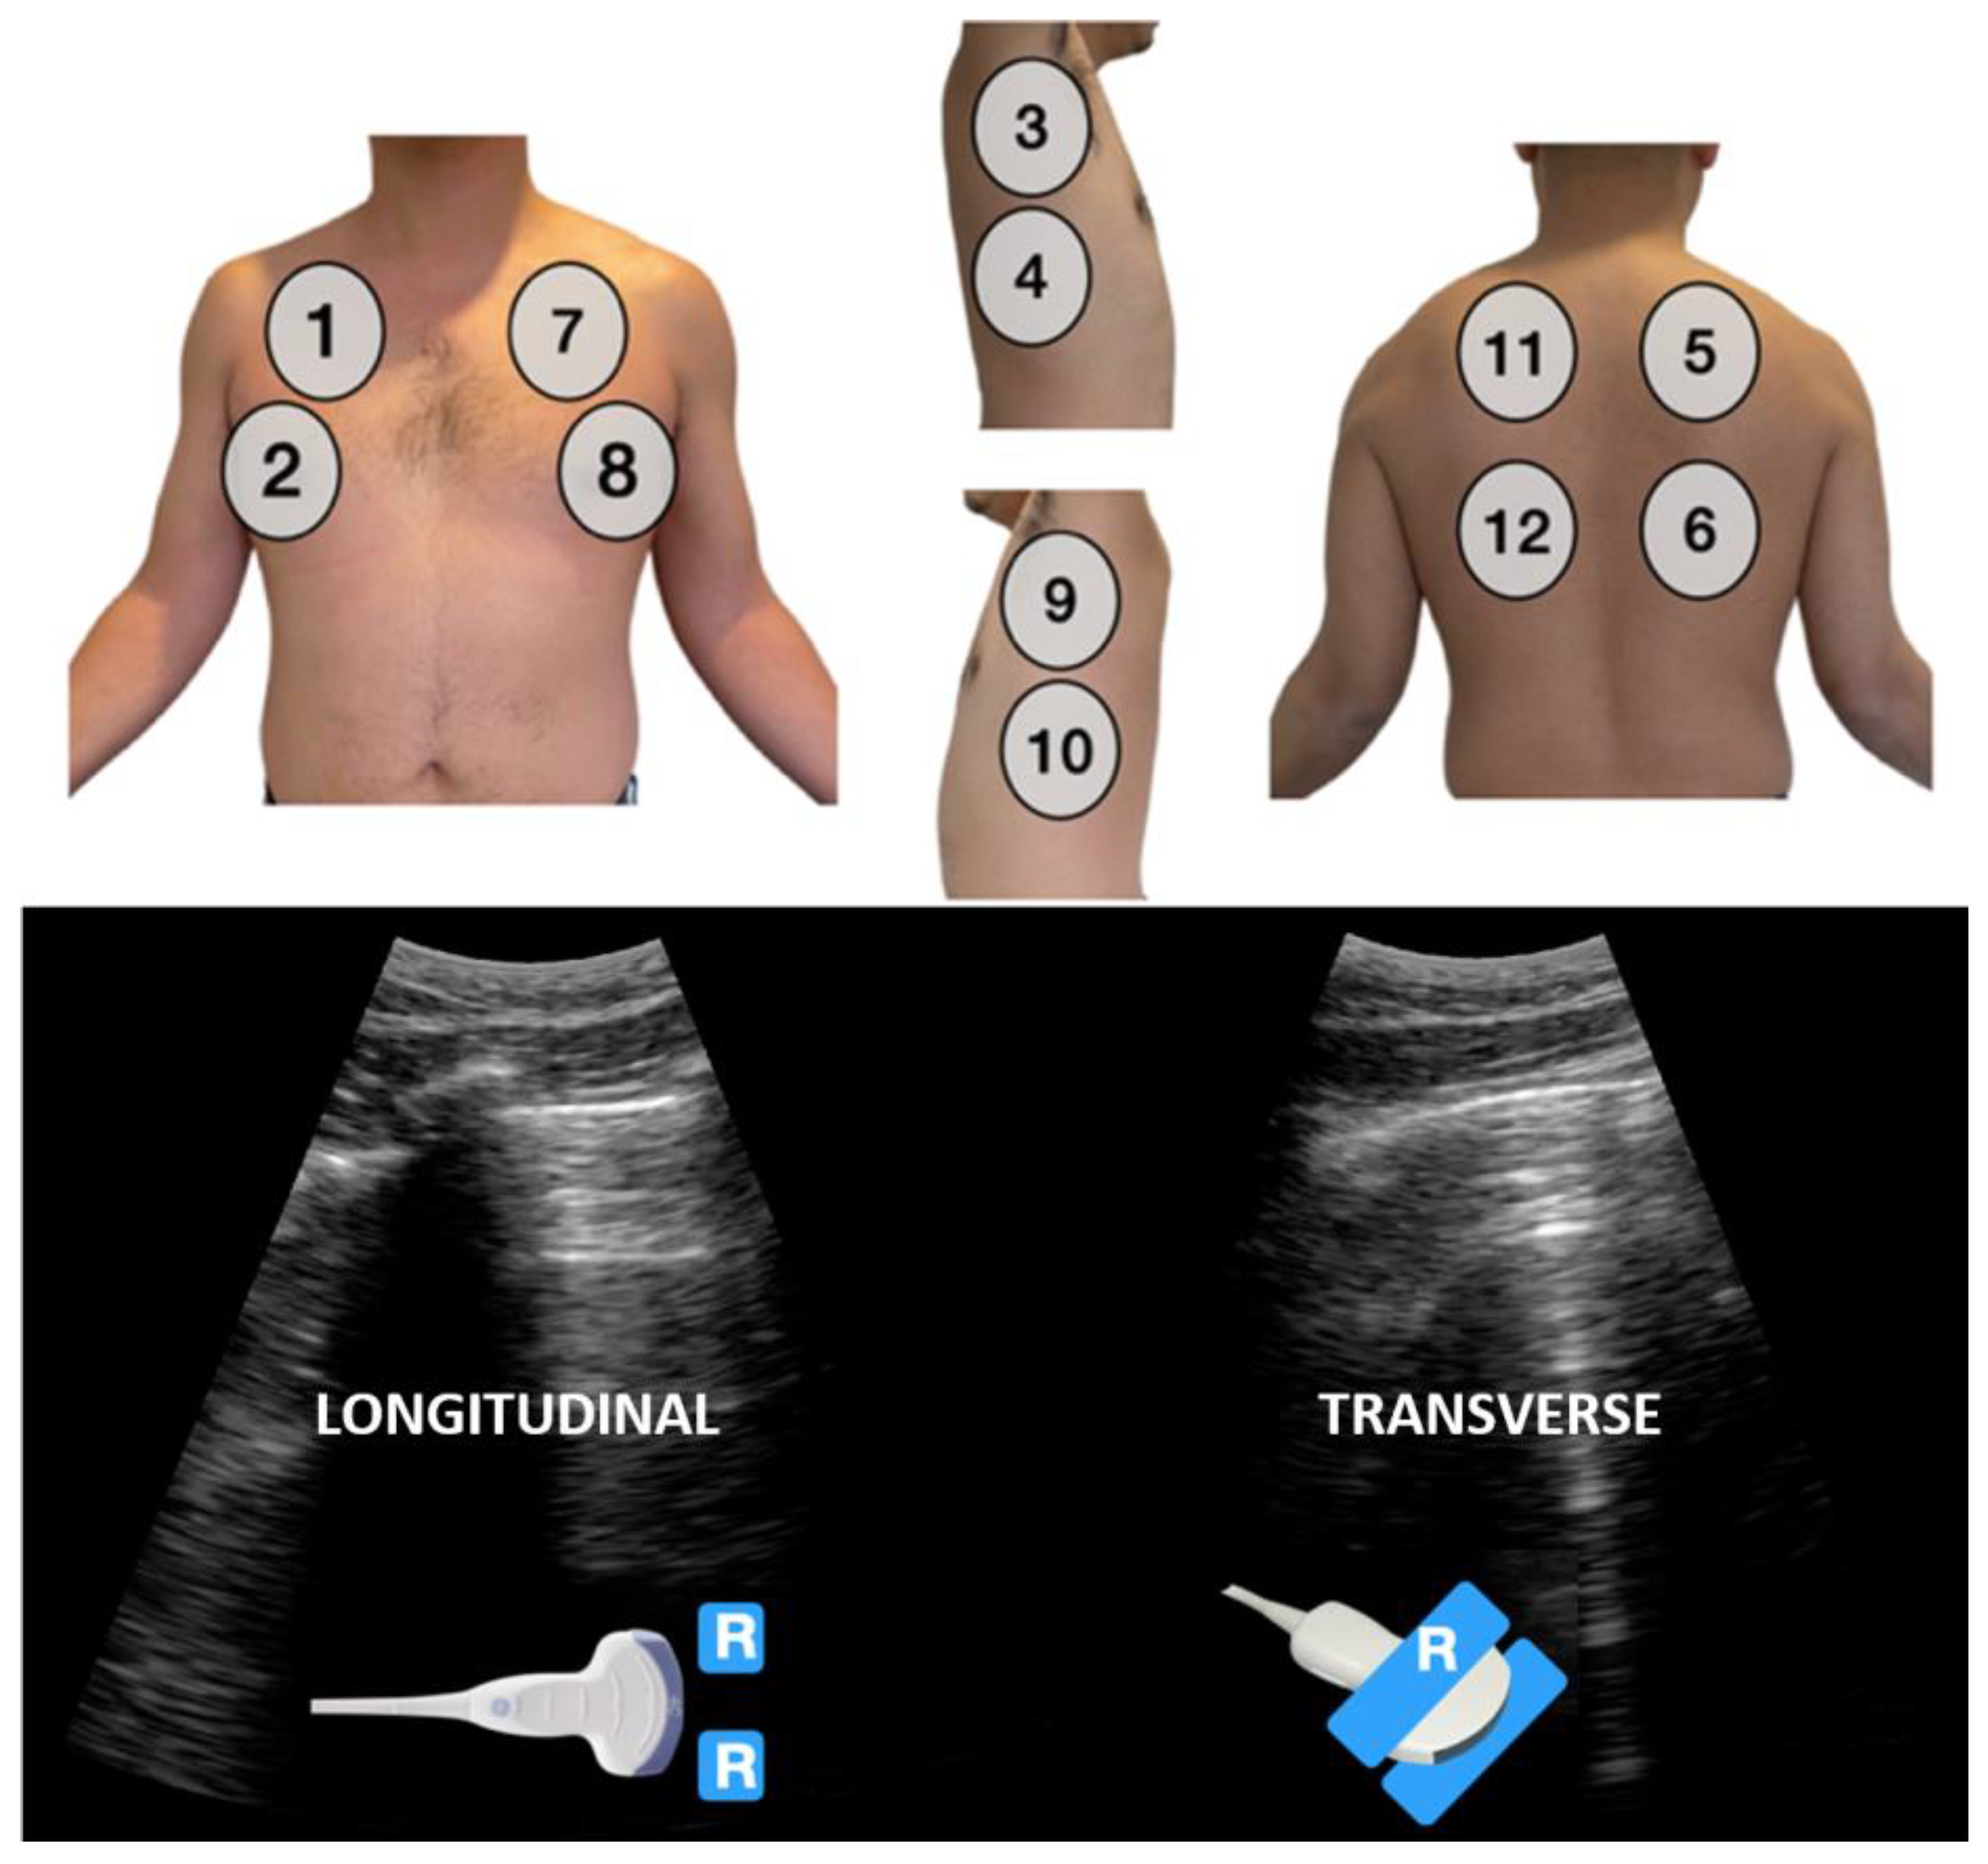
In this study, a total of 33 physicians (internal medicine n = 16; intensivist n = 4; family physician n = 5; pneumology = 1; pediatrics = 1; and emergency medicine, n = 6) with advanced experience in performing and interpreting LUS, from 29 different healthcare centers in Spain, independently evaluated previously acquired ultrasound videos of 20 patients. All had more than 3 years’ experience performing and interpreting LUS.
The acquisitions corresponded to patients with COVID-19 diagnosed by nasopharyngeal RT-PCR for SARS-CoV-2 obtained in the internal medicine service of two different hospitals in Madrid collected during the summer of 2021 [8]. All studies were collected by two physicians (YT-C, AT-V), who followed a 12-areas LUS protocol and a 0–3 point per finding score system [18] (Figure 1). Specifically, each area was scored from 0 to 3 according to the observed patterns (Figure 2). Score 0 is associated with the physiological horizontal artifacts, A-lines. Score 1 is assigned when isolated vertical artifacts appear (B-lines). Score 2 represents confluent B-lines in less than 50% of the pleural line. Score 3 is associated with confluent B-lines extending more than 50% of the pleural line, as well as subpleural or lobar consolidation or pleural effusion. In each zone, the ultrasound probe was used in longitudinal and transverse positions, and a 3 s video of 20 fps was recorded. In total, 24 videos of 3 s each were acquired per patient. No patient had more than one scan in the database. Each physician assigned the highest score to the 3 s video.
In all cases, the data were obtained with a ULTRACOV ultrasound scanner prototype using a 3.5 MHz convex probe with 128-channel ultrasound electronics [8]. This resulted in a total of 480 videos (28,800 frames). The imaging depth in all cases was set to 13 cm. More details of the data acquisition can be found in a recently published work, which focused on the automatic calculation of LUS score [8].
The data were acquired from a study conducted at a tertiary academic hospital and an emergency field hospital that investigated a reduction in the exploration time per patient when using an ultrasound system developed specifically for LUS. The study was reviewed by our institutional review board (IRB) and approved at both participating sites. Informed consent was obtained for each patient.
Several LUS protocols have been proposed for the lung assessment of COVID-19 patients based on the number of areas or points to explore. We adopted a 12-zone scanning protocol, which was previously validated and shown to be consistent with higher ICC and a higher degree of concordance with CT [18].
The selected patients for this study (n = 20) were selected from the total acquired dataset from that study (n = 28) so that half of the cases (n = 10) corresponded to patients in relatively good condition (with a total score between 1 and 7 based on the in situ assessment of the LUS expert), while the other half (n = 10) corresponded to patients who had a moderate condition (with a score between 8 and 18 based on the in situ assessment of the LUS expert). As the LUS device was not located within the ICU, no severe cases were present in the database.
The physicians had no information about the patients in the survey and were blinded to their history and clinical information. They also did not have access to the characteristics of the scanner and the evaluations performed by the other physicians. All the videos from the same patient were supplied together before moving on to the next patient, as would happen in a regular patient examination.
The sonographer expert who collected the videos also conducted the survey, so that a comparison between the findings obtained during the examination and those observed in the surveyed videos was also undertaken. As the survey was performed 9 months after the scans, there was no recollection of each patient’s status at that time.

2.1. Preparation

All participant physicians were instructed to evaluate the de-identified studies and provide their interpretation using a web survey. They received instructions at the beginning of the study, which included the scanning protocol and definition of the orientation of the probe in each case. No other information on the interpretation or definition of the LUS findings was provided during the evaluation. The physicians were blinded to any clinical or imaging information. Furthermore, they had no prior experience with the system used to collect the videos.
In previous studies [4,14], physicians met before performing the evaluations for the inter-rater study to review some sample videos to discuss their interpretation. In this case, no previous calibration session was conducted.

2.2. Data Analysis

We performed a series of statistical analyses comparing the interpretation of the presence of ultrasound artifacts and the ultrasound diagnosis performed by the physicians. All were performed with Python using NumPy and Scikit-learn libraries.
First, we evaluated the agreement between raters of the individual scores (0, 1, 2, or 3) assigned by each observer to each of the 480 videos in the study. These videos correspond to the 20 patients, with 12 zones and two probe orientations each. Cohen’s kappa was used to quantify the inter-rater agreement between each pair of physicians [19]. The coefficient ranges from −1 to +1, with 0 representing random chance and 1 representing perfect agreement.
Based on the total score from the evaluation of the 12 zones, patients were classified into four subgroups: A. total score 0; B. total score between 1 and 7; C. total score between 8 and 18; D. total score between 19 and 36. These subgroups have been used in previous studies to obtain a fair indication of the severity of their condition. Similar to previous cases, Cohen’s kappa between this four-class classification was obtained. In this case, analysis was performed separately for the longitudinal and transverse examinations. The results are shown in Figure 3.
Agreement in the interpretation of each ultrasound artifact (A-lines, isolated B-lines, confluent B-lines, and consolidations) was also assessed separately. The degree of inter-rater agreement was evaluated using Fleiss’ kappa statistics (k) [19,20]. Kappa values close to 1 imply strong agreement beyond chance in LUS diagnosis [19,20]. We interpreted the scaled kappa statistics as follows: k ≤ 0, less than chance agreement; k 0.01–0.20, slight agreement; k 0.21–0.40, fair agreement; k 0.41–0.60, moderate agreement; k 0.61–0.80, substantial agreement; and k ≥ 0.81, near-perfect agreement [19,20]. Table 1 contains the results of this analysis.
As an alternative means of visualizing agreement in the findings, Figure 5 shows a matrix of the scores assigned to each video with respect to the most voted score (among the 33 evaluations), which can be considered as a surrogate for the ground truth. This provides a quick view of the most challenging scores. Agreement between the comparison of the ultrasound diagnosis performed in situ with the recorded videos was also undertaken utilizing k values adjusted for maximum attainable agreement.

3. Results

3.1. Patients

The selected patients in this study (n = 20) corresponded to COVID-19 admissions to hospital. The mean age was 53.2 years (standard deviation (SD) 11.9) and 45% was female. Five patients (25%) had hypertension, two (10%) were diabetic, and none had cardiovascular disease. They had an average of 19.1 days (SD 20.6) after symptom onset, consisting of fever (95%), shortness of breath (75%), and weakness (85%). The mean lymphocyte count was 1.81 × 10⁹ (SD 1.00), C-reactive protein was 29.4 mg/dL (SD 33.3), and D-dimer 536.47 ng/mL (SD 315.7) at admission. No patients died at follow-up. The LUS exams were performed within 2–3 days of their hospital admission after obtaining consent. None ended up in ICU and all were discharged after several days/weeks in hospital.

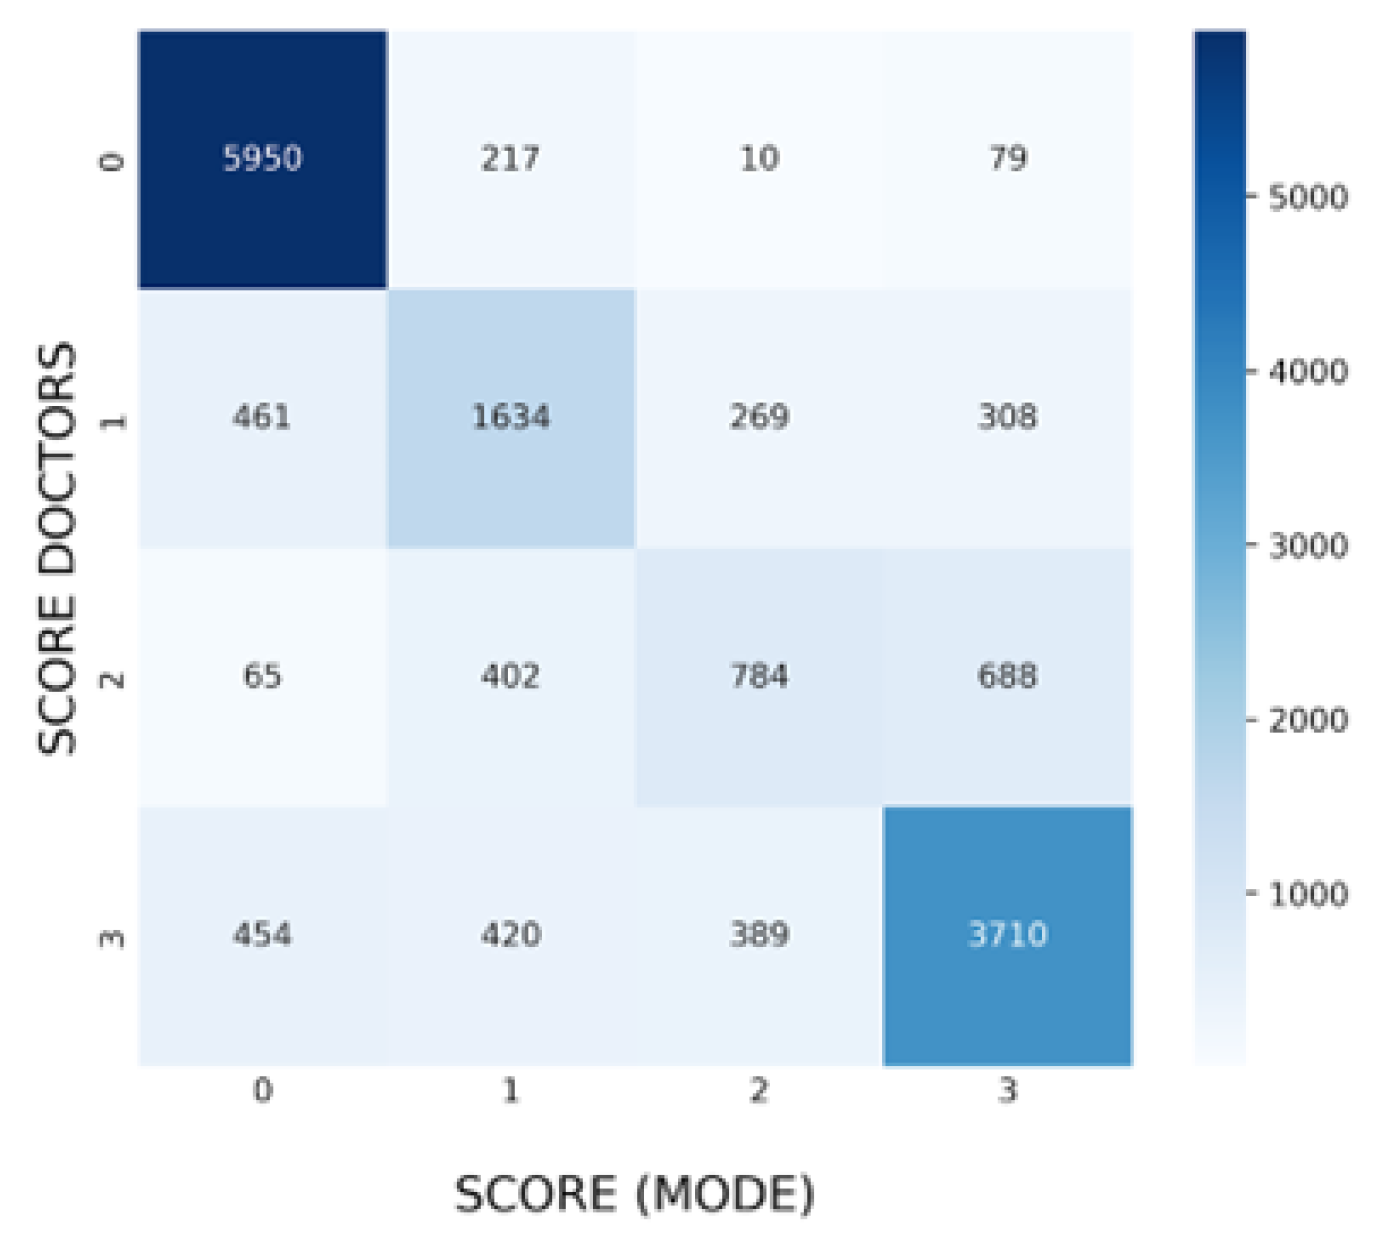
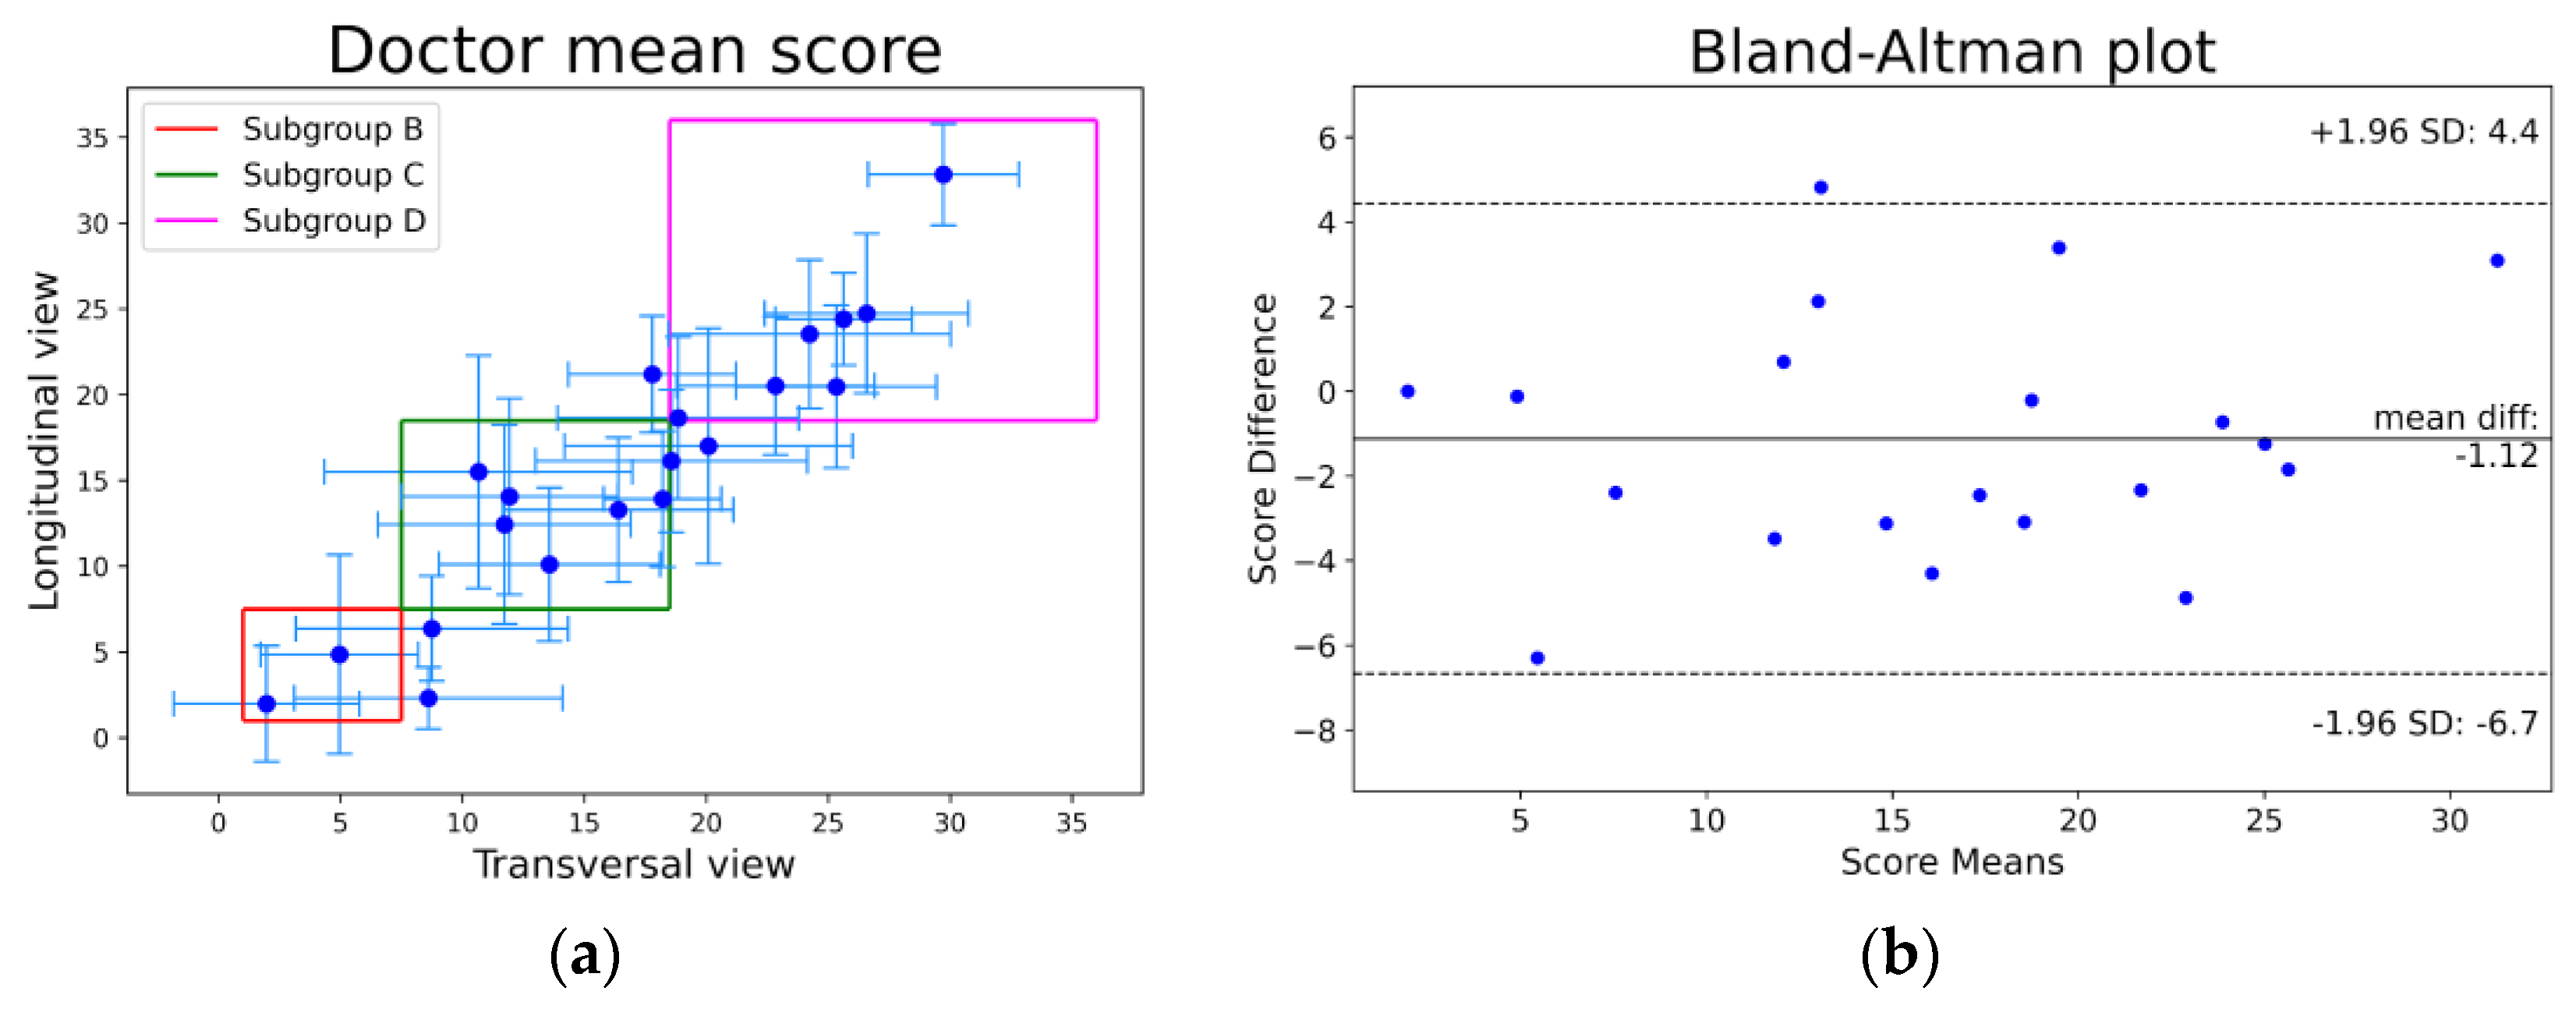
3.2. Overall Agreement between Raters

The overall Cohen’s kappa statistics between each pair of raters of the 480 videos are shown in Figure 4. Raters are sorted from left to right based on their overall Cohen’s kappa with their peers (0.45 to 0.78 variation).
Comparison of the evaluations of the sonographer who collected the videos performed during the examination with respect to those observed in the surveyed videos indicates a Cohen’s kappa value of 0.68 (moderate agreement).
The most relevant outcome of the patient LUS evaluation is their classification into four subgroups based on the severity of their lung condition. Therefore, we evaluated Cohen’s kappa between the classification of patients in each subgroup performed by each physician considering longitudinal and transversal directions (Figure 4). The agreement was slightly higher with the studies performed in the longitudinal direction (Figure 4).

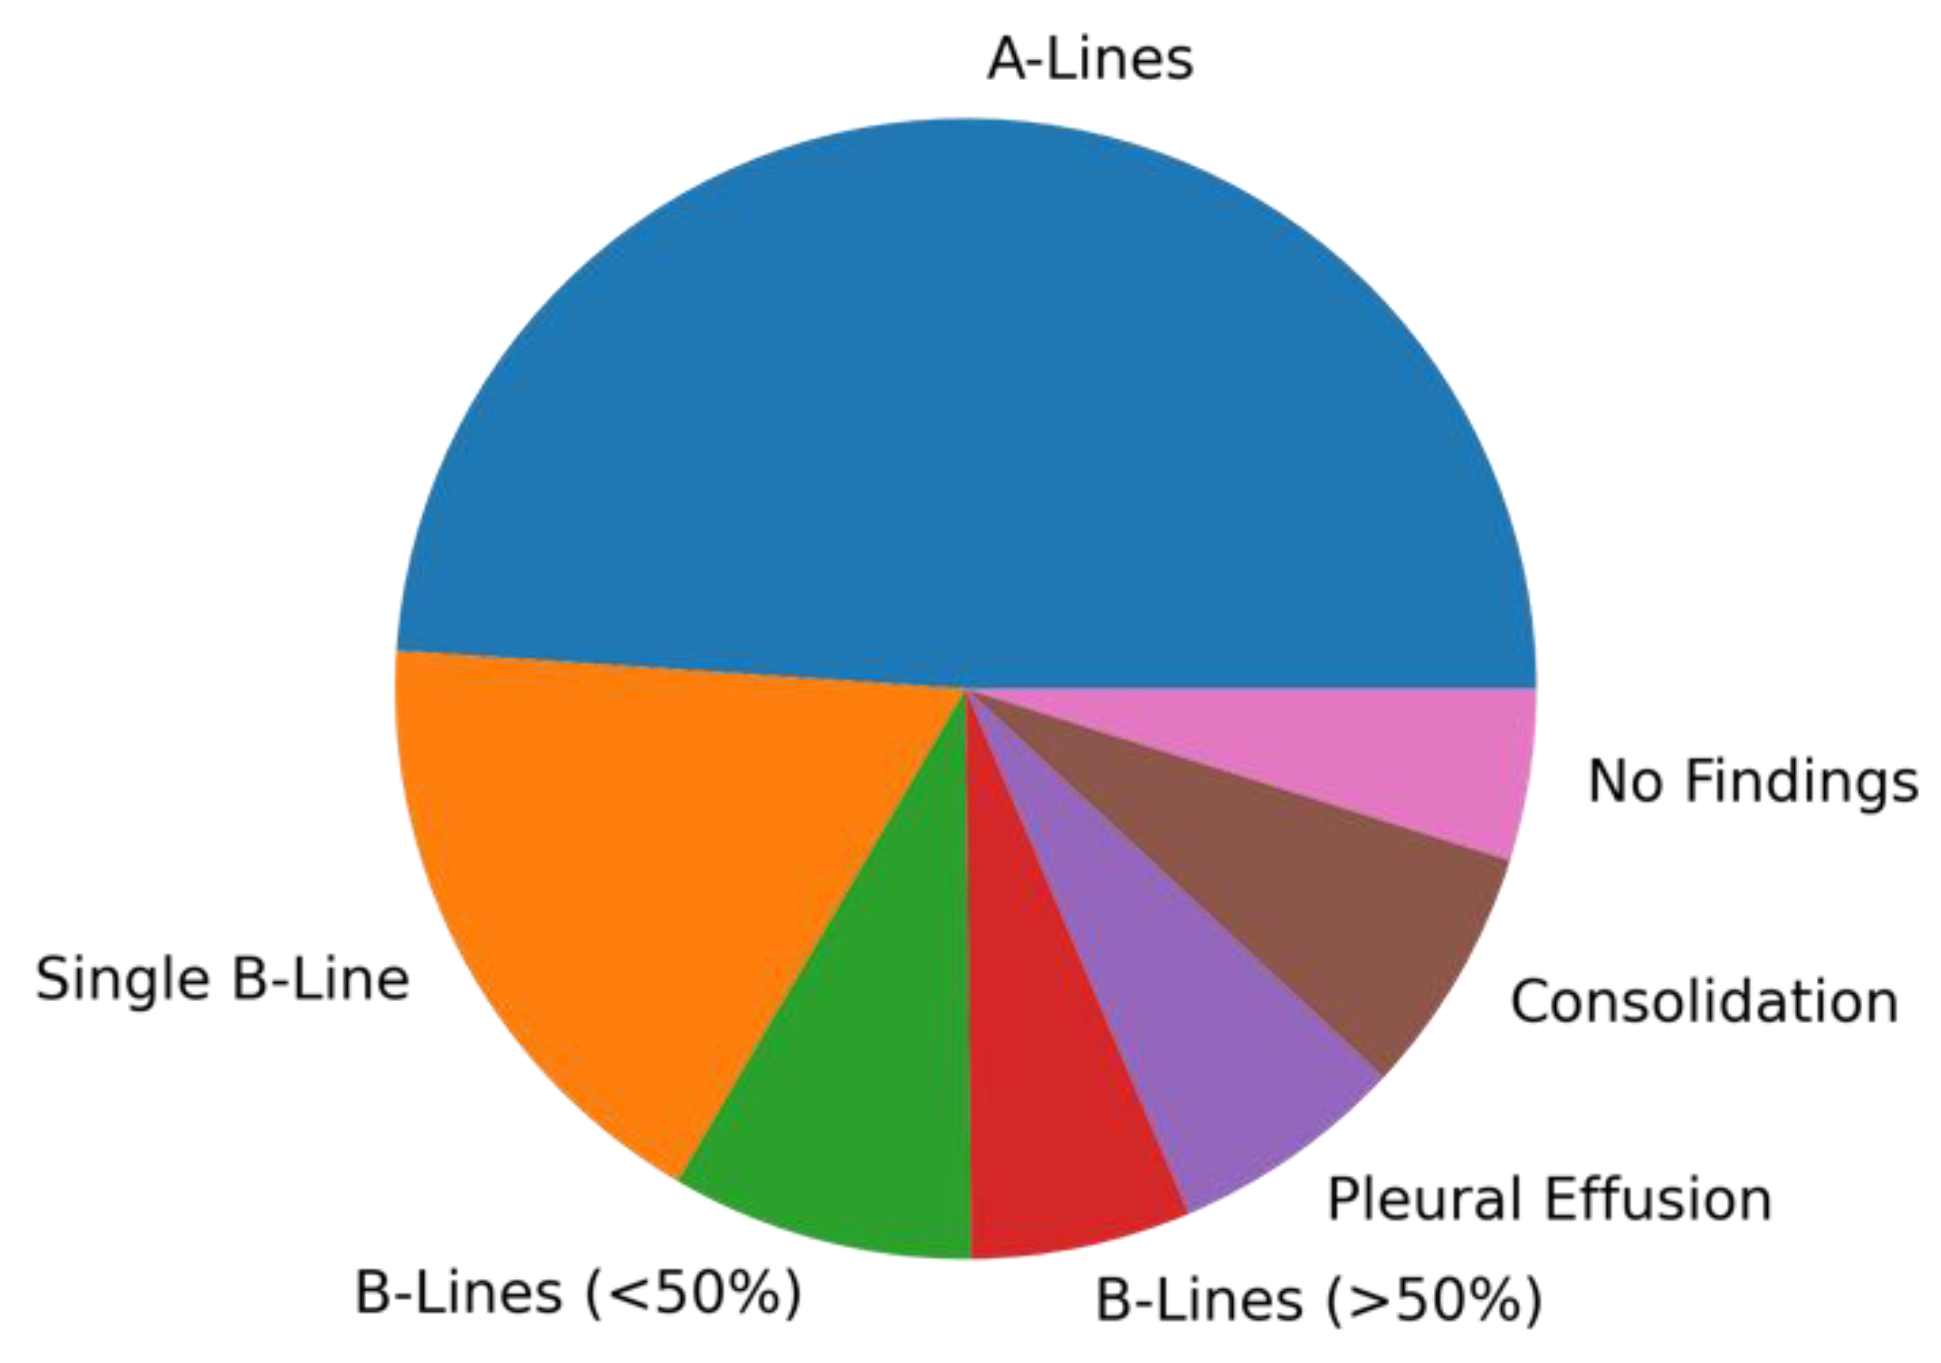
3.3. Agreement in Specific Findings

Regarding the degree of agreement between physicians with respect to the specific findings, Table 1 summarizes Fleiss’ kappa analysis. There was good agreement in determining (normal) A-lines (κ = 0.74) and fair agreement in determining the presence of individual B-lines (κ = 0.36), as well as on the presence of confluent B-lines occupying less than 50% of the ultrasound image (κ = 0.26). Moderate agreement was found for confluent B-lines occupying more than 50% and consolidations (κ = 0.50).
Figure 5 shows a matrix with information on how the scores were assigned to each video with respect to the most voted score (mode) in each case. The most voted score (mode) may be considered a good estimation of the ground truth. The largest differences were found for score = 2.

3.4. Agreement in Specific Findings

Regarding the impact of the probe orientation (longitudinal or transversal, as shown in Figure 1) when performing the study, the total score assigned to each patient in both cases is shown in Figure 6. A scatter plot shows very good correlation between both types of examination (R2 = 0.87) and the Bland–Altman plot of longitudinal minus transversal scores indicates that, on average, the longitudinal view indicates slightly lower scores (−1.12).

4. Discussion

Easy-to-access and reliable diagnostic methods, which can accurately guide the management of COVID-19, are vital in non-hospital settings and areas with limited resources [5]. Some studies have noted that LUS could be a first-line diagnostic alternative to conventional chest X-ray and CT scans since there is no exposure to ionizing radiation [4,6,13] and should be encouraged to avoid transporting patients and reduce the risk of environmental contamination [21,22,23]. Moreover, it could be considered in vulnerable populations, such as pregnant women and children.
Previous research has shown that COVID-19 has notable LUS characteristics, such as B-lines or consolidations [11]. These findings correlate well with COVID-19 CT findings, such as ground-glass consolidations and septal thickening [9]. As a result, given that LUS may be able to predict outcomes in COVID-19 patients, it is crucial to ascertain whether clinicians can correctly interpret these results.
In this study, several LUS findings demonstrated moderate agreement (e.g., consolidations) and others fair agreement (e.g., individual B-lines and confluent B-lines <50%). Therefore, LUS could signify a reliable COVID-19 diagnostic and prognostic tool. Moreover, there was good agreement as to whether an LUS scan was interpreted as normal. In addition, beyond COVID-19, an abnormal LUS scan has prognostic implications for multiple diseases. This study represents the first study to assess inter-observer agreement in LUS findings in COVID-19 obtained with the same device and including practitioners from multiple specialties and centers, who commonly use different portable devices.
Our results are similar to other previous studies on inter-rater reliability for LUS outside of COVID-19. Previous investigations have demonstrated moderate to substantial agreement for B-lines [15,16,17], while this research shows only moderate to fair agreement for consolidations. This is similar to the results obtained in a previous LUS study with COVID-19 patients [14].
This work shows the importance of working toward a more standardized interpretation protocol. Among the possible solutions, the following options should be considered:
(1)
Standardization of the terminology to describe artifacts and signs in LUS is essential. Several definitions of each LUS abnormality can be found in the literature, especially for consolidations, but also regarding pleural abnormalities [1], which were not considered in this study. This group believes that the reliability of findings such as consolidations might improve with a more specific and consensus-based definition.
(2)
The use of automatic tools to quickly analyze the acquisitions and obtain some quantitative values, such as the percentage of affected pleura (B-lines < 50% or >50%) and the size of the consolidations, may be helpful to obtain more consistent results among raters.
(3)
The length of the acquired videos (3 s in this study) could be extended to provide more information in some cases.
(4)
Access to additional clinical data about the patients may also help in their evaluation.
There are several limitations to this study. Due to its dynamic nature, the use of LUS fundamentally differs from traditional medical imaging practices where an exam is performed by a technologist and interpreted remotely by a physician with limited clinical knowledge of the patient. The same provider performs and interprets the study, immediately integrates the findings into the clinical setting, and repeats the study as needed to identify changes associated with bedside interventions. In this case, the raters did not have the opportunity to explore the patients or adapt the ultrasound exploration according to their preferences and findings. Therefore, despite allowing us to evaluate the scans in a very controlled setting (same device, same image quality, etc.), this type of patient observation is not realistic. This fact may have caused some errors in the interpretation of some particular cases. The impact of this was evaluated by performing a comparison of the evaluations the sonographer who collected the videos during the examination with respect to those observed in the surveyed videos. The moderate agreement found (Cohen’s kappa 0.68) in this case is a good indication of the differences that might be expected between in situ evaluations and those performed with a recorded video.
Furthermore, in this study, there were no patients who suffered extremely severe conditions. This reduced the number and size of the consolidations (if present), making them more difficult to identify (see Figure 7). As shown in Figure 5 and Table 1, the cases with score = 2 were those with significantly higher disagreements.
In terms of which is the best way to perform LUS, i.e., whether to use longitudinal or transversal view, our results show that there is a very good correlation between both types of examination (R2 = 0.87), although, on average, the transversal view provides slightly higher scores (1.12). This was expected as avoiding the ribs provides a larger field of view of the lungs and, therefore, a higher probability of detecting pneumonia-related artifacts. The difference is small and does not impact the classification of patients into subgroups for most patients. However, in our case, 4 out of 20 patients changed their subgroup, with 3 increasing their subgroup classification with a transversal view and one decreasing the subgroup (Figure 6). This does not necessarily mean the two orientations are similarly useful, especially since we only examined a type of interstitial lung disease. In certain pathologies, such as pneumothorax, the visualization of the ribs provides a depth landmark and helps to better identify the pleural line. Consequently, our group believes that each patient might benefit most from a different approach, which has been adapted to a flexible scanning protocol subject to the clinical scenario. We would like to acknowledge that, as in all cases, the 12 videos of the transversal view of each patient were evaluated right after the 12 videos of the longitudinal view, this may have created some undesirable correlation between both evaluations. This was chosen to mimic the original in situ study, but a more randomized order of the videos could have been a better choice.
Furthermore, pathological findings such as B-lines may have been better represented than others (consolidations and pleural effusions). Despite these limitations, this study represents one of the most controlled studies into the inter-observer agreement of LUS findings for COVID-19.
Other studies could be conducted with the gathered data. For instance, a study of variability by region (i.e., anterior vs lateral vs posterior), upper and lower, left and right, etc., could be conducted. Furthermore, we did not include AI tools, which are able to evaluate the acquired videos and compare them with human observers. In this work, the AI tool used in [8,16] was not compared but will be part of future work.

5. Conclusions

The most reliable LUS findings with COVID-19 were the presence of B-lines or determining whether a scan is normal. We did not observe statistically significant differences between the longitudinal and transverse scans. The IRR in LUS of COVID-19 patients may benefit from more standardized clinical protocols.

Author Contributions

Conceptualization, J.L.H., J.C. and Y.T.-C.; Methodology, Y.T.-C.; Software, J.L.H., C.F., J.C., M.M. and R.G.; Validation, M.M., R.G., R.A.-R., J.Á.-T., L.M.B.-R., M.B.-W., R.B., A.C.-C., R.C.-L., J.C.-M., J.C.-R., S.G.-R., G.G.-d.-C., A.G.-R., C.H.-C., C.H.-Q., R.L.-F., D.L., R.M.-B., M.C.M.-D., M.M.-G., M.M.-B., R.N., M.N., B.O.d.U.-A., A.Á.O.-G., J.M.P., S.R., D.A.R.-S., T.S., I.M.S.-B., M.T.-A. and Y.T.-C.; Formal analysis, J.L.H., C.F. and M.M.; Investigation, R.A.-R., J.Á.-T., L.M.B.-R., M.B.-W., R.B., A.C.-C., R.C.-L., J.C.-M., J.C.-R., S.G.-R., G.G.-d.-C., A.G.-R., C.H.-C., A.H.-P., C.H.-Q., R.L.-F., D.L., R.M.-B., M.C.M.-D., M.M.-G., M.M.-B., F.M.-A., R.N., M.N., B.O.d.U.-A., A.Á.O.-G., J.M.P., S.R., D.A.R.-S., T.S., I.M.S.-B., M.T.-A., J.T.-M., A.T.V., T.V.-V., J.J.Z.-S. and Y.T.-C.; Resources, J.C., R.G. and Y.T.-C.; Data curation, J.L.H. and C.F.; Writing—original draft, J.L.H. and C.F.; Writing—review & editing, J.L.H., C.F., J.C., M.M., R.G., R.A.-R., J.Á.-T., L.M.B.-R., M.B.-W., R.B., A.C.-C., R.C.-L., J.C.-M., J.C.-R., S.G.-R., G.G.-d.-C., A.G.-R., C.H.-C., A.H.-P., C.H.-Q., R.L.-F., D.L., R.M.-B., M.C.M.-D., M.M.-G., M.M.-B., F.M.-A., R.N., M.N., B.O.d.U.-A., A.Á.O.-G., J.M.P., S.R., D.A.R.-S., T.S., I.M.S.-B., M.T.-A., J.T.-M., A.T.V., T.V.-V., J.J.Z.-S. and Y.T.-C.; Visualization, A.H.-P., F.M.-A., J.J.Z.-S. and Y.T.-C.; Supervision, J.L.H., C.F., J.C., J.T.-M., A.T.V., T.V.-V. and Y.T.-C.; Funding acquisition, J.C. All authors have read and agreed to the published version of the manuscript.

Funding

This research was partially funded by CDTI (Spanish acronym: Centre for Industrial Technological Development), funding number COI-20201153. Partially supported by the Google Cloud Research Credits program with the funding number GCP19980904, by the project RTI2018-099118-A-I00 founded by MCIU/AEI/FEDER UE and by the European Commission–NextGenerationEU, through CSIC’s Global Health Platform (PTI Salud Global).

Institutional Review Board Statement

The study was conducted in accordance with the guidelines of the Declaration of Helsinki and approved by the IRB of Hospital Universitario Puerta de Hierro (protocol code 2.0 5 April 2021 and date of approval April 2021).

Informed Consent Statement

Informed consent was obtained from all subjects involved in the study.

Data Availability Statement

Not applicable.

Conflicts of Interest

The authors declare no conflict of interest.

References

  1. Demi, L.; Wolfram, F.; Klersy, C.; De Silvestri, A.; Ferretti, V.V.; Muller, M.; Miller, D.; Feletti, F.; Wełnicki, M.; Buda, N.; et al. New International Guidelines and Consensus on the Use of Lung Ultrasound. J. Ultrasound Med. 2022, 42, 309–344. [Google Scholar] [CrossRef]
  2. Gil-Rodrigo, A.; Llorens, P.; Luque-Hernández, M.-J.; Martínez-Buendía, C.; Ramos-Rincón, J.-M. Lung Ultrasound Integration in Assessment of Patients with Noncritical COVID-19. J. Ultrasound Med. Off. J. Am. Inst. Ultrasound Med. 2021, 40, 2203–2212. [Google Scholar] [CrossRef]
  3. Torres-Macho, J.; Sánchez-Fernández, M.; Arnanz-González, I.; Tung-Chen, Y.; Franco-Moreno, A.I.; Duffort-Falcó, M.; Beltrán-Romero, L.; Rodríguez-Suaréz, S.; Bernabeu-Wittel, M.; Urbano, E.; et al. Prediction Accuracy of Serial Lung Ultrasound in COVID-19 Hospitalized Patients (Pred-Echovid Study). J. Clin. Med. 2021, 10, 4818. [Google Scholar] [CrossRef] [PubMed]
  4. Volpicelli, G.; Gargani, L.; Perlini, S.; Spinelli, S.; Barbieri, G.; Lanotte, A.; Casasola, G.G.; Nogué-Bou, R.; Lamorte, A.; Agricola, E.; et al. Lung Ultrasound for the Early Diagnosis of COVID-19 Pneumonia: An International Multicenter Study. Intensive Care Med. 2021, 47, 444–454. [Google Scholar] [CrossRef] [PubMed]
  5. Calvo-Cebrián, A.; Alonso-Roca, R.; Rodriguez-Contreras, F.J.; Rodríguez-Pascual, M.d.l.N.; Calderín-Morales, M.d.P. Usefulness of Lung Ultrasound Examinations Performed by Primary Care Physicians in Patients With Suspected COVID-19. J. Ultrasound Med. 2021, 40, 741–750. [Google Scholar] [CrossRef] [PubMed]
  6. Ebrahimzadeh, S.; Islam, N.; Dawit, H.; Salameh, J.-P.; Kazi, S.; Fabiano, N.; Treanor, L.; Absi, M.; Ahmad, F.; Rooprai, P.; et al. Thoracic Imaging Tests for the Diagnosis of COVID-19. Cochrane Database Syst. Rev. 2022, 5, CD013639. [Google Scholar] [CrossRef] [PubMed]
  7. Caroselli, C.; Blaivas, M.; Marcosignori, M.; Tung Chen, Y.; Falzetti, S.; Mariz, J.; Fiorentino, R.; Pinto Silva, R.; Gomes Cochicho, J.; Sebastiani, S.; et al. Early Lung Ultrasound Findings in Patients With COVID-19 Pneumonia: A Retrospective Multicenter Study of 479 Patients. J. Ultrasound Med. Off. J. Am. Inst. Ultrasound Med. 2022, 41, 2547–2556. [Google Scholar] [CrossRef]
  8. Camacho, J.; Muñoz, M.; Genovés, V.; Herraiz, J.L.; Ortega, I.; Belarra, A.; González, R.; Sánchez, D.; Giacchetta, R.C.; Trueba-Vicente, Á.; et al. Artificial Intelligence and Democratization of the Use of Lung Ultrasound in COVID-19: On the Feasibility of Automatic Calculation of Lung Ultrasound Score. Int. J. Transl. Med. 2022, 2, 17–25. [Google Scholar] [CrossRef]
  9. Tung-Chen, Y.; de Gracia, M.M.; Díez-Tascón, A.; Alonso-González, R.; Agudo-Fernández, S.; Parra-Gordo, M.L.; Ossaba-Vélez, S.; Rodríguez-Fuertes, P.; Llamas-Fuentes, R. Correlation between Chest Computed Tomography and Lung Ultrasonography in Patients with Coronavirus Disease 2019 (COVID-19). Ultrasound Med. Biol. 2020, 46, 2918–2926. [Google Scholar] [CrossRef]
  10. Porcel, J.M. Pleural Diseases and COVID-19: Ubi Fumus, Ibi Ignis. Eur. Respir. J. 2020, 56, 2003308. [Google Scholar] [CrossRef] [PubMed]
  11. Hernández-Píriz, A.; Tung-Chen, Y.; Jiménez-Virumbrales, D.; Ayala-Larrañaga, I.; Barba-Martín, R.; Canora-Lebrato, J.; Zapatero-Gaviria, A.; Casasola-Sánchez, G.G.D. Importance of Lung Ultrasound Follow-Up in Patients Who Had Recovered from Coronavirus Disease 2019: Results from a Prospective Study. J. Clin. Med. 2021, 10, 3196. [Google Scholar] [CrossRef]
  12. Tung-Chen, Y.; Gil-Rodrigo, A.; Algora-Martín, A.; Llamas-Fuentes, R.; Rodríguez-Fuertes, P.; Marín-Baselga, R.; Alonso-Martínez, B.; Sanz Rodríguez, E.; Llorens Soriano, P.; Ramos-Rincón, J.-M. The lung ultrasound “Rule of 7” in the prognosis of COVID-19 patients: Results from a prospective multicentric study. Med. Clín. 2022, 159, 19–26. [Google Scholar] [CrossRef]
  13. Hussain, A.; Via, G.; Melniker, L.; Goffi, A.; Tavazzi, G.; Neri, L.; Villen, T.; Hoppmann, R.; Mojoli, F.; Noble, V.; et al. Multi-Organ Point-of-Care Ultrasound for COVID-19 (PoCUS4COVID): International Expert Consensus. Crit. Care Lond. Engl. 2020, 24, 702. [Google Scholar] [CrossRef]
  14. Kumar, A.; Weng, Y.; Graglia, S.; Chung, S.; Duanmu, Y.; Lalani, F.; Gandhi, K.; Lobo, V.; Jensen, T.; Nahn, J.; et al. Interobserver Agreement of Lung Ultrasound Findings of COVID-19. J. Ultrasound Med. Off. J. Am. Inst. Ultrasound Med. 2021, 40, 2369–2376. [Google Scholar] [CrossRef] [PubMed]
  15. DeSanti, R.L.; Cowan, E.A.; Kory, P.D.; Lasarev, M.R.; Schmidt, J.; Al-Subu, A.M. The Inter-Rater Reliability of Pediatric Point-of-Care Lung Ultrasound Interpretation in Children With Acute Respiratory Failure. J. Ultrasound Med. Off. J. Am. Inst. Ultrasound Med. 2022, 41, 1159–1167. [Google Scholar] [CrossRef]
  16. Fatima, N.; Mento, F.; Zanforlin, A.; Smargiassi, A.; Torri, E.; Perrone, T.; Demi, L. Human-to-AI Interrater Agreement for Lung Ultrasound Scoring in COVID-19 Patients. J. Ultrasound Med. Off. J. Am. Inst. Ultrasound Med. 2022. [Google Scholar] [CrossRef]
  17. Šustić, A.; Mirošević, M.; Szuldrzynski, K.; Marčun, R.; Haznadar, M.; Podbegar, M.; Protić, A. Inter-Observer Reliability for Different Point-of-Care Lung Ultrasound Findings in Mechanically Ventilated Critically Ill COVID-19 Patients. J. Clin. Monit. Comput. 2022, 36, 279–281. [Google Scholar] [CrossRef]
  18. Tung-Chen, Y.; Ossaba-Vélez, S.; Acosta Velásquez, K.S.; Parra-Gordo, M.L.; Díez-Tascón, A.; Villén-Villegas, T.; Montero-Hernández, E.; Gutiérrez-Villanueva, A.; Trueba-Vicente, Á.; Arenas-Berenguer, I.; et al. The Impact of Different Lung Ultrasound Protocols in the Assessment of Lung Lesions in COVID-19 Patients: Is There an Ideal Lung Ultrasound Protocol? J. Ultrasound 2021, 25, 483–491. [Google Scholar] [CrossRef]
  19. McHugh, M.L. Interrater Reliability: The Kappa Statistic. Biochem. Med. 2012, 22, 276–282. [Google Scholar] [CrossRef]
  20. Stemler, S. A Comparison of Consensus, Consistency, and Measurement Approaches to Estimating Interrater Reliability. Pract. Assess. Res. Eval. 2019, 9, 4. [Google Scholar] [CrossRef]
  21. Mateos González, M.; García de Casasola Sánchez, G.; Muñoz, F.J.T.; Proud, K.; Lourdo, D.; Sander, J.-V.; Jaimes, G.E.O.; Mader, M.; Canora Lebrato, J.; Restrepo, M.I.; et al. Comparison of Lung Ultrasound versus Chest X-ray for Detection of Pulmonary Infiltrates in COVID-19. Diagnostics 2021, 11, 373. [Google Scholar] [CrossRef]
  22. Pellegrino, F.; Carnevale, A.; Bisi, R.; Cavedagna, D.; Reverberi, R.; Uccelli, L.; Leprotti, S.; Giganti, M. Best Practices on Radiology Department Workflow: Tips from the Impact of the COVID-19 Lockdown on an Italian University Hospital. Healthcare 2022, 10, 1771. [Google Scholar] [CrossRef]
  23. Wang, M.; Luo, X.; Wang, L.; Estill, J.; Lv, M.; Zhu, Y.; Wang, Q.; Xiao, X.; Song, Y.; Lee, M.S.; et al. A Comparison of Lung Ultrasound and Computed Tomography in the Diagnosis of Patients with COVID-19: A Systematic Review and Meta-Analysis. Diagnostics 2021, 11, 1351. [Google Scholar] [CrossRef]
Figure 1. Ultrasound 12 scanning locations (top row) and the two orientations of the transducer considered (bottom row). “R” stands for rib.
Applsci 13 01321 g001
Figure 2. Examples of the four different scores for the respective LUS findings.
Applsci 13 01321 g002
Figure 3. Cohen’s kappa between raters for (a) longitudinal acquisitions and (b) transversal acquisitions classifying patients into 4 subgroups according to their total score. Raters are sorted from left to right based on their overall Cohen’s kappa with their peers (indicated by the axis ticks).
Applsci 13 01321 g003
Figure 4. Comparison of the agreement between each pair of raters using Cohen’s kappa. This was obtained from the scores assigned by each rater using all 480 videos. Raters are sorted from left to right based on their overall Cohen’s kappa with their peers (indicated by the axis ticks).
Applsci 13 01321 g004
Figure 5. Scores assigned to each video (vertical axis) with respect to the most voted scores (mode, horizontal axis) among the 33 evaluations in each case.
Applsci 13 01321 g005
Figure 6. (a) Scatter plot with the longitudinal vs transversal total scores per patient. Points and error bars correspond to the average and standard deviation, respectively, of the evaluations obtained from all physicians. The 3 subgroups shown correspond to the classification of the patients based on their severity; (b) Bland–Altman plot of the total score per patient (obtained as the average value of all the evaluations) assigned to the videos acquired with longitudinal and transversal probe orientation (“Score difference” indicates longitudinal minus transversal scores).
Applsci 13 01321 g006
Figure 7. Pie chart with the distribution of findings observed by the participants in all the videos considered. A reduced number of severe cases can be observed.
Applsci 13 01321 g007
Table 1. Fleiss kappa analysis of the inter-rater agreement in the findings in all the videos.
ScoreFindingFleiss Kappa (k and 95% CI)Agreement
0Normal/A-lines 0.74[0.71–0.76]Substantial
1Individual B-lines 0.36[0.33–0.39]Fair
2Confluent B-lines < 50%0.26[0.24–0.29]Fair
3Confluent B-lines > 50% & Consolidations0.50[0.47–0.53]Moderate
Disclaimer/Publisher’s Note: The statements, opinions and data contained in all publications are solely those of the individual author(s) and contributor(s) and not of MDPI and/or the editor(s). MDPI and/or the editor(s) disclaim responsibility for any injury to people or property resulting from any ideas, methods, instructions or products referred to in the content.

