Abstract
The resolution of remote sensing images has increased with the maturation of satellite technology. Ship detection technology based on remote sensing images makes it possible to monitor a large range and far sea area, which can greatly enrich the monitoring means of maritime departments. In this paper, we conducted research on small target detection and resistance to complex background interference. First, a ship dataset with four types of targets (aircraft carriers, warships, merchant ships and submarines) is constructed, and experiments are conducted on the dataset using the object detection algorithm YOLOv4. The Kmeans++ clustering algorithm is used for a priori frame selection, and the migration learning method is used to enhance the detection effect of the YOLOv4. Second, the model is improved to address the problems of missed detection of small ships and difficulty in resisting background interference: the RFB_s (Receptive Field Block) with dilated convolution is introduced instead of the SPP (Spatial Pyramid Pooling) to enlarge the receptive field and improve the detection of small targets; the attention mechanism CBAM (Convolutional Block Attention Module) is added to adjust the weights of different features to highlight salient features useful for ship detection task, which improve the detection performance of small ships and improve the model’s ability to resist complex background. Compared to YOLOv4, our proposed model achieved a large improvement in mAP (mean Average Precision) from 77.66% to 91.40%.
1. Introduction
Surface ship detection is of great importance to countries with vast sea areas, both in civil and military aspects. In the civilian aspect, ship detection can help rescue ships in distress and improve search and rescue efficiency. In the military aspect, it can detect the enemy’s port fleet deployment in time and improve maritime battlefield situational awareness. Therefore, it is crucial to detect the ships in remote sensing images quickly and accurately.
Traditional methods of detecting ships can be divided into four categories: methods based on statistical features of grayscale information, methods based on visual saliency, methods based on template matching and methods based on classification learning [1,2]. Satellite remote sensing technology is maturing, resulting in higher resolution of images and the proliferation of data. There are disadvantages to traditional ship detection algorithms, including low recognition accuracy, low efficiency, and susceptibility to interference from the background, which make it difficult to meet the application requirements.
Convolutional neural networks are extensively applied in the domain of object detection because of their powerful feature extraction ability, and a series of classical object detection algorithms have emerged. They are usually classified into two categories: two-stage object detection algorithms and one-stage object detection algorithms. The representative two-stage target detection algorithms are R-CNN (Region-Convolutional Neural Network) [3], Fast R-CNN [4] and Faster R-CNN [5], and the representative one-stage target detection algorithms are SSD (Single Shot Multi-Box Detector) [6] and the YOLO (You Only Look Once) series of algorithms [7,8,9,10]. Among them, there are numerous applications for the YOLO series of algorithms in many fields, such as disease detection in medicine [11] and vehicle detection in traffic [12].
Recently, the ability to detect ships based on remote sensing images through CNN has been greatly improved. However, because of the uniqueness of the remote sensing image, detection remains a challenging task to address. On the one hand, ships often occupy only a few or dozens of pixels in the remote sensing images, and it is hard to detect small targets. On the other hand, the background of the image is complex, which easily causes interference with detection.
In this paper, the detection framework used is YOLOv4, and its network structure is optimized to enhance the detection performance of small targets and the resistance to background interference. The experimental results illustrate that the detection effect of the improved model has a significant improvement. The specific work is as follows.
- A visible remote sensing image ship dataset is constructed: it includes four types of ship targets such as aircraft carriers, warships, merchant ships and submarines. With the aim to address the problem of small target labeling sample scarcity, the remote sensing images in the open source dataset are collected, and the small ship targets in the images are labeled. Additionally, the dataset contains 1333 images.
- An improved model based on the RFB_s (Receptive Field Block) module [13] and CBAM (Convolutional Block Attention Module) module [14] is proposed: the RFB_s is used instead of the SPP [15] to enlarge the receptive field and detect small ships more effectively; an attention mechanism, CBAM, is introduced to highlight salient features by adjusting the weights of different feature maps, aiming to address the problem arising from the small ship and complex background interference. The mAP (Mean Average Precision) of the proposed method is increased from 77.66% to 91.40%.
The organization of this paper is as follows: related work regarding ship detection algorithms based on CNN is introduced in Section 2. Section 3 describes the YOLOv4 model, RFB_s and CBAM, and our improved method. In Section 4, we elaborate on the dataset setup, experiment details and the ablation experiments. Finally, Section 5 draws conclusions.
2. Related Works
For the past few years, convolutional neural networks have also been continuously applied in remote sensing image object detection, and the object detection algorithm based on deep learning is a cutting-edge technology for ship detection.
To enhance the detection performance of multi-scale ships, features are usually fused. Zhang et al. [16] achieved good detection results with a SAR ship detection network constructed using an improved FPN, which consists of four unique FPNs to fuse features to improve SAR ship detection performance. Qing et al. [17] used an improved FPN (Feature Pyramid Network) and PANet (Path Aggregation Network) to fuse features from the backbone network. The two modules can integrate feature maps of different layers, combine context information on multiple scales and strengthen feature information.
To improve small target detection, two types of methods are commonly used. The first method is to expand the number of small target samples by data enhancement. Chen et al. [18] proposed a Gaussian hybrid Wasserstein GAN using gradient penalty to generate small ship samples with sufficient information; the CNN was then trained on the original and generated data to achieve accurate real-time detection of small ships. The improvement of data enhancement on small target detection is limited. Another approach is to make improvements to the network structure. Liu et al. [19] added recombination and routing layers to the improved YOLOv2 network, bringing together shallow and deep feature maps in forward propagation to improve the detection of small ships. To improve the detection accuracy of small targets, Gao et al. [20] added a detection scale to the YOLOv3 network to enhance the sensitivity to small targets, and anchors to small targets were assigned at the increased shallow feature scale. This approach increases the amount of computation and decreases the speed of reasoning.
To address the problem of false and missed detection of ships because of cloud interference, Guo et al. [21] proposed an offshore ship detection method based on scene classification and saliency-tuned YOLO-Net. Firstly, the images were divided into four categories. Secondly, targets were extracted from different images by the saliency detection method. Finally, they designed the saliency-tuned YOLOv4 network to detect ships. This method takes a lot of time to classify the samples.
Real-time ship detection has high requirements for accuracy. As an excellent representative algorithm of the YOLO series, YOLOv4 can detect targets at multiple scales and can achieve a balance of accuracy and speed, which makes it a valuable research tool. In this paper, YOLOv4 was used for detecting ships. To address the problem of detecting small targets with poor accuracy and complex background interference, improvements were made to the structure and detection accuracy.
3. Methods
Our proposed approach is implemented based on the YOLOv4 model with RFB_s module and attention mechanism. In the following subsections, we describe the YOLOv4 algorithm, RFB_s and CBAM model and then introduce our proposed method.
3.1. YOLOv4 Model
3.1.1. Network Structure
As shown in Figure 1, the YOLOv4 network is comprised of backbone CSPDarknet53, neck SPP and PANet [22] and a detection head. CSPDarknet53 is used to extract features, which consist of a convolutional block as well as a series of residual structures. When the size of an input image is 608 × 608 × 3, the sizes of three output feature layers are 76 × 76 × 256, 38 × 38 × 512 and 19 × 19 × 1024, respectively. SPP is used to increase the receptive field and separate out the contextual information, which consists of three max-pooling layers with kernel sizes of 5 × 5, 9 × 9 and 13 × 13. The input feature map is pooled three times, and the results are stacked with the input feature map to obtain the output feature map. PANet is used for feature fusion which consists of a top-down pyramid and a bottom-up pyramid. The top-down pyramid passes down the strong semantic features from the upper layers to enhance the semantic information. The bottom-up pyramid passes up the strong localization features from the lower layers to enhance the localization information. The fused features contain both semantic and localization information. The detection head is used to generate object bounding boxes and predict object classes.
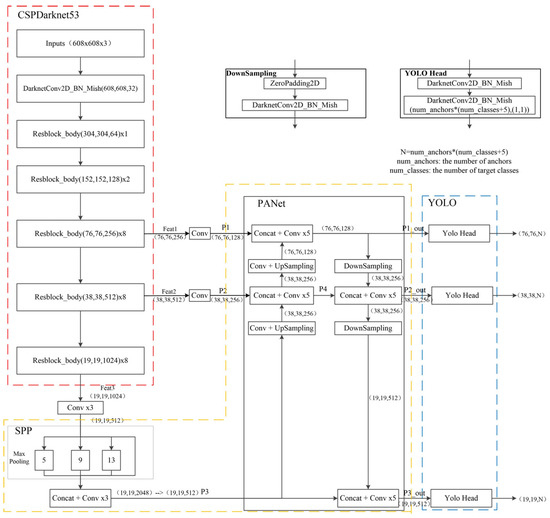
Figure 1.
YOLOv4 network structure diagram. * represents multiply.
3.1.2. Loss Function
There are three components to the loss of YOLOv4:
Regression loss of the object bounding box: the regression loss of the predicted bounding box is calculated using CIOU (Complete Intersection Over Union) [23]. As shown in Figure 2, CIOU considers three geometric measures: overlap area, central point distance and aspect ratio, which makes the bounding box regression more stable.
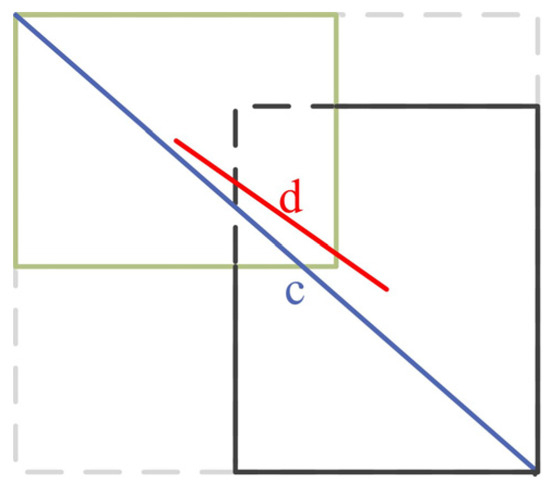
Figure 2.
Target frame distance diagram. c represents the diagonal distance of the smallest closed area which contains both the predicted bounding box and the ground truth. d represents the distance in Euclidean space between the predicted bounding box’s center point and the ground truth’s center point.
The formula for calculating CIOU is shown as follows:
where
where b represents the predicted bounding box; wgt and hgt represent the width and height of the ground truth, respectively; ρ2(b, bgt) represents the distance in Euclidean space between the predicted bounding box’s center point and the ground truth’s center point; c represents the diagonal distance of the smallest closed area that contains both the predicted bounding box and the ground truth; α represents the weighting factor; v is used to consider the similarity of aspect ratio; IOU represents the intersection ratio between the ground truth and the predicted bounding box; 1-CIOU represents the regression loss of the predicted bounding box.
where represents the weighting factor of the positive sample. The input image is segmented into K × K cells, and each cell generates M predicted bounding boxes. = 1 when one object is in the jth prediction box in cell i, and on the contrary, = 0 when there is no target. wi and hi denote the width and height of the predicted bounding box, with representing the penalty term. The smaller the bounding box is, the greater its weight becomes.
Confidence loss: confidence loss consists of two parts: the loss of confidence for positive and negative samples, and the loss value is calculated using cross-entropy.
where represents the sample value of the confidence, represents the value of the predicted confidence and represents the weighting factor of the negative sample. = 1 when the jth prediction box in cell i has no object, and on the contrary, = 0 when there is an object.
Loss of predicted classes: this consists of classification loss of positive samples, and the value is calculated using cross-entropy.
where represents the sample value of the class and denotes the probability of an object belonging to the cth category.
3.2. RFB Module
The RFB (Receptive Field Block) module is inspired by the structure of receptive fields in human visual systems. It refers to the ideas of the Inception network [24] and adds dilated convolution to Inception with the aim of enlarging the receptive field and extracting multi-scale features, which makes convolutional neural networks learn deep features more effectively. As shown in Figure 3, in the RFB structure, features are extracted using standard convolutions as well as dilated convolutions on multi-scales. The standard convolution simulates the receptive fields at different scales. The dilation convolution increases the receptive field while keeping the feature map size unchanged.
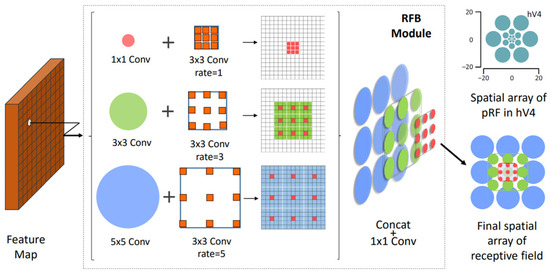
Figure 3.
RFB structure diagram [13].
In an effort to reduce parameters and non-linear layers, RFB_s replaces the 5 × 5 convolutional layer with two stacked 3 × 3 convolutional layers. Then, it uses one 1 × 3 plus one 3 × 1 convolutional layer to replace the 3 × 3 convolutional layer for the same reason. As shown in Figure 4, the RFB_s structure has a four-branch structure consisting of four convolutional kernels with kernel sizes of 1 × 1, 1 × 3, 3 × 1 and 5 × 5. Dilated convolutions with different rates are introduced in each of its branches to extend the receptive field. The input features from the previous layer are first passed through the four-branch structure; then the output features are fused and passed through the 1 × 1 convolutional layer, and the result is fused with the input features by a shortcut so that the original information can be retained; eventually, the result is provided by the activation function.
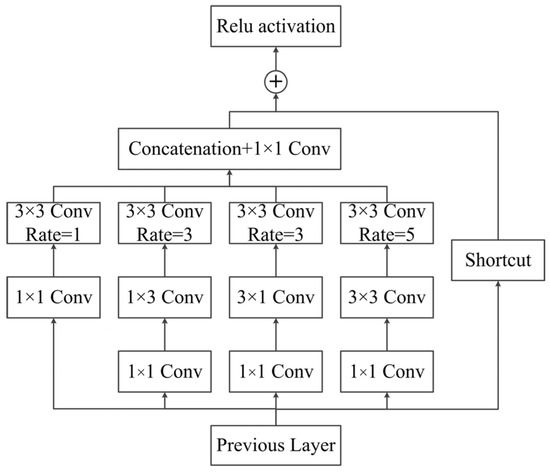
Figure 4.
RFB_s structure diagram [13].
3.3. Attentional Mechanisms
The attention mechanism simulates the human visual mechanism aiming to strengthen important features and suppress unnecessary features while reducing time, cost and computational complexity. The object detection algorithm based on the visual attention mechanism uses the attention model to strengthen the difference between the object and the background, and then the object is detected by analyzing the obtained salient feature map. Because CBAM is a lightweight attention module, it can be incorporated with any CNN structure with a negligible increase in computational effort. Additionally, it can be trained end-to-end with CNNs. As shown in Figure 5, given the input feature, CBAM sequentially derives the attention mapping along the channel dimension and spatial dimension and then multiplies the attention mapping with the input feature to perform adaptive feature refinement and increase the weights of the features representing the object. That means, given an input feature map: F ∈ RC×H×W, the channel attention submodule infers a 1D channel attention map: Mc ∈ RC×1×1 and then the spatial attention submodule infers a 2D spatial attention map: MS ∈ R1×H×W. The overall process can be summarized as follows:
where represents element-wise multiplication and the attention values are broadcasted correspondingly: channel attention values are broadcasted along the spatial dimension, and spatial attention values are broadcasted along the channel dimension. F′ represents the feature map enhanced by channel attention, and F″ represents the output feature map. Convolutional neural networks, with an added attention mechanism, can extract the spatial meaning and channel meaning of the feature map, which helps to strengthen the features of the object, suppress unnecessary details and improve the representation capability of CNN [25].
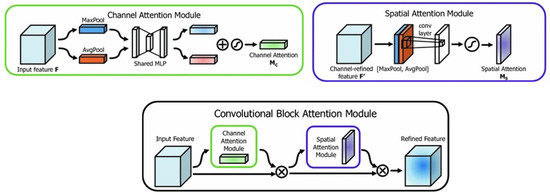
Figure 5.
CBAM structure diagram [14].
3.4. Improved Network Model
When CNN performs ship detection, the region containing ships in the remote sensing image is used as the effective region that plays a dominant role. However, due to the large variety of ship sizes in the image, small ships are easily confused with noise, resulting in their features not being effectively extracted. In contrast to SPP’s max-pooling, RFB introduces dilated convolution and residual connection, which can enhance the receptive field of the effective region and retain small ships in the feature map.
The YOLOv4 network begins forward propagation after inputting the image: the backbone performs an extensive number of convolution operations on the input image to extract multi-scale feature maps, and then the neck fuses the extracted feature maps. This means that the fused feature combines the features extracted from each channel and location equally. However, the feature maps for each channel and location can actually be seen as a response to specific semantic information. The detection of the target is facilitated if the features representing the target are provided with appropriate weights. The attention mechanism captures the global and local relationships in the input image and thus focuses on finding the key information about the target. Therefore, we introduce CBAM in the YOLOv4 network to improve the original structure. The channel attention sub-module of CBAM establishes interdependencies between channels and enhances the representation of specific semantic information. The spatial attention sub-module acquires the weights of local features to improve the localization of candidate regions, which can enhance the useful features representing the target and resist background interference at the same time.
In order to address the problems of complex background interference and poor detection of small targets in remote sensing images with high resolution, an improved YOLOv4 ship detection model based on the RFB_s module and CBAM module is proposed. The RFB_s module is introduced to enhance the receptive domain and improve the detection effect of small ships; the CBAM module is introduced to adaptively adjust the weights of different feature layers to effectively capture the information of small ships while improving the ability of the model to resist complex background interference. Figure 6 illustrates the structure of our improved model. RFB_s is used instead of the SPP structure; two CBAM modules are added between the backbone part and the neck, and the feature map extracted from the backbone network undergoes a convolution operation to reduce the number of channels with the purpose of reducing the number of introduced parameters. Then, the feature map is enhanced by the CBAM module for feature fusion. Similarly, a CBAM module is added between the RFB_s module and the neck, and the feature maps are enhanced and passed into the neck PANet for feature fusion.
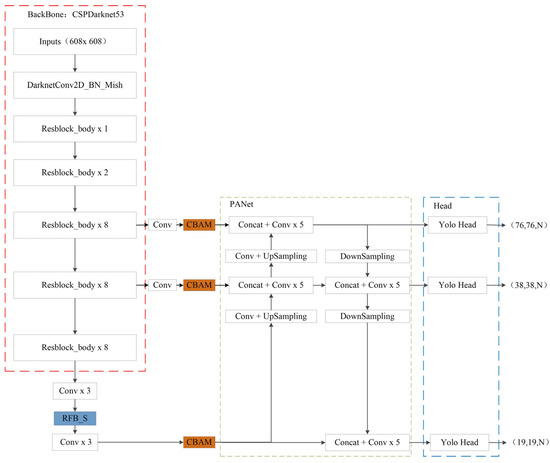
Figure 6.
Our improved model structure diagram.
4. Experiments and Results
To demonstrate the effectiveness of the proposed method, firstly, we constructed the ship dataset and clustered the dataset using the Kmeans++ clustering algorithm. Then, we trained our improved model and compared it with the state-of-the-art model. Finally, we designed ablation experiments to verify the accuracy of the improvement.
4.1. Data Sets and Evaluation Metrics
In this paper, we collected remote sensing images containing ships in the open source dataset to construct the dataset. We screened specific types of training samples from the HRSC2016 (High-Resolution Ship Collection 2016) dataset [26] and preferred images containing small targets in different complex backgrounds to evaluate the optimization degree of the improved network. The original dataset did not annotate the small ship targets in the images; we re-annotated them and annotated the ship targets of all scales in the images, which expanded the number of small ship samples and helped to improve their detection effects. We labeled the ships into four categories, such as merchant ship, aircraft carrier, warship and submarine, with a total of 1333 labeled images, and we divided them into three sets: training, validation and test, in a ratio of 8:1:1. The constructed dataset can provide training data for training the convolutional neural network for coarse recognition of ship targets. Detailed information regarding the dataset can be found in Table 1.

Table 1.
Dataset details.
The common evaluation indexes of ship detection are: Precision P (Precision), R (Recall), Average Precision (AP) and Mean Average Precision (mAP). P indicates the ratio of the number of correctly identified positive samples to the total number of predicted positive samples; R refers to the ratio of the number of correctly identified positive samples to the number of all positive samples. As shown in Figure 7, in the PR (precision-recall) curve, the vertical axis is precision, and the horizontal axis is recall. The higher the precision and recall of the model indicate its better performance and, correspondingly, the larger the area under the PR curve. The mAP is a composite measure of the average accuracy of the detected objects. When detecting multiple classes of objects, the mAP is obtained by averaging the AP for each class.
where TP means a real positive sample, TN means a real negative sample, FP is a false positive sample and FN is a false negative sample. m represents the number of categories of objects in the dataset.
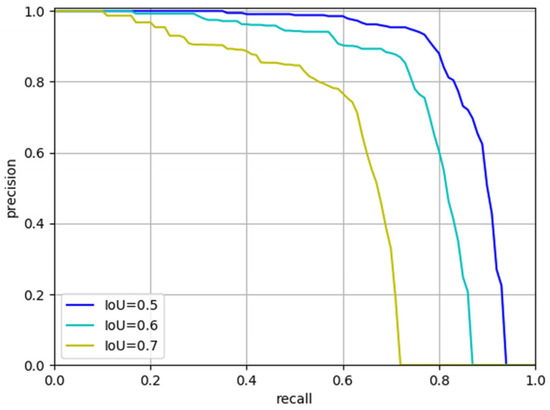
Figure 7.
PR curve.
4.2. Kmeans++ Initial Anchor Frame Clustering
The Kmeans clustering algorithm first initializes K cluster centers before formal clustering. As a result, cluster center initialization heavily influences convergence. If multiple cluster centers are initialized in the same cluster, then the results will be incorrect. The Kmeans++ clustering algorithm improves the way of initializing cluster centers: K cluster centers are selected one by one, and the farther the sample point is from other cluster centers, the higher the probability that it will be selected as the next cluster center. This is conducted as follows.
- The first cluster center c1 is selected at random from the dataset.
- Calculate the shortest distance between each sample and the currently existing cluster center, denoted by D(x); then, calculate the probability P(x) of each sample point being selected as the next cluster center. Finally, select the sample point corresponding to the maximum probability value as the next cluster center ci. Where
- 3.
- Until K clusters are selected, repeat Step 2.
The data set was clustered using the Kmeans++ clustering algorithm to obtain a priori frames suitable for the ships assigned to the three detection scales of YOLOv4.
4.3. Pre-Training
Convolutional neural network models are complex with a large number of parameters and require a large amount of labeled data for training. The size of our constructed dataset was much smaller than the dataset with millions of images. Therefore, we borrowed the idea of migration learning to train a neural network using other large image datasets and trained a new model based on the parameters of the trained model. The YOLOv4 model was pre-trained using the ImageNet dataset [27], and since the backbone network of the improved model was the same as the YOLOv4 model, the parameters of the backbone part of the pre-trained model were used as initialization parameters instead of random initialization for training, which effectively improved the model convergence speed.
4.4. Experimental Environment Configuration and Result
The training environment is shown in Table 2, and the network training parameters are shown in Table 3.

Table 2.
Training environment configuration.

Table 3.
Training parameter setting.
The model was trained by feeding the training and validation sets into the network, and all images were trained for a total of 300 epochs. In each epoch, the network received 12 images per batch, and the image size was uniformly adjusted to 800 × 800. The loss values on the training and validation sets were calculated for each epoch, and the loss curves of the training process were plotted according to the loss values. As shown in Figure 8, the loss values on both the training and validation sets gradually decreased and leveled off in the first 210 epochs of model training; after 210 epochs, the loss value on the training set decreased from 0.05 to 0.02, but the loss value on the validation set increased slightly, indicating that the model was overfitting. We saved the model with the lowest loss value on the validation set in the 200–210 epoch, and the loss curves of the model on both the training and validation set leveled off at this time, which proved that the model had converged.
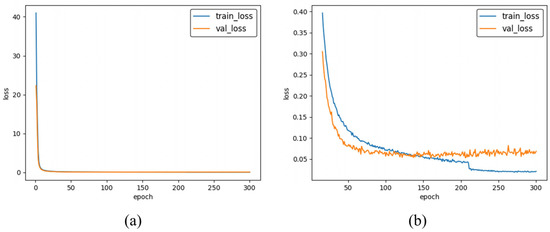
Figure 8.
Curve of loss value change during training. (a) Loss value curve of 300 epoch training process. (b) Loss value curve of the post 285 epoch training process.
In order to prove the superiority of our method, we compared it to the highest version of YOLO: YOLOv7 [28]. Table 4 shows the results of the experiment. The mAP of the YOLOv7 improved by 13.43%. The mAP of our method increased by 13.74%. The accuracy of our model reached the same level as the state-of-the-art model with a slight improvement. Additionally, the detection speed did not decrease significantly. There were a large number of small ships in the labeled merchant ships, and the AP of merchant ships of YOLOv7 improved by 11.78%. The AP of merchant ships of our model improved by 12.43%, which demonstrated that our model detects small ships better.

Table 4.
Comparison of the accuracy and speed of different modes.
4.5. Detection Effect of the Improved Model
4.5.1. Detection Effect of Small Targets
As shown in Figure 9, there are multi-scale ships in the image, and when the YOLOv4 model performs detection, the small ships are not detected, or not all of them can be detected (the first column of Figure 9). When the improved model detects, all the small ships are detected (the second column of Figure 9). When the YOLOv7 model detects, the detection effect of small ships is improved compared with the YOLOv4 model (the first and third rows of the third column of Figure 9), but there are still small ships missed (the second and fourth rows of the third column of Figure 9). Based on our tests, our method outperforms all other methods when it comes to detecting small ships.
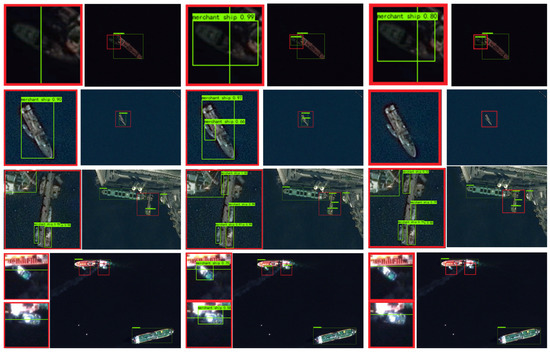
Figure 9.
Small target detection effect comparison: the first column is the detection effect of the YOLOv4 model; the second column is the detection effect of our improved model; the third column is the detection effect of the YOLOv7 model.
4.5.2. Effect of Resisting Background Interference
As shown in the first column of Figure 10, the original model incorrectly detects the island as the target in the image; when there are background interferences such as snow, clouds and harbor ground in the image, it will interfere with the detection results, and the target cannot be detected. As shown in the second column of Figure 10, the improved model has no misdetection and detects the targets correctly, which indicates that our improved model can resist background interference. As shown in the third column of Figure 10, YOLOv7’s ability to resist complex background interference has been improved compared with YOLOv4 (the first and second rows), but there are still missed detections (the third and fourth rows). According to the results, our method proves to be more effective at reducing background interference than all the other approaches compared.
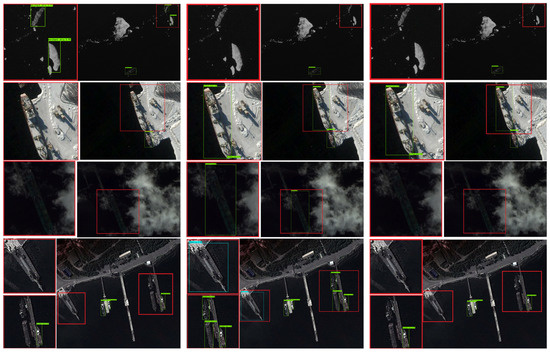
Figure 10.
Comparison of the effect of resistance to background interference: the first column is the detection effect of the YOLOv4 model; the second column is the detection effect of our improved model; the third column is the detection effect of the YOLOv7 model.
4.6. Ablation Experiments
We conducted a series of ablation experiments on our dataset. As shown in Table 5, we considered the influence of different combinations of four factors, backbone parameter, Kmeans++, CBAM and RFB_s, on the experimental results. We used the mAP and AP of each ship class as evaluation criteria to verify the effectiveness of our model.

Table 5.
Comparison of ablation experiment.
It can be seen that, with YOLOv4 as the benchmark experiment, the YOLOv4-Kmeans++ model improves the mAP of the model by 7.81% through using pre-trained backbone parameters instead of random initialization and the Kmeans++ algorithm to select better initial anchors. Based on this, the YOLOv4-CBAM model adds the CBAM module to adaptively adjust different feature layer weights, the mAP of the model improves by 9.81% and the AP of merchant ships improves by 11.11%. As a result of a large number of small ships in the labeled merchant ships, CBAM can be validated as effective at improving the detection of small targets. The mAP of the YOLOv4-RFB_s model increased by 10.93%, and the AP of the merchant ship increased by 10.68%, indicating that the RFB_s module can also improve the small target detection effect. The mAP of the improved model with the introduction of CBAM and RFB increased by 13.74%, and the AP of the merchant ship increased by 12.43%, proving that the improved model improved the small target detection effect.
As can be seen from Figure 11, the original model does not detect the small ships and the ship at the edge of the image (Figure 11a). The model with the CBAM module detects the ship at the edge, and some of the small ships are missed by the original model, but it still does not detect small ships completely (Figure 11b). The model with the RFB_s module detects the ship at the edge, and small ships are missed by the original model but miss small ships disturbed by the background (Figure 11c). The improved model correctly detects all ships (Figure 11d).
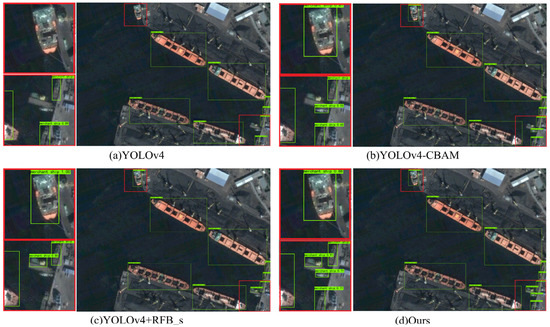
Figure 11.
Comparison of ablation experiment test results. (a) Detection result of YOLOv4 model. (b) Detection result of YOLOv4-CBAM model. (c) Detection result of YOLOv4-RFB_s model. (d) Detection result of our improved model.
5. Conclusions
In this paper, we proposed an improved model. Firstly, we used the RFB_s structure instead of the SPP structure to enhance the receptive field and enhance the detection performance on small ships. Secondly, we introduced the CBAM module, which adaptively adjusts the weights of different feature maps before feature fusion to effectively highlight salient features of objects and detect small ships more effectively while improving the model’s resistance to background interference. The mAP of the improved model was increased from 77.66% to 91.40%. The experimental results showed that the improved model can accurately detect small ships and effectively resist background interference. Additionally, the problem of wrong and missed detection was greatly addressed.
Although the detection effect of the method proposed in this paper was significantly improved, this paper only classifies the ships into four categories for coarse identification, and there is room for further improvement in detection accuracy. In future work, on the one hand, the dataset will be expanded, focusing on images containing small ships and images with complex backgrounds, and the ships will be divided into fine-grained categories. On the other hand, the training ship detection model for fine recognition will be explored, and the ability of the model to resist complex background interference will be further improved.
Author Contributions
Conceptualization, X.J. and F.W.; methodology, Z.H. and F.W.; software, Z.H. and Y.F.; validation, Z.H., Y.Z., T.F. and J.P.; formal analysis, Z.H. and F.W.; resources, X.J.; data curation, Z.H. and T.F.; writing—original draft preparation, Z.H. and X.J.; writing—review and editing, Z.H. and F.W.; project administration, X.J.; funding acquisition, X.J. and F.W. All authors have read and agreed to the published version of the manuscript.
Funding
This research was funded by the National Key R&D Program of China, grant number 2022YFB3902300, and was funded by the National Natural Science Foundation of China, grant number 42001345.
Institutional Review Board Statement
Not applicable.
Informed Consent Statement
Not applicable.
Data Availability Statement
The data presented in this study are available on request from the corresponding author. The data are not publicly available due to privacy.
Conflicts of Interest
The authors declare no conflict of interest.
References
- Li, B.; Xie, X.; Wei, X.; Tang, W. Ship detection and classification from optical remote sensing images: A survey. Chin. J. Aeronaut. 2021, 34, 145–163. [Google Scholar] [CrossRef]
- Kanjir, U.; Greidanus, H.; Oštir, K. Vessel detection and classification from spaceborne optical images: A literature survey. Remote Sens. Environ. 2018, 207, 1–26. [Google Scholar] [CrossRef] [PubMed]
- Girshick, R.; Donahue, J.; Darrell, T.; Malik, J. Rich feature hierarchies for accurate object detection and semantic segmentation. In Proceedings of the IEEE Conference on Computer Vision and Pattern Recognition, Columbus, OH, USA, 23–28 June 2014. [Google Scholar]
- Girshick, R. Fast R-CNN. In Proceedings of the IEEE International Conference on Computer Vision, Boston, MA, USA, 7–12 June 2015. [Google Scholar]
- Ren, S.; He, K.; Girshick, R.; Sun, J. Faster R-CNN: Towards Real-Time Object Detection with Region Proposal Networks. IEEE Trans. Pattern Anal. Mach. Intell. 2017, 39, 1137–1149. [Google Scholar] [CrossRef] [PubMed]
- Liu, W.; Anguelov, D.; Erhan, D. SSD: Single shot multibox detector. In Proceedings of the European Conference on Computer Vision, Amsterdam, The Netherlands, 11–14 October 2016. [Google Scholar]
- Redmon, J.; Divvala, S.; Girshick, R.; Farhadi, A. You only look once: Unified, real-time object detection. In Proceedings of the IEEE Conference on Computer Vision and Pattern Recognition, Las Vegas, NV, USA, 27–30 June 2016. [Google Scholar]
- Redmon, J.; Farhadi, A. YOLO9000: Better, faster, stronger. In Proceedings of the IEEE Conference on Computer Vision and Pattern Recognition, Honolulu, HI, USA, 21–26 July 2017. [Google Scholar]
- Redmon, J.; Farhadi, A. Yolov3: An incremental improvement. arXiv 2018, arXiv:1804.02767. [Google Scholar]
- Bochkovskiy, A.; Wang, C.-Y.; Liao, H.-Y.M. Yolov4: Optimal speed and accuracy of object detection. arXiv 2020, arXiv:2004.10934. [Google Scholar]
- Yao, S.; Chen, Y. An improved algorithm for detecting pneumonia based on YOLOv3. Appl. Sci. 2020, 10, 1818. [Google Scholar] [CrossRef]
- Rodríguez-Rangel, H.; Morales-Rosales, L.A. Analysis of Statistical and Artificial Intelligence Algorithms for Real-Time Speed Estimation Based on Vehicle Detection with YOLO. Appl. Sci. 2022, 12, 2907. [Google Scholar] [CrossRef]
- Liu, S.; Huang, D. Receptive field block net for accurate and fast object detection. In Proceedings of the European Conference on Computer Vision (ECCV), Munich, Germany, 8–14 September 2018. [Google Scholar]
- Woo, S.; Park, J.; Lee, J.Y. CBAM: Convolutional block attention module. In Proceedings of the European Conference on Computer Vision (ECCV), Munich, Germany, 8–14 September 2018. [Google Scholar]
- He, K.; Zhang, X.; Ren, S.; Sun, J. Spatial pyramid pooling in deep convolutional networks for visual recognition. IEEE Trans. Pattern Anal. Mach. Intell. 2015, 37, 1904–1916. [Google Scholar] [CrossRef] [PubMed]
- Zhang, T.; Zhang, X.; Ke, X. Quad-FPN: A novel quad feature pyramid network for SAR ship detection. Remote Sens. 2021, 13, 2771. [Google Scholar] [CrossRef]
- Qing, Y.; Liu, W.; Feng, L.; Gao, W. Improved Yolo network for free-angle remote sensing target detection. Remote Sens. 2021, 13, 2171. [Google Scholar] [CrossRef]
- Chen, Z.; Chen, D.; Zhang, Y.; Cheng, X.; Zhang, M.; Wu, C. Deep learning for autonomous ship-oriented small ship detection. Saf. Sci. 2020, 130, 104812. [Google Scholar] [CrossRef]
- Liu, W.; Ma, L.; Chen, H. Arbitrary-oriented ship detection framework in optical remote-sensing images. IEEE Geosci. Remote Sens. Lett. 2018, 15, 937–941. [Google Scholar] [CrossRef]
- Cao, C.; Wu, J.; Zeng, X.; Feng, Z.; Wang, T.; Yan, X.; Wu, Z.; Wu, Q.; Huang, Z. Research on airplane and ship detection of aerial remote sensing images based on convolutional neural network. Sensors 2020, 20, 4696. [Google Scholar] [CrossRef] [PubMed]
- Guo, J.; Wang, S. Saliency Guided DNL-Yolo for Optical Remote Sensing Images for Off-Shore Ship Detection. Appl. Sci. 2022, 12, 2629. [Google Scholar] [CrossRef]
- Liu, S.; Qi, L.; Qin, H. Path aggregation network for instance segmentation. In Proceedings of the IEEE Conference on Computer Vision and Pattern Recognition, Salt Lake City, UT, USA, 18–23 June 2018. [Google Scholar]
- Zheng, Z.; Wang, P.; Liu, W. Distance-IOU loss: Faster and better learning for bounding box regression. In Proceedings of the AAAI Conference on Artificial Intelligence, New York, NY, USA, 7–12 February 2020. [Google Scholar]
- Szegedy, C.; Liu, W.; Jia, Y. Going deeper with convolutions. In Proceedings of the IEEE Conference on Computer Vision and Pattern Recognition, Boston, MA, USA, 7–12 June 2015. [Google Scholar]
- Ju, M.; Luo, J. Adaptive feature fusion with attention mechanism for multi-scale target detection. Neural Comput. Appl. 2021, 33, 2769–2781. [Google Scholar] [CrossRef]
- Liu, Z.; Yuan, L.; Weng, L.; Yang, Y. A high resolution optical satellite image dataset for ship recognition and some new baselines. In Proceedings of the International Conference on Pattern Recognition Applications and Methods, Porto, Portugal, 24–26 February 2017. [Google Scholar]
- Deng, J.; Dong, W.; Socher, R. Imagenet: A large-scale hierarchical image database. In Proceedings of the IEEE Conference on Computer Vision and Pattern Recognition, Miami, FL, USA, 20–25 June 2009. [Google Scholar]
- Wang, C.-Y.; Bochkovskiy, A.; Liao, H.-Y.M. YOLOv7: Trainable bag-of-freebies sets new state-of-the-art for real-time object detectors. arXiv 2022, arXiv:2207.02696. [Google Scholar]
Disclaimer/Publisher’s Note: The statements, opinions and data contained in all publications are solely those of the individual author(s) and contributor(s) and not of MDPI and/or the editor(s). MDPI and/or the editor(s) disclaim responsibility for any injury to people or property resulting from any ideas, methods, instructions or products referred to in the content. |
© 2023 by the authors. Licensee MDPI, Basel, Switzerland. This article is an open access article distributed under the terms and conditions of the Creative Commons Attribution (CC BY) license (https://creativecommons.org/licenses/by/4.0/).