1. Introduction
With the rapid development of socio-economics and technology, as well as the wide-spread urbanization worldwide, road accidents and traffic congestion have become common challenges around the world. Confronted with increasingly intricate traffic environments, traditional methods relying on increasing manpower for management and scheduling are no longer able to meet the demands of current transportation systems for safety, efficiency, and environmental sustainability. Intelligent transportation systems have incorporated technologies such as the Internet of Things, artificial intelligence, cloud computing, edge computing, and automation to provide traffic information services based on real-time traffic data. Systems are being applied in areas such as smart highways, transportation data management, and autonomous driving [
1].
Artificial Intelligence (AI) has been widely applied in intelligent transportation systems due to the ability of reducing human involvement while maintaining high accuracy. Vehicles and pedestrians are integral elements of the complex and dynamic road environment in urban traffic networks. The raw data for intelligent transportation is derived from semantic segmentation and object detection specifically tailored for smart transportation. The respective trajectories of vehicles and pedestrians can be obtained by segmentation and detection methods, enabling the inference of potential safety hazards [
2]. Images contain a wealth of underlying semantic information, and computer vision, as a crucial technology in intelligent transportation systems, utilizes methods centered around computer vision to aid intelligent vehicles in understanding scene semantics [
3].
Existing algorithms [
4,
5,
6,
7] can independently achieve scene analysis in complex scenarios through semantic segmentation and object detection. Although these methods demonstrate excellent performance in their respective single task, they require sequential processing, leading to unnecessary time consumption. However, when deploying environment perception systems on embedded devices in driving vehicles in intelligent transportation system, limitations in computation resources and the requirement for low latency must be taken into account. Furthermore, there are often a multitude of interrelated pieces of information between multiple tasks in traffic lane scene analysis. For example, in a driving lane scene, lane markings often serve as boundaries for drivable areas, and there are typically scattered road vehicles (cars, motorcycles, etc.) and passing pedestrians around the driving area. Detecting these objects would facilitate semantic segmentation. Therefore, sharing detection information from multiple tasks contributes to enhancing the overall performance of autonomous driving perception systems. Integrating the requirements of multiple tasks into a unified model in autonomous driving scenes allows for effective information sharing among tasks, thereby improving the overall performance of autonomous driving perception systems. Moreover, in practical applications such as autonomous vehicles and traffic control, models not only need to demonstrate good accuracy but also meet the requirements of computational efficiency and real-time performance, which are crucial evaluation metrics. The depth of the network places demanding requirements on hardware and software resources, such as computational capacity and storage. Simply reducing the model size would lead to a significant decline in algorithm performance.
Deep learning-based algorithms for scene understanding, including image semantic segmentation and object detection, are the main focus of this work. The goal is to achieve segmentation predictions on traffic lane datasets to aid in the analysis of road conditions. A lightweight network based on the Swin-Transformer [
8] is designed, along with an adapter network suitable for both image semantic segmentation and object detection tasks. This network effectively improves the model’s prediction accuracy while maintaining a small computational cost. The inter-frame consistency module, called the inter-frame consistency module, is introduced as an information measurement and comparison method based on the consistency of information between adjacent frames. It is used to induce the model to extract more accurate road information from the images. In the multi-scale feature space, the adapter network is applied to effectively identify scene objects of different scales. The proposed approach is validated on four datasets: BDD100K, CamVid, SYNTHIA, and CeyMo. Experimental results demonstrate that, compared to the baseline models, the proposed model Swin-APT achieves an improvement of up to 13.1% mIoU. Additionally, in the road detection branch of the CeyMo dataset, experiments on road marking detection show an improvement of 1.85% mAP compared to the baseline model.
The main contributions and innovations of this work are as follows:
A lightweight network called Swin-APT, based on the Swin-Transformer, is introduced, and an adapter network suitable for image semantic segmentation and object detection tasks is proposed. The prediction accuracy of the model is improved while maintaining a small computational cost;
A module based on the inter-frame consistency of image frames is proposed, which induces the model to extract more accurate road information from the images;
The adapter network is applied in the multi-scale feature space to effectively improve the recognition rate of scene objects in downstream tasks;
Extensive experiments are conducted on four public road semantic segmentation datasets and a road mark detection dataset. The experimental results aim to find a balance between accuracy and computational cost. The effectiveness of the proposed approach is demonstrated through these experiments.
2. Related Work
Semantic segmentation has been widely researched and applied in traffic lane scene analysis. Wong [
4] proposed a feedback-based deep semantic segmentation method that can integrate spatial context by incorporating an additional output feedback mechanism, eliminating the need for post-processing steps such as Conditional Random Fields (CRF) refinement. Ref. [
5] introduced a shallow Convolutional Neural Network (CNN) called Multi-View Sampling CNN (MVS-CNN), which utilizes abstract features extracted from the gradient information of images to improve the semantic segmentation of road areas. In order to capture and convey road-specific contextual information, Ref. [
9] focused on the Spatial Information Inference Structure (SIIS), which can learn both local visual features of roads and global spatial structural information. To accurately extract linear features, a novel Dilated Vertical and Horizontal kernel (DVH) was introduced into the feature extraction task of the semantic segmentation network [
6]. Mobile Laser Scanning (MLS) technology has also been widely used for road image segmentation and recognition [
10]. By analyzing high-resolution images, a better understanding of urban traffic conditions can be achieved, facilitating the formulation of traffic policies and infrastructure investment plans. However, in practical application scenarios, autonomous driving has strict requirements for real-time road and obstacle detection methods. Therefore, there is a need to develop novel semantic segmentation models to ensure the accuracy of various indicators for autonomous vehicles.
Object detection is another key task in intelligent transportation. It can be used for real-time monitoring of traffic flow and for identifying and tracking vehicles and pedestrians on the road. Object detection methods based on CNN (Convolutional Neural Networks) delve into deeper features, providing more sensitive generalization and adaptability. They overcome the challenges posed by complex outdoor traffic environments and variations in vehicle scales, among other uncertain factors. YOLO series [
11,
12,
13] were widely used in vehicle detection and related tasks.
Taheri et al. [
14] proposed an improved Tiny-YOLOv3 model that can detect and classify objects at a speed of 95 FPS (Frames Per Second) on the BIT vehicle dataset by pruning and simplifying the model. Yao et al. [
7] added a
detection layer to YOLOv3 and recalculated 12 anchor boxes using k-means to improve the detection accuracy of small vehicles. Kim et al. [
15] proposed a multi-scale vehicle detection method based on Spatial Pyramid Pooling, which enhanced robustness against vehicle occlusion and scale variation. YOLOv4 is an upgraded version of YOLOv3. Ref. [
16] introduced an adaptive model by combining YOLOv4 with Deepsort, enabling real-time detection and counting of various types of vehicles, which achieved improved detection accuracy at a speed of 32 FPS. Ref. [
17] proposed a real-time traffic monitoring system based on virtual detection zones, Gaussian Mixture Models, and YOLO. This system aimed to enhance vehicle counting and classification efficiency. These innovations and improvements in object detection methods contribute to the development of efficient and accurate systems for traffic monitoring and management in intelligent transportation applications.
Based on the aforementioned, Ref. [
18] proposed a shared encoder with three independent decoder architectures to simultaneously accomplish scene classification, object detection, and drivable area segmentation tasks. The network performed well in multiple tasks but did not incorporate lane line detection. Ref. [
19] also employed an encoder-decoder structure and built context tensors between the subtask decoders to facilitate the sharing of specific information among tasks. These algorithms utilize an encoder to extract features and decoders to perform individual tasks, making the network relatively complex.
3. Methods
In this section, the overall structure of Swin-APT will be introduced. A balance between accuracy and computational complexity is aimed for. The overall architecture of the model is illustrated in
Figure 1. The input to the model comprises two consecutive color images that are processed by the network in parallel.
The network’s encoding part comprises four consecutive Swin-Transformer blocks. This is followed by an adapter network that is proposed, forming a feature pyramid structure to encode the images into high-level semantic features. These high-level semantic features are then fed into the Inter-frame Consistency Module (InCM), a module for measuring information consistency and contrastive learning between image frames. InCM is used for learning consistent information from the two parallel consecutive frames to further encode the semantic meaning of the images.
Finally, the image features are passed through task-specific heads for road segmentation and road marking detection.
3.1. Light-Weight Backbone Swin-L
The model is designed based on Swin-Transformer [
8], which is a lightweight backbone network used for initial feature extraction of road images. Features are hierarchically extracted from input images using the Swin-Transformer. The backbone structure includes image patch partitioning, image embedding, and encoding layers, which are capable of capturing image features at different levels. Swin-Transformer increases the receptive field of image patches by using W-MSA, making it particularly suitable for fine-grained classification tasks such as image classification and image segmentation.
However, issues such as a large number of model parameters, high computational resource requirements, and long inference time arise when directly applying the vanilla Swin-Transformer to road segmentation. It is not suitable for real-time predictions in intelligent transportation and driving environments. As a result, the Swin-Tiny is modified by changing the intermediate feature dimension and reducing the number of blocks, resulting in a lightweight network called Swin-Light (Swin-L).
Specifically, a 4-layer structure of the Swin-Transformer is applied, where each layer consists of an image patch merging module and consecutive Swin-Transformer blocks. The numbers of Swin-Transformer blocks for each layer are set as 1, 1, 3, and 2, and the hidden dimensions of each layer are set as 48, 96, 192, and 384.
Experimentally, Swin-Light reduces 35% of parameters compared to Swin-Tiny (from 60 M to 39 M). However, performance degradation may occur due to the significant decrease in network parameters and complexity, as the scene features may not be fully captured by the model.
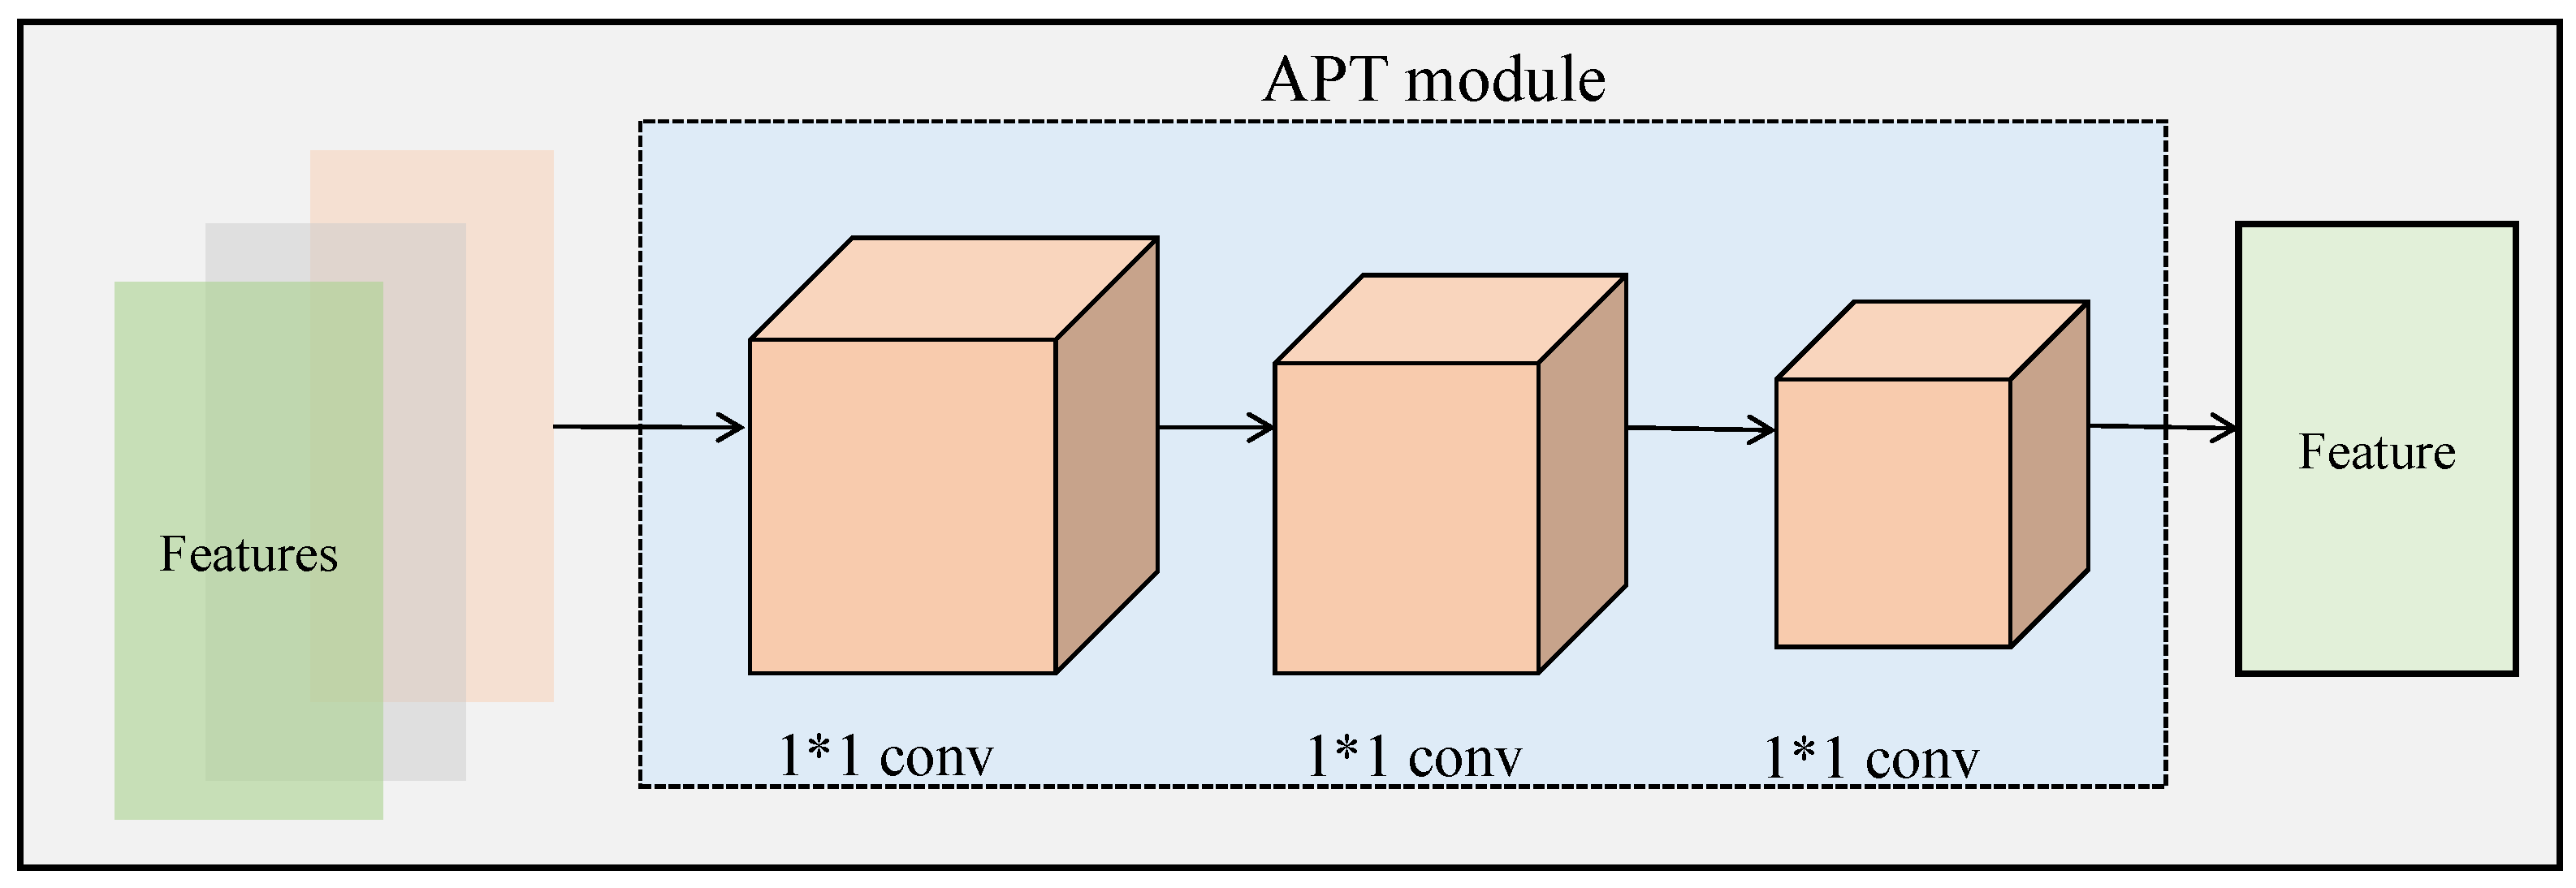
3.2. Adapter Net
The performance degradation of the model is attributed to the lack of global information exchange between low-level features, similar to the Transformer architecture. To maintain the model scale, an adapter net is designed that follows the Swin-Transformer hierarchical structure, as shown in
Figure 2. The structure of the adapter network combines the information in the feature space through consecutive 1 × 1 convolutions, achieving information fusion at a low cost.
Specifically, given a feature map
, it is divided into
g groups of sub-features
, that is
,
where
represents consecutive convolution layers with a kernel size of 1, which are used to extract information from the feature space.
is an aggregation function used to fuse features from different groups, such as
,
, etc. In this work, the non-linear function
is employed to learn different weights from different groups.
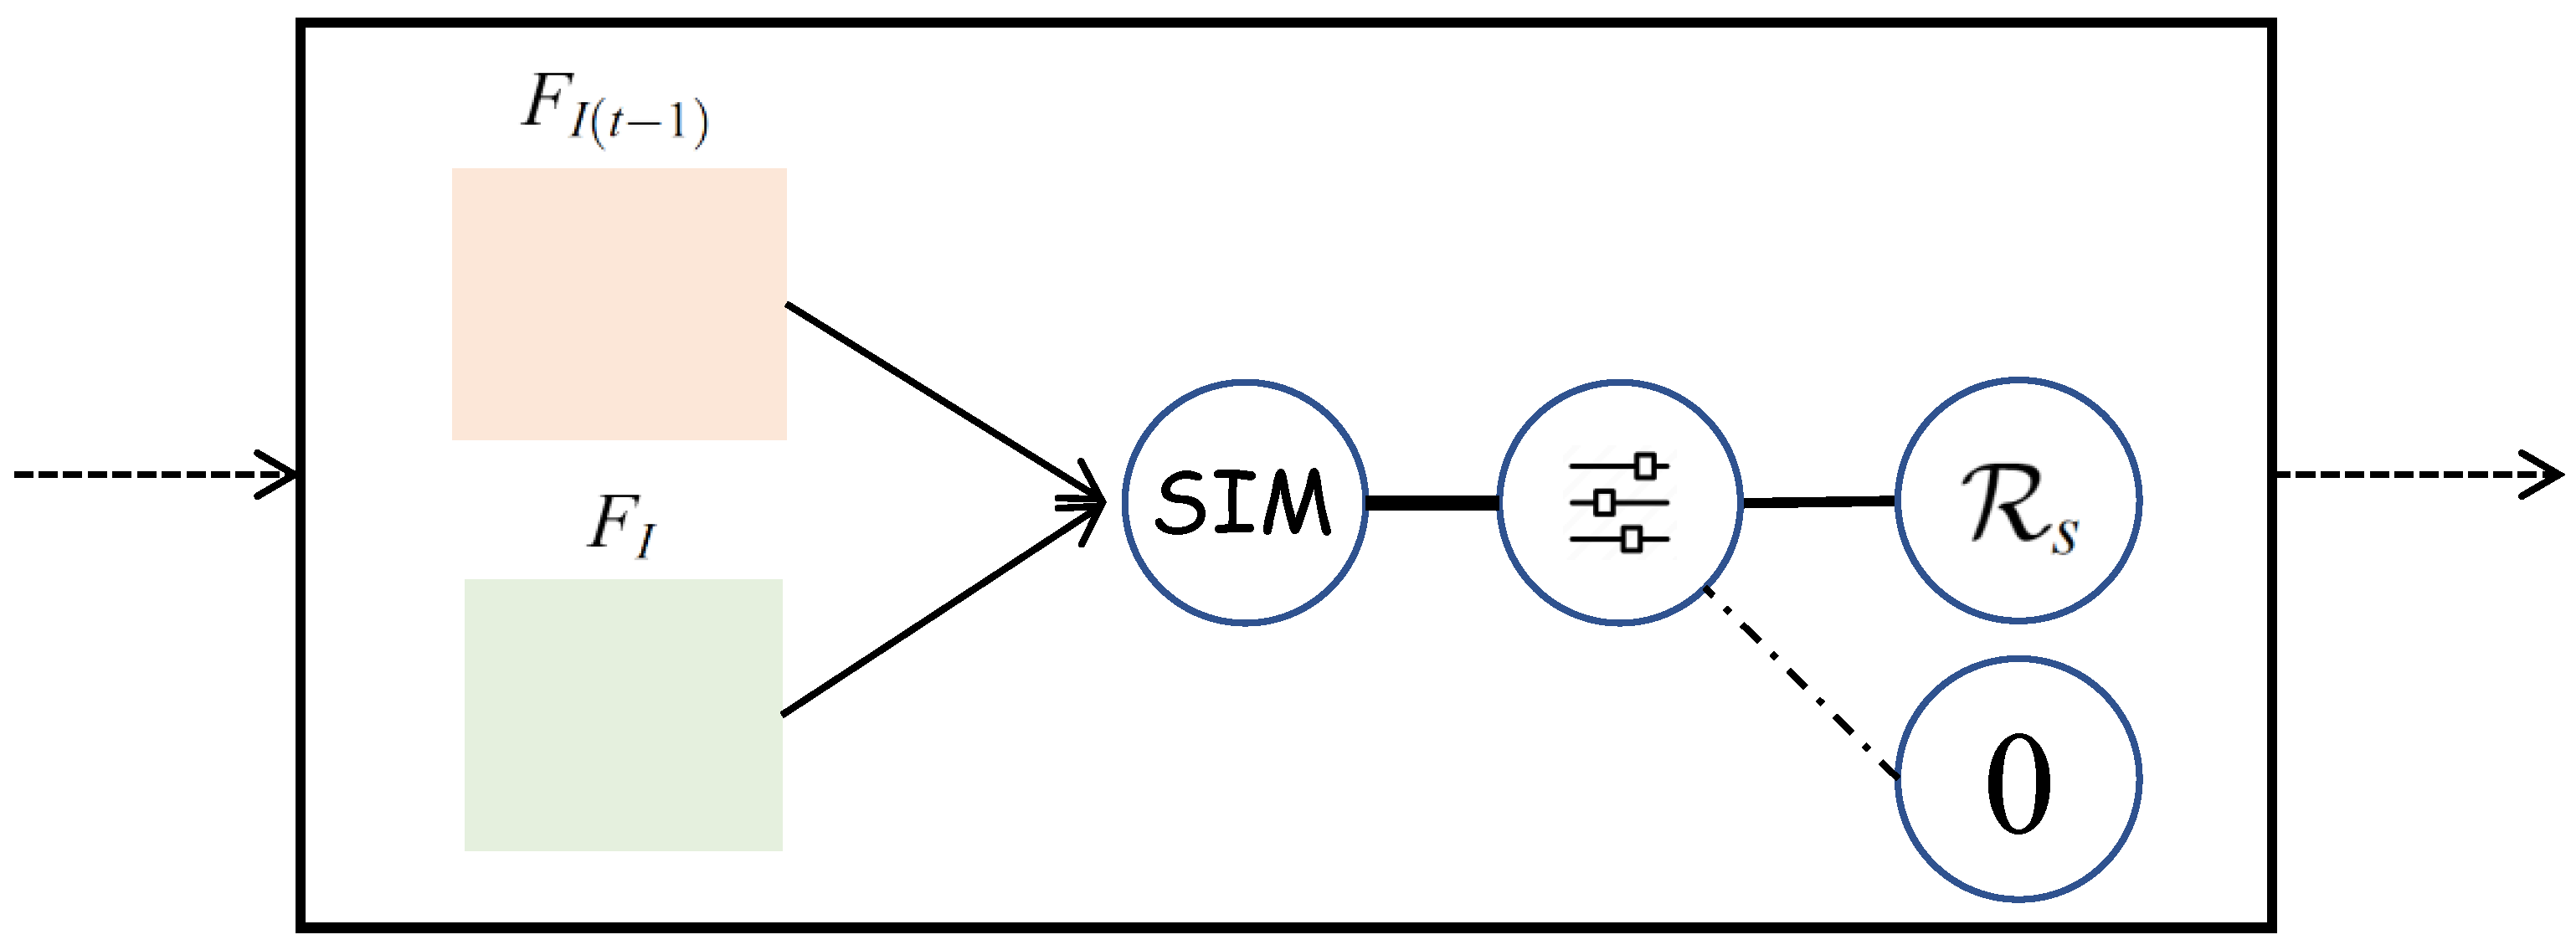
3.3. Inter-Frame Consistency Module
In autonomous driving, road information tends to be consistent over short periods of time. To capture the encoded road information from consecutive frames, where the feature differences are limited, an information measurement and contrast module based on inter-frame consistency is introduced. Two parallel inputs are taken by the module: the current frame
and the consecutive correlated frames
. The network structure of this module is depicted in
Figure 3. A measure of information similarity is introduced to compute the similarity of encoded features between adjacent frames:
where
represents the encoding function that obtains the feature encoding from image frames to feature information and
denotes the measurement function. Specifically, the KL-divergence is used as the measurement
to quantify the divergence between adjacent frame features. Mathematically, the KL-divergence between two frame features
and
is calculated as:
Furthermore, a constraint module is designed to enable the model to learn consistent information between neighboring frames:
where
is the threshold value set to distinguish scene transition issues during model training. When there is a significant difference in feature information due to scene transitions, it is necessary to disable the information measurement and comparison module in order to achieve better performance.
3.4. Multi Scale Adapter Net
To address multiple scales of the same object in different perspectives in road scenes, it is proposed to further integrate the adapter network into a multi-scale network to enhance the robustness of the network. Specifically, as shown in
Figure 1, the multi-level outputs of the backbone network are sent to the adapter network corresponding to each level, and the multi-scale adapter network is followed by an FPN [
20] for feature fusion.
4. Datasets and Metrics
In this section, the road segmentation dataset and road marking detection dataset are introduced, along with the corresponding evaluation metrics.
4.1. Datasets
For the road segmentation task, four public datasets are used: BDD100K, CamVid, SYNTHIA, and CeyMo. For the road marking detection task, the CeyMo dataset is also used for validation.
BDD100K [
21] serves as a benchmark dataset for experimental research and is a challenging public dataset in driving scenes. The dataset contains 100,000 frames from the driver’s perspective and is widely used as an evaluation benchmark for autonomous driving. The BDD100K dataset is considered to have more advantages in terms of weather conditions, scene locations, and lighting. Following previous work, the dataset has been divided into a training set containing 70,000 images, a validation set containing 10,000 images, and a test set containing 20,000 images.
CamVid [
22] is the first video collection that includes semantic labels for object classes. The dataset provides ground truth labels that associate each pixel with 1 of 32 semantic classes. CamVid is a road/driving scene understanding dataset that uses 5 video sequences captured by a
resolution camera installed on the dashboard of a car. These sequences are sampled (4 at 1 fps and 1 at 15 fps) for a total of 701 frames. A total of 367 frames are used for training, 101 frames for validation, and 233 frames for testing. Each frame has a size of
pixels.
SYNTHIA [
23] is a synthetic dataset consisting of 9400 photorealistic frames from a virtual city presented from multiple viewpoints, with pixel-level semantic annotations for 13 classes. Each frame has a resolution of
. A total of 6580 frames are used for training, and 2820 frames are used for validation. These images come from a collection of photorealistic frames rendered from a virtual city and have precise pixel-level semantic annotations for 13 classes. It is used for semantic segmentation and related scene understanding tasks in driving scenes.
The CeyMo [
24] dataset contains a total of 2887 images, with 4706 road marking instances annotated for 11 classes, and a resolution of
pixels. The entire dataset is divided into a training set (2099 images) and a test set (788 images). For each road marking instance, CeyMo provides three annotation methods: polygon, bounding box, and pixel-level annotation.
4.2. Evaluation Metrics
For the road segmentation task, accuracy (Acc) and mean Intersection over Union (mIoU) are used as evaluation metrics. For the road marking detection task, mean Average Precision (mAP) is used as the metric for validation.
4.2.1. Accuracy
For each image, the model predicts the following classification as correct or incorrect:
represents the model predicting positive and the actual sample being positive;
represents the model predicting positive and the actual sample being negative;
represents the model predicting negative and the actual sample being positive;
represents the model predicting negative and the actual sample being negative. Accuracy (Acc) is a commonly used metric for measuring the performance of a model, which represents the ratio of the number of correct judgments to the total number of judgments and describes the proportion of correct predictions made by a model on the test dataset. The formula for calculating accuracy is shown in Equation (
6):
4.2.2. Mean Intersection over Union
In semantic segmentation, Intersection over Union (IoU) is the ratio of the intersection and union of the ground truth and prediction. mIoU is the average of IoU for each class in the dataset, and the formula for calculating mIoU is as shown in Equation (
7):
where
k represents the number of classes included in the dataset.
4.2.3. Mean Average Precision
Mean Average Precision (mAP) is a measure of model performance in object detection. In object detection, the Accuracy metric in classification is not applicable due to the object localization boxes. The mAP metric in the object detection field is proposed. To calculate AP, precision and recall of the model are first calculated along with the P-R curve, and the formulas for calculating them are Equations (
8) and (
9):
The P-R curve is the curve formed by all Precision-Recall points connected by Precision as the horizontal axis and Recall as the vertical axis. The calculation formulas for AP and mAP are as shown in Equations (
10) and (
11):
where
represents the P-R curve, and
k represents the number of target categories included in the dataset. AP has a value range between 0 and 1. The higher the AP, the better the model’s performance. If the area under the P-R curve is 1, it means that the model’s performance is the best. Generally, AP is calculated for a single class, and mAP is the average of AP for all classes.
5. Experiments
In this section, the effectiveness of the proposed model is validated on road segmentation datasets and the road marking detection dataset.
5.1. Road Segmentation
Experiments are first conducted on road semantic segmentation using the BDD100K [
21], CamVid [
22], SYNTHIA [
23], and CeyMo [
24] datasets.
5.1.1. Training Details
The training network follows the basic structure of Swin-Transformer [
8]. A Swin-Transformer with a four-layer structure, featuring ResNet50 [
25] as the backbone network, is employed. Each layer consists of a merging module for image patches and a sequence of Swin-Transformer blocks. The specific number of Swin-Transformer blocks used per layer is as follows: 1, 1, 3, and 2. Additionally, the hidden feature dimensions for each layer are set as 48, 96, 192, and 384, respectively. The embed_dims is set to 48, and the window_size is set to 7. Each Adapter net is composed of two consecutive convolution layers with a kernel size of 1. The output channels in the convolution layers are set to 512, 256, and 256, respectively. The value of
g is set to 4, representing the number of groups within the Adapter net. All images in the datasets are resized to a resolution of
, and the same augmentation pipeline is applied, including random cropping and flipping.
The optimizer used is AdamW, with an initial learning rate of 0.00006, a weight_decay of 0.01, and a linear learning rate adjustment during training. The training is performed for 16,000 epochs, and the learning rate remains constant for the initial 1500 epochs. The training is implemented on a single NVIDIA RTX 2080 (NVIDIA, Santa Clara, CA, USA) Ti, with CUDA = 11.6, Python = 3.8, and PyTorch = 1.10.
5.1.2. Results on BDD100K
The model is validated on the Drivable Area Detection benchmark of the BDD100K [
21] dataset. The mIoU of Swin-APT on the BDD100K [
21] dataset is reported, and a comparison with previous works is presented in
Table 1.
Swin-APT showcases a clear performance advantage over the other methods in this comparison. Swin-APT stands out as the top-performing model with an impressive mIoU of 91.2%. Swin-APT significantly outperforms the baseline methods like MultiNet and DLT-Net, achieving mIoU scores of 71.6% and 72.1%, respectively. PSPNet and HybridNets are specialized models for semantic segmentation, yet Swin-APT outperforms both. A-YOLOM is a recent state-of-the-art model, but Swin-APT surpasses it with a higher mIoU of 91.2% versus A-YOLOM’s 91.0%. This indicates that Swin-APT represents a significant advancement in this task. In conclusion, Swin-APT distinguishes itself as a top-performing model in road segmentation on the BDD100K dataset, consistently outperforming various previous models and even recent advancements.
5.1.3. Results on CamVid
The model is validated on the CamVid benchmark. The mIoU of Swin-APT on the CamVid [
22] dataset is reported, and a comparison with previous works is presented in
Table 2.
Table 2 gives the quantitative results of different methods. Except for the DeepLabV3Plus + SDCNetAug [
33] method, Swin-APT shows significant advantages over other methods. Notably, it competes effectively with specialized models like DFANet A, DenseDecoder, VideoGCRF, and ETC-Mobile, surpassing all of them. For instance, it outperforms DFANet A with a significant margin, which attains an mIoU of 64.7%. DeepLabV3Plus + SDCNetAug achieves the highest mIoU of 81.7% in this comparison. However, it should be noted that this method employs additional training data for pre-training, which may result in a slight performance advantage. Swin-APT’s mIoU of 81.3% is just 0.4% lower, despite not relying on additional data, demonstrating its competitiveness. Swin-APT’s performance on the CamVid dataset reflects its versatility, as it can effectively tackle semantic segmentation tasks without the need for specialized training data. This suggests its potential as a robust model for various real-world applications.
5.1.4. Results on SYNTHIA
The performance of Swin-APT on synthetic data is validated using SYNTHIA [
23], and the accuracy of the proposed modules is verified through ablation experiments. The mIoU results of Swin-APT on the SYNTHIA [
23] dataset are compared in
Table 3.
The quantitative results in
Table 3 verify the effectiveness of the proposed modules. Swin-L represents the Swin-Transformer backbone structure with only reduced network size. Swin-L + apt represents the structure with the adapter network added at the highest layer. Swin-L + InCM represents the structure with only the information metric comparison module added for inter-frame consistency. Swin-L + MS apt represents the structure with the multi-scale adapter network added.
Swin-APT consistently outperforms its variants in almost all individual classes, including “Road”, “Building”, “Sky”, “Car”, “Vegetation”, “Pedestrian”, and “Cyclist”. The improvements across these classes collectively contribute to the higher mIoU. Notable performance improvement is observed as the base Swin-L configuration is progressed to Swin-APT. Swin-L denotes the Swin-Transformer backbone with reduced network size, and as components such as the adapter network (apt), InCM, and MS apt are incorporated, the mIoU is consistently increased. This indicates that segmentation accuracy is improved by these modules. It is believed that the reason for this phenomenon is that inter-frame consistency is disrupted in the SYNTHIA [
23] synthetic dataset, and the information metric comparison module for inter-frame consistency is only applicable to a small amount of data, making it difficult to demonstrate its advantages. To investigate this issue, ablation experiment results on the real CeyMo [
24] dataset are provided to observe the effectiveness of the modules.
5.1.5. Results on CeyMo
The road object segmentation task experimental results of Swin-APT on the CeyMo [
24] dataset are presented. The mIoU and Acc of the lightweight network Swin-L and Swin-APT for 11 object classes are reported in
Table 4 and
Table 5, respectively, to verify the effectiveness of the multi-scale adapter network and the information metric comparison module for inter-frame consistency.
Table 4 shows that the best IoU is mostly obtained by the complete Swin-APT. As the configuration transitions from having no additional modules (denoted by ✘ for absent and ✔ for present) to having all modules, consistent improvements in IoU across most categories are observed. Swin-APT consistently outperforms the other configurations in almost all categories, including “BL”, “DM”, “JB”, “PC”, “RA”, “SL”, and “SLA”. This demonstrates that the combination of the adapter network (Apt), Inter-frame Consistency Module (InCM), and Multi-Scale Adapter (MS) contributes to improved segmentation accuracy across various categories. For example, in the “RA” category, Swin-APT achieves an IoU of 82.36%, which is notably higher than the configuration without these modules, which has an IoU of 37.81%. Similar trends can be observed in other categories. The exceptions are analyzed: for the Left Arrow (LA) class, the performance decreases after the use of the multi-scale adapter, which is attributed to category ambiguity. Specifically, significant consistency exists between the Straight-Left Arrow and Left Arrow categories, which may affect the model’s learning of scale.
Similarly,
Table 5 provides an ablation study comparing three different configurations, varying the presence of different modules. Swin-APT exhibits a clear performance advantage over other configurations in terms of accuracy (Acc) on the CeyMo dataset. The proposed combination of modules contributes to enhanced segmentation accuracy across various categories, making Swin-APT a strong candidate for diverse segmentation tasks.
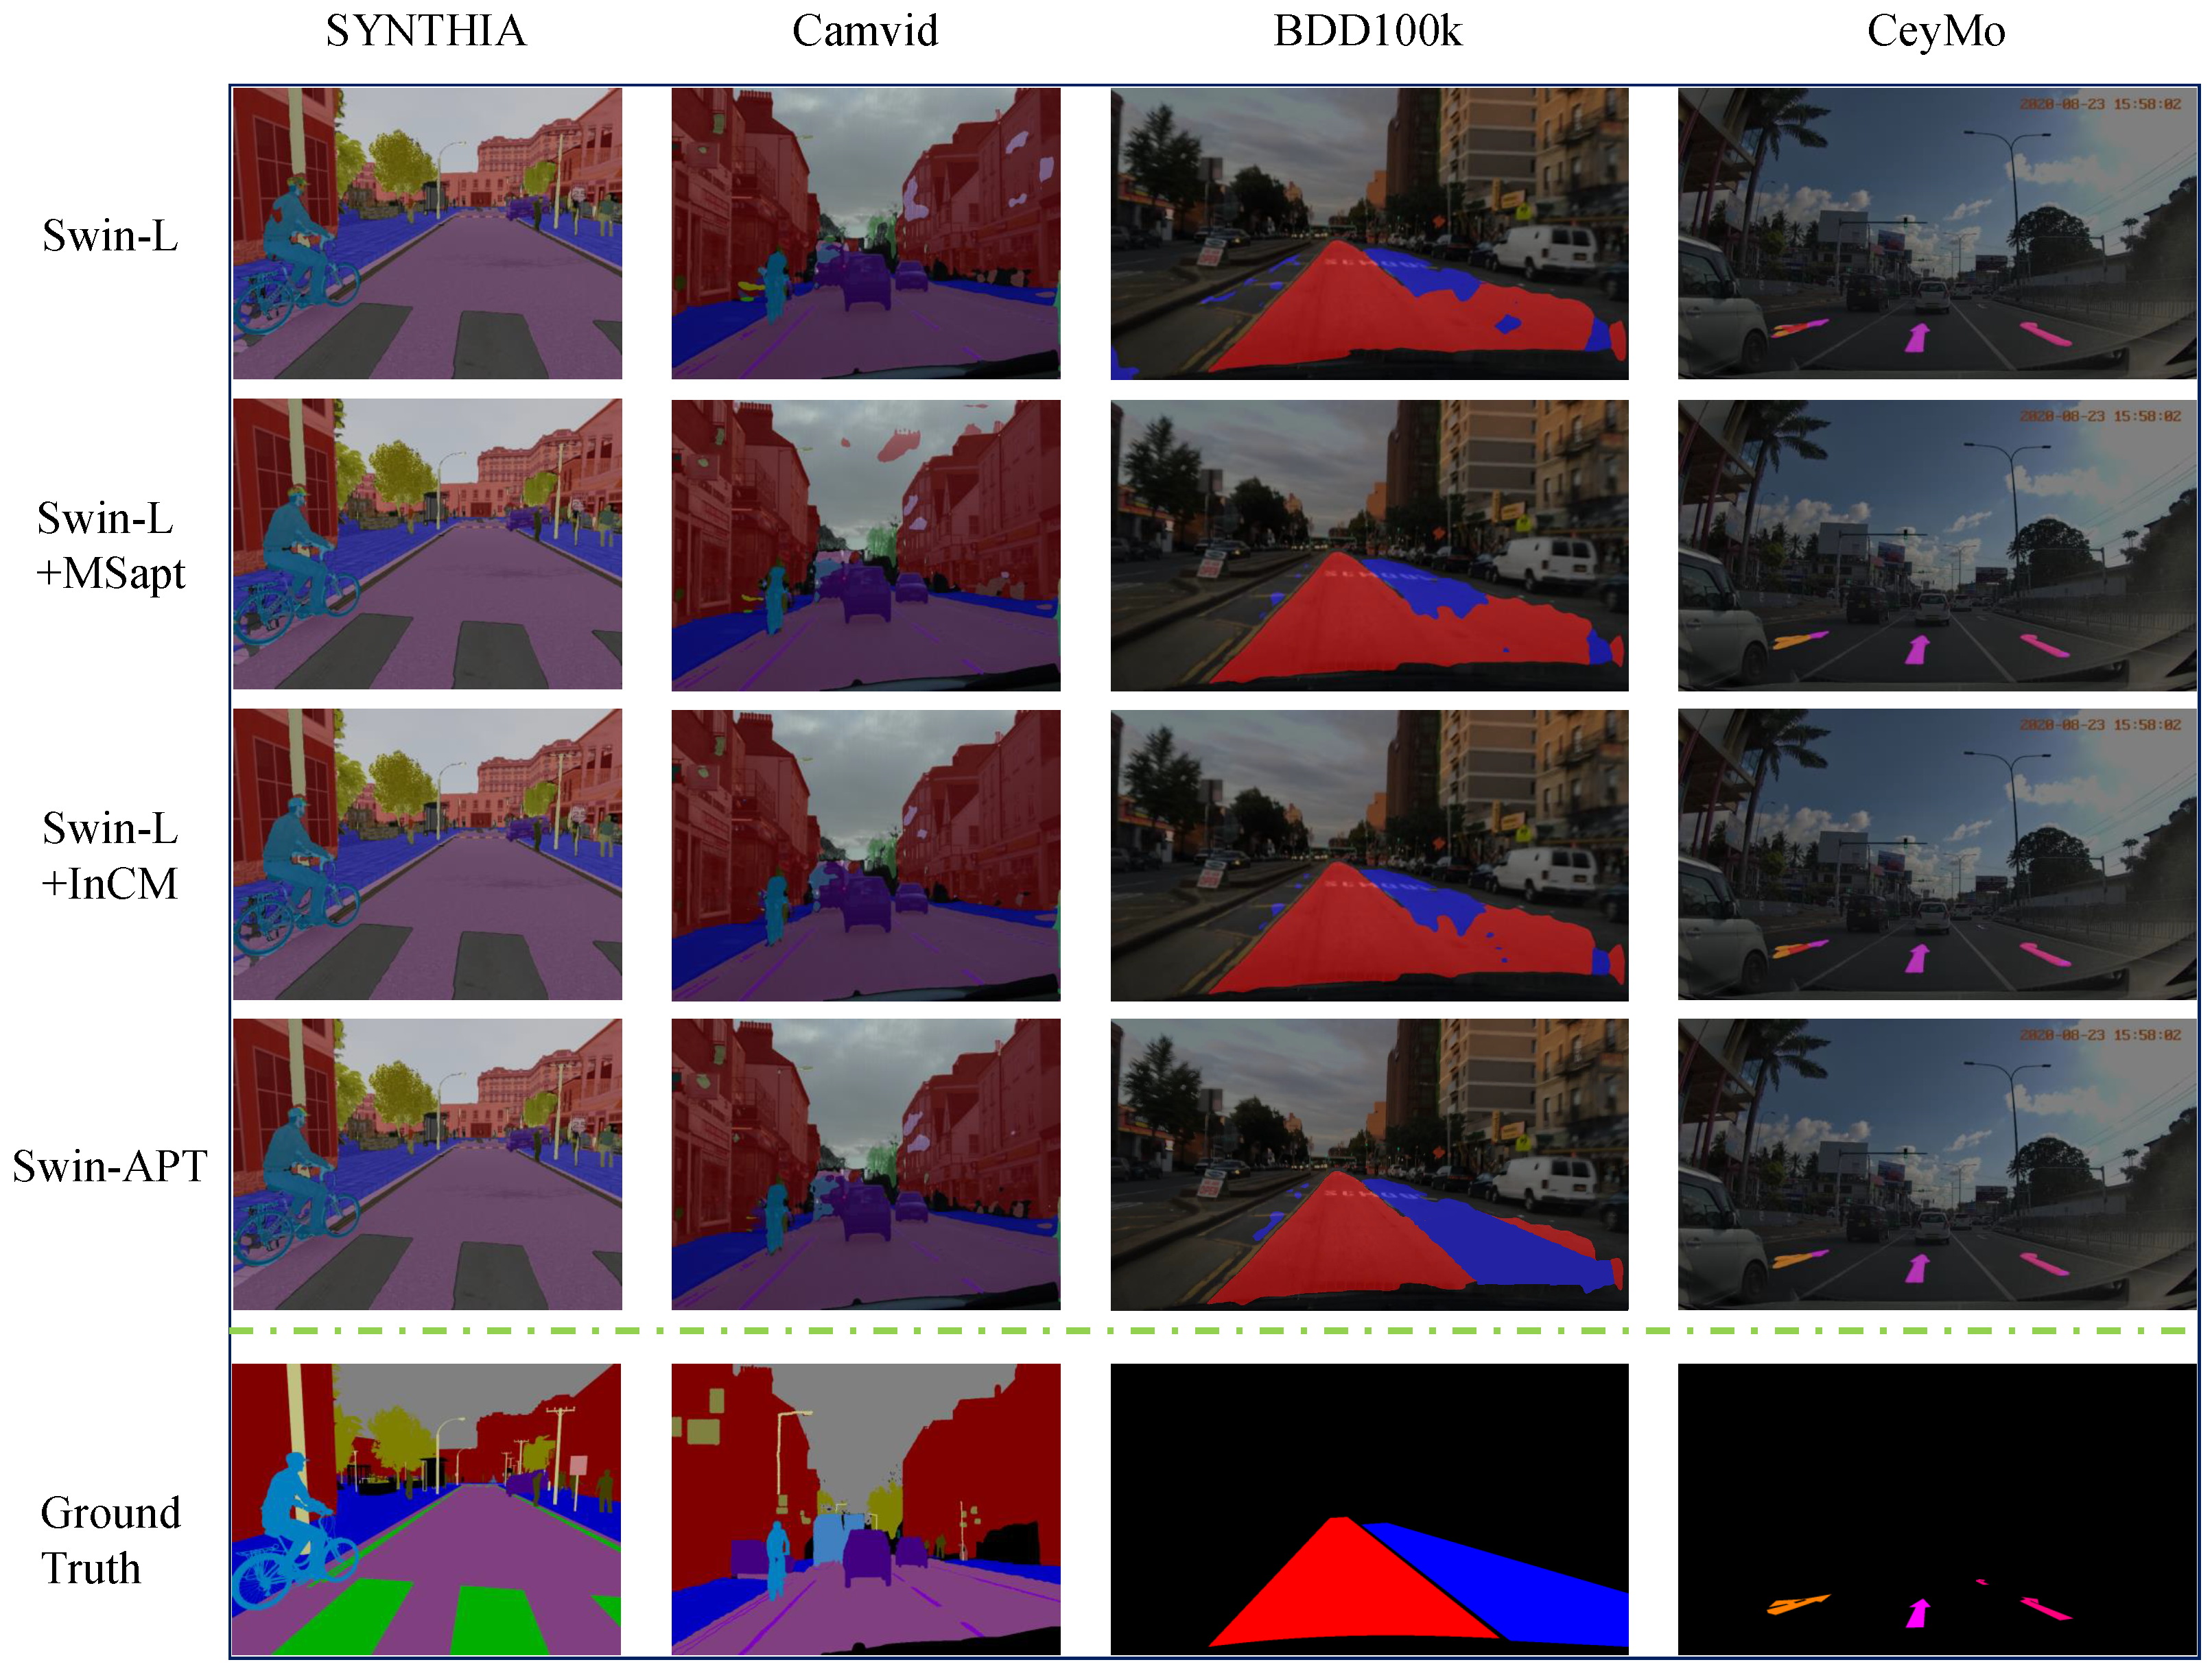
5.1.6. Visualization for Semantic Segmentation
The prediction results of Swin-APT on the BDD100K [
21], CamVid [
22], SYNTHIA [
23], and CeyMo [
24] datasets are visualized to demonstrate the performance of the proposed model structure and modules, as illustrated in
Figure 4.
The first row in
Figure 4 shows the results of Swin-L, the second row shows the results of adding the adapter network at the highest layer of Swin-L, the third row shows the results of adding the information metric comparison module for inter-frame consistency at the highest layer of Swin-L, the fourth row shows the results of adding the information metric comparison module for inter-frame consistency, the fifth row shows the visualization results of the complete Swin-APT structure, and the last row shows the ground truth labels. Each column represents a dataset.
5.2. Road Marking Detection
Experiments on road marking detection on the CeyMo [
24] dataset are also conducted to demonstrate the effectiveness in the detection task.
5.2.1. Training Details
Similar to road segmentation, the training network with the same architecture, except for the task-specific detection head, is employed. During training, AdamW is used as the optimizer with an initial learning rate of 0.0001 and weight_decay of 0.05. Additionally, a linear learning rate scheduler is used. The training is conducted for a total of 24 epochs on a single GPU 2080 Ti.
5.2.2. Results on CeyMo
To verify the robustness of the proposed model, the results of Swin-APT on the CeyMo [
24] dataset are presented. To ensure consistency with ref. [
24], a comparison is made with SSD-MobileNet-v1 [
34,
35], SSD-Inception-v2 [
34,
36], Mask-RCNN-Inception-v2 [
36,
37], and Mask-RCNN-ResNet50 [
25,
37]. The F1-Score and Macro F1-Score for each category are reported in
Table 6.
Table 6 provides a comparison of the Macro F1-Score results for various methods, including SSD MobileNet-v1, SSD Inception-v2, Mask-RCNN Inception-v2, Mask-RCNN ResNet50, and Swin-APT. Swin-APT achieves the highest Macro F1-Score of 90.18%, outperforming the other methods. Swin-APT demonstrates superiority over various other architectures, including SSD MobileNet-v1, SSD Inception-v2, Mask-RCNN Inception-v2, and Mask-RCNN ResNet50, in most of the evaluated categories. Notably, Swin-APT excels in categories such as “Cycle Line”, “Diamond”, “Junction Box”, “Left Arrow”, “Right Arrow”, “Straight Arrow”, “Slow”, “Straight-Left Arrow”, and “Straight-Right Arrow”. Swin-APT consistently achieves high F1-Scores across a range of object categories, contributing to its excellent Macro F1-Score. This suggests that Swin-APT is effective in accurately detecting and classifying objects across diverse classes. The Macro F1-Score for Swin-APT (90.18%) is the highest among all methods in the comparison, indicating its overall superiority in terms of object detection accuracy.
Similarly, the AP and overall mAP metrics of the lightweight Swin-L and Swin-APT for 11 object categories on the CeyMo [
24] dataset are presented in
Table 7, to verify the effectiveness of the multi-scale adapter network and the information metric comparison module for inter-frame consistency.
Table 7 illustrates that Swin-APT exhibits a clear performance advantage over other configurations in terms of mAP on the CeyMo dataset. The proposed combination of modules plays a pivotal role in improving road marking detection accuracy across different categories.
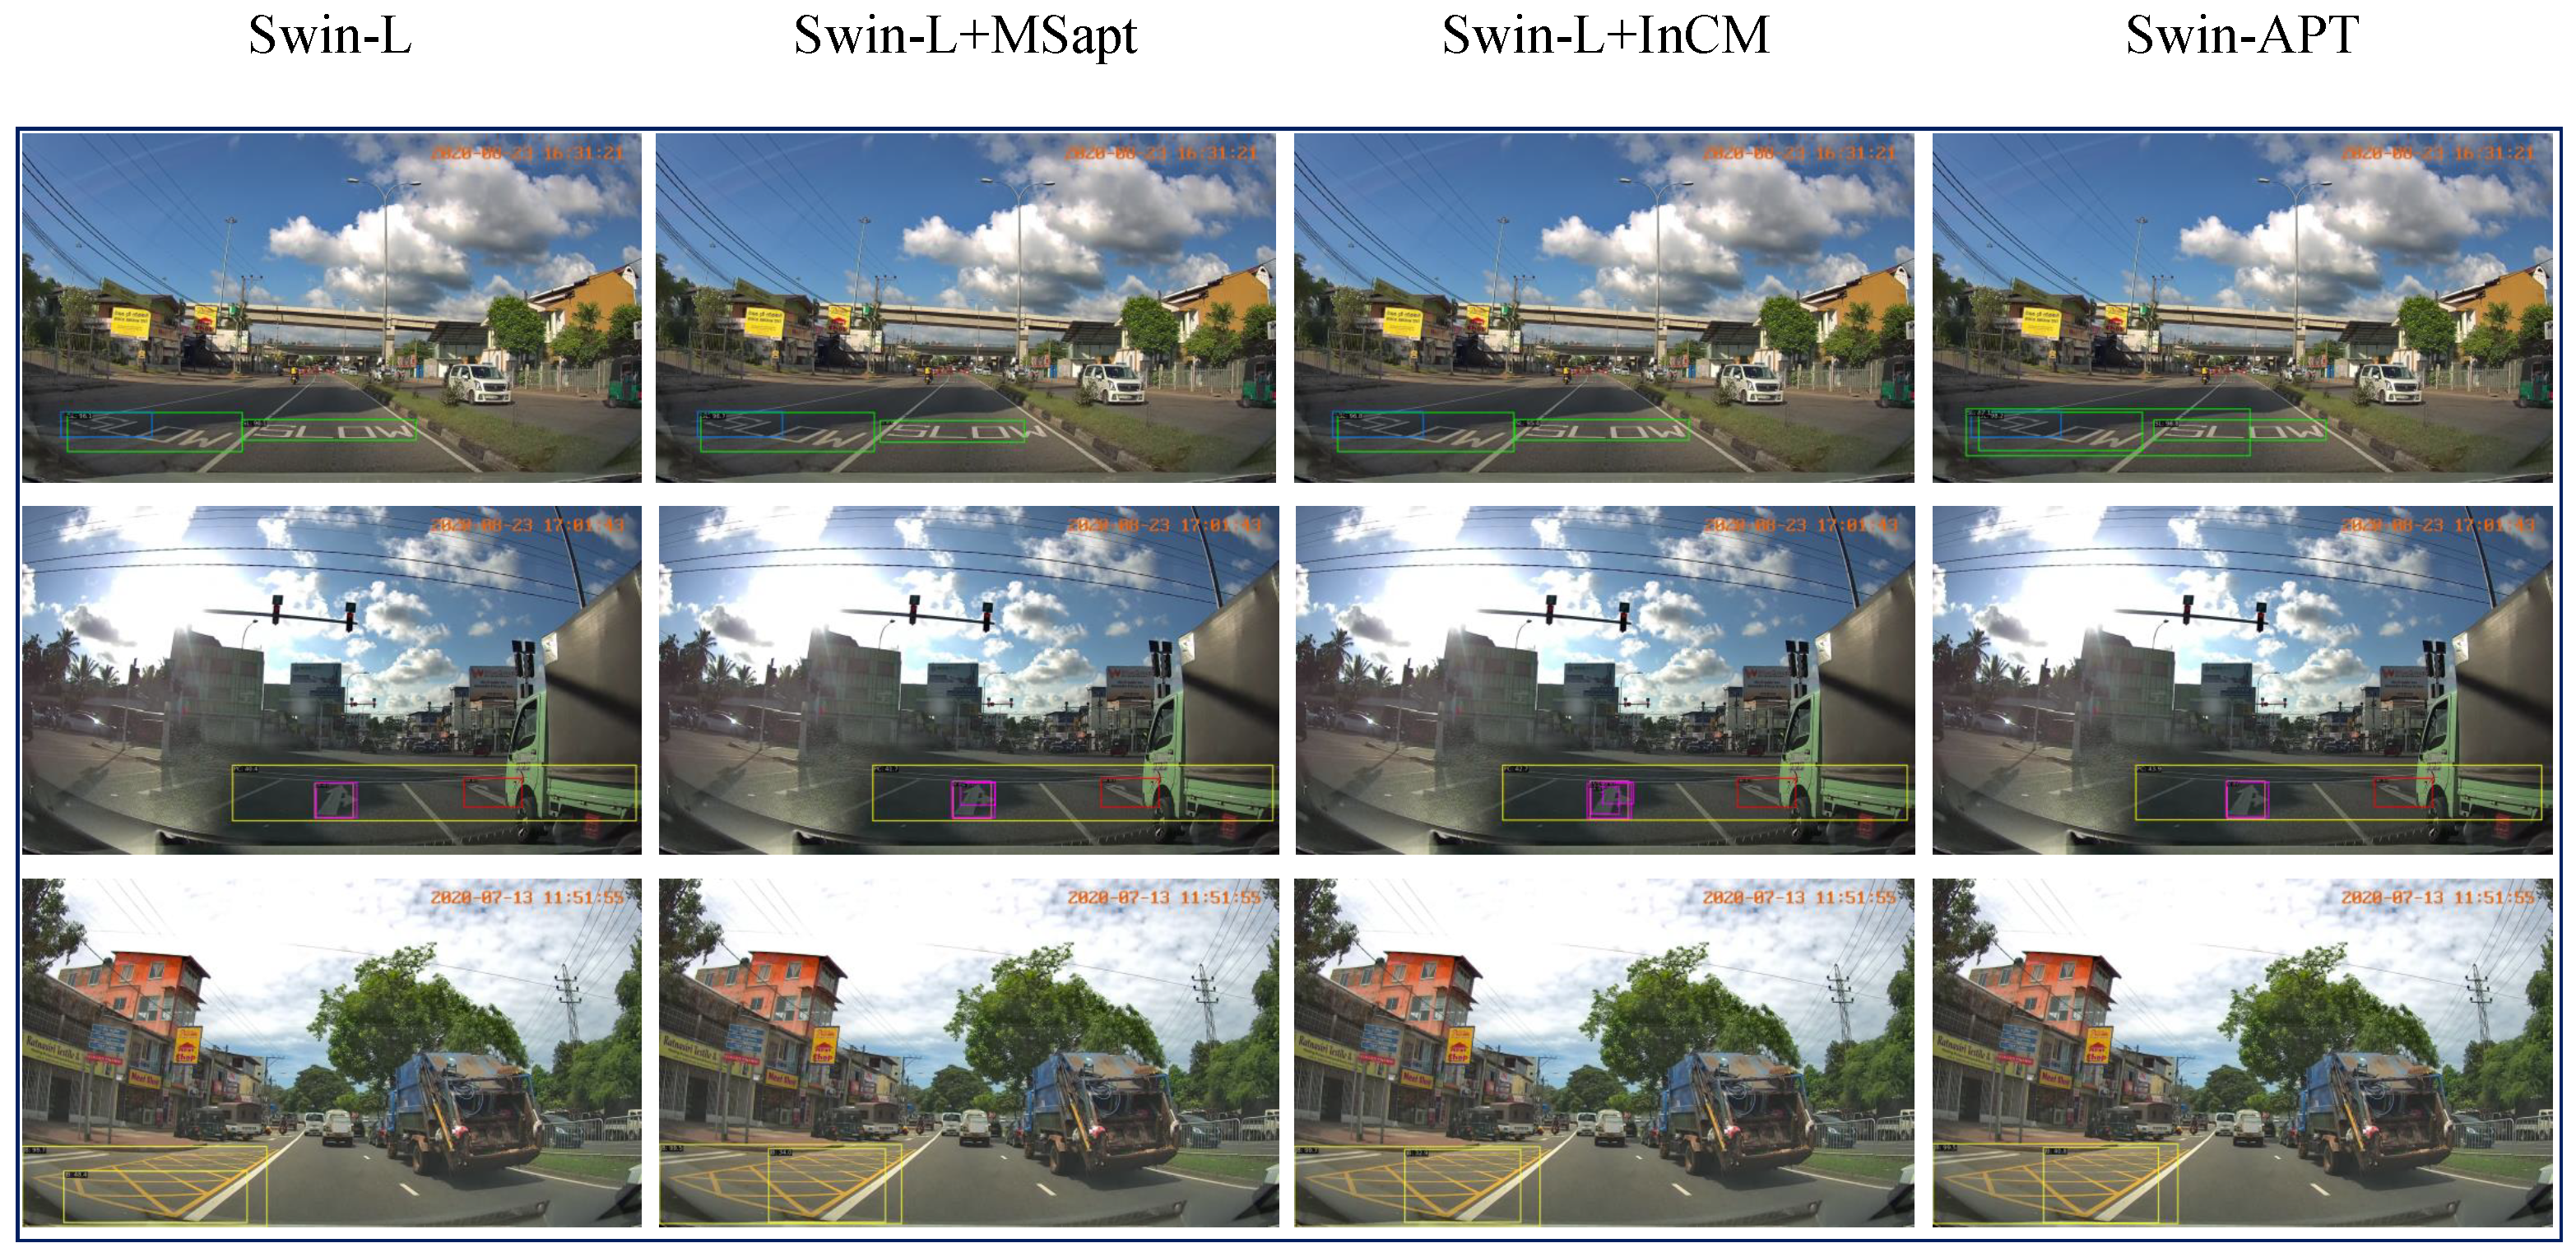
5.2.3. Visualization for Road Marking Detection
The prediction results of Swin-APT on the CeyMo [
24] dataset are visualized to intuitively demonstrate the performance of the proposed model structure and modules, as shown in
Figure 5.
Some examples from the CeyMo [
24] dataset are shown in
Figure 5. The results of Swin-L are visualized in the first column, the results of adding the adapter network to the highest layer of Swin-L are visualized in the second column, the results of adding the information metric comparison module for inter-frame consistency to the highest layer of Swin-L are visualized in the third column, the results of adding the information metric comparison module for inter-frame consistency are shown in the fourth column, and the visualization results of the complete structure Swin-APT are shown in the fifth row. Each row corresponds to one sample.
6. Conclusions
This work focuses on deep learning-based semantic segmentation and object detection for intelligent transportation systems. Swin-APT, a lightweight network and an adapter network suitable for image semantic segmentation and object detection tasks is designed. Additionally, a module based on inter-frame consistency of images is proposed, which allows the full utilization of the consistency of adjacent frame information to extract more accurate road information from images. The adapter network is applied to the multi-scale feature space, which can effectively identify scene targets of different scales. The proposed method is verified on four datasets: BDD100K, CamVid, SYNTHIA, and CeyMo, and outperforms the baseline by 13.1%. Furthermore, the experimental results on the road marking detection benchmark show an improvement of 1.85% of mAcc.
Author Contributions
Conceptualization, C.W.; Investigation, C.W.; Methodology, Y.L.; Resources, Y.Z.; Software, Y.L.; Supervision, S.Z.; Visualization, Y.Z.; Writing—original draft, K.C.; Writing—review and editing, Y.L. All authors have read and agreed to the published version of the manuscript.
Funding
This work was supported in part by the National Natural Science Foundation of China under Grant 62272089 and the General Program of Science and Technology Department of Sichuan Province under Grant 2022YFG0207.
Institutional Review Board Statement
Not applicable.
Informed Consent Statement
Not applicable.
Data Availability Statement
Conflicts of Interest
The author declares no conflict of interest.
References
- Zhang, J.; Wang, F.Y.; Wang, K.; Lin, W.H.; Xu, X.; Chen, C. Data-driven intelligent transportation systems: A survey. IEEE Trans. Intell. Transp. Syst. 2011, 12, 1624–1639. [Google Scholar] [CrossRef]
- Wang, H.; Zhang, H. A hybrid method of vehicle detection based on computer vision for intelligent transportation system. Int. J. Multimed. Ubiquitous Eng. 2014, 9, 105–118. [Google Scholar] [CrossRef]
- Yang, Z.; Pun-Cheng, L.S. Vehicle detection in intelligent transportation systems and its applications under varying environments: A review. Image Vis. Comput. 2018, 69, 143–154. [Google Scholar] [CrossRef]
- Wong, C.C.; Gan, Y.; Vong, C.M. Efficient Outdoor Video Semantic Segmentation Using Feedback-Based Fully Convolution Neural Network. IEEE Trans. Ind. Inform. 2020, 16, 5128–5136. [Google Scholar] [CrossRef]
- Junaid, M.; Ghafoor, M.; Khalid, S.; Hassan, A.; Zia, T. Multi-feature View-based Shallow Convolutional Neural Network for Road Segmentation. IEEE Access 2020, 8, 36612–36623. [Google Scholar] [CrossRef]
- Liao, J.; Cao, L.; Li, W.; Luo, X.; Feng, X. UnetDVH-Linear: Linear Feature Segmentation by Dilated Convolution with Vertical and Horizontal Kernels. Sensors 2020, 20, 5759. [Google Scholar] [CrossRef] [PubMed]
- Yao, X.; Zhang, Y.; Yao, Y.; Tian, J.; Yang, C.; Xu, Z.; Guan, Y. Traffic vehicle detection algorithm based on YOLOv3. In Proceedings of the International Conference on Intelligent Transportation, Big Data & Smart City (ICITBS), Xi’an, China, 27–28 March 2021; pp. 47–50. [Google Scholar]
- Liu, Z.; Lin, Y.; Cao, Y.; Hu, H.; Wei, Y.; Zhang, Z.; Lin, S.; Guo, B. Swin transformer: Hierarchical vision transformer using shifted windows. In Proceedings of the IEEE/CVF International Conference on Computer Vision, Montreal, QC, Canada, 10–17 October 2021; pp. 10012–10022. [Google Scholar]
- Tao, C.; Qi, J.; Li, Y.; Wang, H.; Li, H. Spatial information inference net: Road extraction using road-specific contextual information. ISPRS J. Photogramm. Remote Sens. 2019, 158, 155–166. [Google Scholar] [CrossRef]
- Che, E.; Jung, J.; Olsen, M. Object Recognition, Segmentation, and Classification of Mobile Laser Scanning Point Clouds: A State of the Art Review. Sensors 2019, 19, 810. [Google Scholar] [CrossRef] [PubMed]
- Redmon, J.; Divvala, S.; Girshick, R.; Farhadi, A. You only look once: Unified, real-time object detection. In Proceedings of the IEEE Conference on Computer Vision and Pattern Recognition, Las Vegas, NV, USA, 27–30 June 2016; pp. 779–788. [Google Scholar]
- Redmon, J.; Farhadi, A. YOLO9000: Better, faster, stronger. In Proceedings of the IEEE Conference on Computer Vision and Pattern Recognition, Honolulu, HI, USA, 21–26 July 2017; pp. 7263–7271. [Google Scholar]
- Redmon, J.; Farhadi, A. Yolov3: An incremental improvement. arXiv 2018, arXiv:1804.02767. [Google Scholar]
- Tajar, A.T.; Ramazani, A.; Mansoorizadeh, M. A lightweight Tiny-YOLOv3 vehicle detection approach. J. Real-Time Image Process. 2021, 18, 2389–2401. [Google Scholar] [CrossRef]
- Kim, K.J.; Kim, P.K.; Chung, Y.S.; Choi, D.H. Performance enhancement of YOLOv3 by adding prediction layers with spatial pyramid pooling for vehicle detection. In Proceedings of the 15th IEEE International Conference on Advanced Video and Signal Based Surveillance (AVSS), Auckland, New Zealand, 27–30 November 2018; pp. 1–6. [Google Scholar]
- Doan, T.N.; Truong, M.T. Real-time vehicle detection and counting based on YOLO and DeepSORT. In Proceedings of the 12th International Conference on Knowledge and Systems Engineering (KSE), Can Tho City, Vietnam, 12–14 November 2020; pp. 67–72. [Google Scholar]
- Lin, C.J.; Jeng, S.Y.; Lioa, H.W. A real-time vehicle counting, speed estimation, and classification system based on virtual detection zone and YOLO. Math. Probl. Eng. 2021, 2021, 1577614. [Google Scholar] [CrossRef]
- Teichmann, M.; Weber, M.; Zoellner, M.; Cipolla, R.; Urtasun, R. Multinet: Real-time joint semantic reasoning for autonomous driving. In Proceedings of the IEEE Intelligent Vehicles Symposium (IV), Changshu, China, 26–30 June 2018; pp. 1013–1020. [Google Scholar]
- Qian, Y.; Dolan, J.M.; Yang, M. DLT-Net: Joint detection of drivable areas, lane lines, and traffic objects. IEEE Trans. Intell. Transp. Syst. 2019, 21, 4670–4679. [Google Scholar] [CrossRef]
- Lin, T.Y.; Dollár, P.; Girshick, R.; He, K.; Hariharan, B.; Belongie, S. Feature pyramid networks for object detection. In Proceedings of the IEEE Conference on Computer Vision and Pattern Recognition, Honolulu, HI, USA, 21–26 July 2017; pp. 2117–2125. [Google Scholar]
- Yu, F.; Chen, H.; Wang, X.; Xian, W.; Chen, Y.; Liu, F.; Madhavan, V.; Darrell, T. Bdd100k: A diverse driving dataset for heterogeneous multitask learning. In Proceedings of the IEEE/CVF Conference on Computer Vision and Pattern Recognition, Seattle, WA, USA, 14–19 June 2020; pp. 2636–2645. [Google Scholar]
- Brostow, G.J.; Fauqueur, J.; Cipolla, R. Semantic object classes in video: A high-definition ground truth database. Pattern Recognit. Lett. 2009, 30, 88–97. [Google Scholar] [CrossRef]
- Ros, G.; Sellart, L.; Materzynska, J.; Vazquez, D.; Lopez, A.M. The synthia dataset: A large collection of synthetic images for semantic segmentation of urban scenes. In Proceedings of the IEEE Conference on Computer Vision and Pattern Recognition, Las Vegas, NV, USA, 27–30 June 2016; pp. 3234–3243. [Google Scholar]
- Jayasinghe, O.; Hemachandra, S.; Anhettigama, D.; Kariyawasam, S.; Rodrigo, R.; Jayasekara, P. CeyMo: See more on roads-a novel benchmark dataset for road marking detection. In Proceedings of the IEEE/CVF Winter Conference on Applications of Computer Vision, Waikoloa, HI, USA, 3–8 January 2022; pp. 3104–3113. [Google Scholar]
- He, K.; Zhang, X.; Ren, S.; Sun, J. Deep residual learning for image recognition. In Proceedings of the IEEE Conference on Computer Vision and Pattern Recognition, Las Vegas, NV, USA, 27–30 June 2016; pp. 770–778. [Google Scholar]
- Zhao, H.; Shi, J.; Qi, X.; Wang, X.; Jia, J. Pyramid scene parsing network. In Proceedings of the IEEE Conference on Computer Vision and Pattern Recognition, Honolulu, HI, USA, 21–26 July 2017; pp. 2881–2890. [Google Scholar]
- Vu, D.; Ngo, B.; Phan, H. Hybridnets: End-to-end perception network. arXiv 2022, arXiv:2203.09035. [Google Scholar]
- Wang, J.; Wu, Q.; Zhang, N. You Only Look at Once for Real-time and Generic Multi-Task. arXiv 2023, arXiv:2310.01641. [Google Scholar]
- Li, H.; Xiong, P.; Fan, H.; Sun, J. Dfanet: Deep feature aggregation for real-time semantic segmentation. In Proceedings of the IEEE/CVF Conference on Computer Vision and Pattern Recognition, Long Beach, CA, USA, 15–20 June 2019; pp. 9522–9531. [Google Scholar]
- Bilinski, P.; Prisacariu, V. Dense decoder shortcut connections for single-pass semantic segmentation. In Proceedings of the IEEE Conference on Computer Vision and Pattern Recognition, Salt Lake City, UT, USA, 18–23 June 2018; pp. 6596–6605. [Google Scholar]
- Chandra, S.; Couprie, C.; Kokkinos, I. Deep spatio-temporal random fields for efficient video segmentation. In Proceedings of the IEEE conference on Computer Vision and Pattern Recognition, Salt Lake City, UT, USA, 18–23 June 2018; pp. 8915–8924. [Google Scholar]
- Liu, Y.; Shen, C.; Yu, C.; Wang, J. Efficient semantic video segmentation with per-frame inference. In Proceedings of the Computer Vision–ECCV 2020: 16th European Conference, Glasgow, UK, 23–28 August 2020; pp. 352–368. [Google Scholar]
- Zhu, Y.; Sapra, K.; Reda, F.A.; Shih, K.J.; Newsam, S.; Tao, A.; Catanzaro, B. Improving semantic segmentation via video propagation and label relaxation. In Proceedings of the IEEE/CVF Conference on Computer Vision and Pattern Recognition, Long Beach, CA, USA, 15–20 June 2019; pp. 8856–8865. [Google Scholar]
- Liu, W.; Anguelov, D.; Erhan, D.; Szegedy, C.; Reed, S.; Fu, C.Y.; Berg, A.C. Ssd: Single shot multibox detector. In Proceedings of the Computer Vision–ECCV 2016: 14th European Conference, Amsterdam, The Netherlands, 11–14 October 2016; pp. 21–37. [Google Scholar]
- Howard, A.G.; Zhu, M.; Chen, B.; Kalenichenko, D.; Wang, W.; Weyand, T.; Andreetto, M.; Adam, H. Mobilenets: Efficient convolutional neural networks for mobile vision applications. arXiv 2017, arXiv:1704.04861. [Google Scholar]
- Szegedy, C.; Vanhoucke, V.; Ioffe, S.; Shlens, J.; Wojna, Z. Rethinking the inception architecture for computer vision. In Proceedings of the IEEE Conference on Computer Vision and Pattern Recognition, Las Vegas, NV, USA, 27–30 June 2016; pp. 2818–2826. [Google Scholar]
- He, K.; Gkioxari, G.; Dollár, P.; Girshick, R. Mask r-cnn. In Proceedings of the IEEE International Conference on Computer Vision, Venice, Italy, 22–29 October 2017; pp. 2961–2969. [Google Scholar]
| Disclaimer/Publisher’s Note: The statements, opinions and data contained in all publications are solely those of the individual author(s) and contributor(s) and not of MDPI and/or the editor(s). MDPI and/or the editor(s) disclaim responsibility for any injury to people or property resulting from any ideas, methods, instructions or products referred to in the content. |
© 2023 by the authors. Licensee MDPI, Basel, Switzerland. This article is an open access article distributed under the terms and conditions of the Creative Commons Attribution (CC BY) license (https://creativecommons.org/licenses/by/4.0/).


