Article

Mitigating Nitrate Concentration Using an Optimal Cropping Pattern Developed by Linking a Soil and Water Assessment Tool with Evolutionary Optimization

1
ICEDS & MSI, Australian National University, Canberra, ACT 2601, Australia
2
College of Science, James Cook University, Townsville, QLD 4811, Australia
*
Author to whom correspondence should be addressed.
Appl. Sci. 2023, 13(24), 13183; https://doi.org/10.3390/app132413183
Submission received: 16 November 2023 / Revised: 3 December 2023 / Accepted: 7 December 2023 / Published: 12 December 2023

Abstract

:
The unplanned development of agricultural land and urban areas poses threats to water quality, which can lead to the death of the aquatic species in rivers. The present study developed a novel framework by combining a soil and water assessment tool (SWAT) and evolutionary algorithms to optimize the cultivation pattern at the catchment scale in the Tajan River basin, with the aim of mitigating the environmental impacts of surface runoff from farms. This river basin is located in northern Iran, where quick agricultural development is one of the environmental challenges. We utilized a SWAT to simulate the nitrate concentrations for different crops at the river basin scale by applying the Nash–Sutcliffe model efficiency coefficient (NSE) as a measurement index. Then, a novel model was developed to optimize the cultivation pattern by applying different metaheuristic algorithms. Fuzzy technique for order of preference by similarity to ideal solution (TOPSIS) was applied as a decision-making system to select the best optimization algorithm. The results demonstrated that using a SWAT in the optimization model structure is a robust method for the design of an optimal cultivation pattern. The Nash–Sutcliffe model efficiency coefficient (NSE) was 0.74, demonstrating the robust predictive skills of the water quality model. The decision-making system indicated that particle swarm optimization and shuffled complex evolution were the best evolutionary algorithms to optimize the cultivation pattern using the proposed method. The proposed method opens a new window regarding the optimization of cultivation patterns in agriculture and provides an environmental-based optimization to design cultivation patterns on the catchment scale.

1. Introduction

Rivers have a significant role in the development of human communities [1]. These inland water bodies are important ecosystems, where many aquatic species need suitable water quality for survival. However, pollutants from urban and nonurban areas might drain into these water bodies [2]. It should be noted that rivers are one of the most important ecosystems in the world. In fact, aquatic and many terrestrial species are dependent on river ecosystems. The increasing human population might intensify the destruction of river habitats in the future [3]. Thus, protecting river ecosystems has gained attention in recent decades. Two types of abiotic factors affect the suitability of river habitats: physical habitat parameters and water quality parameters [4]. The development of agricultural land and urban areas is a serious threat that weakens the suitability of water quality. In fact, the surface runoff from agricultural and urban areas might be considerably polluted, meaning the concentration of the constituents might be higher than the defined suitable threshold for aquatic organisms such as fishes [5].
Agriculture is one of the key components of economic development in many countries. However, polluted surface runoff from farms poses a serious problem for downstream river aquatic habitats. One of the strategies for controlling runoff pollutants for farms is using treatment facilities. For example, constructed wetlands are one of the known tools for treating agricultural lands [6]. However, construction of these facilities can be very expensive. Thus, they are not a popular option, especially in developing countries. It seems that using other options might be useful in this regard. Selecting a correct cultivation pattern is one of the requirements for effective agricultural practice [7]. Many previous studies have highlighted the importance of the cultivation pattern, and different methods have been developed to optimize them [8,9,10]. Most of these studies have focused on economic benefit or water consumption as two critical factors in agriculture. However, sustainable agricultural development needs to focus on the environmental aspects of agriculture. Owing to impact of agricultural practices on the generated runoff at the catchment scale, farming might harm downstream river habitats drastically. A focus on the environmental aspects of the optimization of the cultivation pattern is thus required. In fact, it might be an inexpensive option to mitigate the impact of water pollutants on downstream river ecosystems. It should be noted that a focus on mitigating environmental impacts is needed to maintain good agricultural practices for future years.
Modeling of agricultural practices is a viable path to ensure optimal water management and productivity and to minimize the environmental impacts of agricultural practices. Optimization methods are an important tool for managing cropping patterns in order to balance the economic benefits and environmental impacts of agriculture. One of the key requirements regarding optimization models is to select a robust and efficient optimization method. Linear programming (LP) is the simplest method for optimization [11]. It has also been utilized in cropping pattern optimization [12] and might be applicable for simple and linear objective functions. However, it might not be the most appropriate option for nonlinear objective functions. Nonlinear programming (NLP) and dynamic programming (DP) are other methods that have been utilized to solve nonlinear objective functions. New computers provide copious space for applying advanced computational methods for optimization problems. In fact, improvement in the optimization methods in complex problems is essential and might be possible with new methods. Evolutionary algorithms are the most recent advanced method in optimization. These algorithms utilize the same process to find the best solution for an objective function. However, they use different strategies to search for a solution space. For example, some algorithms imitate the social behavior of animals [13], while others might follow the laws of physics to find the best solution. These algorithms are classified into two groups: classic and new-generation algorithms [14]. Classic algorithms, such as the genetic algorithm, have been applied for many engineering problems. It should be noted that classic algorithms might provide proper answers to many problems. However, new generation algorithms, such as the bat algorithm (BA), have been developed to improve the efficiency of optimization [15].
Water quality modeling is another aspect that should be briefly reviewed. Many models have been developed in this regard. However, runoff modeling in agricultural lands needs a model that is able to simulate water quality at the river basin scale. The soil and water assessment tool (SWAT) is one of the most applicable and best-known models for simulating runoff and water pollutants on the river basin scale. This model has been used in many aspects of river basin management in recent studies. For instance, the SWAT was able to simulate the impacts of pesticides in a data-scarce river basin [16]. Moreover, nitrogen leaching was estimated using the SWAT because of winter cover crops [17]. The calibration of the outputs is one of the important steps in using SWAT in practical projects [18]. The SWAT can simulate runoff and water pollutants continuously, which indicates its advantages in agricultural planning. A recent study highlighted the importance of continuous hydrologic simulation in river basin management [19]. Moreover, the SWAT can be used to explore the impact of land change dynamics as well as the impacts of climate change on water quality [20].
We describe the research gap that motivated this study. The optimization of cropping patterns has been described in many previous studies, as cited in the previous paragraphs. However, the previous studies have only considered economic benefits and water consumption in cropping pattern optimization. The cropping pattern is effective at addressing environmental challenges such as increasing the nitrate concentration in the natural drainage network or the river network of the catchments. Thus, the cropping pattern must be optimized considering environmental purposes. Hence, this study was carried out to design a new cropping pattern that minimizes the nitrate contaminants running off to river networks through agricultural drainage.
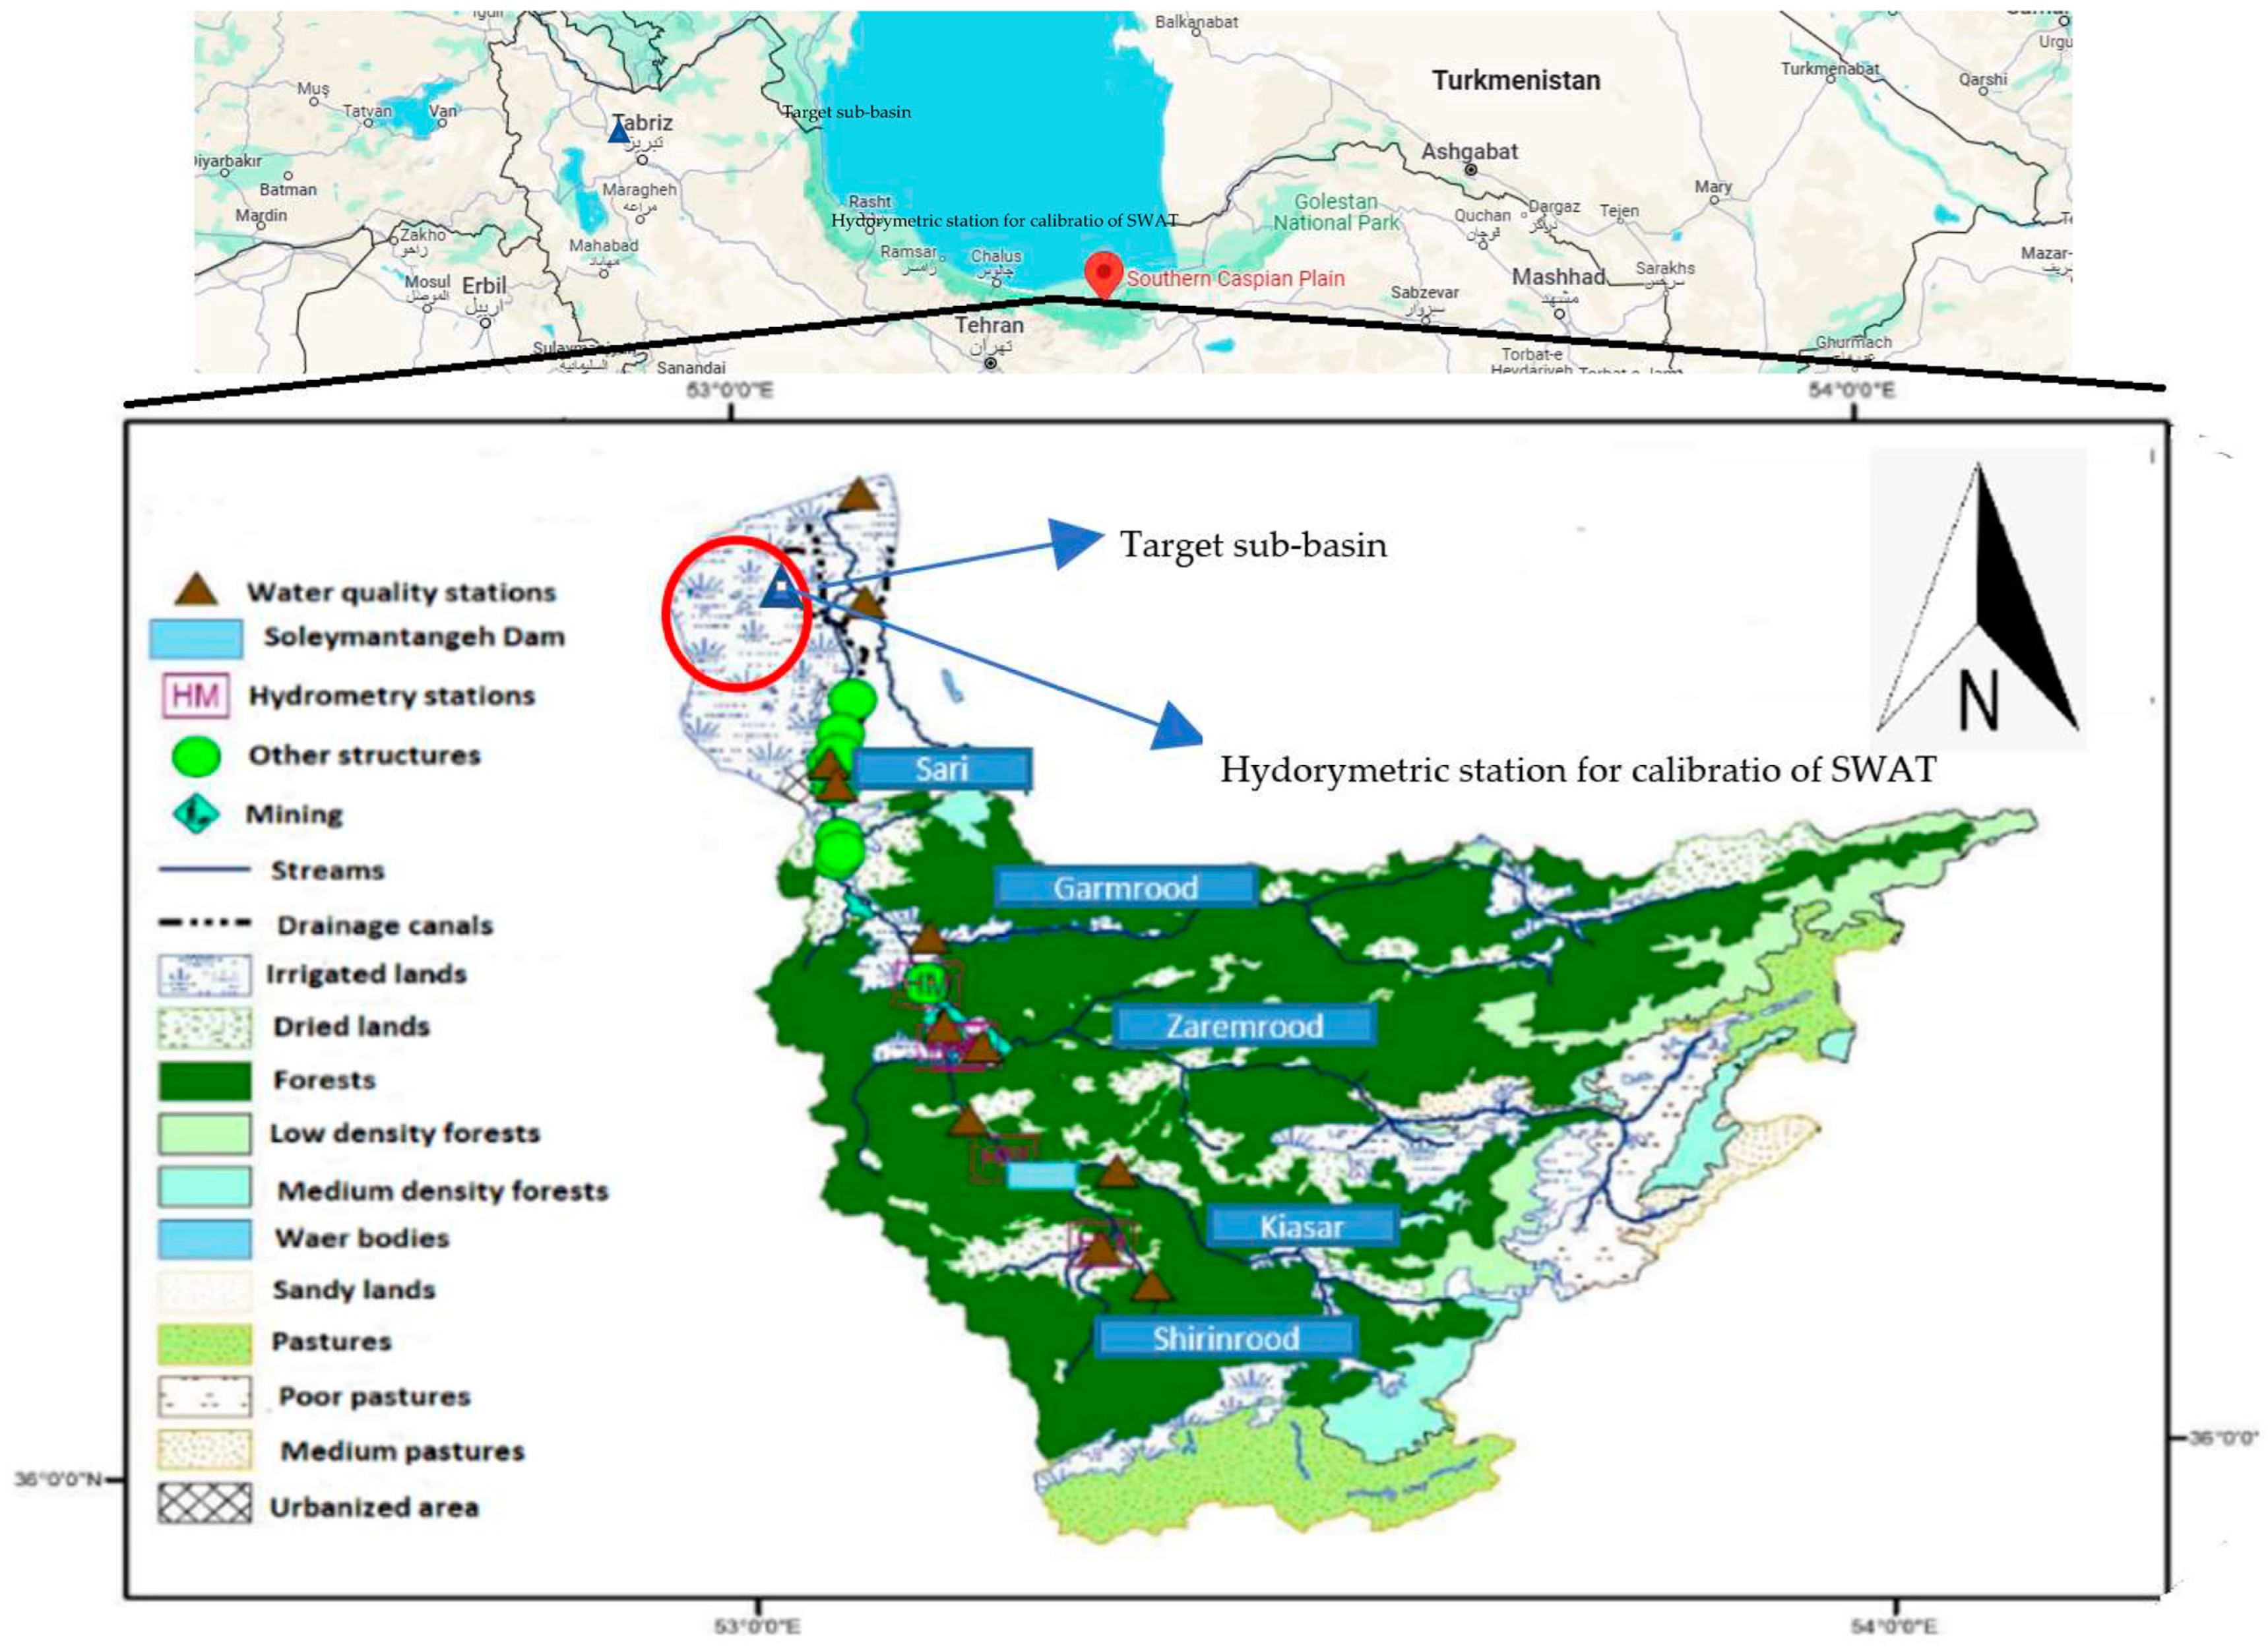
Based on the above research gap, the objective of this study was to develop and evaluate a novel framework to optimize the cultivation pattern on the catchment scale that mitigates the environmental impacts of runoff from farms. The SWAT was utilized as a water quality model on the catchment scale. Then, the outputs of this model were coupled with an optimization model that minimized the difference between the defined threshold of the water quality parameters and the actual concentration in a simulated period. We selected nitrate as one of the most important pollutants in river ecosystems. High nitrate concentrations might dramatically harm aquatic environments. Initial ecological studies indicated that higher nitrate concentrations can reduce the population of fish species in a case study. Thus, it was selected as a critical water quality parameters in the study area for optimizing the cropping pattern. The main source of the increased nitrate concentration was the agricultural drainage in the study area according to the initial measurements of the nitrate concertation downstream of the agricultural land. Thus, controlling nitrate concentration is a critical task for managing the river habitats in the case study. This study opens new windows to optimize cropping patterns, which is necessary for the sustainable development of agriculture and mitigating its environmental impacts.

2. Application and Methodology

2.1. Study Area and Problem Definition

The southern Caspian Sea basin is located in the Middle East, north of Iran, where several rivers provide the habitat of many native fish species such as trout. The Tajan Riveris one of the most important rivers in this basin, which originates from the upstream mountains in the province of Mazandaran. The increasing amounts of pollutants draining off extensive cultivated areas to rivers pose a serious threat to aquatic habitats. In fact, the increases in water pollutants such as nitrate might jeopardize the survival of aquatic species. When the nitrate concentration is above the maximum threshold, it prevents the vital biological activities such as reproduction. Thus, environmentalists are concerned regarding the increasing the nitrate concentration, particularly in the downstream areas of the catchment.
Figure 1 displays the land use and river network map of the Tajan River basin. As displayed, most of the cultivated land is located downstream of the river. We selected one of the sub-basins in this downstream area as the target sub-basin in the present study. The total area of this sub-basin was approximately 3000 Ha. The downstream river area in this catchment is an important habitat for the fishes, as this is mainly where they reproduce. There is an ongoing conflict between the Department of the Environment and the Department of Agriculture regarding the management of this catchment, which has a total cultivated area of 2010 Ha. On the one hand, the Department of Agriculture would like the cultivation pattern in this area to be appropriate, based on agricultural considerations. On the other hand, the Department of he Environment would like to protect the valuable river habitat in terms of the water quality parameters. Here, nitrate is one of the important pollutants. It should be noted that four main crops, including four varieties of rice and wheat, were considered in this study to optimize the cropping pattern considering nitrate contamination. One year was selected as the simulation period in the case study to analyze various cropping patterns. These crops were cultivated in some sub-basins, providing possibility of calibrating and validating the model for each crop. The available data for the most recent 14 years, including recorded river flow and nitrate concentration at the downstream hydrometric station (shown in Figure 1), were used for calibration and validation of the model. Based on the general recommendations, 80% of the data were applied for the calibration process, and rest of the data were used to validate the model.

2.2. Water Quality Modeling Using SWAT

SWAT was applied to simulate the outflow regime and nitrate concentration time series in the simulation period. Two types of inputs were required in this model: raster files as well as text files. A soil map, land use map, and digital elevation model were inserted as the raster files in the model. The model carried out two main processes, including watershed discretization and hydrological response units (HRUs) definitions, before the simulation. Calibration and validation of the outflow and nitrate load are key processes after the initial simulation using the model. Manual calibration and validation might be an arduous task for engineers. Hence, SWAT-CUP was developed as a standalone program to calibrate and validate the outputs of SWATs. This program calibrates the outputs using numerous iterations and tuning some hydrological parameters such as the curve number. Figure 2 displays the slope map generated by the SWAT for the Tajan River basin as one of the required inputs for the simulation. It should be highlighted that we simulated the whole basin because of some technical considerations. For the accurate calibration and validation of the nitrate load for different crops, more simulated data were needed to increase the accuracy of the model. In this study, SWAT 2012 was used as an extension of ARCGIS to simulate river flow as well as nitrate load at the outlet of the selected downstream sub-basin. Moreover, SWAT-CUP 5.6.1.2 was applied in the calibration process in which the Sequential Uncertainty Fitting (SUFI2) algorithm was utilized to find the optimal calibration parameters. We selected four calibration parameters, i.e., CN2.mgt (initial SCS runoff curve number for moisture condition II), ALPHA_BF.gw (alpha factor for groundwater recession curve of the deep aquifer (1/days)), GW_DELAY.gw (ground water delay time), and GWQMN.gw (threshold depth of water in a shallow aquifer required for return flow to occur (mm H2O)) in SWAT-CUP to calibrate the model. As the focus of this study was cropping pattern optimization, additional analyses such ash sensitivity analysis of the SWAT outputs were not carried out.
The final output of the SWAT was the generated nitrate concentration time series in the simulated period for each crop per hectare. The outputs of the SWAT were utilized in the optimized model as described in the next section. The Nash–Sutcliffe model efficiency coefficient (NSE), RMSE observations’ standard deviation ratio (RSR), and percent bias (PBIAS) were applied to measure the robustness of the performance in the validation period of the results as displayed in Equation (1) [21].
N S E = 1 t = 1 T ( O B S t S I M t ) 2 t = 1 T ( O B S t O B S m ) 2
R S R = t = 1 T ( O B S t S I M t ) 2 t = 1 T ( O B S t O B S m ) 2
P B I A S = 100 ( t = 1 T O B S t S I M t t = 1 T O B S t )
where OBSt is the observed or recorded data, SIMt is the simulated data, and T is the total number of time steps. Finally, a regression relationship between river flow and nitrate concentration was generated based on the outputs of the SWAT, which was utilized in the structure for cropping pattern optimization. Table 1 shows the recommended thresholds of the above indices used in this study [21].

2.3. Cropping Pattern Optimization

Defining a correct objective function is the main requirement when developing a robust optimization model. Equation (4) displays the initial objective function, where FNC is the optimal nitrate concentration, and ONCt is the optimized nitrate concentration. T is the time horizon or total number of simulated months. The outputs of the SWAT were used to compute ONCt for each time step.
O F = t = 1 T ( F N C O N C t F N C t ) 2
Each optimization model might need some constraints. One required constraint in the proposed framework is the total cultivated area, which should be the same as the total available area in the catchment. We applied metaheuristic optimization in this study because of the robustness of this optimization algorithm. Thus, a solution was required to insert the constraint in the optimization algorithm; the penalty function method has been used for this in some previous studies [22]. Two penalty functions were required in the optimization model to increase the penalties of the system when the total cultivated area is more or less than the available area in the catchment, as displayed in Equations (5) and (6), where A is total area. C1 and C2 are constant coefficients that can be assessed based on the initial sensitivity analysis. Equation (7) displays final form of the objective function in the optimization model.
i f A t > A a v a i l a b l e P 1 = c 1 ( A t A a v a i l a b l e A a v a i l a b l e ) 2
i f A t < A a v a i l a b l e P 2 = c 2 A a v a i l a b l e A t A a v a i l a b l e 2
O F = t = 1 T ( F N C O N C t F N C t ) 2 + P 1 t + P 2 t
The vulnerability index was used to measure the performance of the system in terms of nitrate concentration and total cultivated area, as displayed in Equations (8) and (9).
i f O N C t > F N C V I = M A X t = 1 T a b s ( O N C t F N C F N C )
V I = M A X t = 1 T a b s ( A t A a v a i l a b l e A a v a i l a b l e )

2.4. Metaheuristic Optimization and Decision-Making System

We applied several algorithms to optimize the cultivation pattern in the present study. It should be noted that each algorithm might perform differently. Thus, it was essential to apply different algorithms in the optimization system. Different metaheuristic algorithms may consider similar steps to find the best solution for the optimization problem. However, they use different strategies for searching the solution space. We utilized six algorithms, including particle swarm optimization (PSO) [23], the shuffled frog-leaping algorithm (SFLA) [24], shuffled complex evolution (SCE) [25], the harmony search algorithm (HS) [26], invasive weed optimization (IWO) [27], and differential evolution (DE) [28], in the present study. We applied MATLAB 2019 developed by MathWorks as the platform for implementing these algorithms. In fact, we applied algorithms with different origins, including classic and new-generation algorithms and animal- and non-animal-inspired algorithms. Figure 3 displays a flow chart of PSO as an example. More details on these methodologies are provided in the cited references.
Using different algorithms made it necessary to apply a decision-making system to select the best algorithms based on the selection criteria [29]. Fuzzy technique for order of preference by similarity to ideal solution (FTOPSIS) is a robust decision-making system that has been broadly utilized in previous studies [30,31]. Figure 4 displays a flow chart of the method used to select the best candidate in the structure of a decision-making system. Figure 5 displays the hierarchical structure of this method in this study. Three levels are defined in this figure, including the goal of the system, selection criteria, and candidates or alternatives. More details are provided in Figure 5.

3. Results and Discussion

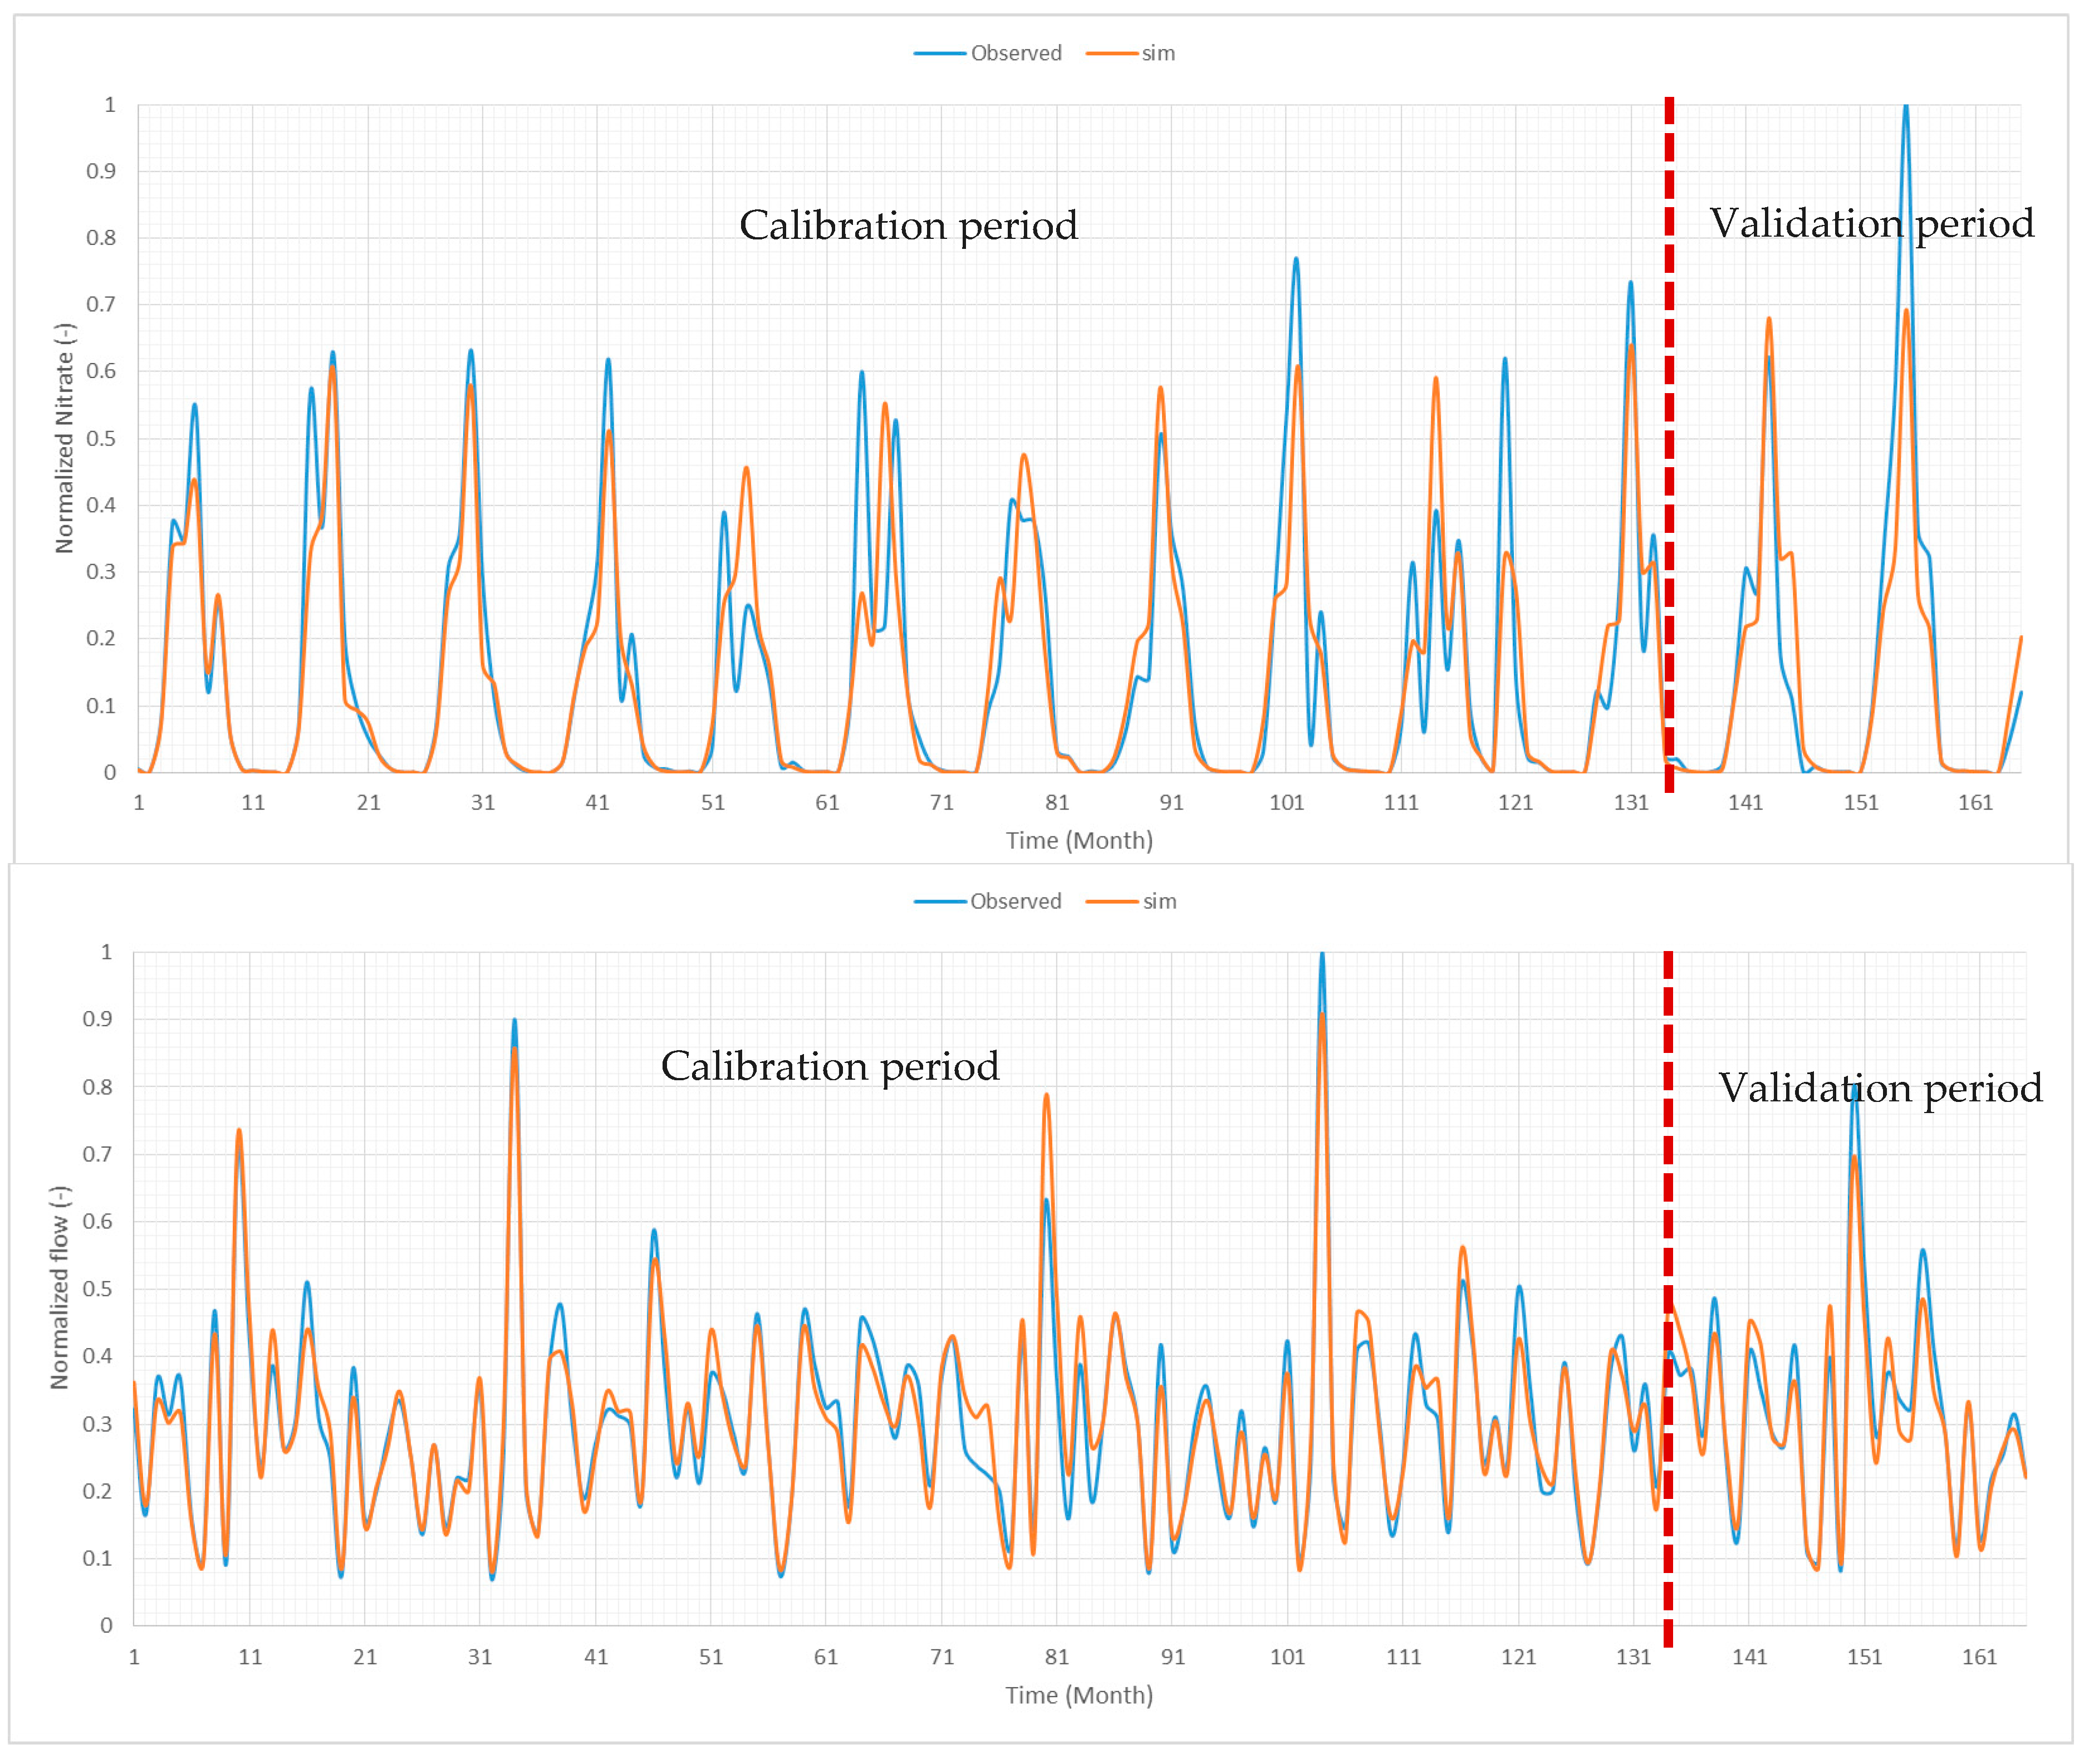
First, it is essential to present and discuss the calibration and validation of the SWAT we used to simulate the river flow as well as the nitrate load in the river basin. Figure 6 displays results of the calibration and validation of the outflow and nitrate concentration in the target downstream areas. According to Table 1 and Table 2, the model is reliable for further applications.
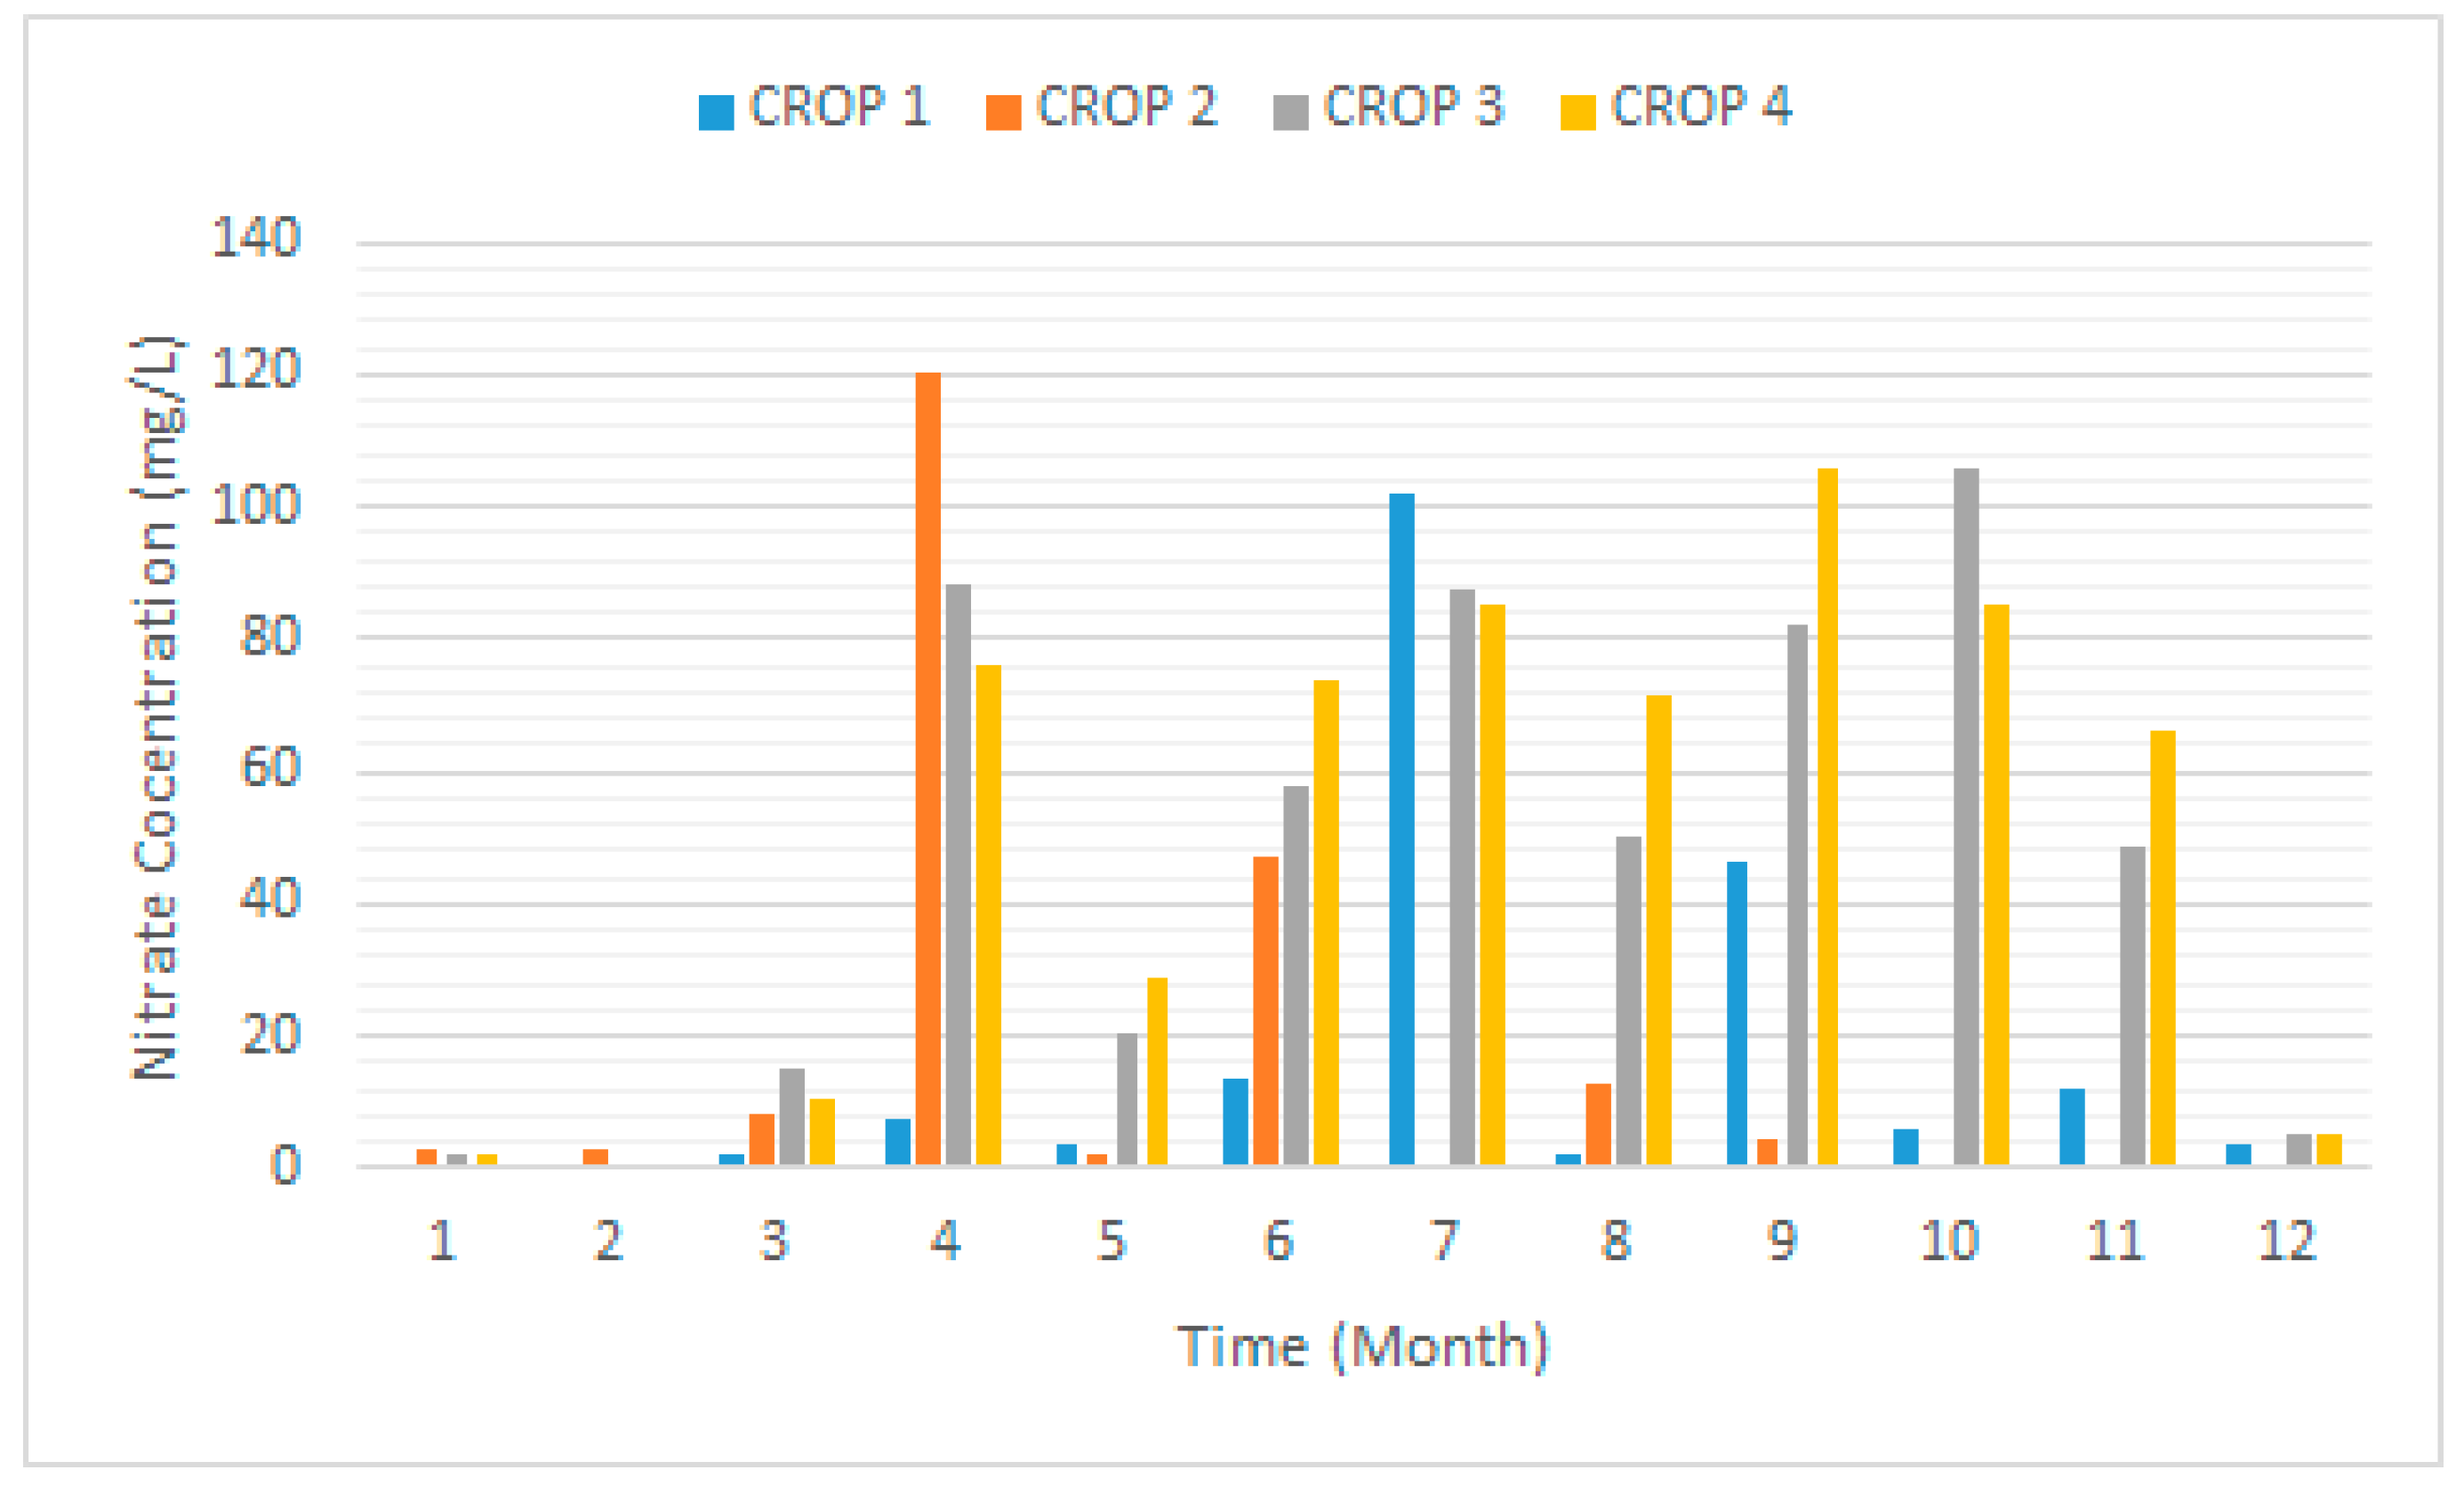
Figure 7 displays the nitrate concertation simulated using the validated model for different crops per hectare in the simulation period. Currently, all targeted agricultural areas in this study are rice fields, but we tried to optimize the area with combinations wheat and rice to minimize environmental impacts. Crops 1 to 4 are two varieties of wheat and two varieties of rice that have been recommended by the Department of Agriculture for the study area. We selected these crops for the optimization system. In fact, the farmers are familiar with the cultivation of these crops. Thus, the proposed optimal cultivation pattern might be useable in practice.
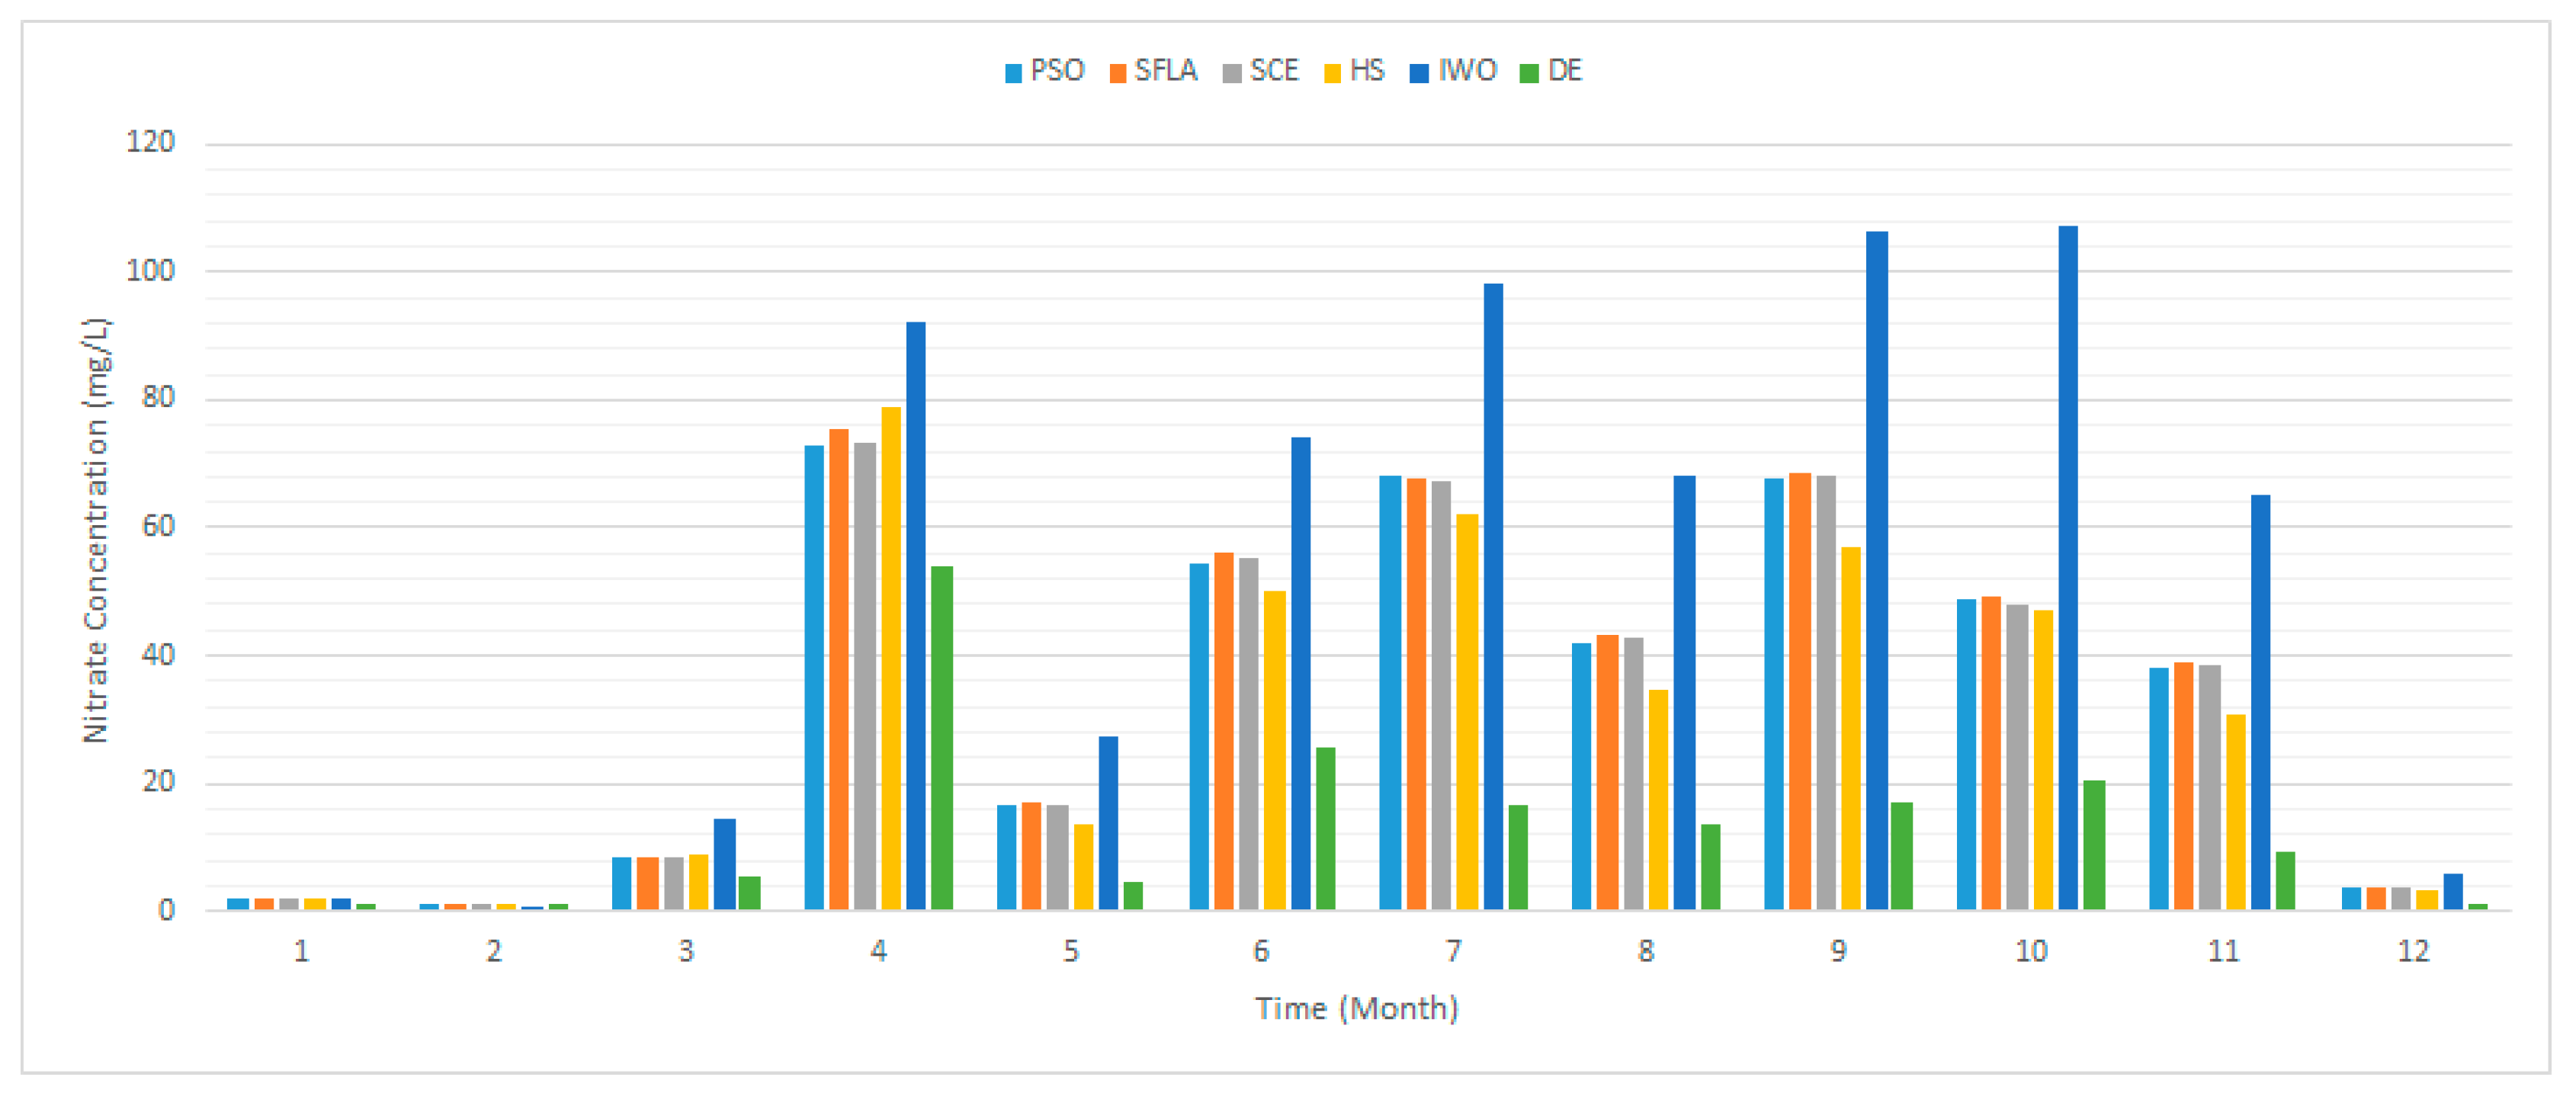
Figure 8 displays the optimal nitrate concentration as the output of the optimization model. It seems that the performance of the different algorithms differed regarding the mitigation of the impact of the nitrate concentration on the downstream aquatic habitats in the catchment. However, the performance of some algorithms, such as SFLA and SCE, was similar. The performance of IWO was not as robust as that of other algorithms. The optimum threshold in the optimization model was 50 mg/L, which provides a suitable habitat for aquatic species. This threshold was selected based on the expert opinions of regional ecologists who were familiar with the biological characteristics of the native fishes in the local habitats. Seemingly, IWO was not able to optimize the nitrate concentration in the simulated period. In fact, the optimal nitrate concentration produced by IWO was much higher than that produced by other algorithms. In fact, the performance of this algorithm was poor in terms of the optimization of the nitrate concentration. Conversely, DE was very robust in terms of optimizing the nitrate concentration. In fact, in most time steps, the nitrate concentration was very low, so DE produced crop pattern that creates the most suitable habitats for fishes. However, selecting the best optimization performance was not only based on the performance of the system in terms of nitrate concentration. Other factors should be considered in evaluation of the results of the optimization model. The optimization system should have robust performance in terms of agricultural considerations as well.
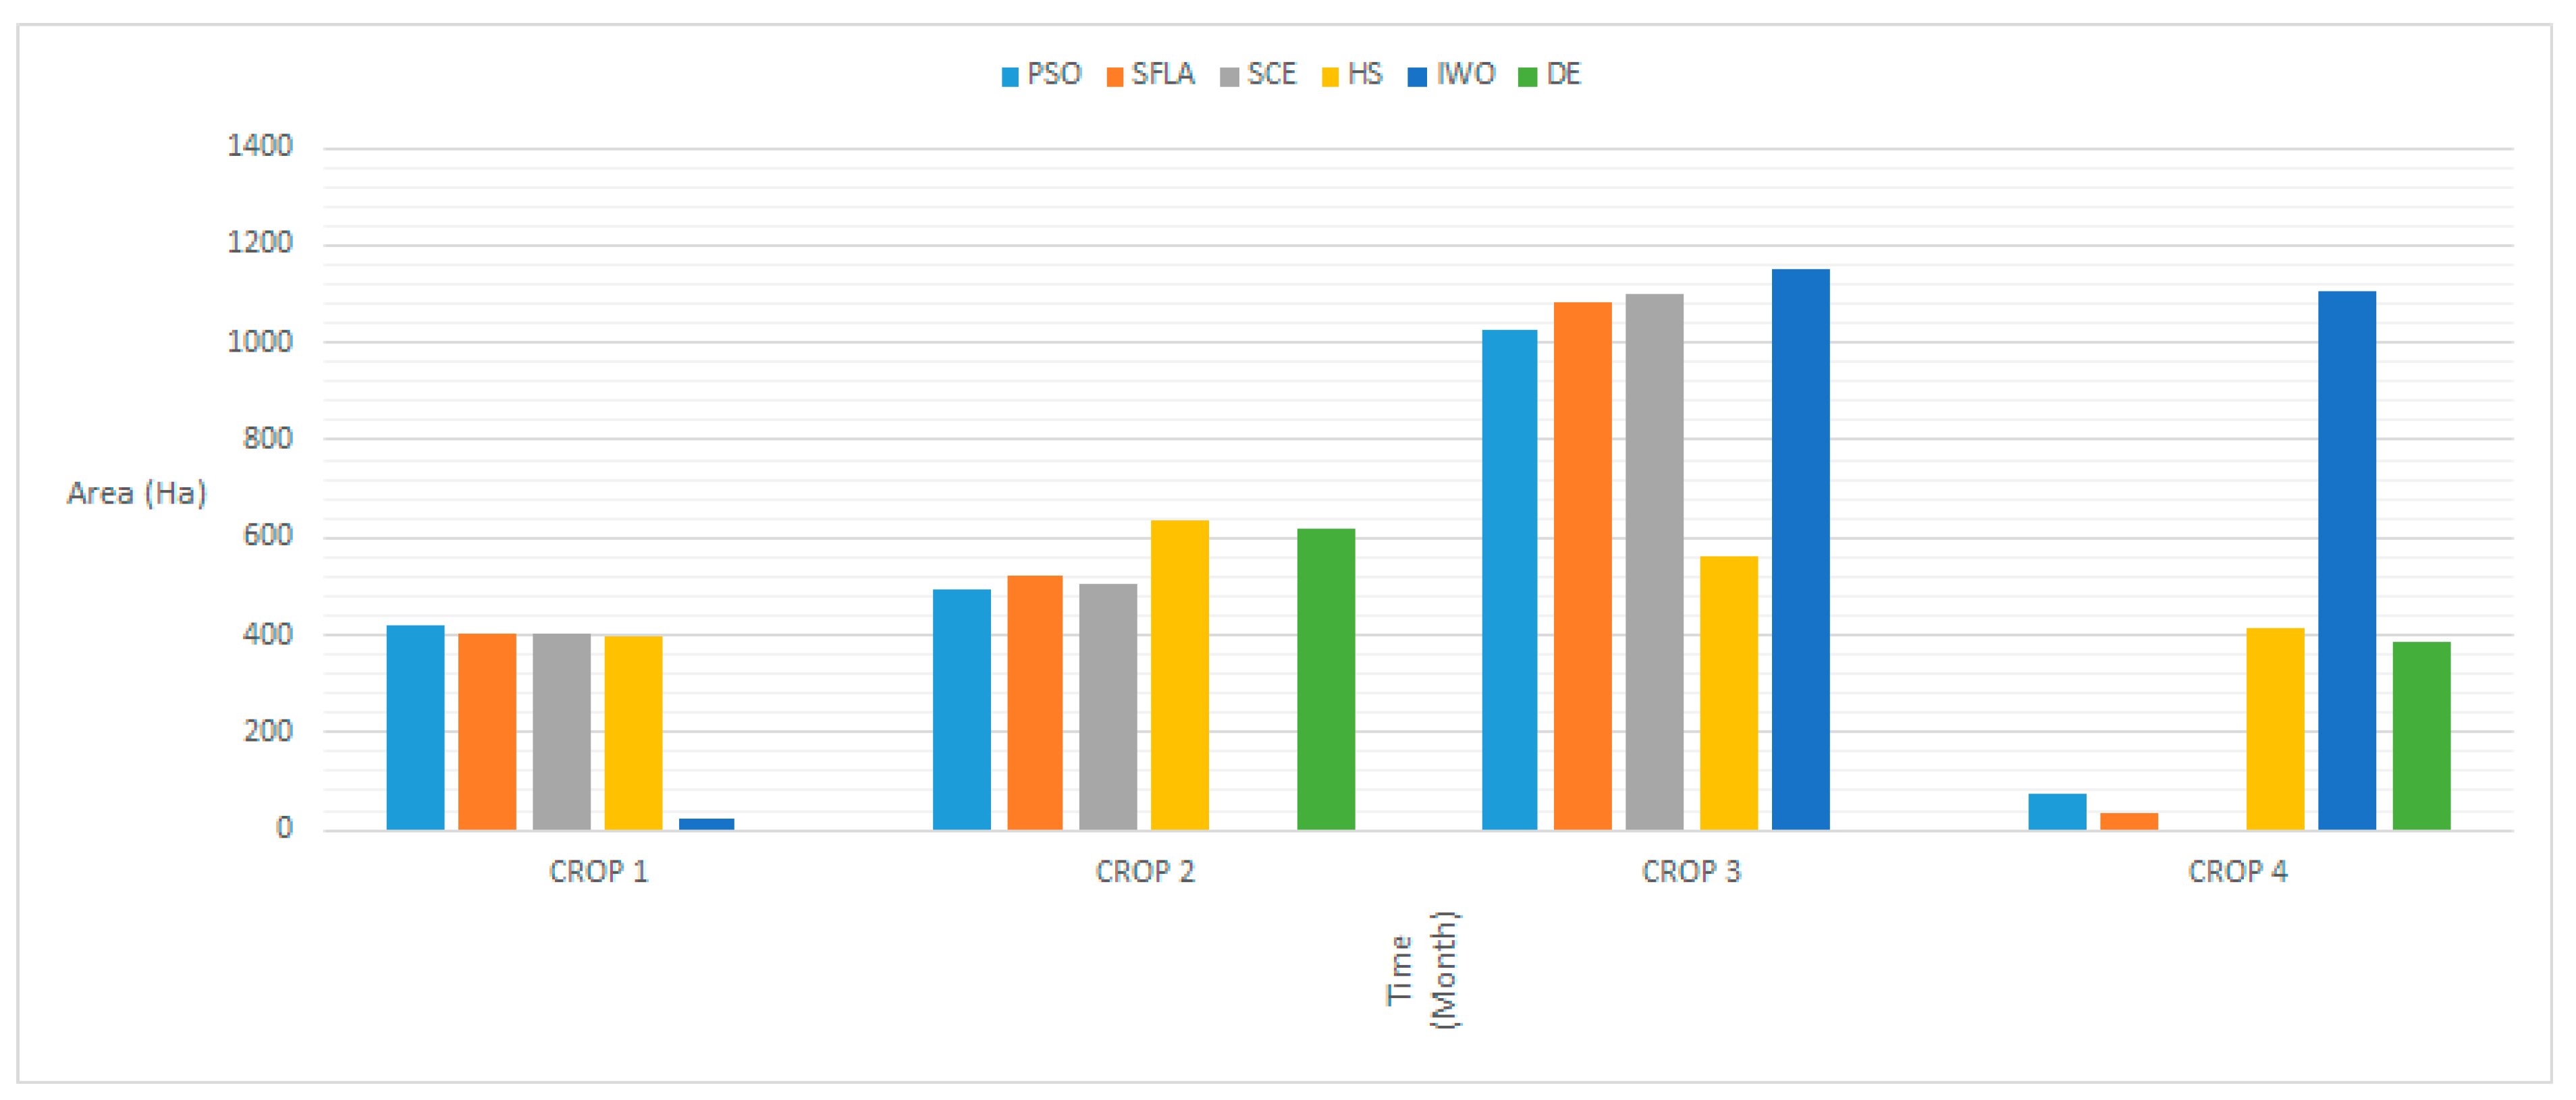
Figure 9 displays the optimal cultivation pattern proposed by the optimization model. The performance of the algorithms differed in terms of cultivated area for each crop as well. For example, IWO optimized the cultivation pattern by allocating more area to each crop. In contrast, DE allocated a very small area for some crops. Moreover, 
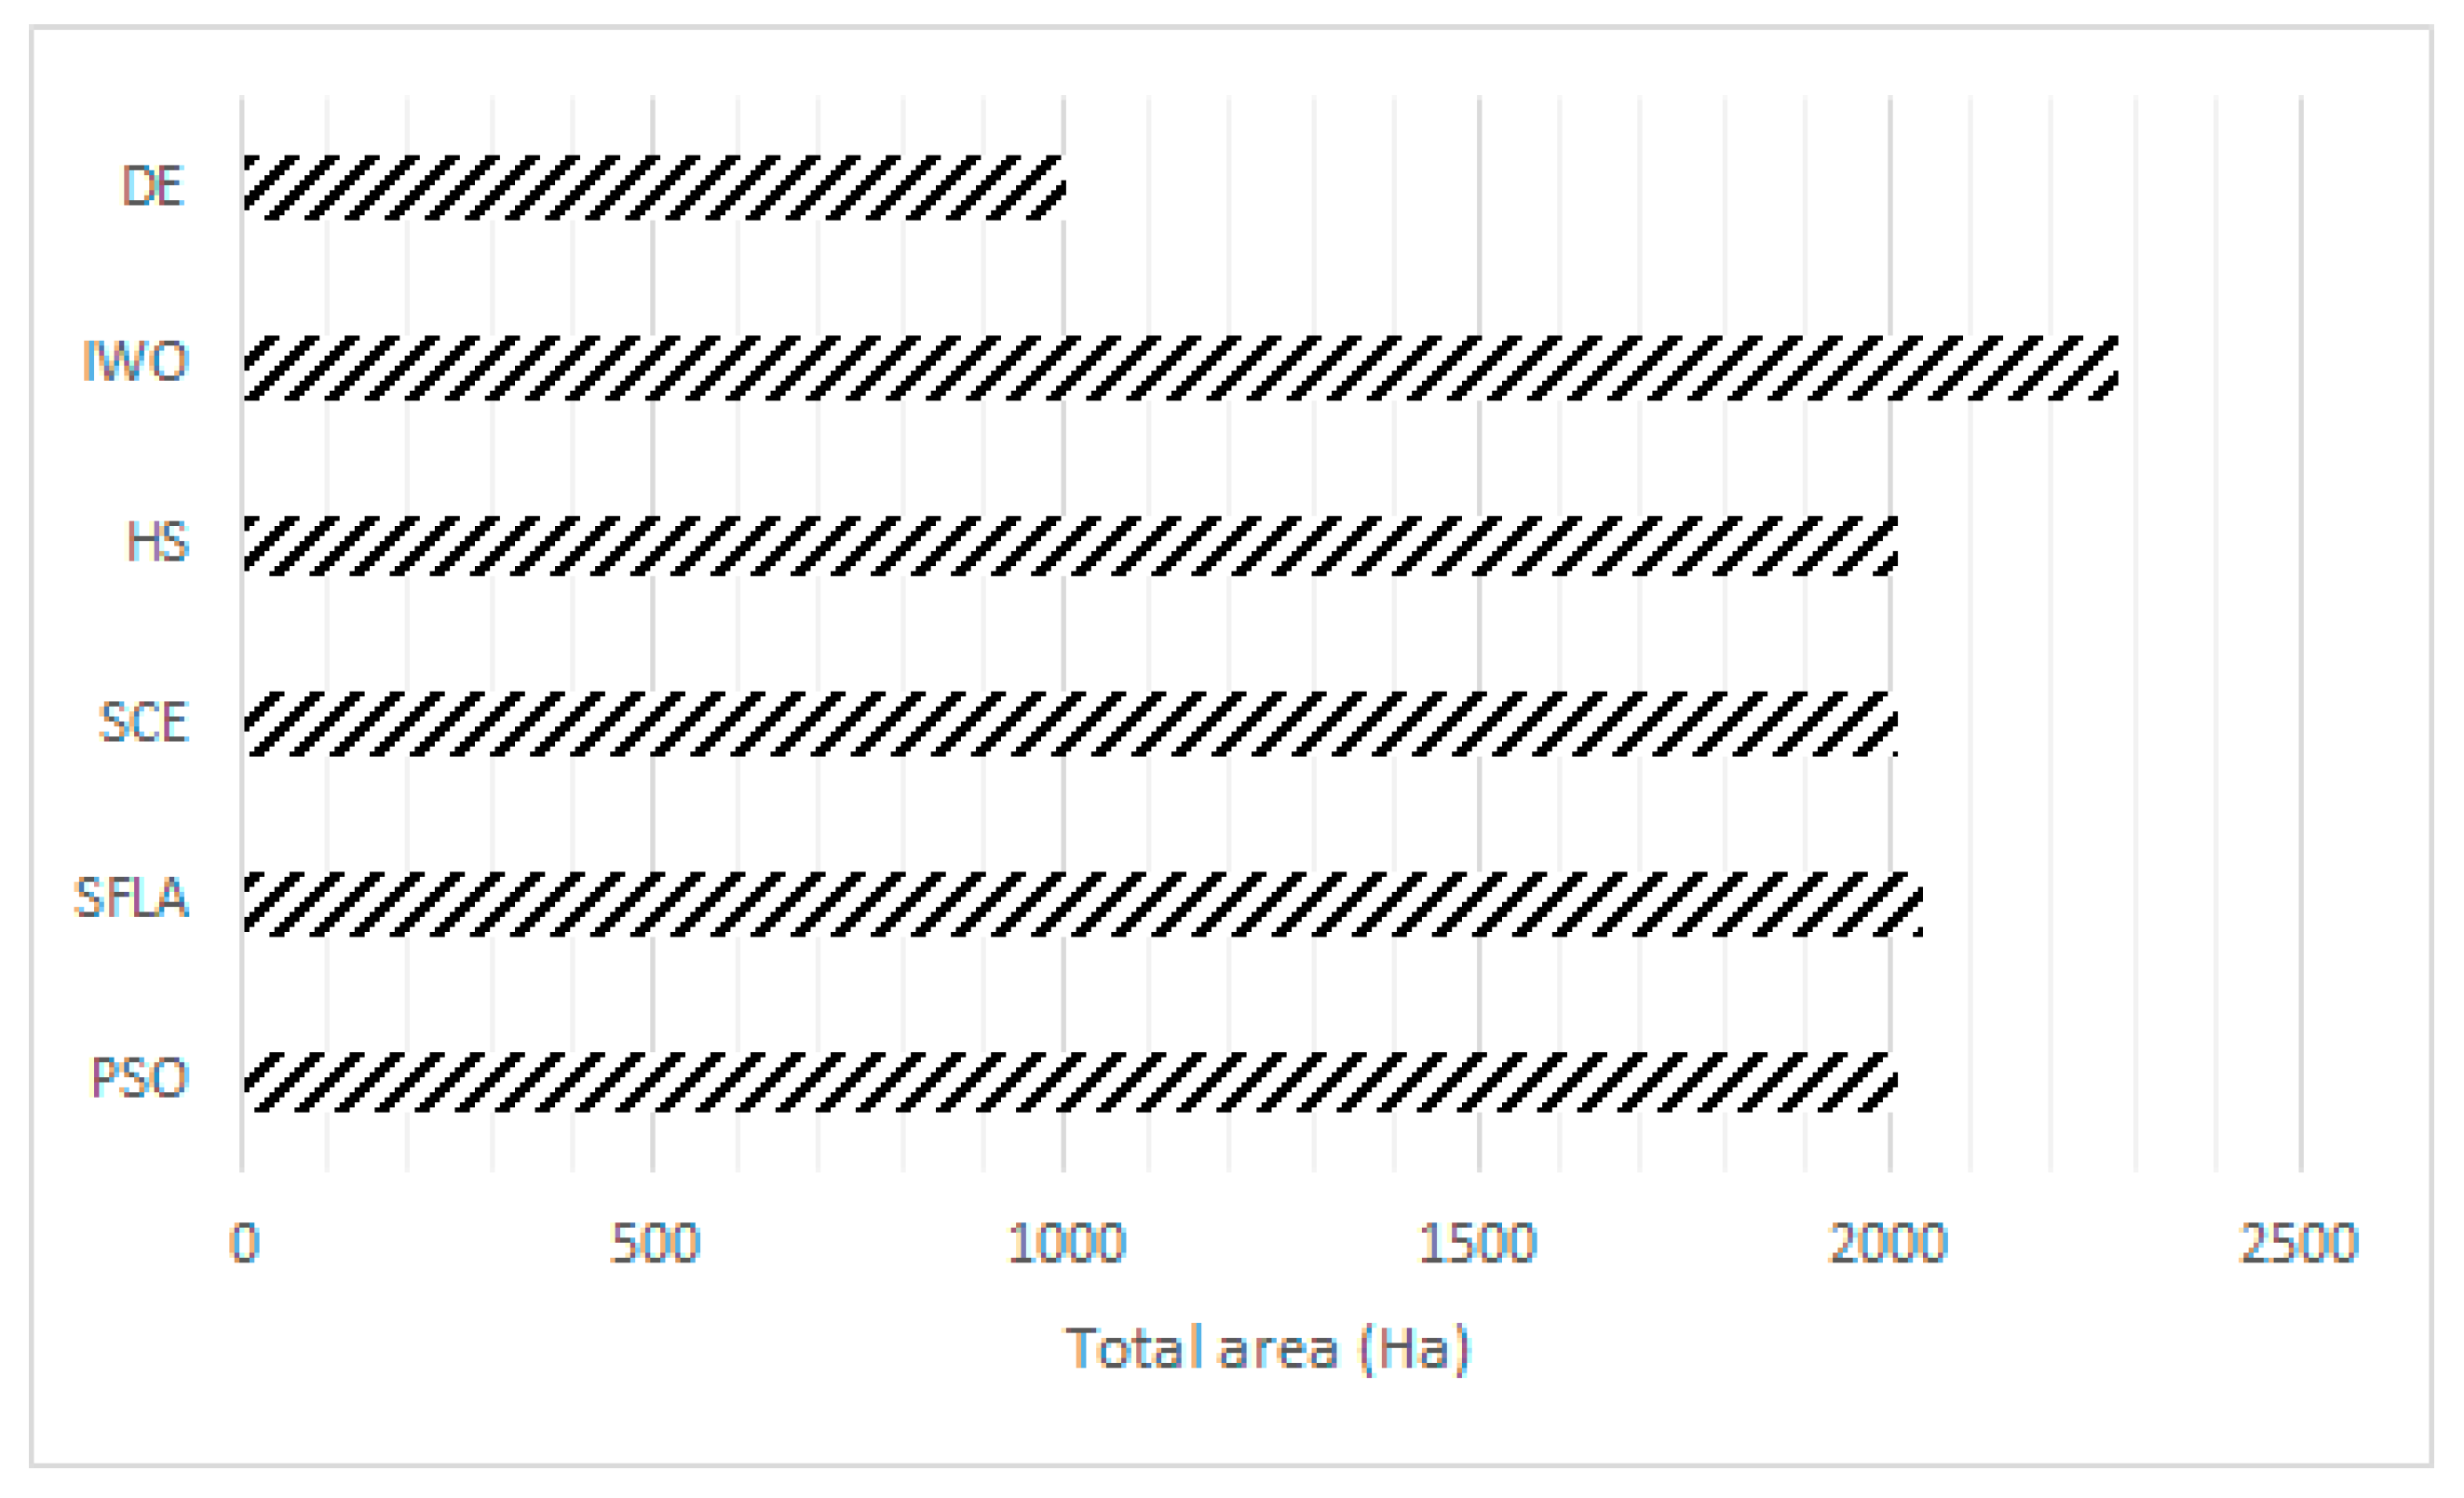
Figure 10 displays total area produced using the different algorithms. The total area produced using the IWO method is larger than that produced using the other algorithms. Conversely, the total area produced with DE is smaller than that produced with other algorithms. In fact, it seems that these two algorithms were not able to apply the penalty functions efficiently. Other algorithms predicted a total area close to 2010 Ha. However, slight differences were observed. 
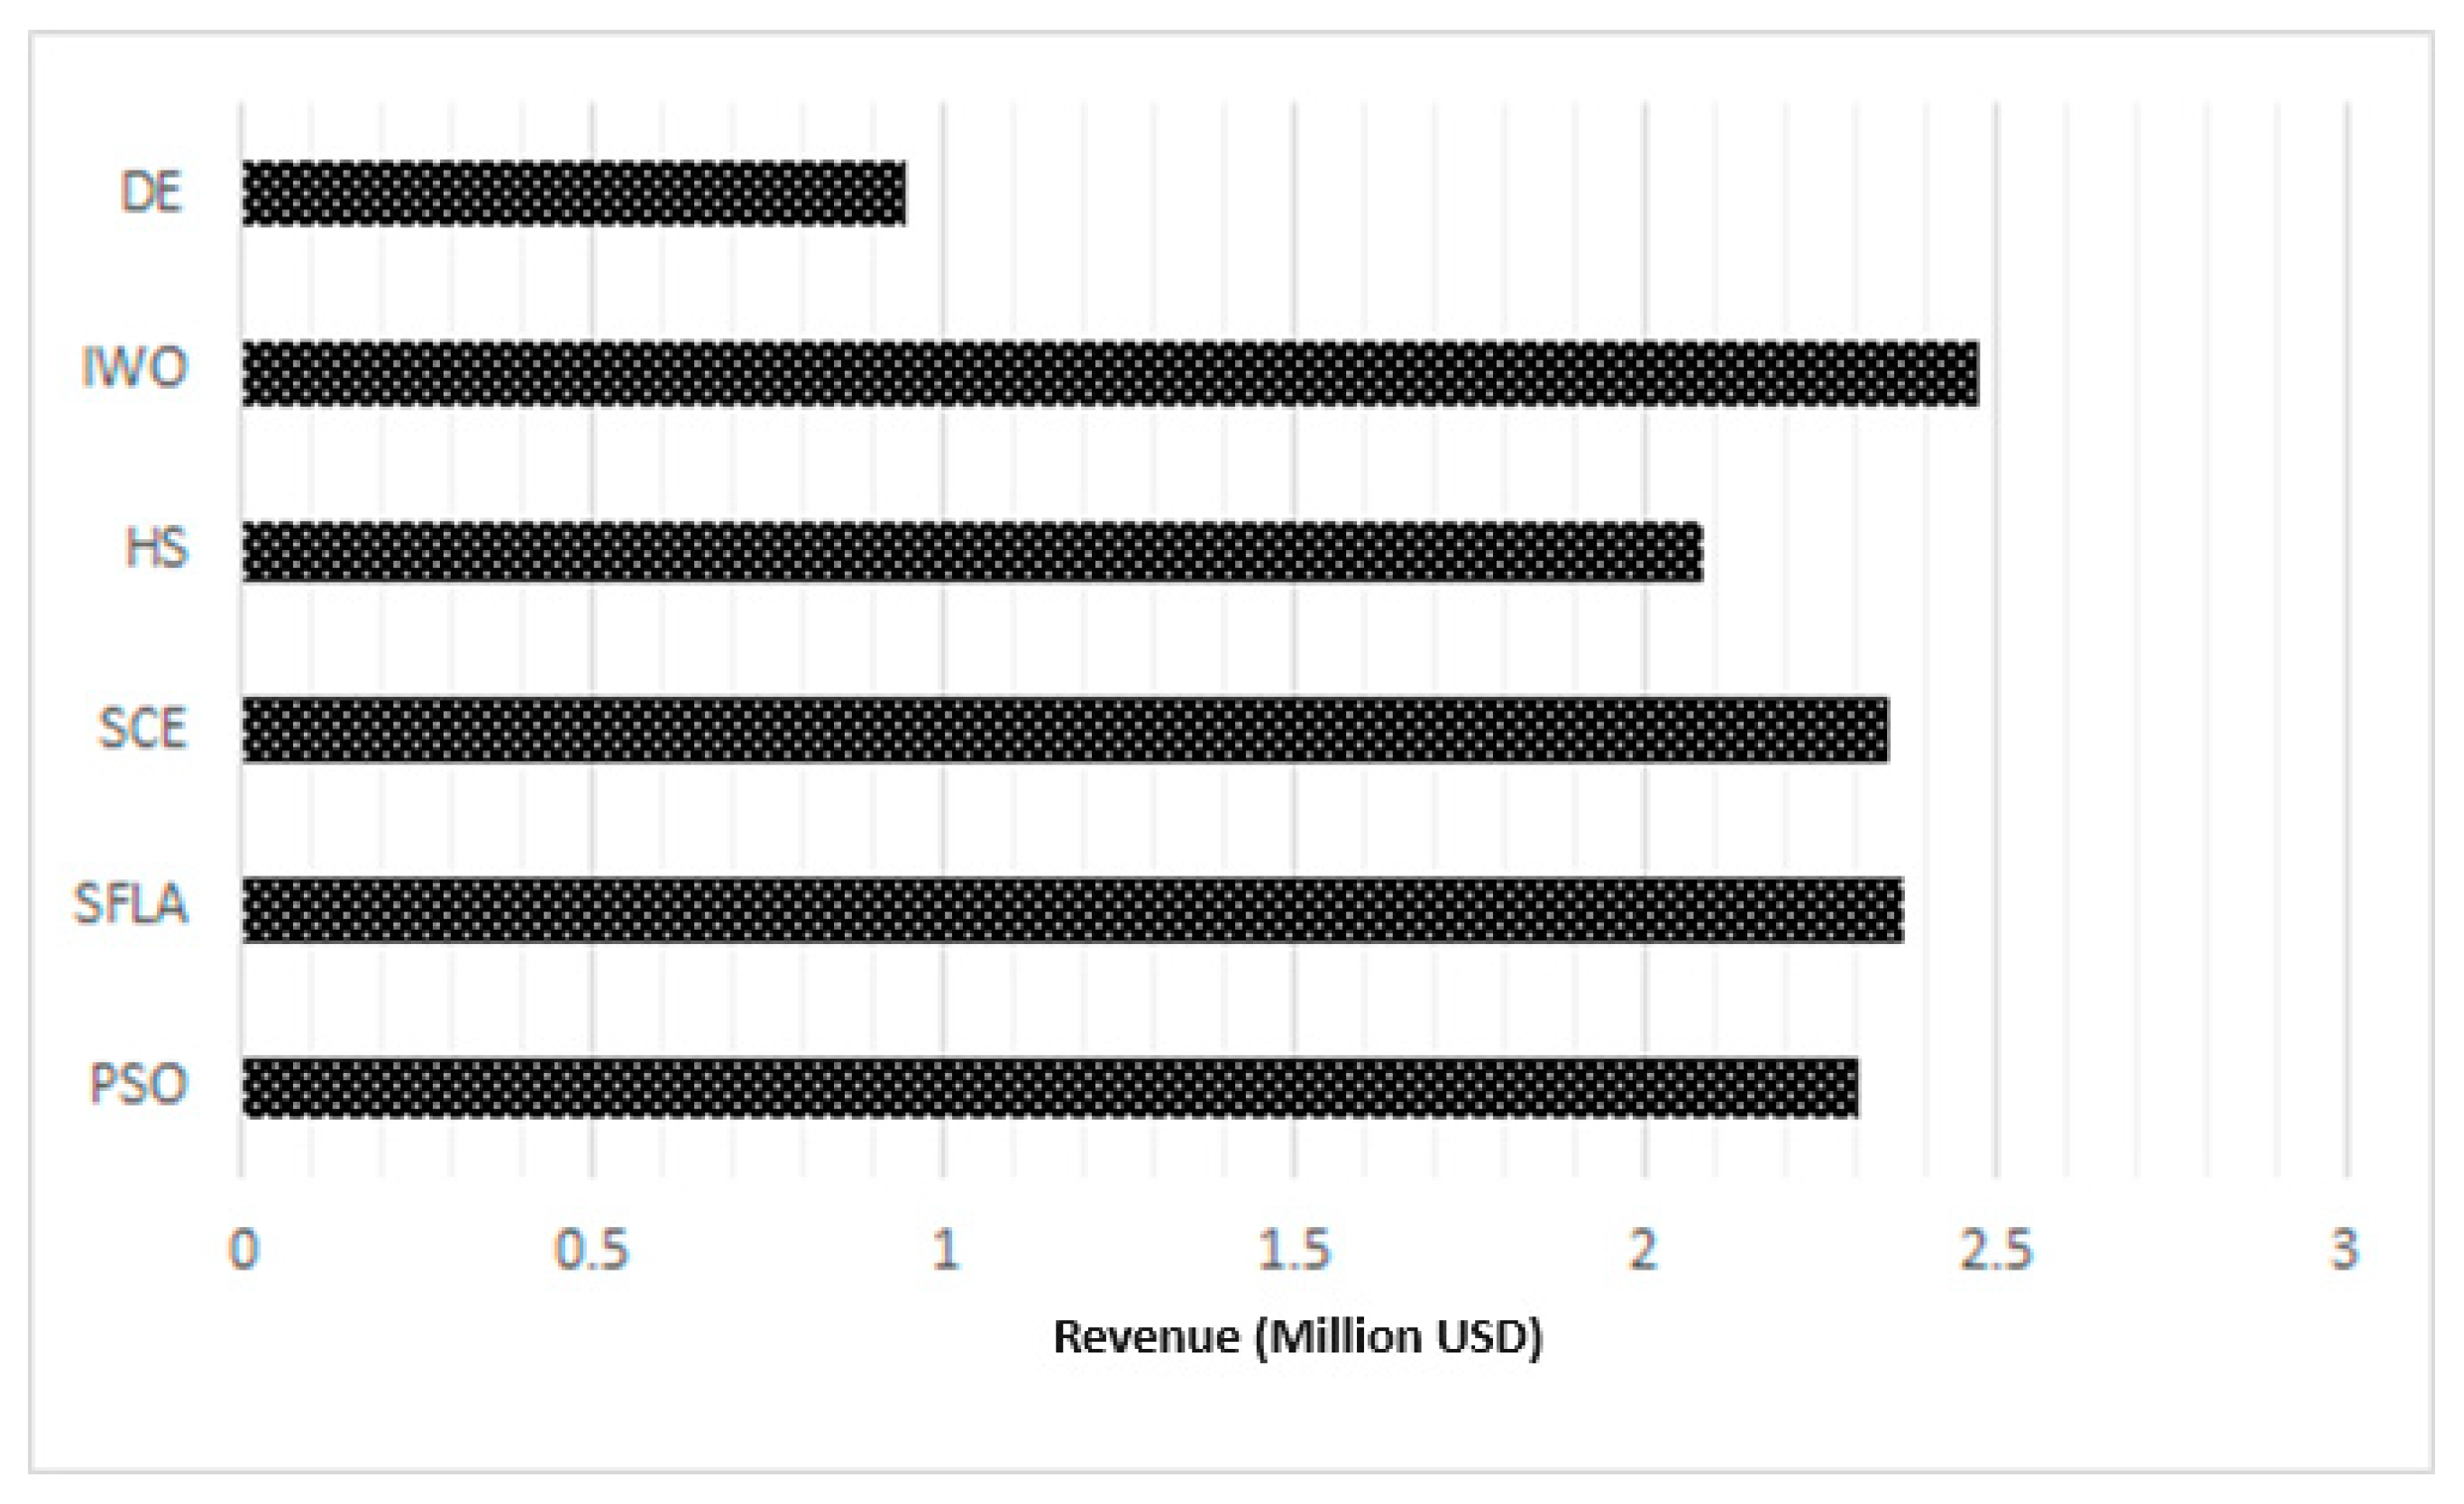
Figure 11 displays the total revenue for the proposed cultivation pattern for the different algorithm. The price of the crops and the yield of each crop were considered based on the recommendations of the Department of Agriculture. To analyze the results, a decision-making system was needed. In fact, each algorithm performed differently in terms of nitrate concentration, cultivation pattern, total area, and revenue.
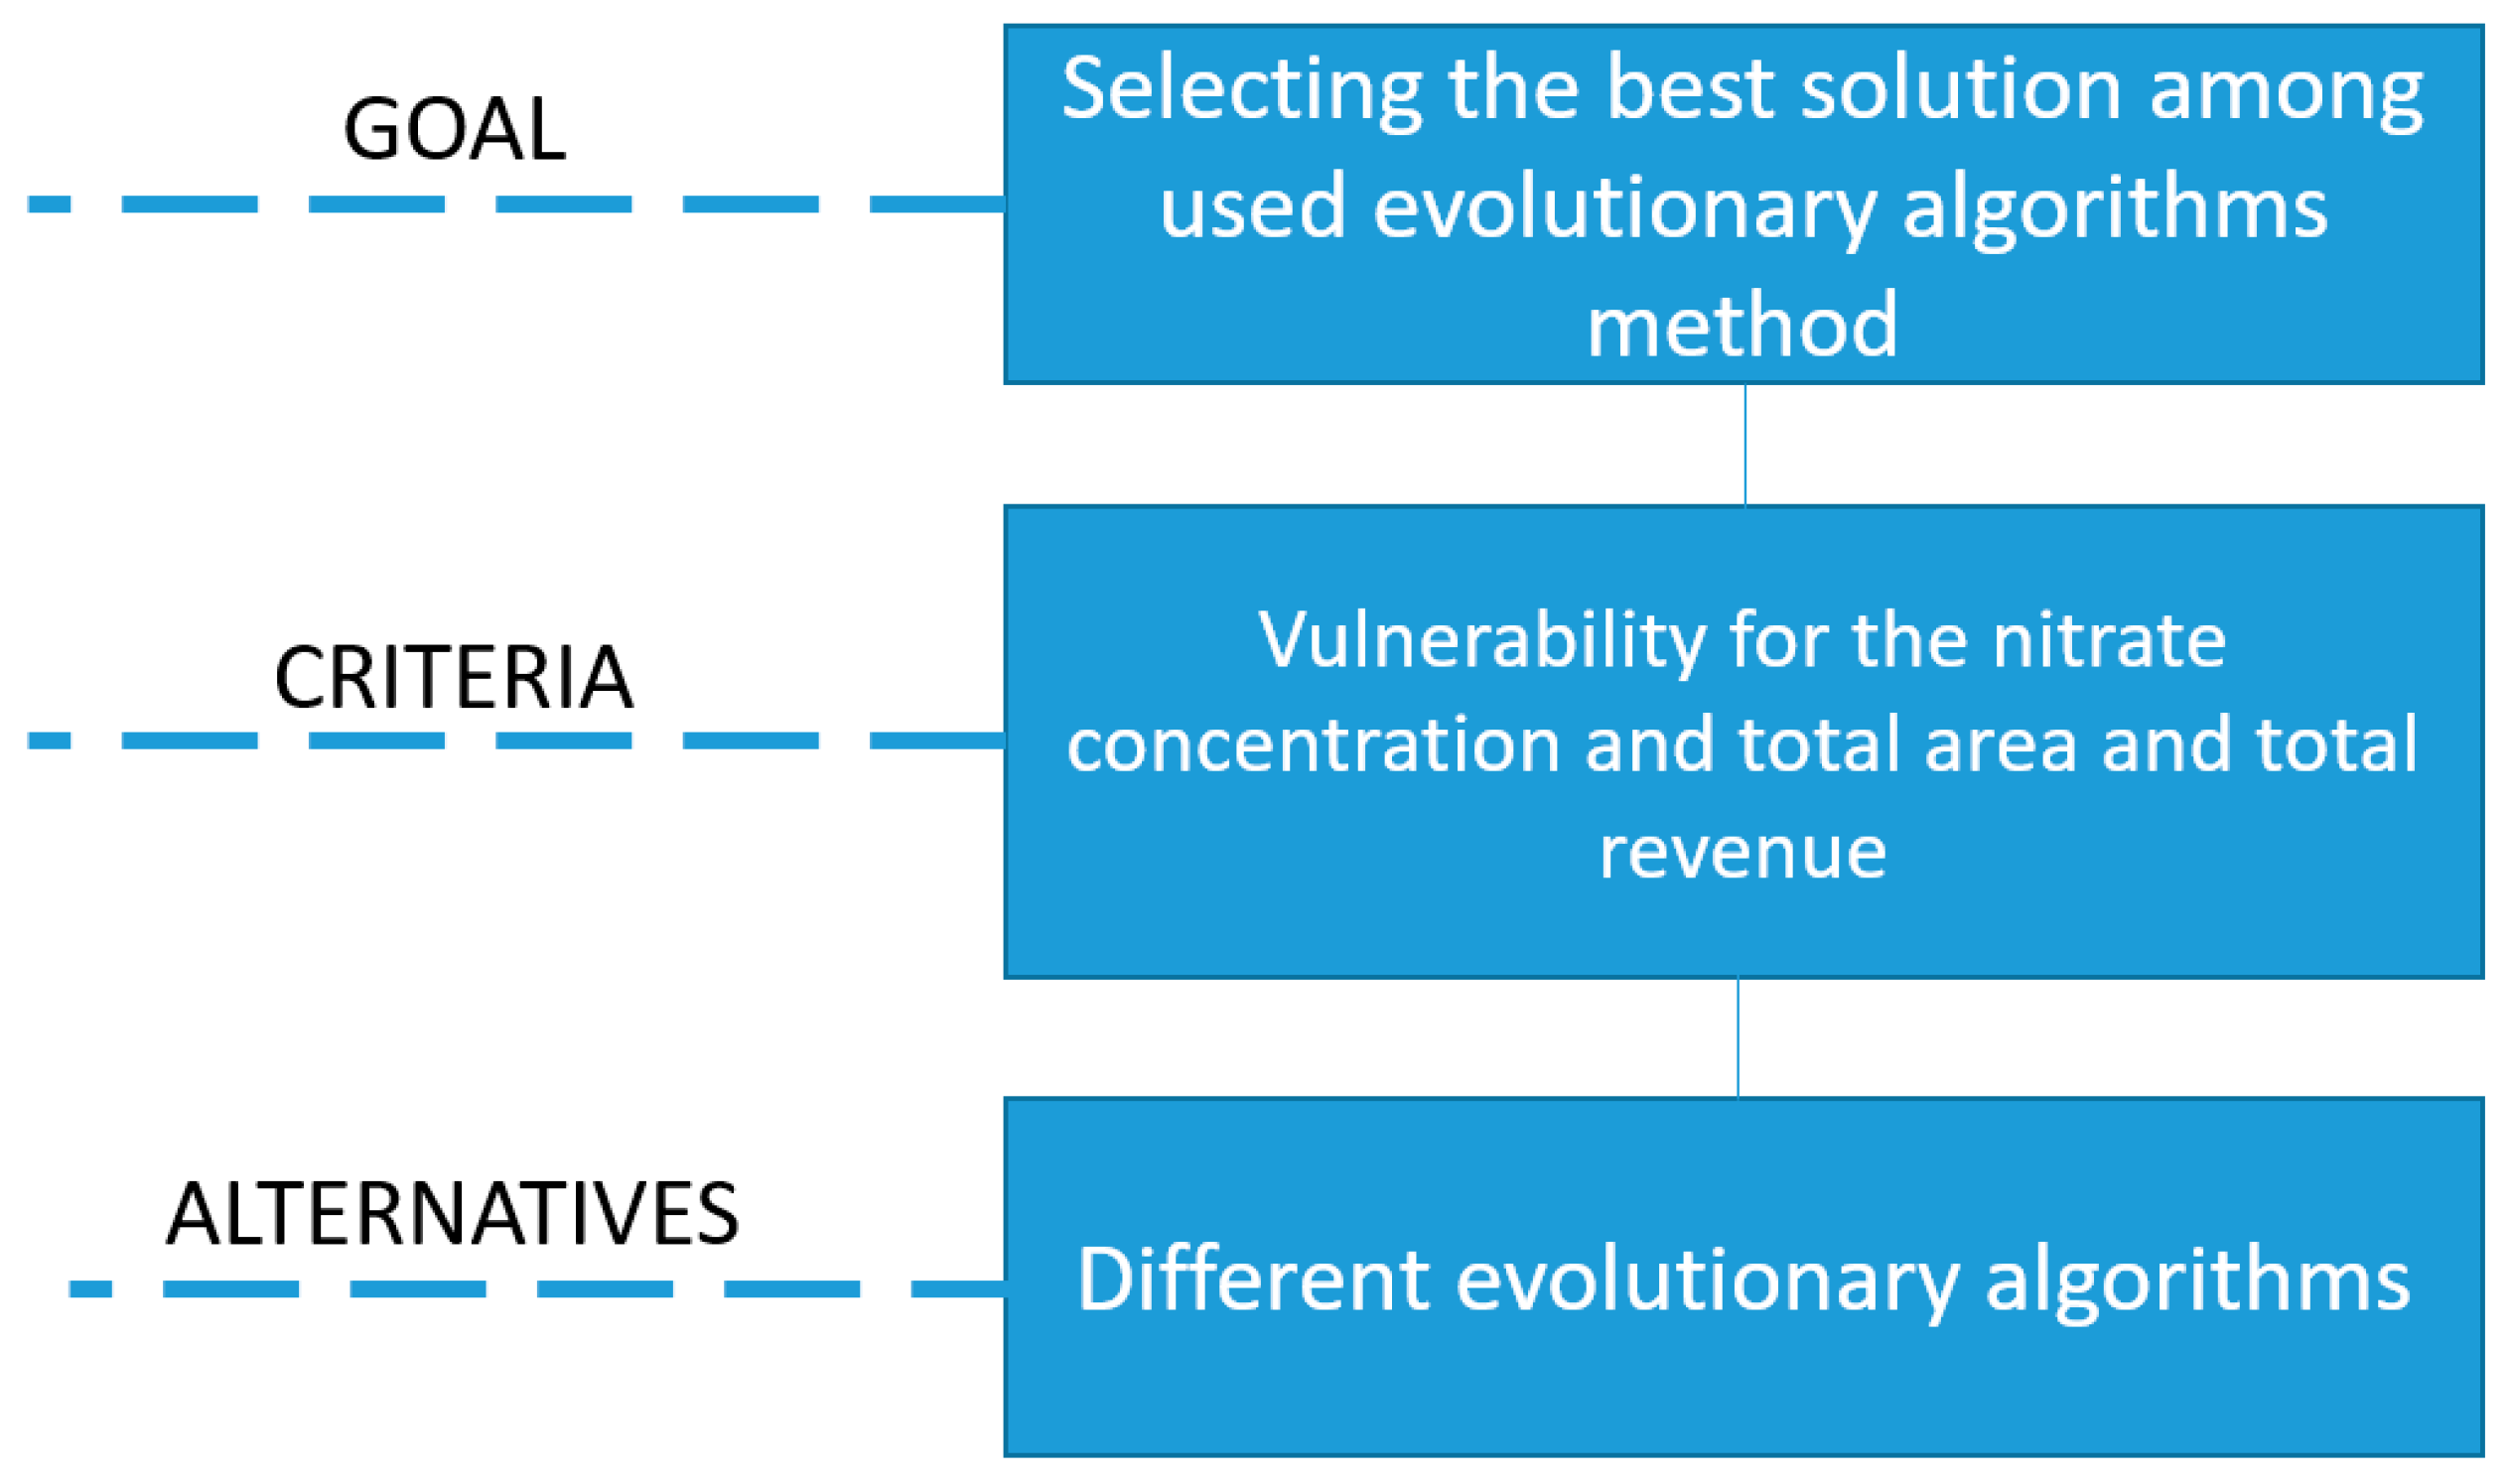
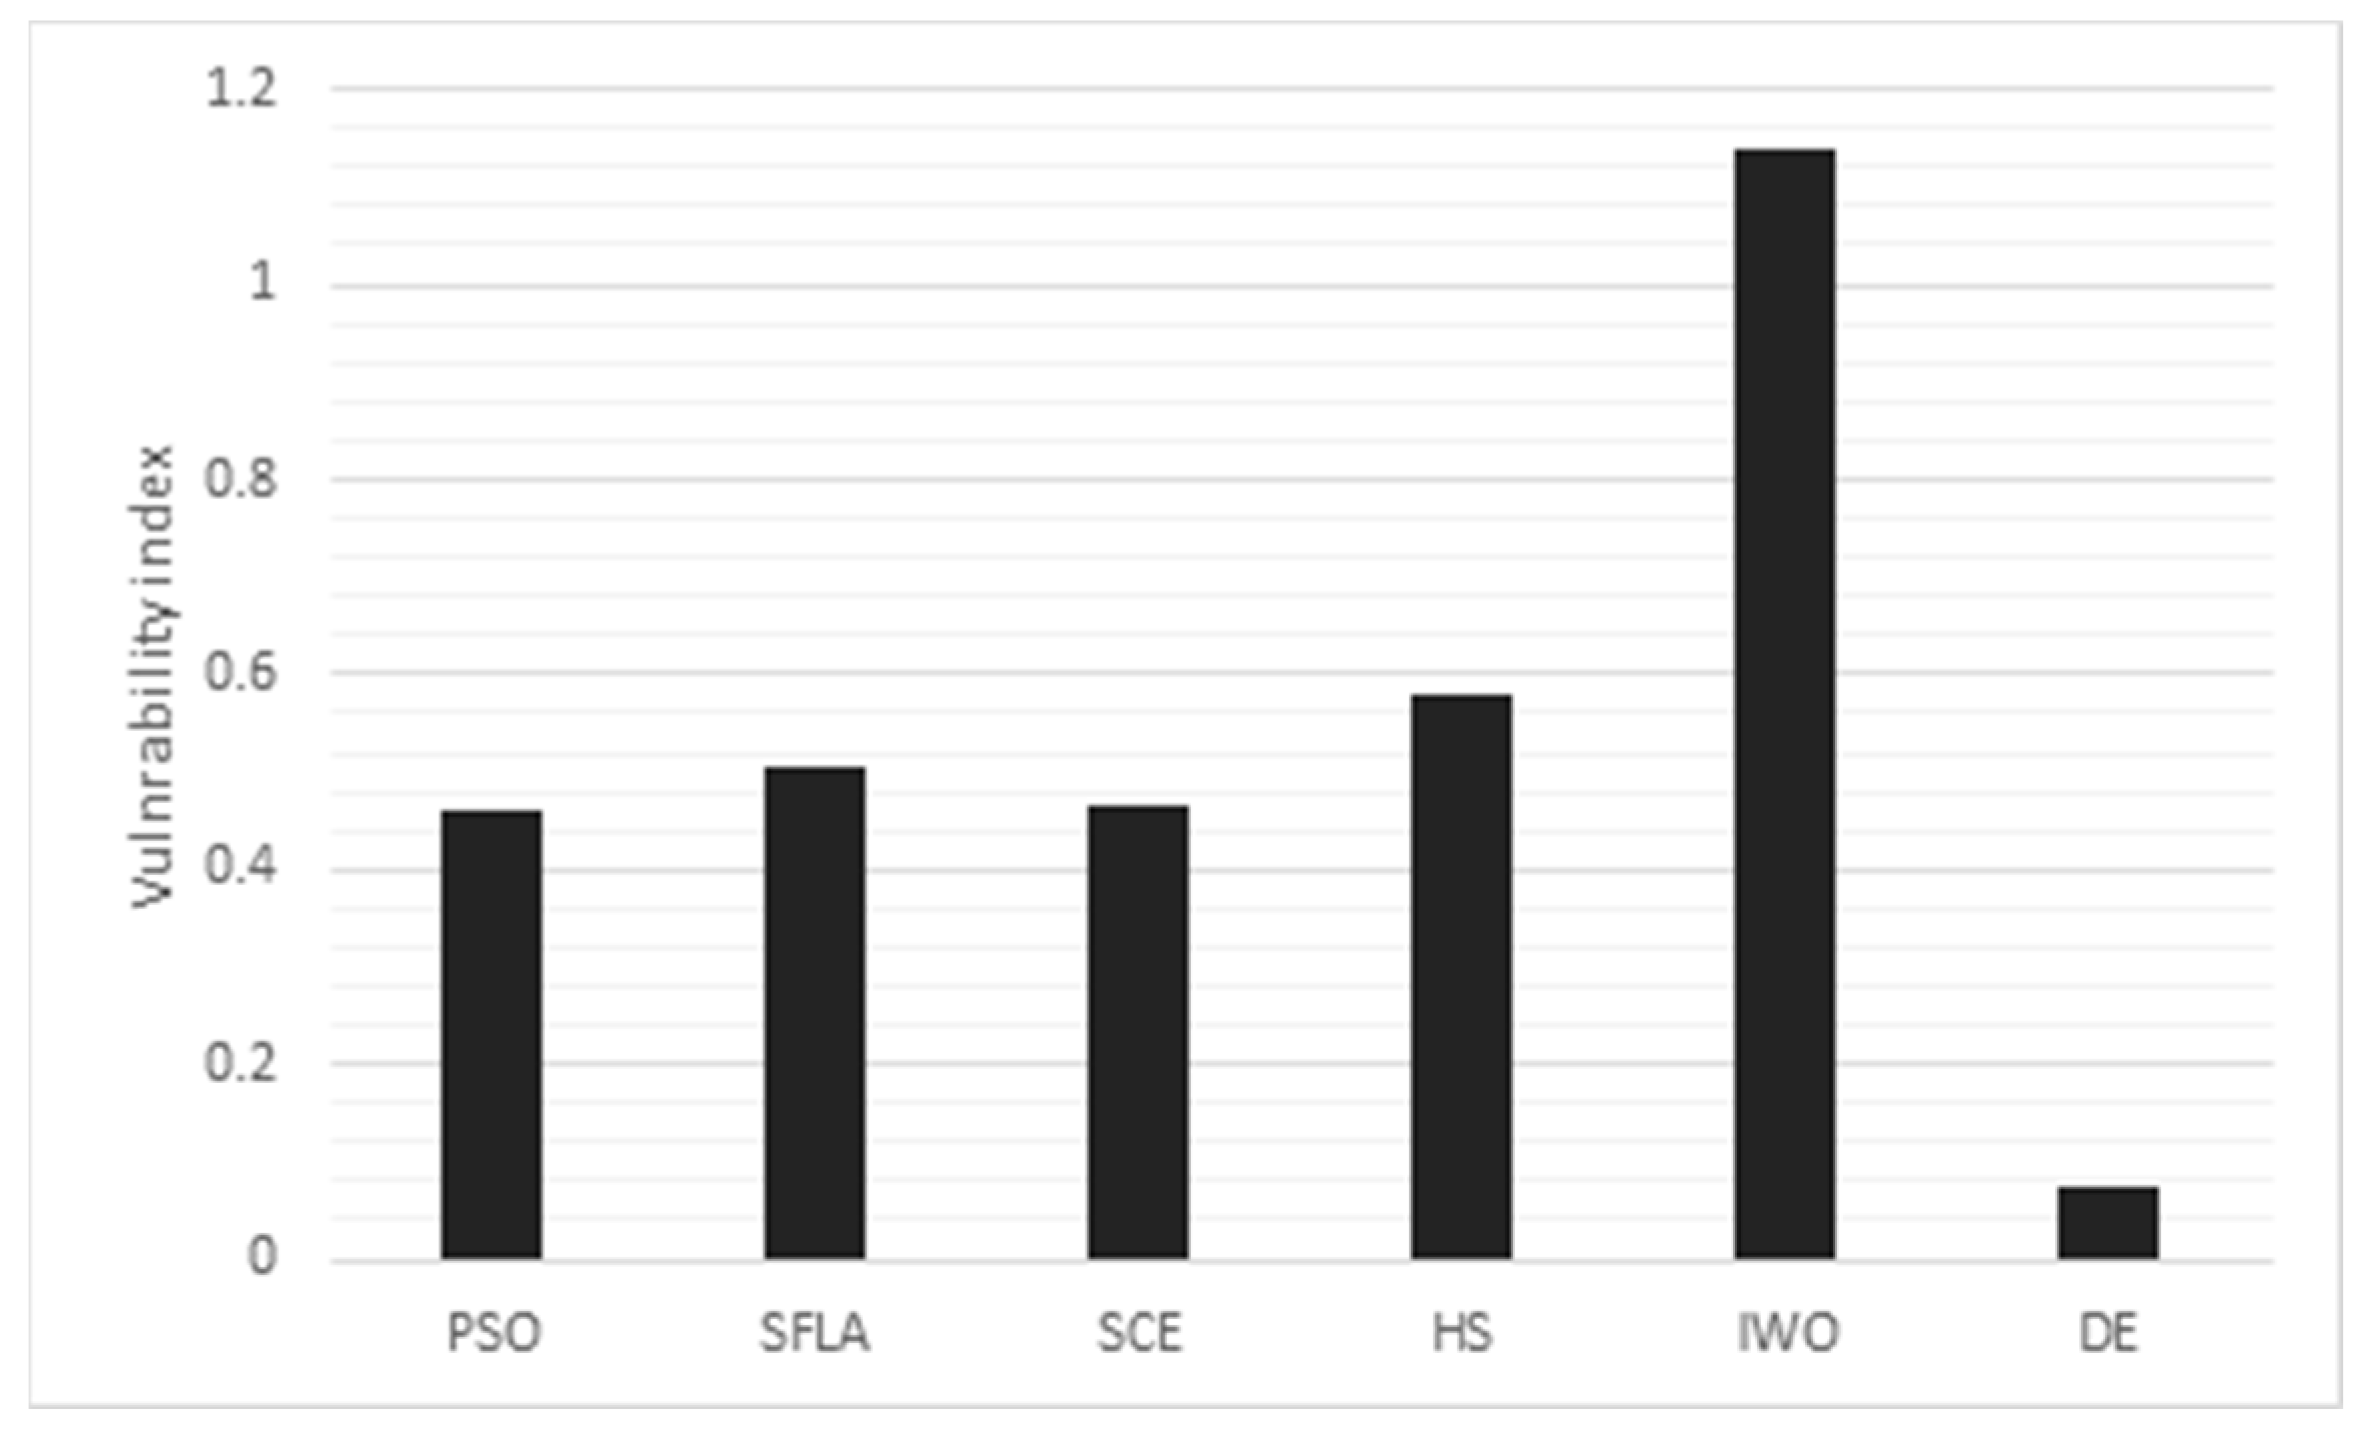
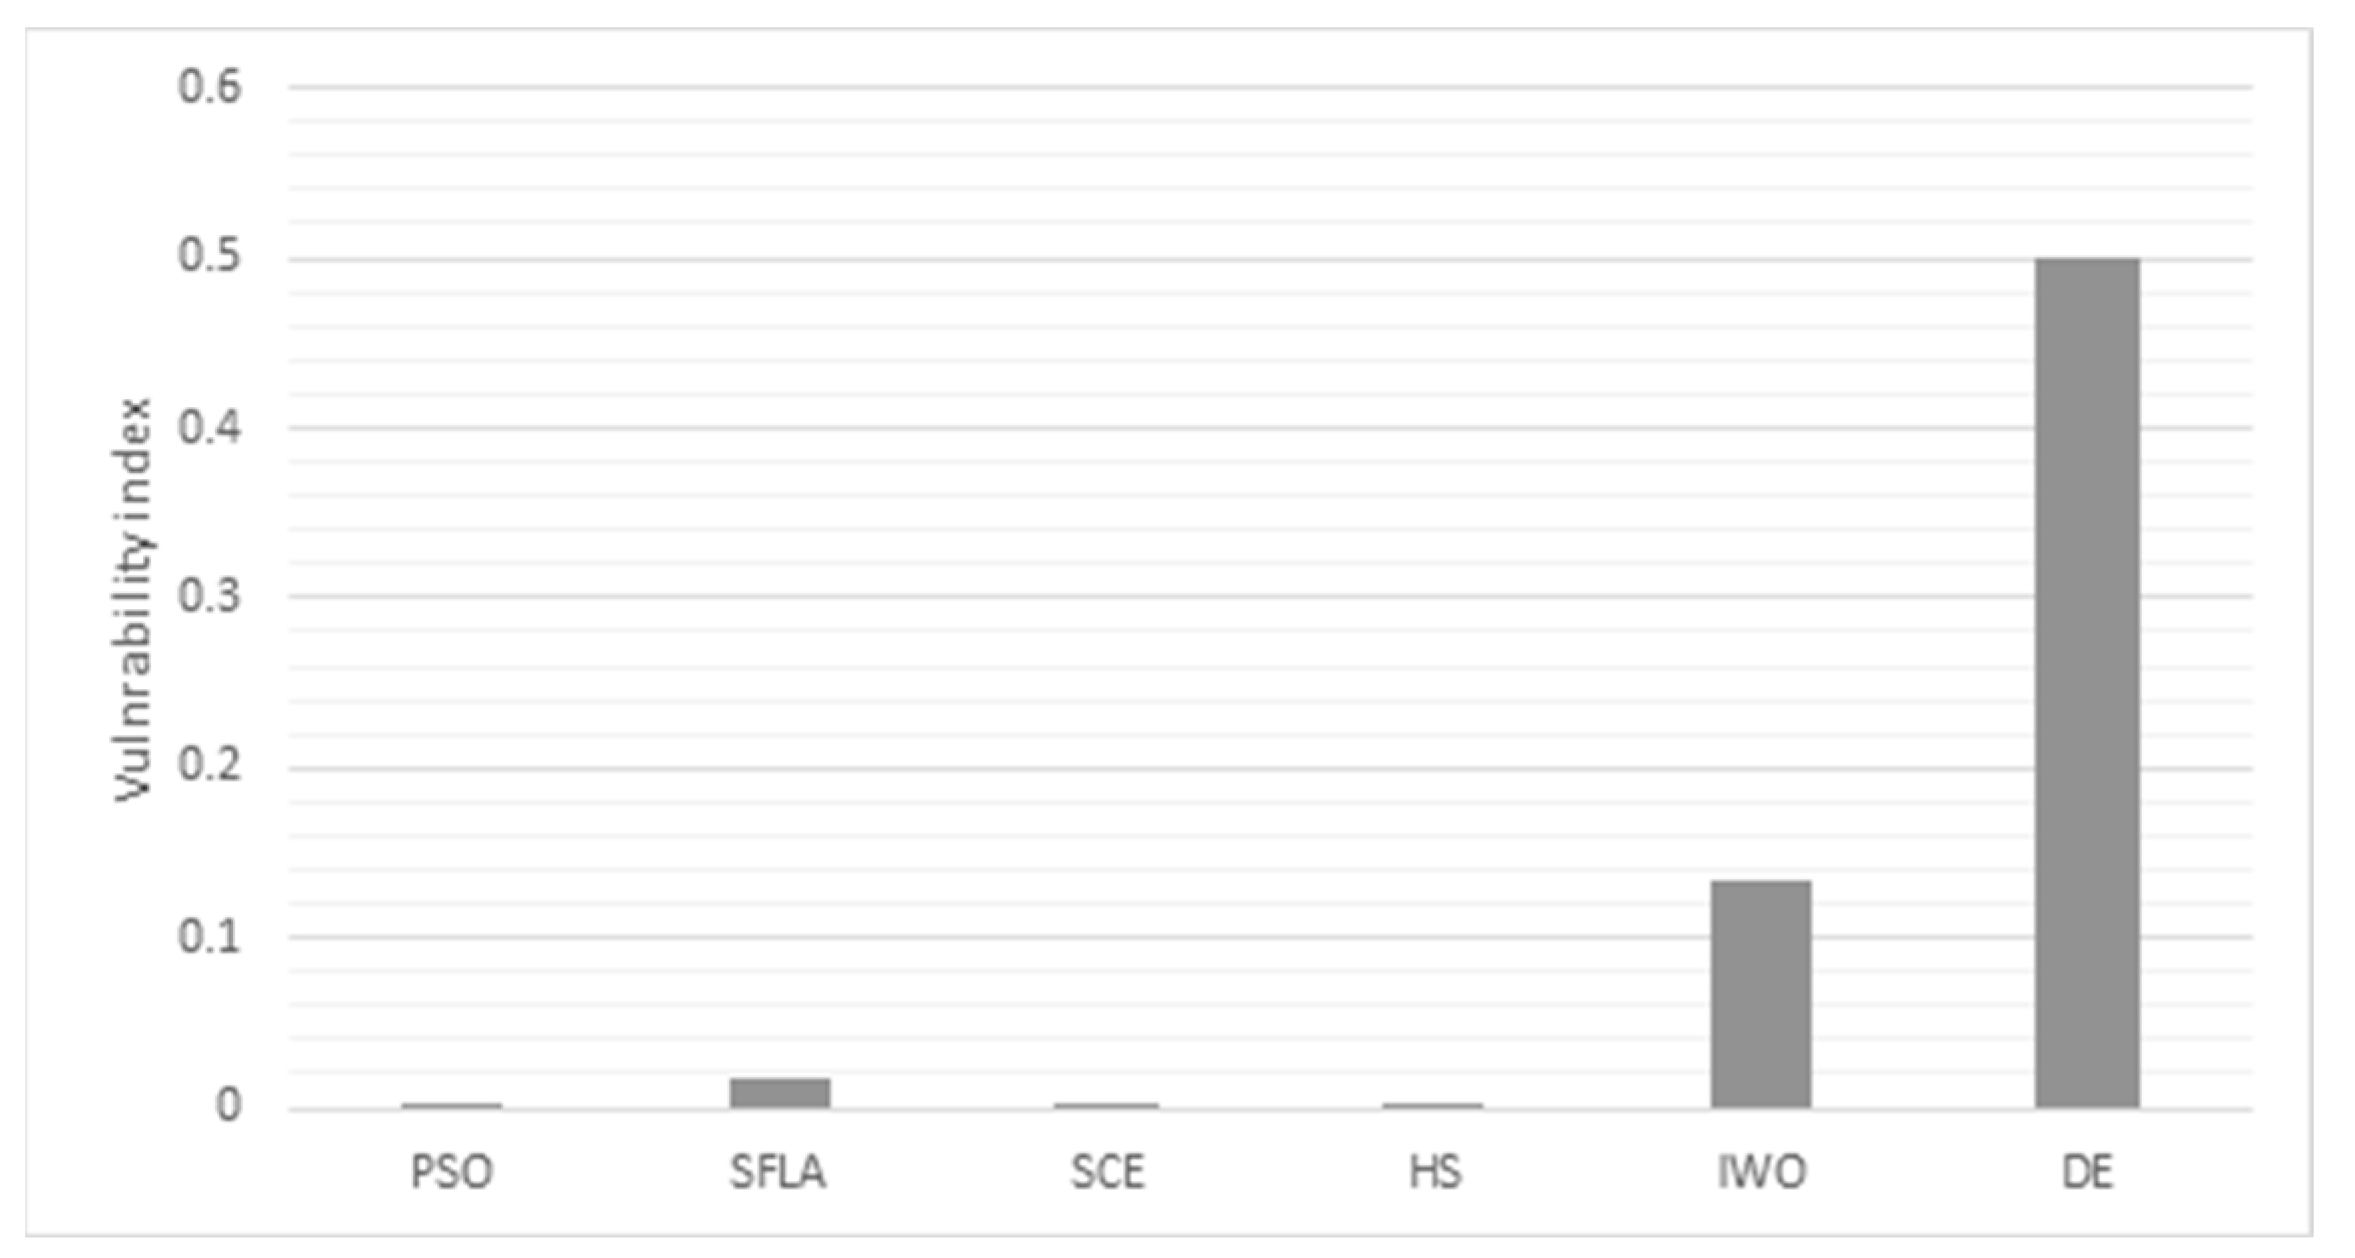
Figure 12 displays vulnerability index of the nitrate concentration as well as total area. The weak performances of DE and IWO in terms of either the nitrate concentration or the total area can be observed clearly. Two tasks are essential in the FTOPSIS method: the rating of alternatives and the determination of the weights of importance. As presented in the previous section, three criteria were considered to prioritize the algorithms in the present study” vulnerability indices for the nitrate concentration and total area and total revenue produced using the proposed cultivation pattern. The weights of importance for these criteria were considered as high, very high, and medium, respectively. The total area must be the same as the total available area, and it might be very important in terms of the social issues in the catchment. Hence, the total area was considered very high importance in the decision-making system. Moreover, the performance of the optimization model in minimizing the impacts of nitrate was considered high importance. The total revenue was considered medium importance because of being less important than the two other factors. The rating of the alternatives was carried out based on the computed vulnerability indices in Figure 12 and the assessed revenue in Figure 11 from very poor to very good, as proposed in the literature [8]. 
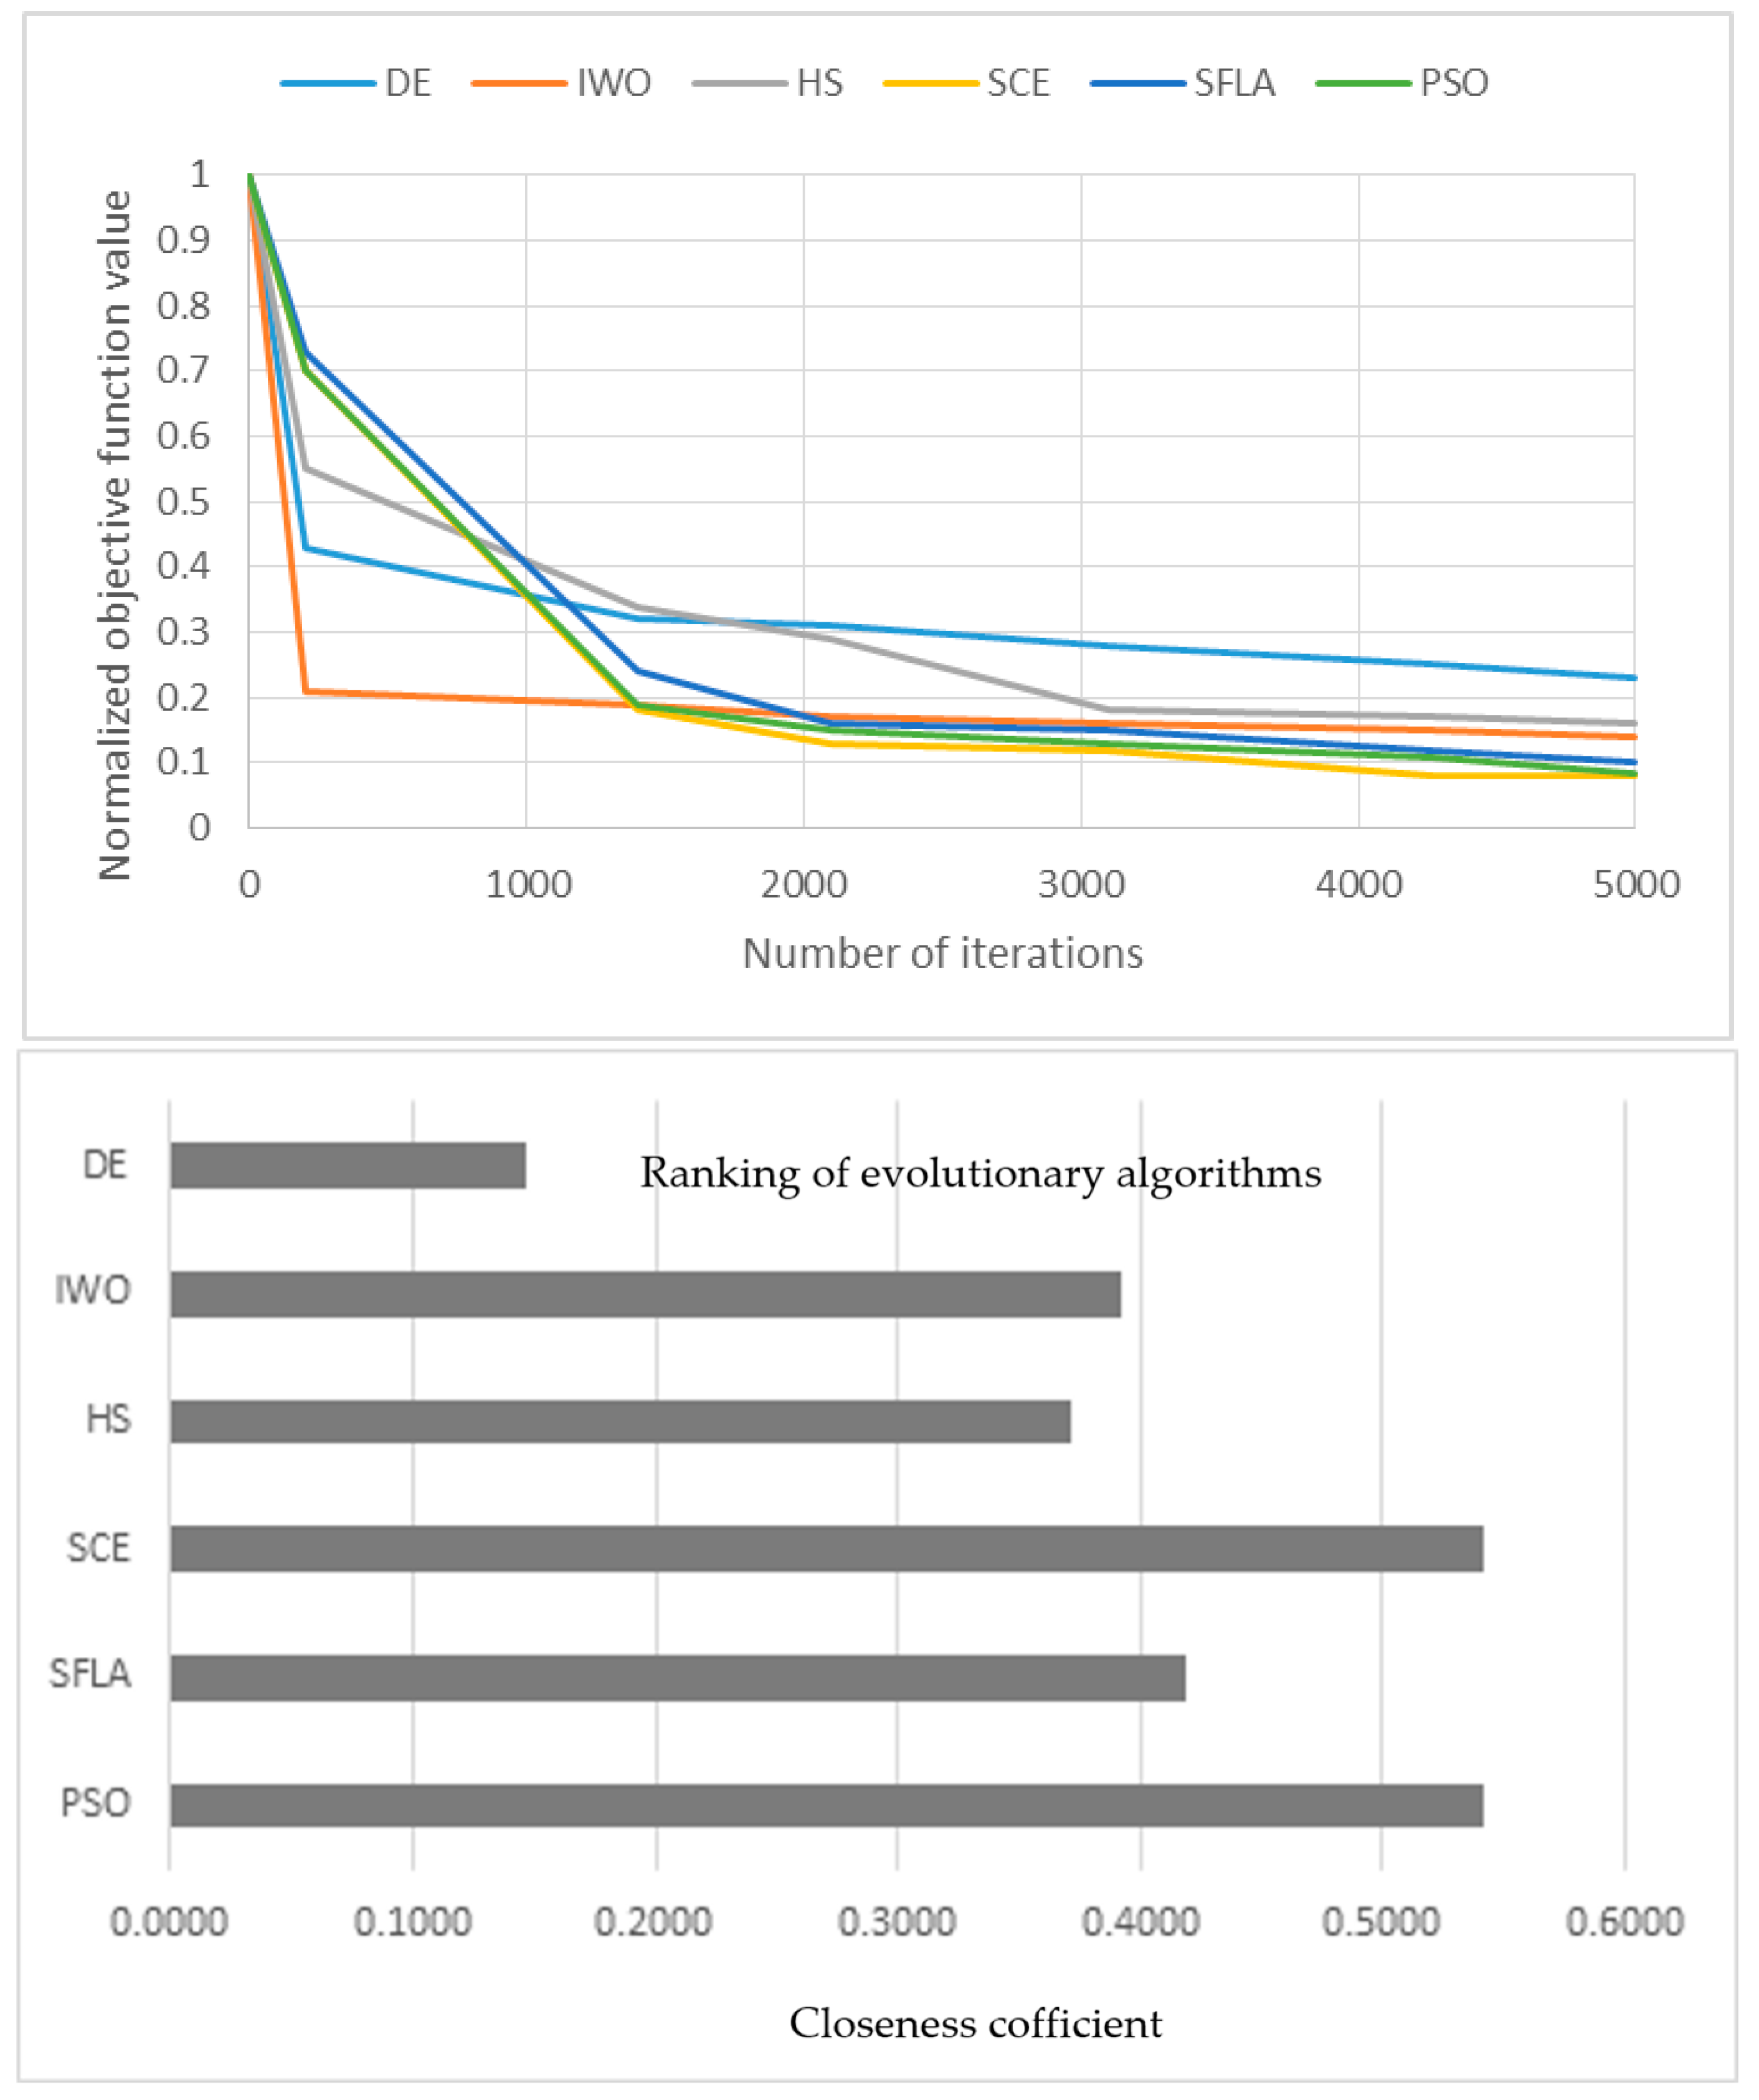
Figure 13 displays the final ranking produced with the FTOPSIS method. The highest CC demonstrates that the algorithm is the best one among all considered algorithms. The robustness of PSO and SCE was very close. Hence, these algorithms were selected as the best algorithms to optimize cultivation patterns in the proposed method.
We discussed the different aspects of the proposed method in this study. Previous studies optimized cropping patterns considering revenue or water consumption. However, environmental aspects should be highlighted for the future planning of farming. In fact, the destructive effect of agriculture on river ecosystems has been recognized in past decades. However, the previous methods for optimizing different aspects of agriculture are not able to take into account environmental degradation in their structure. Hence, developing new methods that are able to simulate environmental aspects in an integrated optimization system is necessary. This study developed an applicable method in this regard, in which the cultivation pattern was optimized considering the mitigation of the nitrate concentration in the aquatic habitats in the downstream river in a catchment. It opens a new window regarding the optimization process in agricultural engineering. One of the main reasons for achieving a successful solution for this problem was the application of the SWAT as a robust water quality model in the structure of the optimization model. Shifting from an optimization process to a simulation-optimization process is another necessity to handle environmental challenges in future studies. One of the key advantages of the proposed method is its low computational complexity, which makes the application of the method easier in actual projects. Computational complexity is defined as the time and memory required for the optimization algorithm. In fact, when computational complexity is high, more time and memory are needed to find the best solution. At first glance, computational complexity might not be a key decision factor in selecting an optimization model. However, an optimization model with high computational complexity might take a long time to simulate a long-term period or numerous simulations may be required in a practical project.
We applied the proposed model to optimize the nitrate concertation. However, this method can be applied for other water quality parameters as well. Analysis of the interaction of several water quality parameters in an aquatic habitat might be complex, which means upgrading the proposed method is necessary. This method can be upgraded to assess the interactions of many water quality parameters for designing an optimal cropping pattern. The economic considerations were a priority in the cultivation pattern optimization in most previous studies. However, the result of the case study indicated that an incorrect cultivation pattern can drastically reduce aquatic populations. A very high concentration of nitrate even in one time step might disrupt the biological activities of various species, which might reduce the population of that species in a river. One of the recommended future research needs is to carry out sensitivity analysis to investigate the impact of each parameter on the optimal cultivation pattern.
In our case study, revenue was not reduced dramatically by the optimization of the cultivation pattern. In fact, our assessment demonstrated that the highest possible revenue is USD 2.73 million, which is close to the revenue proposed using the SCE, as the best algorithm, in the present study. We recommend using the proposed method in practical projects for protecting the environmental values of river habitats downstream of agricultural catchments.
This study corroborates the outcomes of a previous study regarding the robustness of the SWAT for modeling sustainable agriculture [1]. According to the literature, the use SWAT was validated for ensuring the cost-effectiveness of the best management practices in improving the water quality of agricultural drainage [1]. This study adds an important point to the existing knowledge by applying SWAT in the process of cropping pattern optimization. Hence, SWAT is a useful tool not only for simulating best management practices but also for optimizing cropping patterns. We also need to highlight the limitations of the proposed method. Using the SWAT for water quality simulation needs considerable data, which might not be available in many cases. So, simpler methods/models are recommended in cases studies in which extensive catchment data are not available. Moreover, applying evolutionary optimization might have some limitations. This algorithm is not able to guarantee global optimization, which means the outputs might not be highly reliable in terms of providing an optimal solution. The computational time of the proposed optimization methods is another limitation, which might reduce the attractiveness of the method, particularly for large catchments. Another limitation of this study is the lack of uncertainty analysis, which is a real need in practical projects. It should be noted that the main sources of uncertainty in the proposed method are the reliability of the land use, soil, precipitation, and air temperature data.

4. Conclusions

This study developed a novel cropping pattern optimization method for minimizing the nitrate concentration in aquatic environments caused by agricultural drainage. The SWAT was used to simulate runoff as well as nitrate concentration. The results of the SWAT were used with a wide range of evolutionary algorithms to optimize the cropping pattern. Then, FTOPSIS was applied to select the best optimization algorithm considering three measurement indices: vulnerability index for nitrate concentration, total area, and maximum revenue for the proposed cultivation pattern. The results demonstrated that the proposed method could mitigate the impact of nitrate in the water. PSO and SCE were selected as the best algorithms to optimize the cropping pattern in the case study. A new cropping pattern was the main output of the model in the case study.

Author Contributions

Conceptualization, M.S. and B.D.; methodology, M.S.; software, M.S.; validation, M.S; formal analysis, M.S.; data curation, M.S.; writing—original draft preparation, M.S.; writing—review and editing, B.D.; supervision, B.D. All authors have read and agreed to the published version of the manuscript.

Funding

This research received no external funding.

Institutional Review Board Statement

Not applicable.

Informed Consent Statement

Not applicable.

Data Availability Statement

The data presented in this study are available on request from the corresponding author. However, the permission of the data provider is needed before sharing the data.

Conflicts of Interest

The authors declare no conflict of interest.

References

  1. Abbaspour, K.C.; Rouholahnejad, E.; Vaghefi, S.; RSrinivasan, R.; Yang, H.; Kløve, B. A continental-scale hydrology and water quality model for Europe: Calibration and uncertainty of a high-resolution large-scale SWAT model. J. Hydrol. 2015, 524, 733–752. [Google Scholar] [CrossRef]
  2. Agarwal, M.; Gupta, R. Penalty function approach in heuristic algorithms for constrained redundancy reliability optimization. IEEE Trans. Reliab. 2005, 54, 549–558. [Google Scholar] [CrossRef]
  3. Ahmadi-Nedushan, B.; St-Hilaire, A.; Bérubé, M.; Robichaud, É.; Thiémonge, N.; Bobée, B. A review of statistical methods for the evaluation of aquatic habitat suitability for instream flow assessment. River Res. Appl. 2006, 22, 503–523. [Google Scholar] [CrossRef]
  4. Amiri, B.; Fathian, M.; Maroosi, A. Application of shuffled frog-leaping algorithm on clustering. Int. J. Adv. Manuf. Technol. 2009, 45, 199–209. [Google Scholar] [CrossRef]
  5. Arthington, Á.H.; Naiman, R.J.; Mcclain, M.E.; Nilsson, C. Preserving the biodiversity and ecological services of rivers: New challenges and research opportunities. Freshw. Biol. 2010, 55, 1–16. [Google Scholar] [CrossRef]
  6. Ball, J.E.; Babister, M.K.; Nathan, R.; Weinmann, P.E.; Weeks, W.; Retallick, M.; Testoni, I. Australian Rainfall and Runoff—A Guide to Flood Estimation; Geoscience Australia: Canberra, Australia, 2016.
  7. Cambien, N.; Gobeyn, S.; Nolivos, I.; Forio, M.A.E.; Arias-Hidalgo, M.; Dominguez-Granda, L.; Witing, F.; Volk, M.; Goethals, P.L. Using the soil and water assessment tool to simulate the pesticide dynamics in the data scarce Guayas river basin, Ecuador. Water 2020, 12, 696. [Google Scholar] [CrossRef]
  8. Chen, C.T. Extensions of the TOPSIS for group decision-making under fuzzy environment. Fuzzy Sets Syst. 2000, 114, 1–9. [Google Scholar] [CrossRef]
  9. Daghighi, A.; Nahvi, A.; Kim, U. Optimal cultivation pattern to increase revenue and reduce water use: Application of linear programming to Arjan plain in Fars province. Agriculture 2017, 7, 73. [Google Scholar] [CrossRef]
  10. Dokeroglu, T.; Sevinc, E.; Kucukyilmaz, T.; Cosar, A. A survey on new generation metaheuristic algorithms. Comput. Ind. Eng. 2019, 137, 106040. [Google Scholar] [CrossRef]
  11. Eberhart, R.; Kennedy, J. Particle swarm optimization. In Proceedings of the IEEE International Conference on Neural Networks, Perth, Australia, 27 November–1 December 1995; Volume 4, pp. 1942–1948. [Google Scholar]
  12. Fereidoon, M.; Koch, M. SWAT-MODSIM-PSO optimization of multi-crop planning in the Karkheh River Basin, Iran, under the impacts of climate change. Sci. Total Environ. 2018, 630, 502–516. [Google Scholar] [CrossRef]
  13. Haddad, O.B.; Karimirad, I.; Seifollahi-Aghmiuni, S.; Loáiciga, H.A. Development and application of the bat algorithm for optimizing the operation of reservoir systems. J. Water Resour. Plan. Manag. 2015, 141, 04014097. [Google Scholar] [CrossRef]
  14. Hively, W.D.; Lee, S.; Sadeghi, A.M.; McCarty, G.W.; Lamb, B.T.; Soroka, A.; Keppler, J.; Yeo, I.Y.; Moglen, G.E. Estimating the effect of winter cover crops on nitrogen leaching using cost-share enrollment data, satellite remote sensing, and Soil and Water Assessment Tool (SWAT) modeling. J. Soil Water Conserv. 2020, 75, 362–375. [Google Scholar] [CrossRef]
  15. Jafarzadeh, A.; Khashei, S.A.; Shahidi, A. Design a Multi Objective Optimization Model to Determination of Optimal Cultivation Pattern Influenced Climate Change Phenomenon (Case Study: Birjand Plain). Iran. J. Soil Water Res. 2017, 47, 849–859. [Google Scholar]
  16. Jahandideh-Tehrani, M.; Bozorg-Haddad, O.; Loáiciga, H.A. Application of non-animal–inspired evolutionary algorithms to reservoir operation: An overview. Environ. Monit. Assess. 2019, 191, 439. [Google Scholar] [CrossRef]
  17. Liong, S.Y.; Atiquzzaman, M. Optimal design of water distribution network using shuffled complex evolution. J. Inst. Eng. 2004, 44, 93–107. [Google Scholar]
  18. McCuen, R.H.; Knight, Z.; Cutter, A.G. Evaluation of the Nash–Sutcliffe efficiency index. J. Hydrol. Eng. 2006, 11, 597–602. [Google Scholar] [CrossRef]
  19. Newson, M. Land, Water and Development: Sustainable and Adaptive Management of Rivers; Routledge: London, UK, 2008. [Google Scholar]
  20. Osama, S.; Elkholy, M.; Kansoh, R.M. Optimization of the cropping pattern in Egypt. Alex. Eng. J. 2017, 56, 557–566. [Google Scholar] [CrossRef]
  21. Ploskas, N.; Samaras, N. Linear Programming Using MATLAB®; Springer: Cham, Switzerland, 2017; Volume 127. [Google Scholar]
  22. Postel, S.L. Water for food production: Will there be enough in 2025? BioScience 1998, 48, 629–637. [Google Scholar] [CrossRef]
  23. Qin, A.K.; Huang, V.L.; Suganthan, P.N. Differential evolution algorithm with strategy adaptation for global numerical optimization. IEEE Trans. Evol. Comput. 2008, 13, 398–417. [Google Scholar] [CrossRef]
  24. Rad, H.S.; Lucas, C. A recommender system based on invasive weed optimization algorithm. In Proceedings of the 2007 IEEE Congress on Evolutionary Computation, Singapore, 25–28 September 2007; pp. 4297–4304. [Google Scholar]
  25. Upadhyaya, A.; Roy, L.B. Application of linear programming to maximize net return by allocating land under different crops in bhagwanpur distributary. J. Agric. Eng. 2018, 55, 43–51. [Google Scholar]
  26. Wang, M.; Zhang, D.; Dong, J.; Tan, S.K. Application of constructed wetlands for treating agricultural runoff and agro-industrial wastewater: A review. Hydrobiologia 2018, 805, 1–31. [Google Scholar] [CrossRef]
  27. Xia, Y.; Zhang, M.; Tsang, D.C.; Geng, N.; Lu, D.; Zhu, L.; Igalavithana, A.D.; Dissanayake, P.D.; Rinklebe, J.; Yang, X.; et al. Recent advances in control technologies for non-point source pollution with nitrogen and phosphorous from agricultural runoff: Current practices and future prospects. Appl. Biol. Chem. 2020, 63, 8. [Google Scholar] [CrossRef]
  28. Yang, X.S. Harmony search as a metaheuristic algorithm. In Music-Inspired Harmony Search Algorithm; Springer: Berlin/Heidelberg, Germany, 2009; pp. 1–14. [Google Scholar]
  29. Sedighkia, M.; Abdoli, A. Optimizing environmental flow regime by integrating river and reservoir ecosystems. Water Resour. Manag. 2022, 36, 2079–2094. [Google Scholar] [CrossRef]
  30. Sedighkia, M.; Datta, B.; Abdoli, A. Design of optimal environmental flow regime at downstream of reservoirs using wetted perimeter-optimization method. J. Hydro-Environ. Res. 2021, 39, 1–4. [Google Scholar] [CrossRef]
  31. Nădăban, S.; Dzitac, S.; Dzitac, I. Fuzzy TOPSIS: A general view. Procedia Comput. Sci. 2016, 91, 823–831. [Google Scholar] [CrossRef]
Figure 1. Land use and river network map of Tajan basin.
Applsci 13 13183 g001
Figure 2. Slope map of Tajan River basin.
Applsci 13 13183 g002
Figure 3. Particle swarm optimization (PSO) flow chart.
Applsci 13 13183 g003
Figure 4. Flow chart of fuzzy TOPSIS [8].
Applsci 13 13183 g004
Figure 5. Hierarchical framework of FTOPSIS in the present study [31].
Applsci 13 13183 g005
Figure 6. Calibration and validation of outflow and nitrate concentration produced using SWAT.
Applsci 13 13183 g006
Figure 7. Nitrate concentration Simulated using SWAT for different crops.
Applsci 13 13183 g007
Figure 8. Optimal nitrate concentration produced using the optimization model.
Applsci 13 13183 g008
Figure 9. Optimal cultivation pattern produced using the optimization model.
Applsci 13 13183 g009
Figure 10. Total cultivated area produced using the optimization model.
Applsci 13 13183 g010
Figure 11. Total revenue for proposed cultivated pattern using different algorithms.
Applsci 13 13183 g011
Figure 12. Vulnerability indices (top: nitrate concentration; bottom: total cultivation area in the catchment).
Applsci 13 13183 g012aApplsci 13 13183 g012b
Figure 13. Top: Curve convergence of algorithms; bottom: final ranking using the FTOPSIS method.
Applsci 13 13183 g013
Table 1. Thresholds of the evaluation indices.
ExcellentGoodSatisfactoryUnsatisfactory
RSR0–0.50.5–0.60.6–0.7>0.7
NSE0.75–10.65–0.750.5–0.65<0.5
PBIAS<±10±10–±15±15–±25>±25
Table 2. Evaluation indices of SWAT in the case study.
ParameterPeriodNSERSRPBIAS
River flowCalibration 0.930.26−0.88
Validation 0.910.312.76
NitrateCalibration 0.800.455.05
Validation 0.830.416.91
Disclaimer/Publisher’s Note: The statements, opinions and data contained in all publications are solely those of the individual author(s) and contributor(s) and not of MDPI and/or the editor(s). MDPI and/or the editor(s) disclaim responsibility for any injury to people or property resulting from any ideas, methods, instructions or products referred to in the content.

