Article

Research on an Assembly Building Buffer Zone Based on Gray Critical Chain

School of Architectural Engineering, Dalian University, Dalian 116622, China
*
Author to whom correspondence should be addressed.
Appl. Sci. 2023, 13(24), 13174; https://doi.org/10.3390/app132413174
Submission received: 30 October 2023 / Revised: 3 December 2023 / Accepted: 5 December 2023 / Published: 12 December 2023

Abstract

:
The complexity of construction in prefabricated buildings makes it vulnerable to uncertainty in project timelines, and traditional project timeline management is insufficient to control project timelines for prefabricated buildings. Therefore, research on project timeline management for prefabricated buildings is needed in order to optimize project timelines and improve project execution rates. This study proposed an improved method of setting prefabricated building buffer zones through the use of improved grey critical chain technology. Five major factors affecting project timelines in actual prefabricated construction projects were selected: personnel experience, degree of prefabrication, technical complexity, reasonableness of construction plans, and degree of construction space availability. The OPA technique was introduced and combined with the entropy weight method to improve the comprehensive weight coefficient of the grey critical chain calculation of the factors affecting the timeline. Other influencing coefficients were determined, and a new calculation method for the size of prefabricated building buffer zones was proposed. Monte Carlo simulations were conducted in Matlab on actual construction projects to ensure the scientific rationality of the improved method. The results showed that compared with the classical buffer calculation methods (cut-and-paste method, C&PM and square root standard deviation method, RSEM), the project timeline was reduced by 14.3% and 11.7%, respectively, using the improved method. The improved method not only reduces project uncertainties, but also achieves the goal of optimizing project timelines, and it is reasonable and effective. The results of the study provide a direction for the project timeline management of prefabricated building critical chains, and this method can be applied to the planning and management of prefabricated building buffer zones.

1. Introduction

Assembled building involves transferring on-site work to the factory for component manufacturing, and subsequently assembling the components on-site using reliable connections [1,2,3,4]. Assembled buildings are expected to exhibit high efficiency, energy-saving capabilities, and environmental friendliness, thanks to their optimized production structures and a strong emphasis on professionalism [5,6]. This approach is gradually becoming the future trend in the construction industry. In recent years, the national, provincial, and municipal authorities have shown great enthusiasm for the development of assembled buildings [7]. However, numerous challenges, such as quality issues, safety concerns, and schedule delays, continue to impede the progress of assembled building projects [8,9,10,11]. Given the unique characteristics of prefabricated components and the complexity of these projects, the schedule of assembly building projects is fraught with uncertainties. Traditional project schedule management methods, such as the Critical Path Method (CPM) and the Program Evaluation Review Technique (PERT), are no longer adequate to address the demands of schedule management in assembly projects. Consequently, schedule delays have become a common occurrence. Therefore, the establishment of a schedule management system specifically tailored for assembly construction projects holds significant practical importance.
Goldratt [12] combined the Theory of Constraints (TOC) with project management to form Critical Chain Project Management (CCPM), which sets buffers to absorb the impact of uncertainties while satisfying the constraint conditions. CCPM has been applied in various fields [13,14,15,16,17] since it was proposed by Goldratt, and has shown great effectiveness. It has been proven that CCPM is a powerful tool for managing project schedules in the presence of uncertainties. CCPM extracts safety time from the processes to form a buffer, which is inserted at the end of the critical chain as a Project Buffer (PB) to absorb the impact of uncertainties. At the intersection of the critical chain and non-critical chains, a Feeding Buffer (FB) is inserted to prevent delays in non-critical chain processes from affecting the critical chain [18]. Therefore, setting the buffer is the most crucial part of CCPM, and the size of the buffer directly determines the project completion time. Classic methods for determining buffer size include the Cut-and-Paste Method (C&PM) [12] and the Root-Square Error Method (RSEM) [19]. However, subsequent research has found limitations in these two methods, so scholars from both domestic and international sources have proposed improvements by considering project uncertainties in buffer size determination. Tukel et al. [20] proposed two solution methods, resource tightness and network complexity, which effectively reduce buffer size. Bie et al. [21] and Zhang [22] consider factors such as resource availability, network complexity, and activity slack, and propose methods for setting resource buffers in multi-project management. Jiang et al. [23] propose a buffer size determination method that takes into account the comprehensive impact of information and resources, effectively shortening project duration. Huang [24] and Faria [25] utilize the concept of flexible resources to set the critical chain buffer, optimize renewable resources to absorb buffer risks, and reduce the impact of resource risks on project schedules. Zarghami et al. [26] also analyze resource risks, establish scaling factors based on the reliability of available resources to determine buffer size, and compare the method with traditional methods to validate its effectiveness. Ma et al. [27] analyze the risk of information flow interaction and optimize rework safety time to improve buffer accuracy.
When it comes to the selection of methods for quantifying uncertainty factors, Li et al. [28] proposed a new approach of using the gray correlation analysis method to determine buffer zones by comprehensively considering relevant factors. Zhang et al. [29] evaluated uncertainty coefficients using the entropy-weighted TOPSIS method, while other scholars [30,31] used the AHP-entropy weight method and fuzzy comprehensive evaluation method to quantify factors. Ataei et al. [32] have introduced a novel technique called the Ordinal Priority Approach (OPA) for group decision making. OPA is capable of analyzing subjective judgments and uncertainties of different experts concurrently, prioritizing experts based on their experience or knowledge, minimizing their influence, and deriving effective indicator weights. In just a brief period, this technique has been successfully employed in various fields, confirming its effectiveness. Mahmoudi et al. [33] have used this approach to address portfolio selection problems, with a focus on long-term benefits through a resilience perspective. They have also applied OPA to a healthcare project, efficiently measuring its performance [34]. Abdel-Basset et al. [35] have adopted the OPA method to select ideal robots for a pharmaceutical city. In addition, Mahmoudi et al. [36] have proposed a gray sequential prioritization method (OPA-G) for selecting sustainable suppliers under uncertainty in major projects, using the traditional OPA methodology. OPA is a modern methodology that has only been used in a few research papers in the aforementioned disciplines and has not been applied in the field of assembly building schedule management thus far.
The above research results indicate that the current improvement in the setting of project buffer size is to some extent reasonable, but there are still some limitations: (1) The existing buffer size setting methods only consider the impact of risk preference level, resource scarcity, and process complexity in traditional construction projects, ignoring the impact of the unique construction method of prefabricated buildings on the construction period, and failing to form a systematic project schedule management system for the prefabricated construction industry. (2) The existing relevant research methods for quantifying uncertainty factors are too single and universal, and their results cannot well reflect the actual situation of prefabricated projects. Therefore, based on the existing research, this paper analyzes the factors influencing prefabricated construction from the perspective of considering the impact of construction period, which is more in line with the actual situation of prefabricated projects and expands the field of buffer zone measurement. By combining prefabricated construction with the OPA method, and using the OPA-entropy-weight method to improve the gray critical chain technology to determine the buffer zone size of prefabricated buildings, this paper overcomes the limitations of traditional single quantification methods and improves the accuracy of buffer zone setting. Finally, using Matlab2020 for Monte Carlo simulation, an actual case of prefabricated building is selected to verify the effectiveness of the improved buffer zone setting method in accelerating the completion progress of prefabricated projects.

2. Buffer Size Setting for Assembly Building Projects

In the process of managing construction progress on assembly building projects, the first consideration is the uncertainty factors that may affect the schedule in different stages of work. Due to the high precision and standardization requirements for the production of prefabricated components in prefabricated buildings, it determines whether the on-site installation can proceed smoothly. In addition, the installation of prefabricated components has a high degree of complexity and unpredictability, requiring personnel with rich installation experience, sufficient construction space to meet assembly requirements, and cross-over work situations in different stages of construction. Therefore, it is very important to develop a reasonable construction plan based on the specific characteristics of prefabricated buildings, which poses significant challenges to prefabricated building construction progress management. Secondly, other controllable factors such as project risk tolerance level, resource constraints, and process complexity need to be taken into account. Based on this, this article proposes an improvement to the method of calculating buffer size using root variance method. This article combines the OPA-Entropy weight method to improve the quantification of gray relational analysis for uncertain factors in prefabricated buildings, and obtains a buffer based on other influencing factors. The key process of calculating buffer size in improved critical chain is shown in Figure 1.

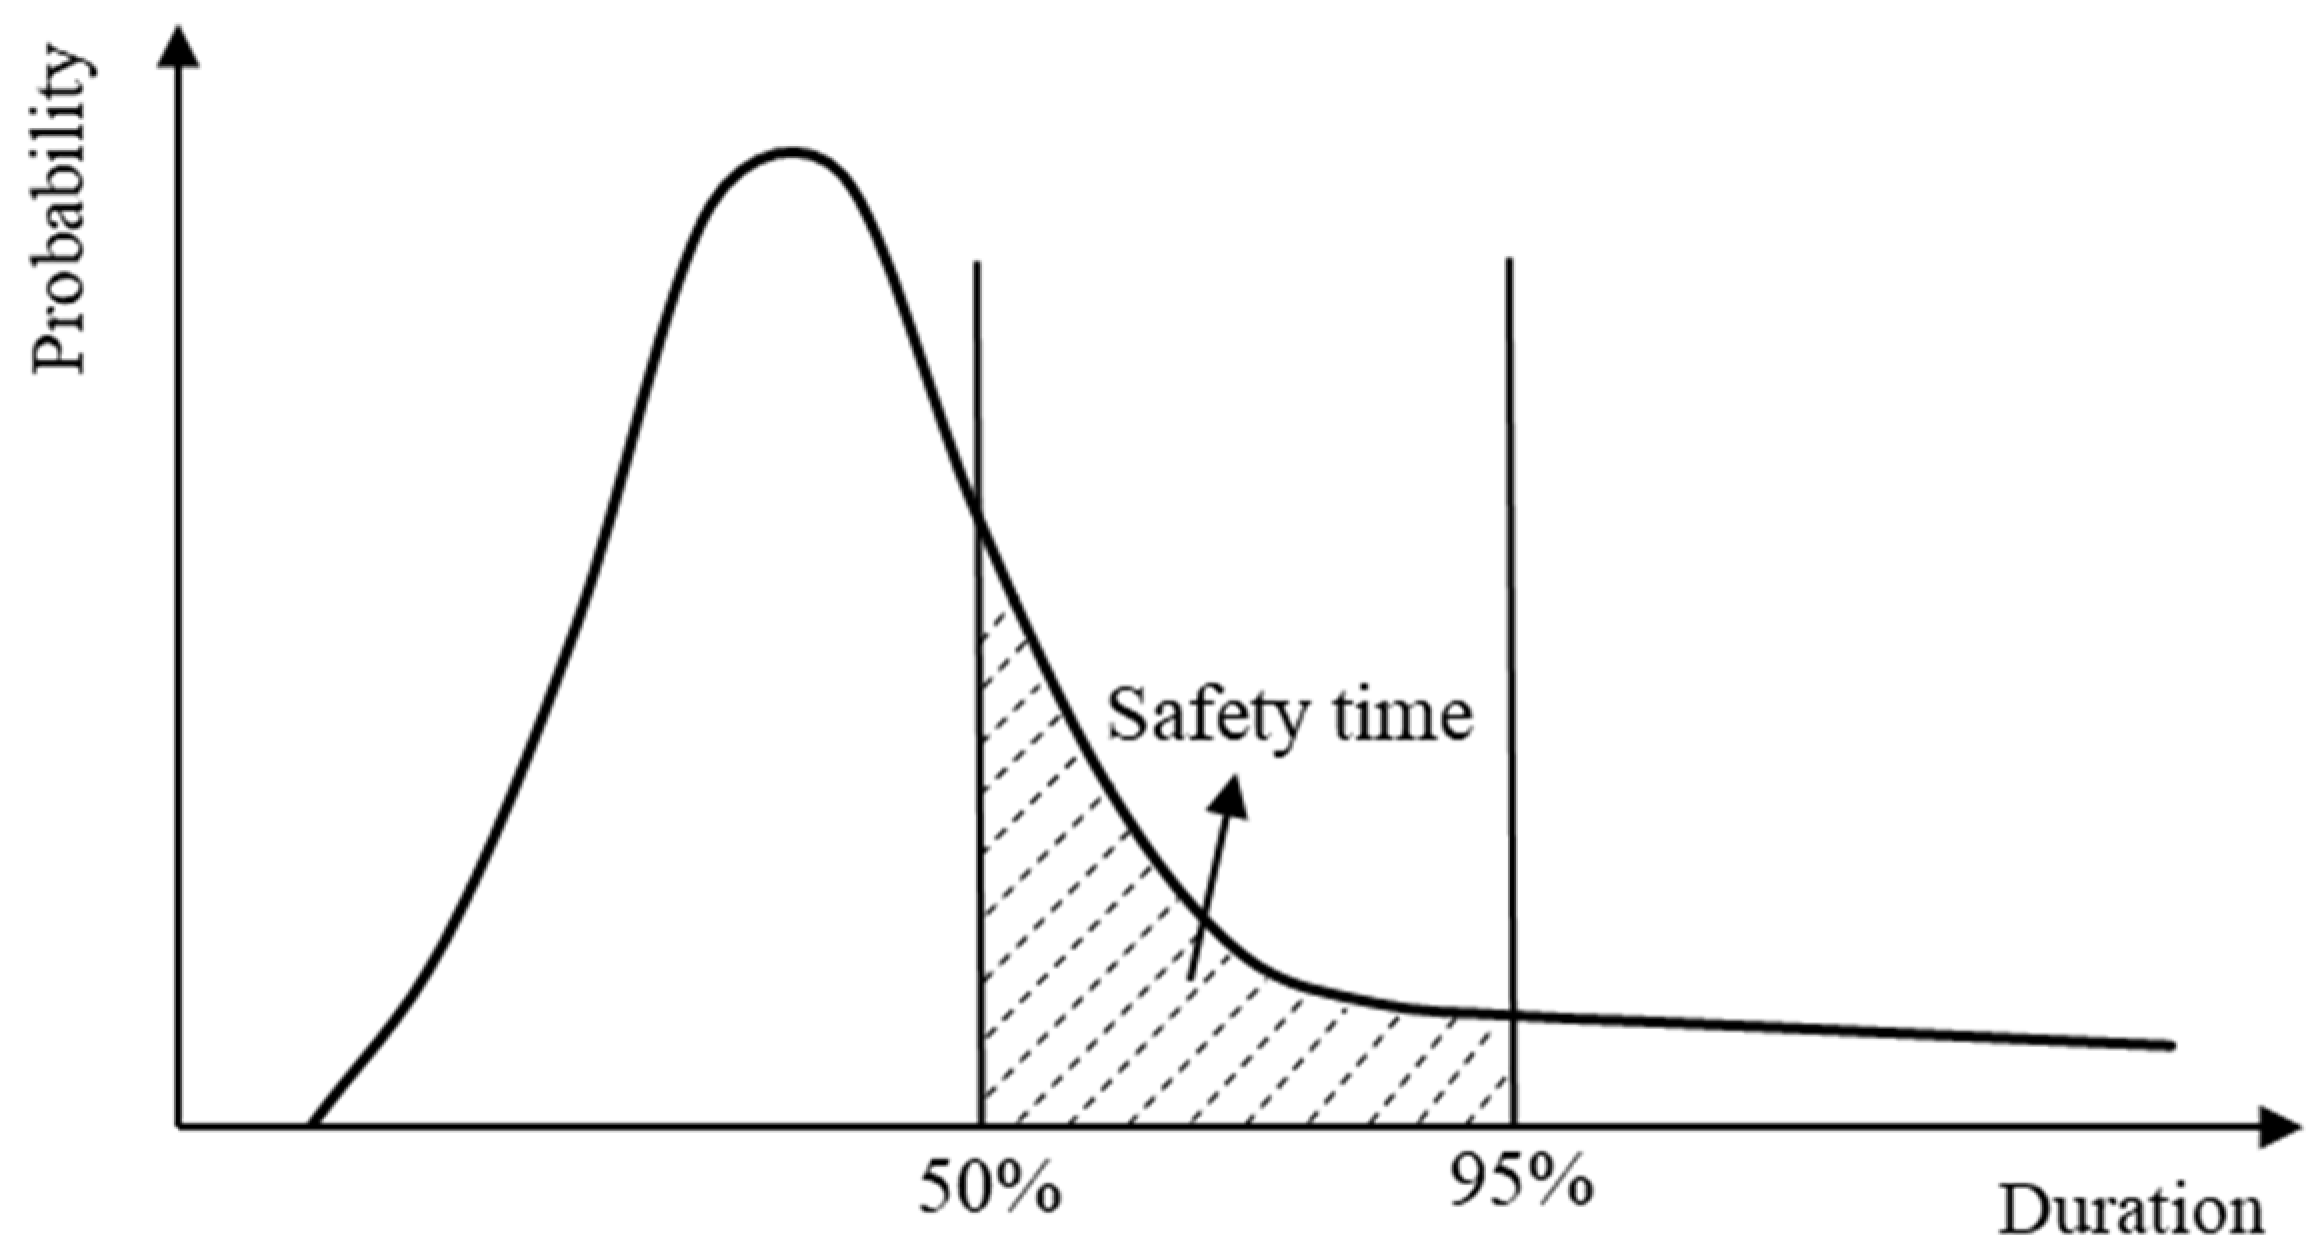
2.1. Determination of Safe Time

The estimates for the duration of the process follow a probability distribution that is skewed towards the right. These duration estimates are determined using a three-point estimation method, which involves considering the most optimistic duration (a), the most probable duration (m), and the most pessimistic duration (b) for each process based on expert experience. The process time estimates have a roughly 95% guarantee, and the safe time is defined as the difference between the completion time that has a 95% probability and the completion time that has a 50% probability. The process safety time shown in Figure 2 is σ = Δ t = t 95 % t 50 % [37].

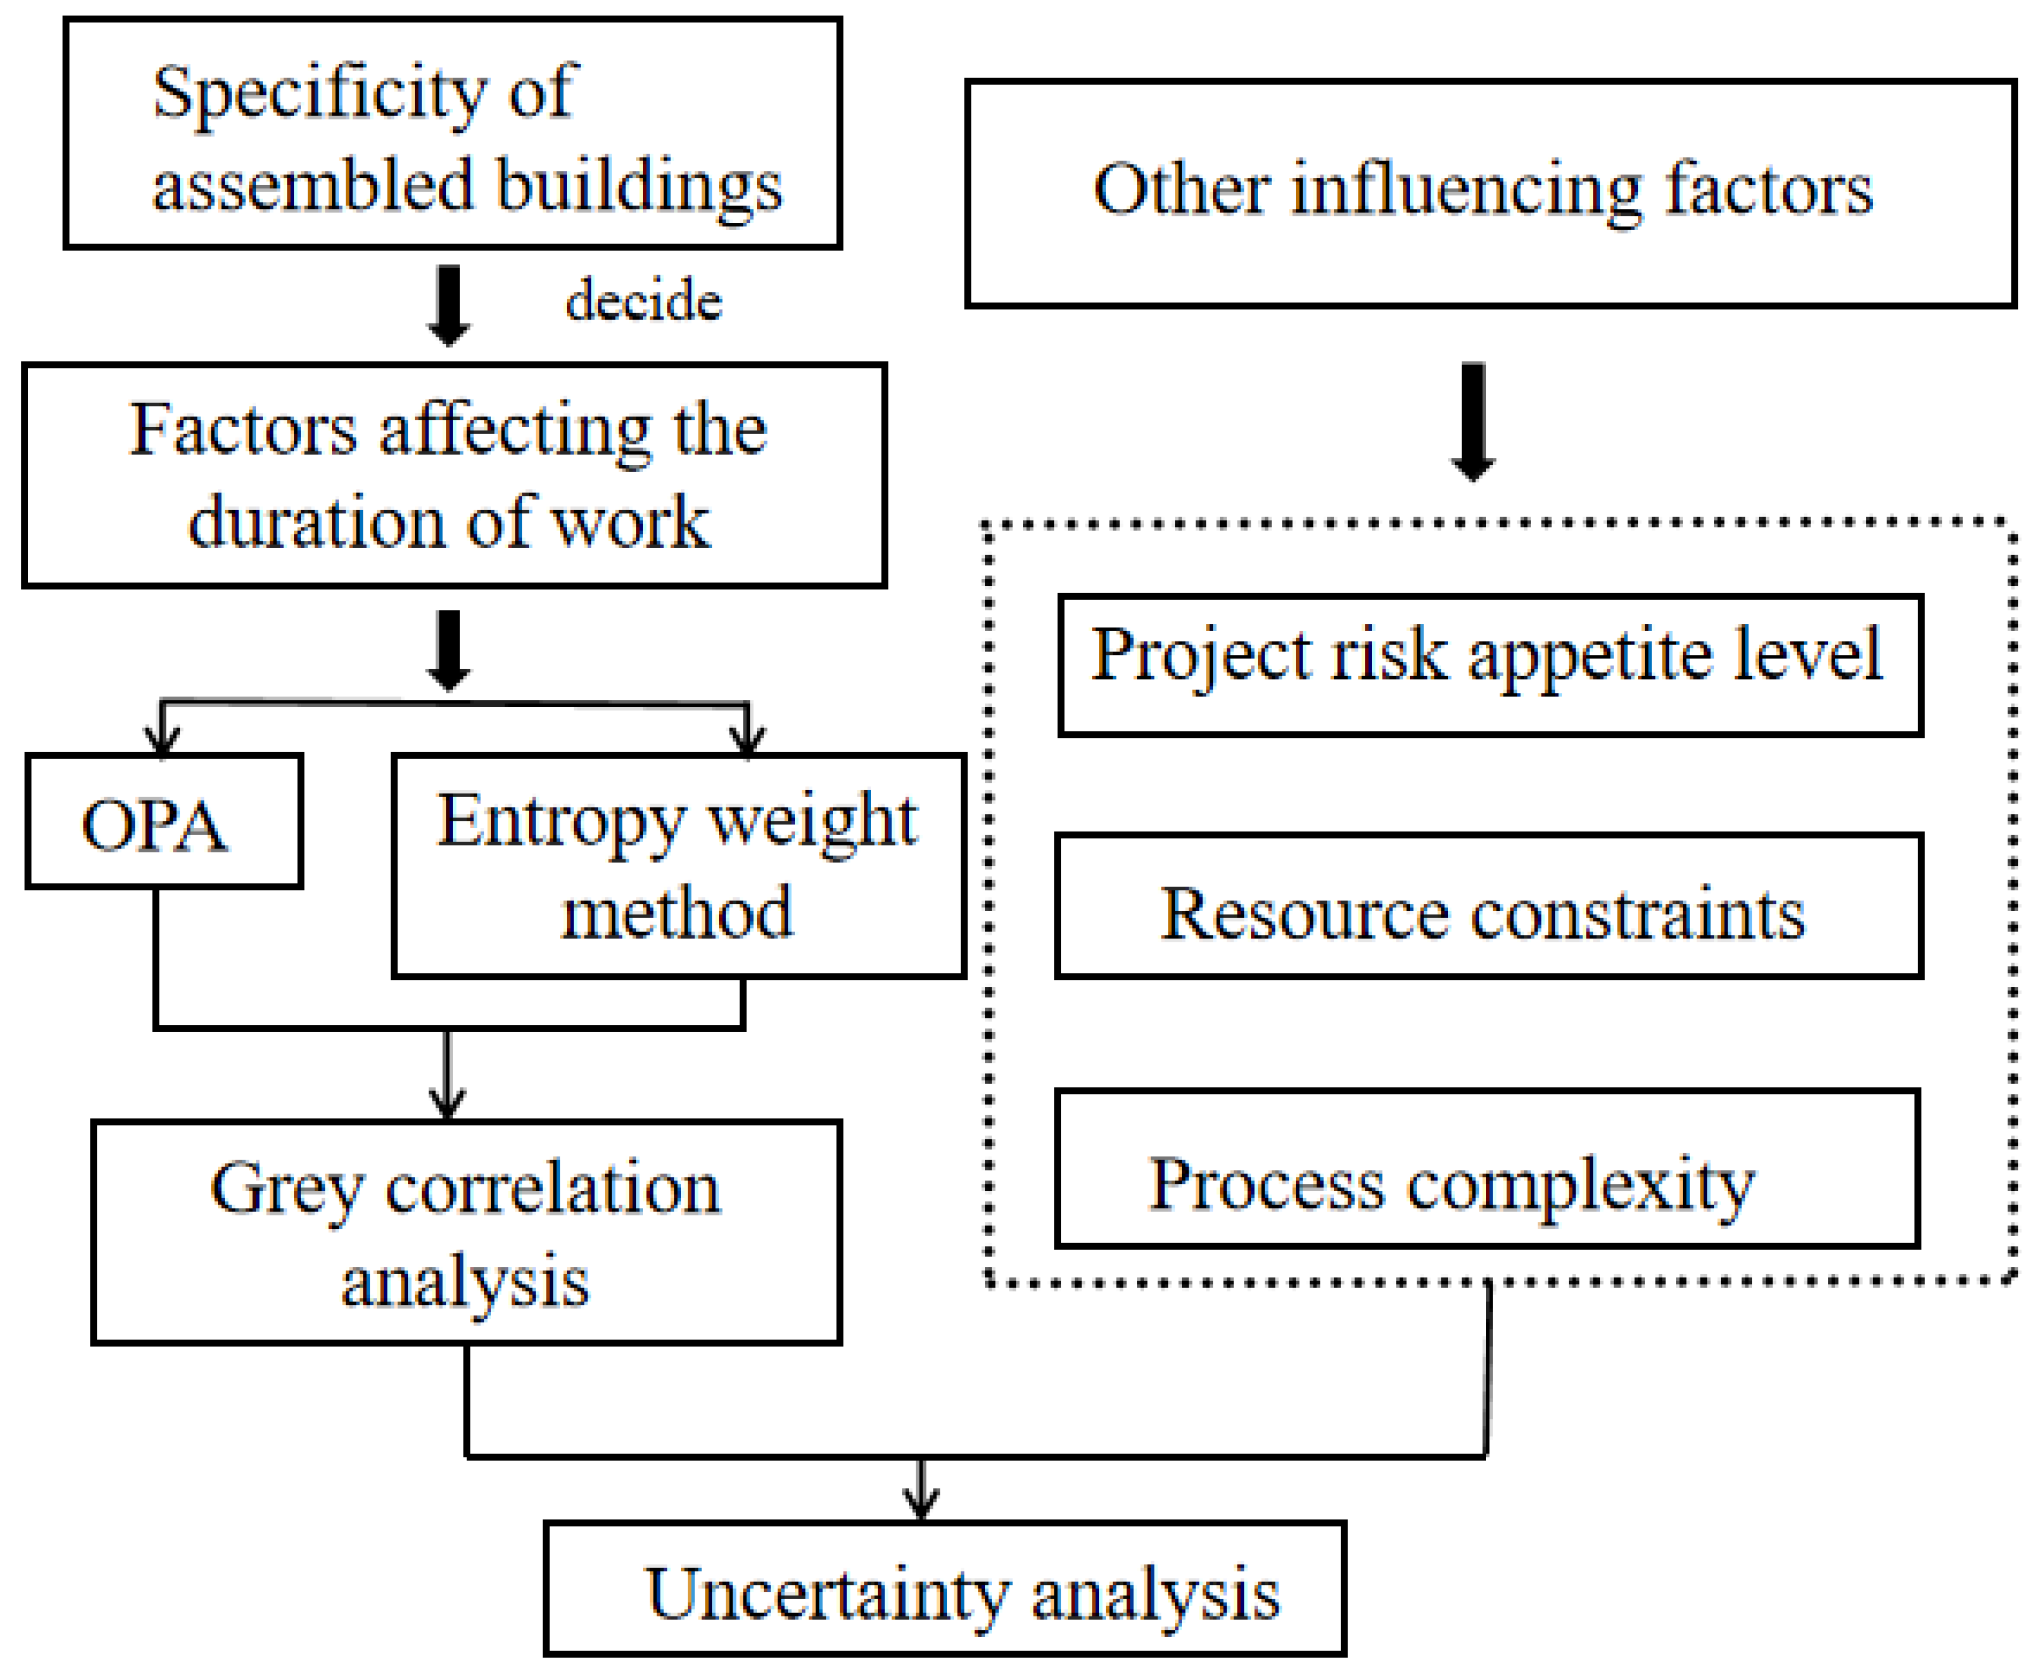
2.2. Determination of Comprehensive Impact Weight Coefficients for the Construction Schedule of Prefabricated Projects

Compared to traditional cast-in-place buildings, assembly buildings are more susceptible to schedule variations due to their unique characteristics. This study searched through various data platforms such as CNKI, Wanfang Library, Web of Science, etc., and identified 306 articles published in the past three years related to “assembly building schedule influencing factors” and “critical chain project management”. Among these articles, 157 were deemed relevant to the optimization of assembly building project schedules. The analysis identified five key influencing factors for the buffer zone size of assembly building projects, which are personnel experience (n1), prefabricated component production degree (n2), technological complexity (n3), construction plan reasonableness (n4), and construction space satisfaction degree (n5) as shown in Table 1.
In order to accurately express the quantitative results of the influencing factors, this paper proposes the joint use of the OPA-entropy weight method to improve the gray correlation analysis method. This allows for the calculation of the weights of the influencing factors and the scientific derivation of the comprehensive weight coefficient ηi.
Gray correlation analysis is an analytical method used to assess the degree of similarity and dissimilarity between factors. It measures the correlation between factors by comparing different situations that have been predetermined [38]. By adjusting the discrimination coefficient according to the weights, gray correlation analysis derives the gray correlation degree δi, which represents the integrated weight coefficient ηi of each process. The calculation steps are as follows:
(1)
Construct a decision matrix. With m processes and n influencing factors, the evaluation of the n influencing factors on the m processes is used to build a decision matrix of size m × n denoted as X Equation (1). The element xmn represents the evaluation value of the nth influencing factor on the mth process.
X = x 11 x 12 x 1 n x 21 x 22 x 2 n x m 1 x m 2 x m n
(2)
Conduct dimensionless transformation. The decision matrix X is transformed to a dimensionless matrix R using the extreme value method, as shown in Equation (2).
R = r 11 r 12 r 1 j r 21 r 22 r 2 j r i 1 r i 2 r i j
(3)
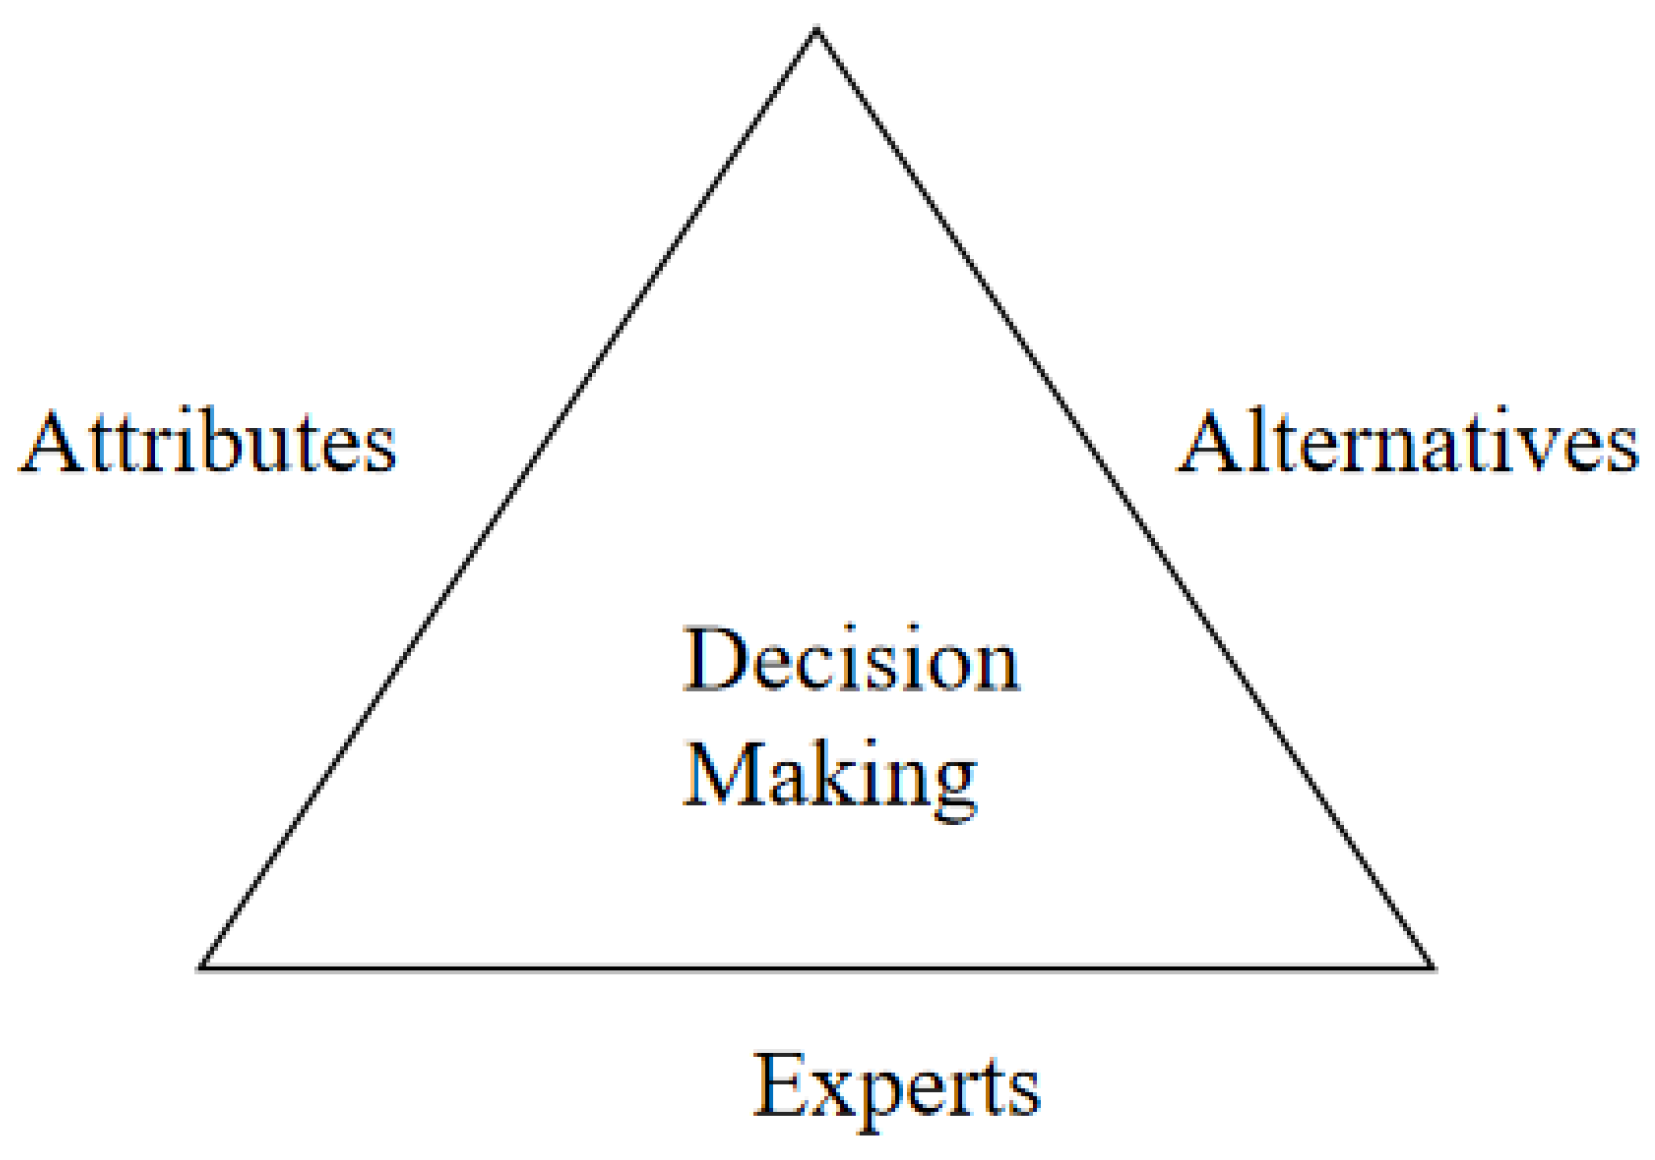
Apply the Ordinal Priority Approach (OPA) for the subjective determination of weights. OPA is a multi-attribute decision-making (MADM) method [32], which solves problems by building a mathematical model. Figure 3 illustrates the decision triangle schematic. This method considers both the numerical weights of the attributes and the ranking of expert opinions to account for the importance of decision schemes. Attribute weights can be derived from expert opinions, making it a subjective method for weight calculation.
To use the OPA method, decision makers must first identify essential criteria and sub-criteria. Experts are then identified and prioritized based on factors such as experience and education. These experts prioritize the criteria and sub-criteria as well as the alternatives within each criterion. Finally, a linear model (3) is constructed from the collected data and solved using MATLAB programming.
Max   Z S . t : Z i j k W i j k k W i j k k + 1           i , j   a n d   k Z i j m W i j k m           i , j   a n d   k i = 1 p j = 1 n k = 1 m W i j k = 1 W i j k 0           i , j   a n d   k
where i represents experts, j represents criteria preferences, and k represents alternatives.
After solving the model, the criterion weights are determined through Equation (4).
W j = i = 1 p k = 1 m W i j k           j
(4)
The entropy weight method [39] determines the weights objectively. The entropy weight method in the entropy value of the amount of information provided to determine the size of the indicator weights, resulting in a more objective weight value. First of all, construct the judgment matrix between the evaluation indicators and the influencing factors, then normalize the judgment matrix, derive the normalized judgment matrix, calculate the indicator entropy value eij and the indicator difference coefficient dj, as shown in Equations (5) and (6). Finally, the indicator entropy weight αj is derived, as shown in Equation (7).
e i j = 1 ln ( m ) i = 1 m p i j ln ( p i j )
d j = 1 e j
α j = d j j = 1 n d j
(5)
Multiplicative synthesis method to determine the integrated weights [40]. The multiplicative synthesis method is used to calculate the combined weight φj of the OPA method and entropy weight method, and the discrimination coefficient ρ and association coefficient εij are calculated as shown in Equations (8)–(10) to obtain the association matrix Y.
φ j = W j α j j = 1 n W j α j
ρ = 1 n i = 1 n j = 1 n r i j ϕ j
ε i j = min i   min j r 0 j r i j + ρ   max i   max j r 0 j r i j r 0 j r i j + ρ   min i   min j r 0 j r i j
(6)
Improve the gray correlation degree δi by multiplying the weights of different factors with the corresponding gray correlation coefficients, i.e., the integrated weight coefficient ηi, as shown in Equation (11).
η i = δ i = j = 1 n ε i ( j ) φ j

2.3. Determination of Other Impact Factors for Assembly Project Duration

There are a number of other factors that can affect schedule during construction of an assembly project. The experience and preferences of project stakeholders can affect schedule planning, and resource constraints and process complexity can also affect buffer size. The tighter the resources and the more complex the links, the larger the project buffer that needs to be set. The buffer size is calculated using project risk appetite level coefficient α, resource tension β and process complexity γ.
(1) Project risk appetite level coefficient α
The project risk appetite level coefficient α is introduced to adjust the 5% delay risk faced by the project when the schedule has a 95% completion guarantee rate, as shown in Equation (12) [41].
α = f 1 ε f 95 %
where f 1 ε denotes the standard deviation multiplier of the project at 1 − ε completion probability, f 95 % = 1.645.
(2) Resource tension β
Whether the resource supply of the work process meets the construction demand is an essential factor affecting the project duration, the resource tension β is used to define the impact of resource tension on the buffer size [42], as shown in Equation (13).
β = max k i r i k R K
where r i k is the demand of activity i for resource K; R K is the total amount of resource K.
(3) Process complexity γ
The more work immediately preceding a process, the greater the uncertainty of the link exists. The process complexity γ is reflected by the complexity of the link where the process is located, and the process complexity γ is determined by synthesizing the number of immediately preceding work of the process and the duration of the process [38], as shown in Equation (14).
γ = n q n Q + t q t Q
where nq, nQ are the number of immediately preceding jobs and the total number of jobs in the link where process i is located, respectively, and tq, tQ are the duration of process i from the beginning of the link where it is located to the beginning of process i and the total duration, respectively.

3. Determination of PB and FB

PB and FB are the key elements to be considered in buffer setting, and PB and FB are usually calculated when buffer setting is carried out. Combining the project risk preference level coefficient, resource tension, process complexity, and comprehensive weight coefficients, the project buffer (PB) and the sink buffer (FB) are improved on the basis of the root-variance method, as shown in Equations (15) and (16).
P B = α i C β γ i ( 1 + η i ) Δ t 2
F B = α i B β γ i ( 1 + η i ) Δ t 2
where C denotes the set of processes on the critical chain, and B denotes the set of processes on the non-critical chain.

4. Case Study

4.1. Assembly Project Engineering Background

An assembly demonstration project [43] is selected, which contains 20 processes. The basic information of the project is shown in Table 2. The resource availability is, respectively, R1: 6, R2: 8, R3: 5, and the planned duration of the project is 57 d.
Adjusting the resource constraint relationship, the two-code network diagram of the project is obtained, as shown in Figure 4, which shows that the critical chains are A-B-C-E-F-G-H-I-L-M-N-O-P-R-S-T, and the non-critical chains are D, Q, Q-J-K.

4.2. Buffer Size Calculation

(1) Create a decision matrix X, as shown in Table 3.
(2) The decision matrix X is dimensionless to obtain the dimensionless matrix R, as shown in Equation (17).
R = 0.636 0.200 0.400 0.625 0.000 0.364 0.000 0.550 0.250 1.000 0.727 0.300 0.850 0.625 0.600 0.727 0.100 0.650 0.125 0.600 0.727 0.400 0.800 0.500 0.300 0.636 0.700 0.950 0.625 0.400 0.727 0.700 0.750 0.875 0.800 0.727 0.600 0.900 0.625 0.500 0.455 0.600 0.900 1.000 0.700 0.727 0.900 0.900 0.750 0.700 0.455 1.000 1.000 0.750 0.300 0.545 0.600 0.900 0.750 0.600 0.818 0.800 0.850 1.000 0.600 0.909 0.700 0.850 0.750 0.100 0.727 0.600 0.800 0.375 0.600 0.455 0.900 0.800 0.000 0.900 0.636 0.400 0.900 0.500 0.100 1.000 0.300 0.600 0.875 0.900 0.000 0.700 0.800 0.375 0.600 0.909 0.100 0.000 0.500 0.400
(3) The OPA method was used to collect data on the ranking of the influencing factors by 25 experts (detailed information can be found in the Supplementary Material), and the results of the calculated weights were as follows: Wj = (0.2452, 0.1676, 0.2272, 0.2229, 0.1370)
(4) According to the steps in Section 2.2 (4), the entropy weight method is used to calculate the entropy weight coefficients of each indicator, resulting in the indicator weight αj = (0.1488, 0.2587, 0.2158, 0.1771, 0.1995)
(5) Gray correlation analysis is used to analyze the correlation between the influencing factors and the process, and the buffer size is calculated according to the steps described in Section 2.2 of this paper, and the project risk preference level coefficient α = 0.951 is derived from Equation (12), and the resource tension β and process complexity γ are calculated according to Equations (13) and (14). The composite weight coefficient φj, the discrimination coefficient ρ, and the correlation coefficient εij are calculated according to Equations (8)–(10), correlation matrix Y, and gray correlation degree δi, and the results are shown in Equation (18) and Table 4.
Y = 0.632 0.439 0.510 0.625 0.385 0.496 0.385 0.582 0.455 1.000 0.696 0.472 0.807 0.625 0.610 0.696 0.410 0.641 0.417 0.610 0.696 0.510 0.758 0.556 0.472 0.632 0.676 0.926 0.625 0.510 0.696 0.676 0.714 0.833 0.758 0.696 0.610 0.862 0.625 0.556 0.534 0.610 0.862 1.000 0.676 0.696 0.862 0.862 0.714 0.676 0.534 1.000 1.000 0.714 0.472 0.579 0.610 0.862 0.714 0.610 0.775 0.758 0.807 1.000 0.610 0.873 0.676 0.807 0.714 0.410 0.696 0.610 0.758 0.500 0.610 0.534 0.862 0.758 0.385 0.862 0.632 0.510 0.862 0.556 0.410 1.000 0.472 0.610 0.833 0.862 0.385 0.676 0.758 0.500 0.610 0.873 0.410 0.385 0.556 0.510
Analyzing and calculating the results of the coefficients derived from Table 4, the project buffer PB and sink buffer FB are, respectively, PB = 4.572 d, FB1 = 0.735 d, FB2 = 1.644 d and FB3 = 3.571 d.
Comparing the modified gray critical chain method of this paper with the traditional cut-and-paste method (C&PM) and root-square error method (RSEM) to derive the buffer sizes, the results are shown in Table 5.
As can be seen from Table 5, the improved grey critical chain method in this paper is able to reduce the buffer size and optimize the assembly project duration compared to the traditional buffer size calculation methods (cut-and-paste method (C&PM) and root-square method (RSEM)).

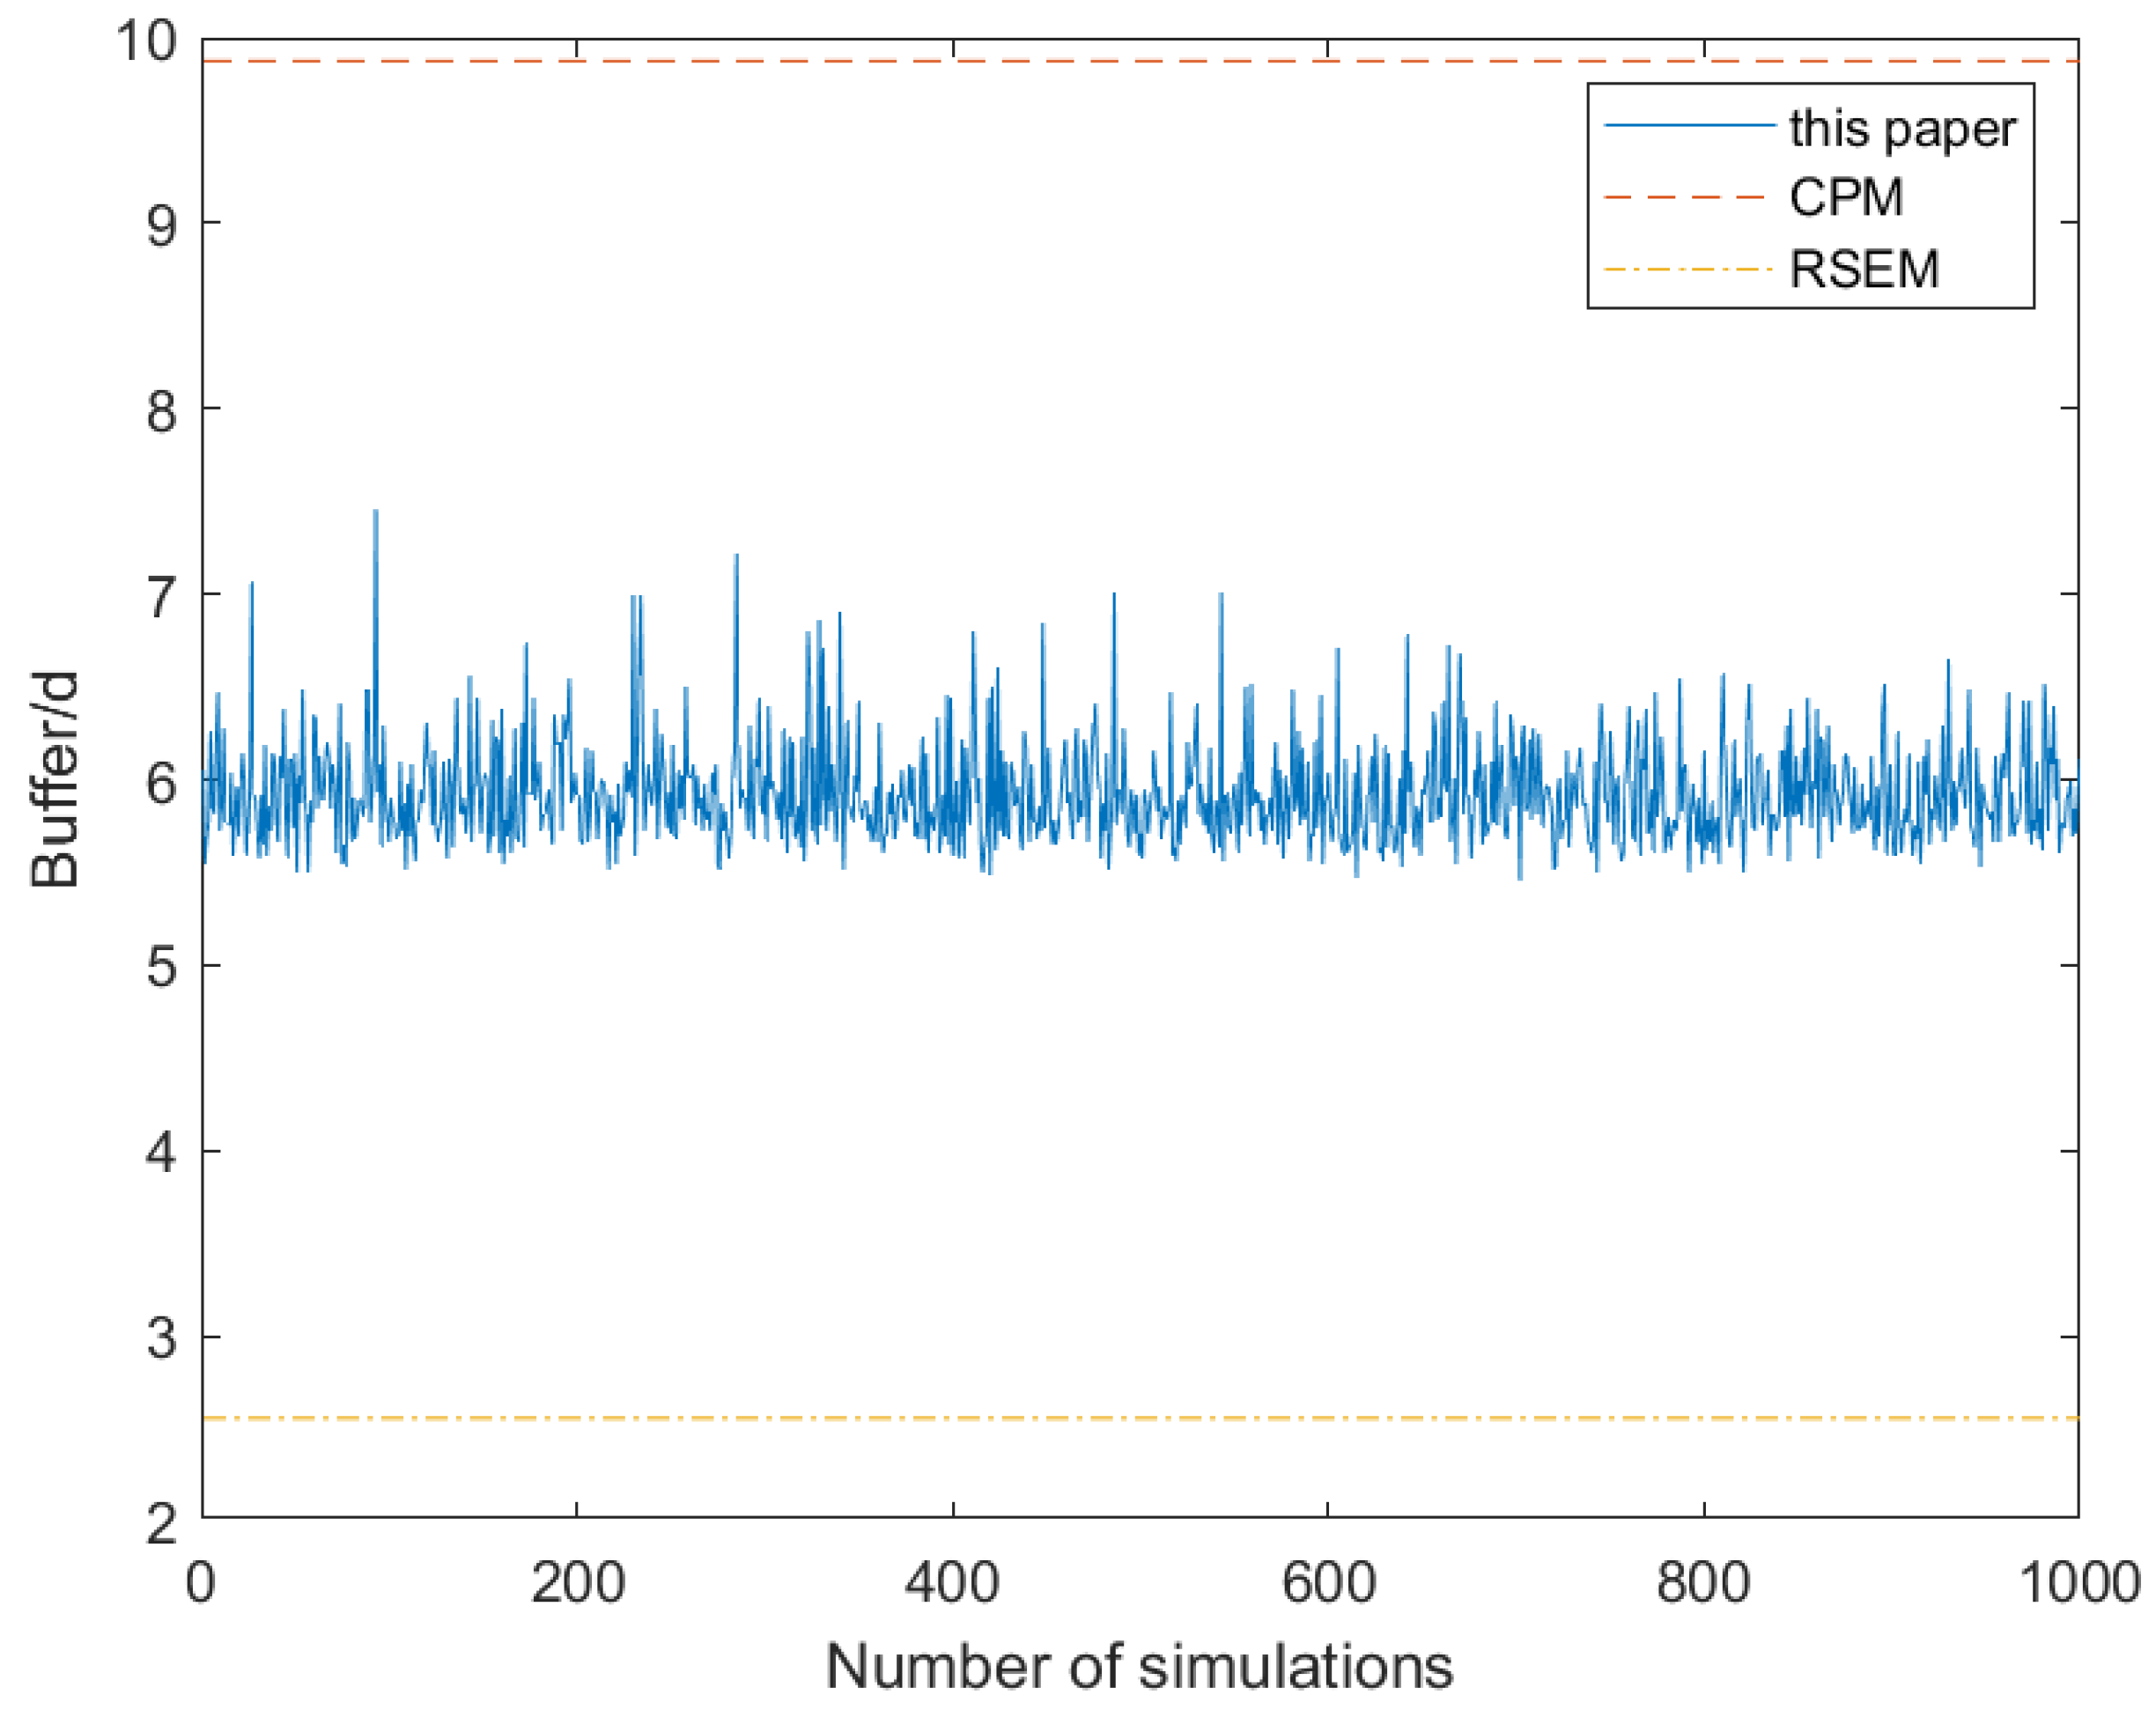
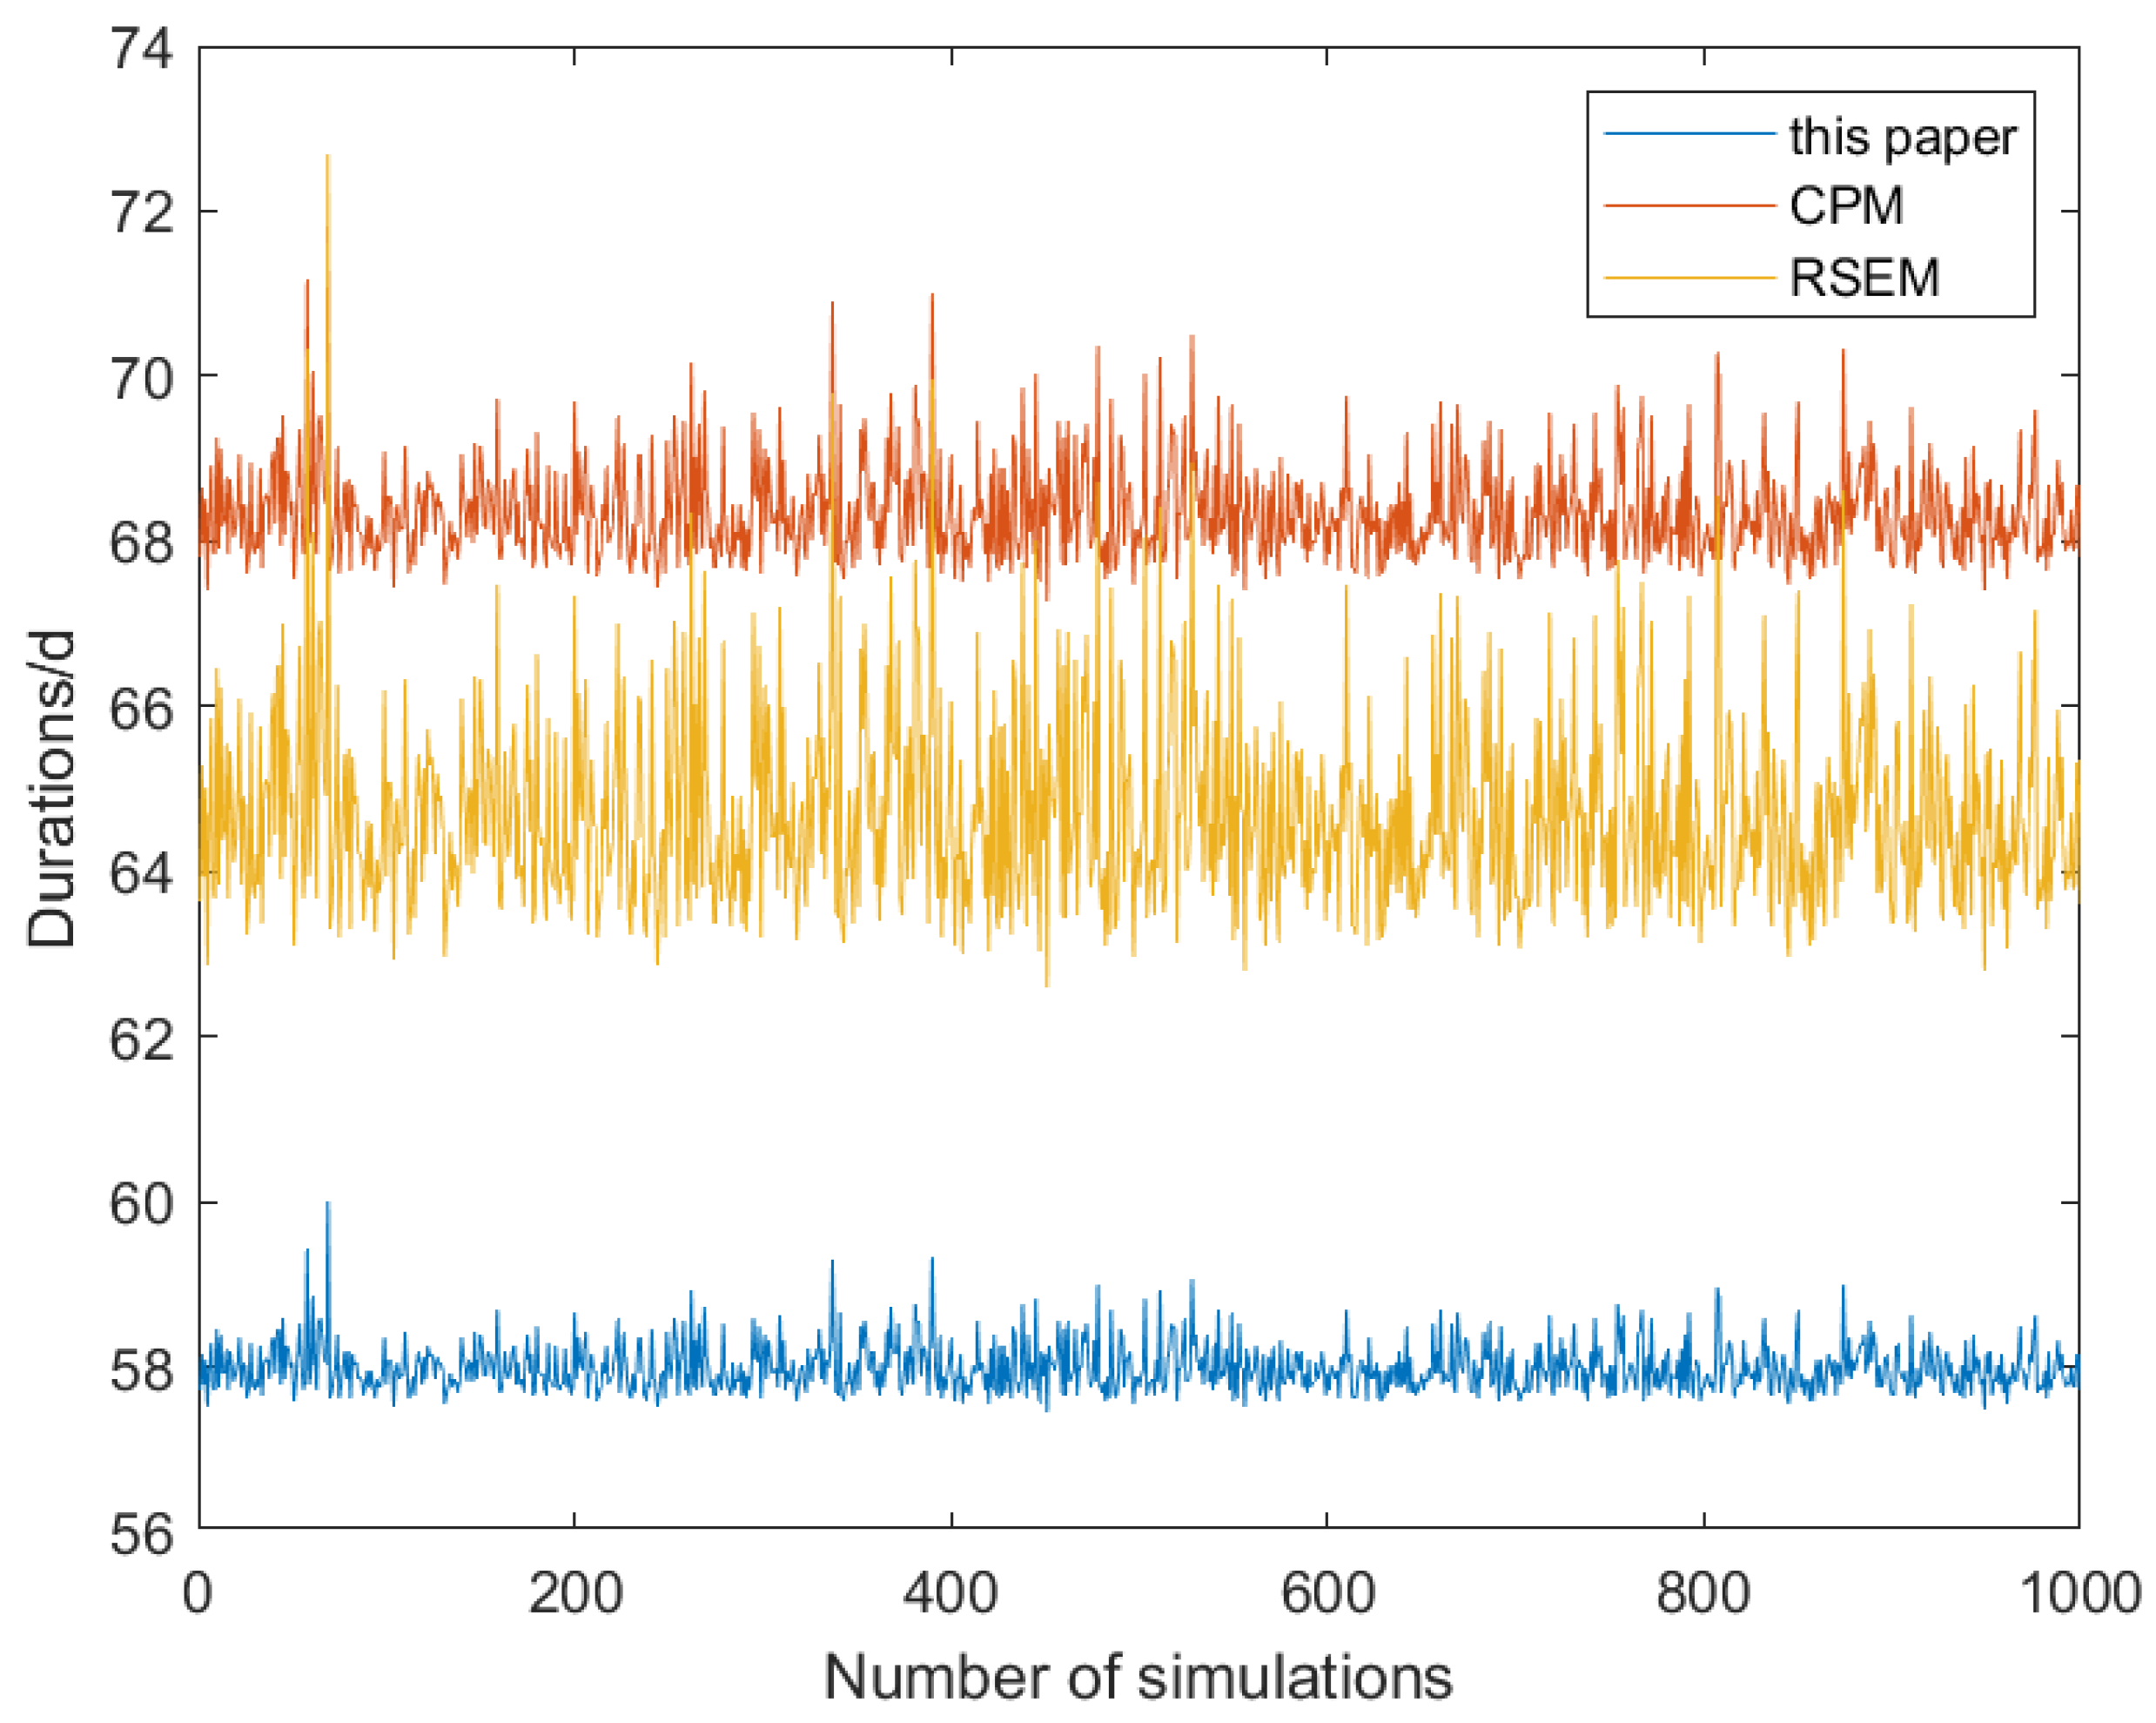
4.3. Monte Carlo Simulation

In order to verify that the buffer size and assembly building project duration derived from the improved grey critical chain method proposed in this paper have an optimization effect, the method of this paper is compared with the traditional project management methods (C&PM and RSEM), and Monte Carlo simulation is carried out using MATLAB 2020, and the number of trials is set to 1000 times. Assuming that the project activity duration obeys the lognormal distribution [44]. x~N(μxx2), then T = lnx, obeys the lognormal distribution, i.e., T~ln(μtt2), Then, μ t = e μ x + 1 2 σ x 2 , σ t = e σ x 2 1 e 2 μ x + σ x 2 , μ x = I n μ t 2 / σ t + μ t 2 , σ x = I n σ t μ t 2 + 1 .
The lognormal distribution random matrix function x = lognrnd(μxx2,1000,1) in MATLAB is utilized to generate the simulated durations for each activity of the project to obtain a 1000 × 16 duration matrix. Based on the results derived from Table 4, 1000 sets of project buffers and durations are calculated and the comparison results are shown in Figure 5 and Figure 6, the analysis results are shown in Table 6.
Analysis of the above results reveals that the buffer size obtained by the method described in this article is lower than that obtained by the C&PM method and higher than that obtained by the RSEM method. Upon analyzing the reasons behind this, it is found that C&PM did not take into account the difficulty level of the process and the impact of uncertain factors. All buffers were set at 50% of the process, resulting in excessive protection of project duration and unnecessary slack in the work of project personnel. The RSEM method sets the buffer zone based on the central limit theorem, assuming that the project processes are independent of each other. However, in actual projects, there are uncertain factors such as human, technical, and management aspects that affect the project duration, thus limiting the applicability of this method. This article’s method considers five factors that influence the project duration in prefabricated construction processes: personnel experience, degree of prefabricated component production, technical complexity, construction scheme rationality, and construction space satisfaction. It also refers to other uncertain coefficients and use the OPA-entropy weighting method to quantify the influencing factors, which can effectively absorb the extension of the project duration caused by uncertain factors and shorten the project duration in line with the actual situation of prefabricated projects.
Based on the simulation results, it can be found that the buffer size obtained by the proposed method is smaller than that of the C&PM method. The overall project duration obtained by the proposed method is 9.66 days less than that of the C&PM method, representing a time save of 14.3%. Compared to the RSEM method, the proposed method results in a time save of 7.68 days, representing a time reduction of 11.7%. Upon analyzing the reasons behind this, it is found that this method considers the impact of student syndrome, avoids unnecessary project duration caused by staff procrastination, and results in a project duration lower than that of the RSEM method. The method proposed in this paper is more reasonable and able to optimize the duration of assembly building projects, which provides a reference for the project management method of the critical chain of assembly buildings.

5. Conclusions

The production technology requirements of prefabricated components for modular construction and the complexity of on-site installation have significantly impacted the progress management process of modular projects. This article considers factors that can affect the construction period in the process of modular construction projects and identifies five key factors. The OPA-entropy method is employed to improve the grey correlation analysis, calculate the comprehensive weight coefficient, determine other influencing factor coefficients, and thereby establish a buffer zone. A method for determining the critical chain project buffer zone for the schedule impact factors of modular construction is proposed. The rationality and feasibility of this buffer zone determination method are validated through Matlab simulation using actual cases.
This article conducts an in-depth analysis of the factors influencing the construction period in the process of modular construction, fully considering the specificity of modular construction. This enhances the rationality of calculating the comprehensive weight of influencing factors and improves the accuracy of buffer zone calculation. It makes the determination of the buffer zone more in line with the actual situation of modular engineering. The combination of OPA technology and the entropy method applied to the field of modular construction avoids the singularity and universality of quantifying influencing factors, pioneering a new method for calculating influencing factor weights. An improved method for determining the buffer zone size is proposed based on the root variance method, overcoming the shortcomings of traditional buffer zone calculation methods C&PM and RSEM. Compared to C&PM and RSEM, the estimated construction period is reduced by 14.3% and 11.7%, respectively. This enhances the accuracy of buffer zone determination, reduces the impact of student syndrome and Parkinson’s law, facilitates the optimization of modular construction buffer zone determination, improves project completion rates, and provides a reference for the critical chain project management method in modular construction.
The proposed method for setting up buffer zones in prefabricated construction presented in this article holds practical significance for the application in actual prefabricated construction projects. It can provide technical support for decision-makers in the management of prefabricated construction projects and can be applied to similar prefabricated construction projects. Currently, research on buffer zones in prefabricated construction projects is relatively limited. Future research should focus on the complexity and diversity of factors affecting the construction period in prefabricated construction projects. New influencing factors should be introduced based on the production, transportation, and installation processes of components to comprehensively assess the uncertainty of the construction period in prefabricated construction projects. In addition, advanced technologies and methods can be applied to the management of prefabricated construction projects. Quantitative and qualitative analyses can be conducted, and appropriate buffer zone models can be designed to predict and assess the likelihood of construction delays. This will enhance the accuracy of buffer zone determination, providing corresponding risk control strategies and response measures. In-depth studies of these aspects will contribute to improving the planning and management levels of prefabricated construction projects, reducing risks associated with construction period uncertainties, and ultimately achieving more efficient and reliable implementation of construction projects.

Supplementary Materials

The following supporting information can be downloaded at: https://www.mdpi.com/article/10.3390/app132413174/s1, A Questionnaire: Survey of Risk Influences on Assembly Building Progress.

Author Contributions

Conceptualization, Q.S.; methodology and validation, J.C.; formal analysis, Z.Y. (Ziyang Ye); investigation, Z.Y. (Zehui Ye); writing—original draft preparation, Z.Y. (Ziyang Ye); supervision, Q.S. All authors have read and agreed to the published version of the manuscript.

Funding

This research received no external funding.

Institutional Review Board Statement

Not applicable.

Informed Consent Statement

Not applicable.

Data Availability Statement

The data presented in this study are available in article and Supplementary Materials.

Acknowledgments

We thank the researchers, Qiao Sun, Ziyang Ye, Zehui Ye for their discussions during the development process of this study.

Conflicts of Interest

The authors declare no conflict of interest.

References

  1. Wallbaum, H.; Ostermeyer, Y.; Salzer, C.; Escamilla, E.Z. Indicator-based sustainability assessment tool for affordable housing construction technologies. Ecol. Indic. 2012, 18, 353–364. [Google Scholar] [CrossRef]
  2. Chang, Y.F.; Ishii, H. Fuzzy multiple criteria decision-making approach to assessing the project quality management in the project. Procedia Comput. Sci. 2013, 22, 928–936. [Google Scholar] [CrossRef]
  3. Zhao, W.H. Discussion on the construction safety risk management of prefabricated residential buildings. Constr. Saf. 2017, 5, 13–15. [Google Scholar]
  4. Du, J.; Jing, H.Q.; Daniel, C.L.; Sugumaran, V. Multi-agent simulation for managing design changes in prefabricated construction projects. Eng. Constr. Archit. Manag. 2020, 27, 270–295. [Google Scholar] [CrossRef]
  5. Wang, S.; Tang, J.; Zou, Y.; Zhou, Q. Research on production process optimization of precast concrete component factory based on value stream mapping. Eng. Constr. Archit. Manag. 2020, 27, 850–871. [Google Scholar] [CrossRef]
  6. Utama, W.P.; Chan, A.P.; Zahoor, H.; Gao, R.; Jumas, D.Y. Making decision toward overseas construction projects. Eng. Constr. Archit. Manag. 2019, 26, 285–302. [Google Scholar] [CrossRef]
  7. Li, X.J. Research on investment risk influence factors of prefabricated building projects. J. Civ. Eng. Manag. 2020, 26, 599–613. [Google Scholar] [CrossRef]
  8. Li, X.; Wang, C.; Kassem, M.A.; Alhajlah, H.H.; Bimenyimana, S. Evaluation Method for Quality Risks of Safety in Prefabricated Building Construction Using SEM-SDM Approach. Int. J. Environ. Res. Public Health 2022, 19, 5180. [Google Scholar] [CrossRef]
  9. Luo, L.Z.; Mao, C.; Shen, L.Y.; Li, Z.D. Risk factors affecting practitioners’attitudes toward the implementation of an industrialized building system. Eng. Constr. Archit. Manag. 2015, 22, 622–643. [Google Scholar] [CrossRef]
  10. Li, Z.; Zhang, S.; Meng, Q.; Hu, X. Barriers to the development of prefabricated buildings in china: A news coverage analysis. Eng. Constr. Archit. Manag. 2021, 28, 2884–2903. [Google Scholar] [CrossRef]
  11. Fard, M.M.; Terouhid, S.A.; Kibert, C.J.; Hakim, H. Safety concerns related to modular/prefabricated building construction. Int. J. Inj. Control Saf. Promot. 2017, 24, 10–23. [Google Scholar] [CrossRef]
  12. Goldratt, E.M. Critical Chain; North River Press: Great Barrington, MA, USA, 1997. [Google Scholar]
  13. Ni, Z.H.; Ma, J.; Yu, J. Research on schedule management of multi-project aerospace power supply products. Proj. Manag. Technol. 2015, 13, 91–97. [Google Scholar]
  14. Zheng, S. Application of Critical Chain in In Vitro Diagnostic Reagent R&D Project Management; University of Chinese Academy of Sciences (School of Engineering Management and Information Technology): Beijing, China, 2014. [Google Scholar]
  15. Anastasiu, L.; Câmpian, C.; Roman, N. Boosting construction project timeline: The case of critical chain project management (CCPM). Buildings 2023, 13, 1249. [Google Scholar] [CrossRef]
  16. You, J.X.; Qin, Y. Critical chain project schedule management based on Bayesian network model. J. Tongji Univ. 2015, 43, 1606–1612. [Google Scholar]
  17. Yu, M.; Xu, N.; Ma, J. An assembly robust project scheduling method based on critical chain technology. J. Shenyang Univ. Archit. 2022, 24, 392–398. [Google Scholar]
  18. Li, S.C.; Wang, Y.C. Research on key chain buffer setting method based on gray correlation. Sci. Technol. Manag. Res. 2013, 33, 203–206. [Google Scholar]
  19. Newbold, R.C. Project Management in the Fast Lane Applying the Theory of Constraints; The St. Lucie Press: Boca Raton, FL, USA, 1998. [Google Scholar]
  20. Tukel, O.I.; Rom, W.O.; Eksioglu, S.D. An investigation of buffer sizing techniques in critical chain scheduling. Eur. J. Oper. 2006, 172, 401–416. [Google Scholar] [CrossRef]
  21. Bie, L.; Cui, N. Study on the buffer size of capability constraints in critical chain multi-project management. Comput. Integr. Manuf. Syst. 2011, 17, 1534–1540. [Google Scholar]
  22. Zhang, J.; Li, Y.; Wan, D. Research on the method of setting resource buffers for critical chain projects based on activity attributes. Soft Sci. 2017, 31, 124–127. [Google Scholar]
  23. Jiang, H.; Peng, Y.; Xie, X. A method for calculating critical chain buffer size based on information and multiple resource constraints. J. Civ. Eng. Manag. 2019, 36, 34–41+47. [Google Scholar]
  24. Huang, J.W.; Wang, Y.K.; Wang, Y.F.; Gong, S.Q.; Zhang, Y.F.; Ye, L.H. Resource flexibility perspective on project schedule management critical chain buffer setting. People’s Chang. 2022, 53, 149–154. [Google Scholar]
  25. Faria, J.; Araújo, M.; Demeulemeester, E.; Tereso, A. Project management under uncertainty: Using flexible resource management to exploit schedule flexibility. Eur. J. Ind. Eng. 2020, 14, 599–631. [Google Scholar]
  26. Zarghami, S.A.; Gunawan, I.; de Zubielqui, G.C.; Baroudi, B. Incorporation of resource reliability into critical chain project management buffer sizing. Int. J. Prod. Res. 2020, 58, 6130–6144. [Google Scholar] [CrossRef]
  27. Ma, G.F.; Wu, M.; Hao, K.K.; Shang, S. A DSM-based CCPMMPL representation method for project scheduling under rework scenarios. Adv. Civ. Eng. 2021, 10, 1. [Google Scholar]
  28. Li, S.; Wang, Y.; Duan, Y. Buffer Setting Method Based on Gray Evaluation. Stat. Decis. Mak. 2014, 15, 70–72. [Google Scholar]
  29. Zhang, J.; Zhou, S. Research on uncertainty-based buffer determination method for critical chain projects. Ind. Technol. Econ. 2021, 40, 154–160. [Google Scholar]
  30. Zhao, B.; Zhong, C. Research on the influencing factors of progress control of assembly building based on ISM. J. Jilin Univ. Archit. 2022, 39, 56–64. [Google Scholar]
  31. Li, J.; Liu, T.; Zhang, J. Critical chain buffer setting method based on FAHP. Proj. Manag. Technol. 2013, 11, 69–73. [Google Scholar]
  32. Ataei, Y.; Mahmoudi, A.; Feylizadeh, M.R.; Li, D.-F. Ordinal Priority Approach (OPA) in Multiple Attribute Decision-Making. Appl. Soft Comput. J. 2020, 86, 105893. [Google Scholar] [CrossRef]
  33. Mahmoudi, A.; Abbasi, M.; Deng, X. A novel project portfolio selection framework towards organizational resilience: Robust Ordinal Priority Approach. Expert Syst. Appl. 2022, 188, 116067. [Google Scholar] [CrossRef]
  34. Mahmoudi, A.; Abbasi, M.; Yuan, J.; Li, L. Large-scale group decision-making (LSGDM) for performance measurement of healthcare construction projects: Ordinal Priority Approach. Appl. Intell. 2022, 52, 13781–13802. [Google Scholar] [CrossRef] [PubMed]
  35. Abdel-Basset, M.; Mohamed, M.; Abdel-Monem, A.; Elfattah, M.A. New extension of ordinal priority approach for multiple attribute decision-making problems: Design and analysis. Complex Intell. Syst. 2022, 8, 4955–4970. [Google Scholar] [CrossRef]
  36. Mahmoudi, A.; Deng, X.; Javed, S.A.; Zhang, N. Sustainable supplier selection in megaprojects: Grey ordinal priority approach. Bus. Strat. Environ. 2021, 30, 318–339. [Google Scholar] [CrossRef]
  37. Hu, C.; Xu, Z.; Yu, J. Critical chain buffer size calculation method based on duration distribution and multi-resource constraints. J. Syst. Manag. 2015, 24, 237–242. [Google Scholar]
  38. Lin, P. Research on Supplier Evaluation Based on Topologizable Hierarchical Analysis and Gray Correlation Method; Hefei University of Technology: Hefei, China, 2016. [Google Scholar]
  39. Zhang, J.Y.; Lv, S.R.; Zhang, Y.D. Fire risk level evaluation of ancient buildings based on WSR-entropy weighted object element topable model. Saf. Environ. Eng. 2020, 27, 126–131. [Google Scholar]
  40. Xie, L.F. Research on Assembly Multi-Project Schedule Planning And Control Based on Critical Chain; Xi’an University of Architecture and Technology: Xi’an, China, 2020. [Google Scholar]
  41. Chu, C.C. Buffer estimation and critical chain project management. Comput. Integr. Manuf. Syst. 2008, 14, 1029–1035. [Google Scholar]
  42. Jiang, H.Y.; Xie, X.H.; Peng, Y. Key chain-based PERT improvement model for assembled buildings and its application. Ind. Eng. Manag. 2018, 23, 82–87+94. [Google Scholar]
  43. Liu, Z.P. Research on the Optimization of Construction Schedule of Assembly Building Based on Improved Critical Chain Method; Changsha University of Technology: Changsha, China, 2021. [Google Scholar]
  44. Fallah, M.; Ashtiani, B.; Aryanezhad, M.B. Critical chain project scheduling: Utilizing uncertainty for buffer sizing. Int. J. Res. Rev. Appl. Sci. 2010, 3, 280. [Google Scholar]
Figure 1. Improvement of the critical chain buffer size calculation process.
Applsci 13 13174 g001
Figure 2. Probability distribution of process duration.
Applsci 13 13174 g002
Figure 3. Key components of decision-making.
Applsci 13 13174 g003
Figure 4. Critical chain project network diagram.
Applsci 13 13174 g004
Figure 5. Comparison of the buffer size of the project between this method and traditional methods.
Applsci 13 13174 g005
Figure 6. Comparison of simulation duration between this method and traditional methods.
Applsci 13 13174 g006
Table 1. List of factors identified as influencing the schedule of assembly buildings.
Type of FactorFactors
Personnel factorLack of experienced workers U1
Inadequate safety precautions U2
Ineffective staffing U3
Material factorUntimely transportation of prefabricated components U4
Prefabricated production inefficiencies U5
Unreasonable stacking on site U6
Technical factorDifficult construction U7
Failure of machinery and equipment U8
Technical complexity U9
Management factorUntimely joining of work processes at the construction site U10
Poorly designed construction program and construction schedule U11
Inadequate coordination of on-site movement control U12
Environmental factorPolicies and regulations U13
Insufficient construction space U14
Force majeure U15
Table 2. Basic information of prefabricated demonstration project.
Process NumberProcess NamePre-Immediate WorkDuration
(a, m, b)
Estimated TimeResource Requirements
R1R2R3
AConstruction Preparation (1, 2.5, 3.5)2.5120
BMeasuring and placing linesA(2, 2.5, 4)2.5220
CLifting of prefabricated exterior wall panelsB(3.5, 4, 5.5)4.5464
DInstallation of diagonal brace correctionC(1.5, 2, 4)2235
ECast-in-place shear wall and column reinforcement tyingB(3, 3.5, 4.5)3.5340
FCast-in-place shear wall and column support formworkE(2, 3.5, 4.5)3.5330
GErection of floor and laminated balcony slab formwork and row frameD, F(1, 1.5, 3)1.5340
HCast-in-place beam reinforcement tying and modelingG(2.5, 3.5, 4.5)3.5220
IFormwork support for post-cast zoneH(1, 1.5, 3)1.5210
JPrefabricated laminated panels liftingG(2, 3.5, 4.5)3.5355
KPrefabricated shaped components liftingJ(1.5, 2.5, 4)2.5335
LTying of reinforcement at wall panel jointsI(1, 1.5, 3)1.5231
MFormwork erection at wall panel jointsL(1, 1.5, 3)1.5221
NPlumbing and electrical installationM(1.5, 2.5, 3.5)2.5220
OBeam and slab face reinforcement tyingN(1, 1.5, 3)1.5230
PConcrete pouring and maintenance of cast-in-place partsO(2, 3.5, 4.5)3.5220
QPrefabricated staircase liftingG(3, 4.5, 6)4.5354
RScaffolding and row frame removalK, Q(1, 1.5, 3)1.5200
SHigh-strength grouting constructionR(2, 3.5, 4.5)3.5464
TInspection and acceptanceS(0.5, 1, 2)1110
Table 3. Decision matrix X.
Work Sequencen1n2n3n4n5
A42.42.43.43
B3.4232.85
C4.22.64.23.44.2
D4.22.23.42.64.2
E4.22.843.23.6
F43.44.63.43.8
G4.23.43.83.84.6
H4.23.24.43.44
I3.63.24.444.4
J4.23.84.43.64.4
K3.644.83.63.6
L3.83.24.43.64.2
M4.43.64.244.2
N4.63.44.23.63.2
O4.23.2434.2
P3.63.842.44.8
Q42.84.43.23.2
R4.82.63.23.84.8
S2.63.4434.2
T4.62.20.83.23.8
Table 4. Results of calculation of coefficients.
Work Sequenceδi t i 50 % t i 95 % σβγ
A0.517 2.382 3.146 0.7640.2500.000
B0.582 2.775 3.613 0.8370.3330.134
C0.641 4.275 5.113 0.8370.8000.205
D0.554 2.419 3.500 1.0811.0000.334
E0.597 3.634 4.226 0.5920.5000.205
F0.673 3.382 4.146 0.7640.5000.305
G0.735 1.775 2.613 0.8370.5000.496
H0.669 3.500 4.184 0.6840.3330.477
I0.736 1.775 2.613 0.8370.3330.577
J0.761 3.382 4.146 0.7641.0000.477
K0.743 2.631 3.567 0.9361.0000.577
L0.674 1.775 2.613 0.8370.3750.620
M0.789 1.775 2.613 0.8370.3330.663
N0.695 2.500 3.184 0.6840.3330.705
O0.634 1.775 2.613 0.8370.3750.777
P0.679 3.382 4.146 0.7640.3330.820
Q0.593 4.500 5.526 1.0260.8000.477
R0.755 1.775 2.613 0.8370.3330.954
S0.584 3.382 4.146 0.7640.8000.934
T0.546 1.134 1.726 0.5920.1671.034
Table 5. Comparison of three buffer size calculation methods.
PB (d)FB1 (d)FB2 (d)FB3 (d)
Traditional MethodsC&PM9.8752.8755.6257.125
RSEM2.6781.5162.2332.478
Modified grey critical chain method4.5720.7351.6443.571
Table 6. Comparison of simulation results.
Simulation ValueDifference in Value
C&PMRSEMImprovement of the Gray Critical Chain MethodCompare to C&PMCompare to RSEM
d%d%
Buffer/d9.8752.6784.572−5.303-1.707-
Durations/d67.6265.6457.96−9.66−14.3%−7.68−11.7%
Disclaimer/Publisher’s Note: The statements, opinions and data contained in all publications are solely those of the individual author(s) and contributor(s) and not of MDPI and/or the editor(s). MDPI and/or the editor(s) disclaim responsibility for any injury to people or property resulting from any ideas, methods, instructions or products referred to in the content.

