Article

Airport Pavement Maintenance Decision-Making System with Condition Cases Optimization

1
Department of Smart Cities, Chung-Ang University, 84 Heukseok-ro, Seoul 06974, Republic of Korea
2
Korea Advanced Institute of Science and Technology, Cho Chun Shik Graduate School of Mobility, 193 Munji-ro, Daejeon 34051, Republic of Korea
3
Department of Transportation and Communications, University of Shanghai Maritime, 1550 Haigang Ave., Shanghai 201306, China
*
Author to whom correspondence should be addressed.
Appl. Sci. 2023, 13(24), 13167; https://doi.org/10.3390/app132413167
Submission received: 29 October 2023 / Revised: 30 November 2023 / Accepted: 5 December 2023 / Published: 11 December 2023
(This article belongs to the Section Civil Engineering)

Abstract

:
The successive growth of the aviation industry has progressively heightened the importance of airport pavement management systems. Existing research has primarily focused on the technological advancements of optimization models, with limited applicability in practice. In this study, we introduce condition cases optimization (CCO) to address these limitations while incorporating multi-facility and multi-year network optimization models. We developed condition index, serviceability level, integrated assessment indices and performance models for decision-making criteria. As a result, a practical decision-making strategy was proposed which can flexibly reflect budget constraints. Sensitivity analysis highlighted the impact of initial budget, maintenance methods, costs, and thresholds on decision outcomes. Using a case study, we validated the effectiveness and practicality of the CCO method as an efficient decision-making tool.

1. Introduction

The aviation industry has witnessed remarkable growth, leading to an increasing demand for airport facilities and services. As airports expand and operate under higher traffic volumes, the importance of effective maintenance management becomes more pronounced. Meeting the demands of various stakeholders while optimizing resource allocation presents a complex challenge. Previous research has mainly concentrated on advancing optimization models, often overlooking their applicability in real-world scenarios.
The primary objective of the airport pavement maintenance decision-making system is to efficiently maintain or improve pavement conditions within a limited budget. This not only ensures user safety but also extends the overall lifespan of the pavement, resulting in cost savings. Airport management entities strive to establish effective maintenance strategies to balance short-term requirements and long-term sustainability.
The Federal Aviation Administration (FAA) provides guidance for individual airport management entities to develop their pavement management systems [1], with most management organizations applying FAA guidelines as the basis for their procedures. Korea Airports Corporation maintains and manages the pavements of 15 domestic and international airports in the country. Maintenance methods and time are determined based on functional factors such as pavement surface distress, skid resistance, and longitudinal profile. Additionally, structural stability assessments are conducted to determine remaining life of the pavement and allowable loads for aircraft. However, a challenge arises from the separation of functional and structural assessments within the decision-making process, as well as the absence of evaluation indices reflecting each country’s environmental conditions. The pavement condition index (PCI), widely used in most countries, has limitations in explaining structural damage phenomena, such as blow-ups, which have been a concern in Korean pavements over the past decade. Furthermore, the estimation of remaining service life is based on “the past damage” concept, which is the ratio of accumulated traffic volume to the allowable load repetitions, leading to limitations in determining maintenance methods based on functional assessment and timing based on structural evaluation. When the structural remaining lifespan is less than 5 years (Level I), immediate maintenance is deemed necessary, and for cases between 5 and 10 years (Level II), continuous monitoring and maintenance planning are required. For cases exceeding 10 years (Level III), a long-term maintenance plan is established. In this process, a comprehensive assessment is performed based on functional evaluation factors, including visual inspections and lab tests, to justify the maintenance plan. It is observed that the emphasis is more on qualitative and subjective judgments rather than consistent linkage between pavement condition, predicted performance, and budget conditions at the assessment stage.
It is essential to recognize that the challenges faced in Korean airport pavement management are not unique to this context. Budget allocation issues are closely linked to national policies, and implementing maintenance based solely on optimization analysis results is difficult to accept practically. Additionally, the nature of public servant systems, which tend to maintain existing regulations and practices, makes it challenging to create an environment where the effectiveness of budget allocation can be clearly evaluated relative to the budget invested.
From a technical perspective, improvements are also necessary. Decision-making systems must compare costs and associated effects for each maintenance method, which can be challenging due to the difficulty of quantifying environmental factors, traffic closure times, user satisfaction, and other non-monetary elements consistently.
Despite the academic advancements in optimization technology, practical airport pavement management systems have not progressed significantly. In this paper, we first examine the underlying reasons for this situation and then aim to develop a decision-making system that can flexibly adapt to the spectrum of budgets. Considering the difficulty of rapid changes in annual budgets for individual airports and the need for equitable budget allocation, our system is designed to address these challenges. Secondly, we seek to improve the decision-making system by enhancing each stage’s component model, including evaluation indices, performance curves, cost, effects, and optimization models. Our goal is to elevate the system’s theoretical validity and rationality using academic research outcomes while simultaneously meeting the practical needs of airport managers.
The key components of pavement management systems are the evaluation of pavement conditions and the decision-making process regarding maintenance methods and timing. The dominant airport pavement evaluation index is the PCI, developed by the United States Corps of Engineers in the 1980s [2]. The FAA utilizes the structural condition index (SCI) as part of the PCI, which is associated with structural deterioration, including rutting and alligator cracking. In addition, functional evaluations encompass longitudinal profile, skid resistance, and the PCI excluding the SCI to assess functional performance [3]. Y. Hachiya [4] introduced the pavement rehabilitation index (PRI) as a Japanese airport pavement evaluation index, adopting cracking, rutting, and profile as key factors.
Delft University of Technology in the Netherlands emphasizes the equal importance of functional and structural pavement performance. They evaluate functional performance using PCI, profile, and skid resistance, and adopt the pavement classification number (PCN) method and remaining life analysis as alternatives for assessing structural performance [5]. Amsterdam Airport, Belgium, and Italy have adopted the PCN method only [6]. The aircraft classification number and pavement classification number system (ACN-PCN system, currently changed to ACR-PCR, where R stands for rating) was developed to assess aircraft operational suitability, explicitly stating that it cannot be used as an evaluation basis for design and maintenance decisions [7].
Pavement performance models have been developed using different modeling methods, including mathematical methods, soft computing methods, and hybrid models combining both [8]. The Markov chain method stands out as one of the most widely used approaches. Its advantage lies in its ability to analyze with limited data. Experts can estimate pavement condition change probabilities based on knowledge and experience [9]. Examples of applying the Markov chain method in pavement management include a 1982 study by Golabi et al. on optimal maintenance method determination for Arizona state roads [10].
Traditional methods such as ranking have been used to prioritize decisions for maintenance [11], and the decision tree method was introduced by Darter et al. in 1985 [12]. There are cases applying decision models with multivariate variables [13], and the analytic hierarchy process (AHP) technique, which determines importance through pairwise comparisons [14]. The worst-fit method, prioritizing higher rankings as conditions worsen, is relatively straightforward and intuitive, but has limitations in overall improvement of the entire management target [12]. Since the 2010s, there has been a trend in developing priority models using artificial intelligence technology and GIS-based approaches [15]. When using optimization models, the prevalent approach for airport pavement is to estimate individual damage over time and traffic volume and derive an integrated index, rather than using the former method.
Linear programming has been used in pavement management since its introduction in the late 1980s [16] and continues to be employed [17]. Integer linear programming has been predominantly used, offering the advantage of shorter calculation times due to its relatively simple modeling [18,19,20]. Yanfeng Ouyang [19] introduced mixed-integer nonlinear programming (MINLP) and expanded it from single to multiple facilities. Hwasoo Yeo [21] also attempted to develop optimization models for multi-facilities using a bottom-up approach. Unlike the models mentioned earlier, they defined costs with expected cost-to-go (ECT). Lee [22] proposed an effective dynamic programming solution for optimizing reconstruction intervals jointly with maintenance and surface treats, using discrete approximation method and parametric approximation method.
The literature review revealed a lack of decision-making systems that comprehensively consider both functional and structural aspects of pavement. While research on decision methodologies has been ongoing, it has been challenging to find examples that link evaluation indices, costs, and effects by pavement type. This identified the need to improve the component models necessary for the step-by-step analysis of decision-making systems, including optimization methods. Furthermore, we aimed to validate the applicability through case studies using actual pavement evaluation data.

2. Airport Pavement Management System Architecture

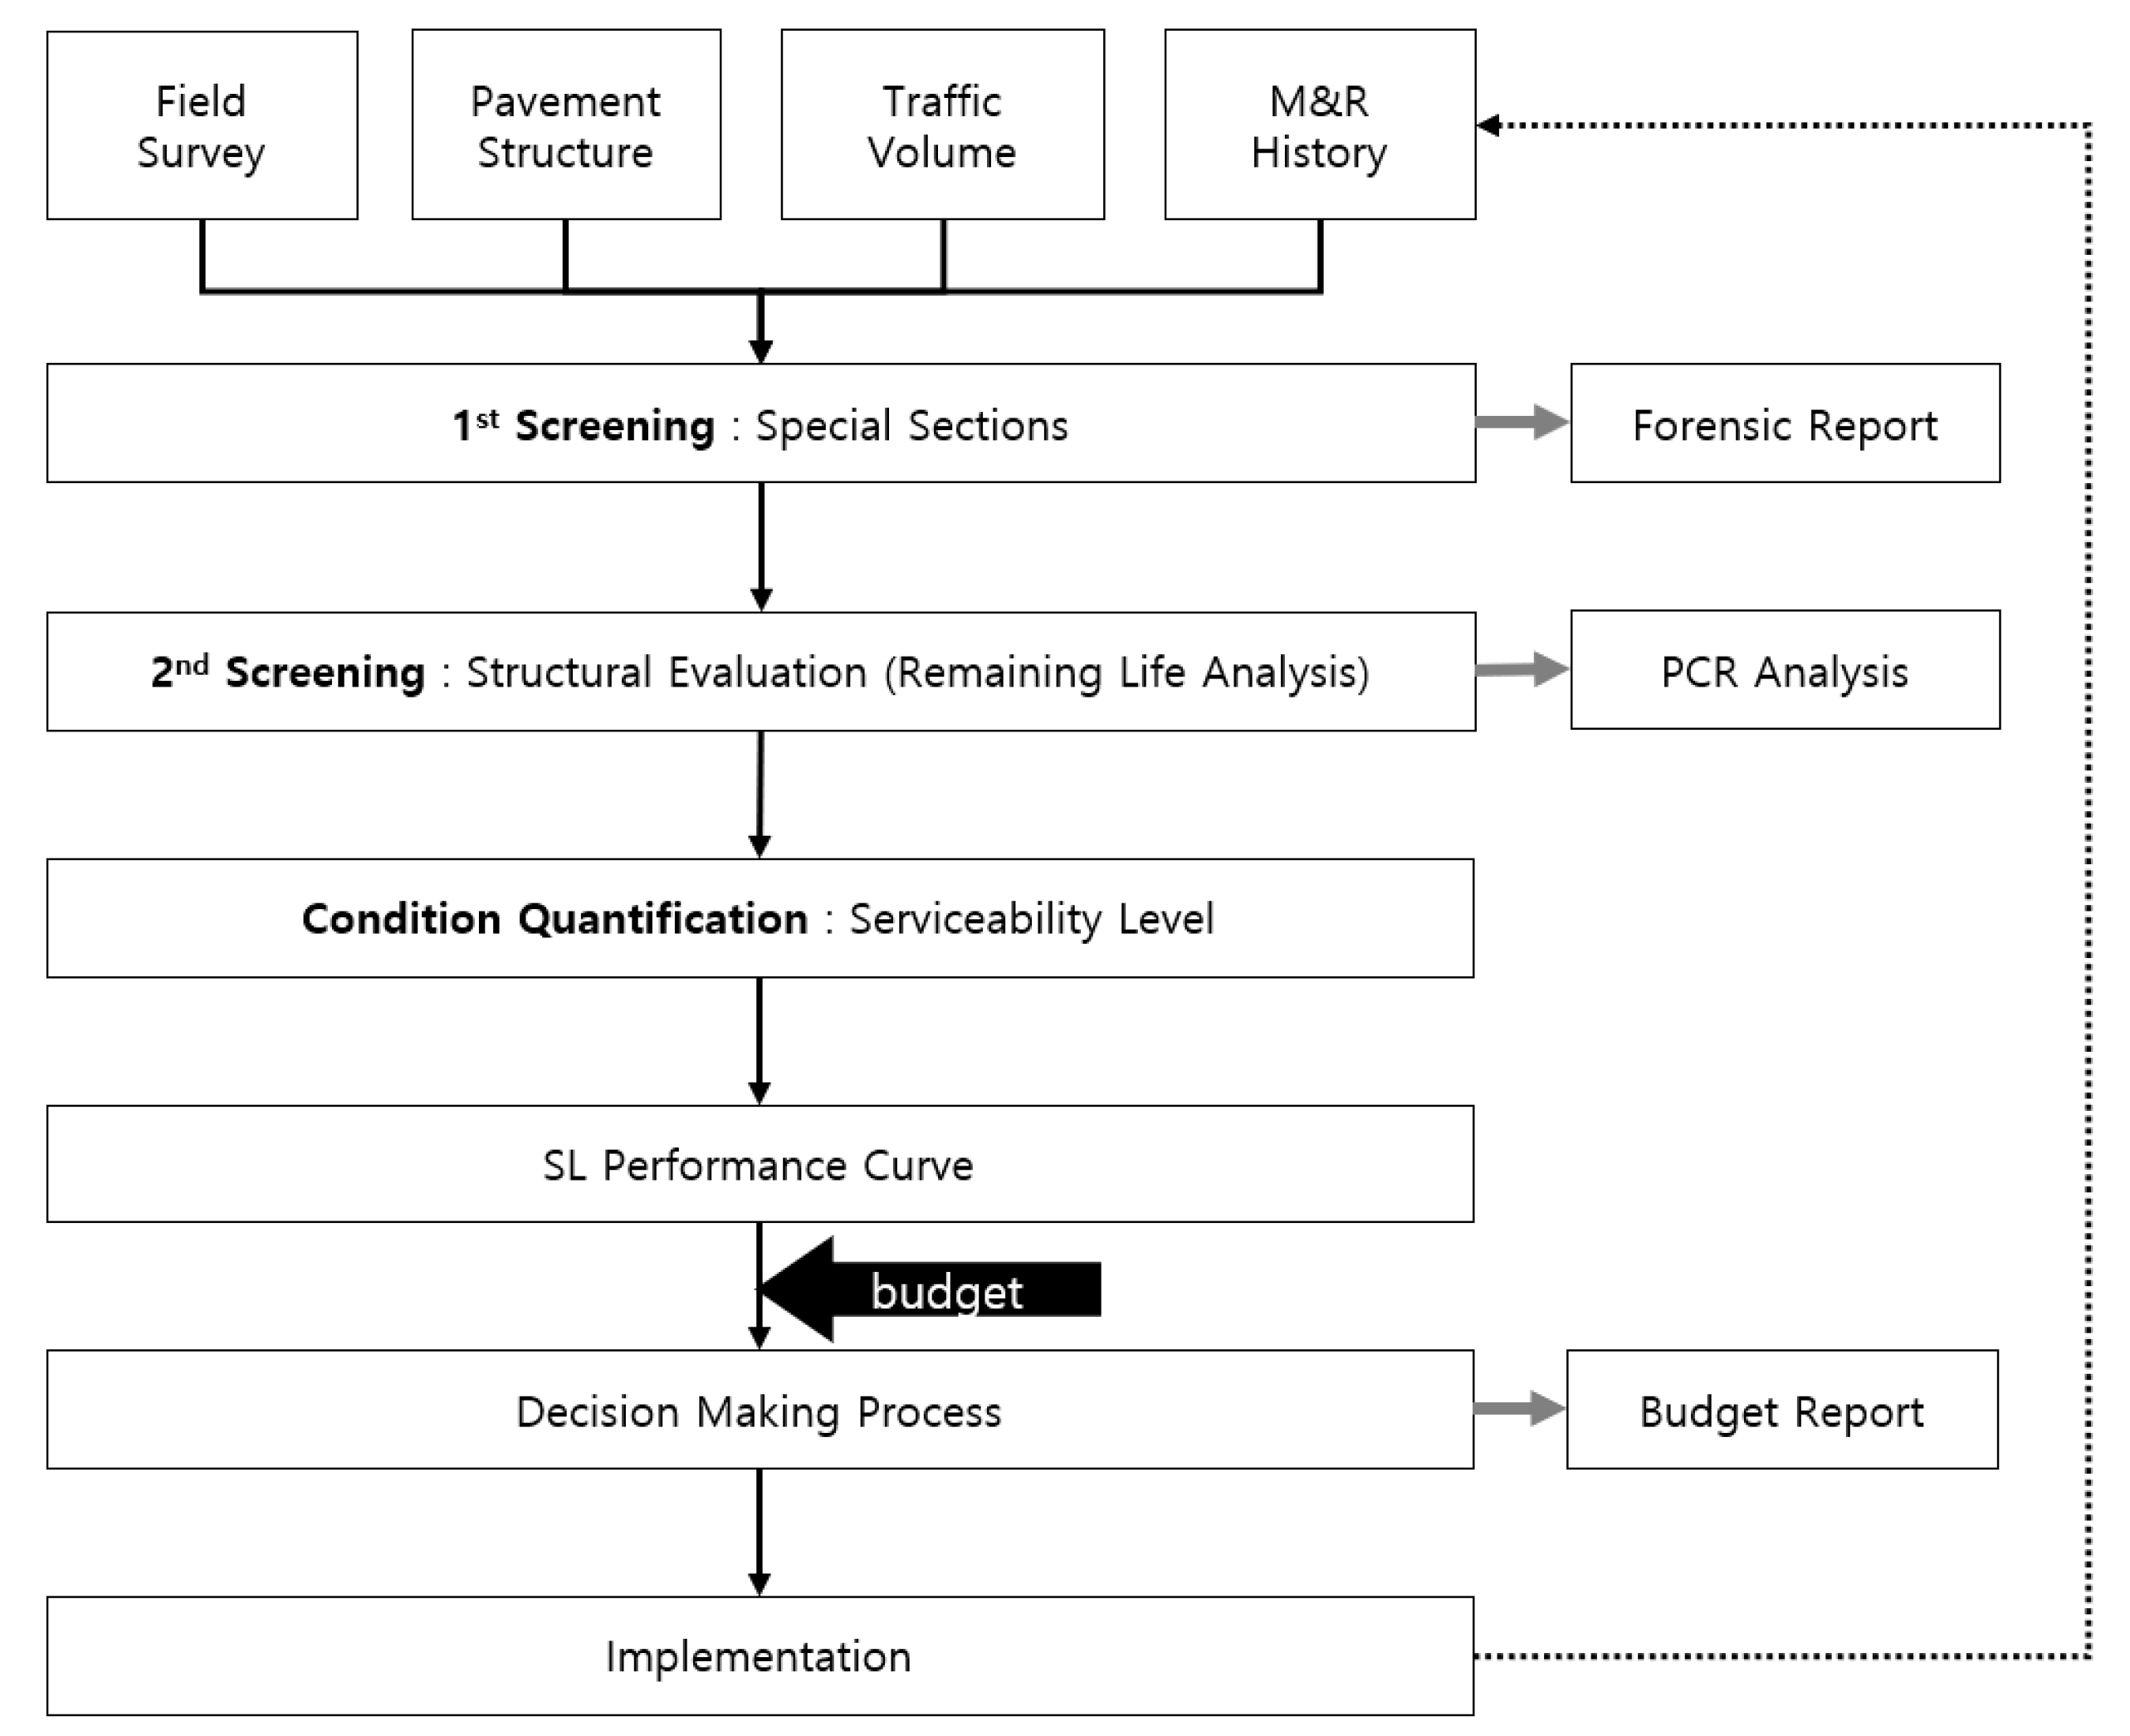
2.1. System Architecture

The architecture of the airport pavement maintenance decision-making system proposed in this paper is as follows (Figure 1). To overcome the limitations mentioned earlier, a key feature of this system is the integration of structural and functional evaluation factors into a single system, incorporating specific segment procedures with a clear sequence.
In cases where phenomena that are difficult to explain using conventional general serviceability prediction models are observed after indoor and field evaluations, special sections are separated. This includes scenarios where there is a risk to safety, such as abrupt climate changes, traffic variations, excessive occurrence of specific defects due to construction management issues, or sudden decreases in skid resistance. Additionally, structural elements, represented by remaining life, are placed before comprehensive performance evaluations. In this phase, the remaining life at the evaluation point is estimated to determine the need for urgent maintenance, and the pavement classification rating (PCR) is calculated for determining allowable take-off weight of aircraft. Budget considerations are primarily conducted for sections that do not fall into these two categories.
After separating the first and second special sections, “Serviceability Level” (SL) is calculated to quantitatively assess pavement conditions comprehensively. Based on maintenance history, serviceability prediction curves for runways, aprons, and taxiways are developed, and they are applied as input variables for decision-making, along with cost and effectiveness for different maintenance methods. The condition cases optimization method, tailored to reflect the rationality of the system and the characteristics of domestic airports, is introduced to ensure practical applicability.
Through the decision-making process, a budget sensitivity report is generated, and after actual maintenance methods are implemented, and the maintenance history is stored in the maintenance database.

2.2. Condition Index: Serviceability Level (SL)

In accordance with the perspectives of various stakeholders such as airport managers, pilots, and passengers, the demands placed on airport pavement vary significantly. Airport managers prioritize efficient budget allocation and pavement maintenance, while pilots focus on the safe takeoff and landing of aircraft, and passengers prioritize a comfortable driving experience. To accommodate these diverse considerations, the decision-making model adopted in this study is based on the serviceability level (SL) developed through collaborative research between the Korea Airports Corporation (KAC) and the Federal Aviation Administration (FAA). This unique index takes into account the specific conditions in Korea, departing from the mega-index SL concept introduced by the FAA [23] and tailored to the domestic context [24].
SL is expressed as a numerical value ranging from a minimum of 0 to a maximum of 100, characterized by hierarchy and comprehensiveness. It is constructed from a perspective that seeks facilities that are safe, sustainable, and comfortable. Factors influencing safety (SAFE) are subdivided into categories related to material or construction-induced distress (MCD: material and construction related distress) and skid resistance (F: friction). Sustainability (SUS) comprises categories related to design-related distress (DD: design-related distress) and structural stability (SS: structural stability). Structural stability is calculated as a weighted sum of deflection indices, such as base layer index (BLI), middle layer index (MLI), and D8 (measured deflection from the sensor located at a 60 inch offset from the loading plate), using the deflection measurements collected from the heavy weight deflectometer (HWD) test data, with adjustments based on daily and monthly temperature change. When DD and SS values are evaluated as poor, extensive maintenance—such as full-depth repairs or repavement methods—is necessary. Lastly, comfort evaluates longitudinal profile (P: profile) as an indicator affecting aircraft vibrations. The analytical hierarchy process (AHP) was chosen as the methodology for determining the weightings between these constituent elements. Developed by Saaty in 1980, AHP simplifies complex problems into pairwise comparisons, enabling informed decision making [25]. Weighted averages were applied to the responses of 18 Korean and 3 U.S. highway/airport pavement experts. The final weights were then used to derive the SL formula (Equations (1)–(4)) [24].
S L = 0.640 S A F E + 0.234 S U S + 0.126 C O M F
S A F E = 0.661 M C D + 0.339 F
S U S = 0.550 D D + 0.450 S S
C O M F = 1.000 P

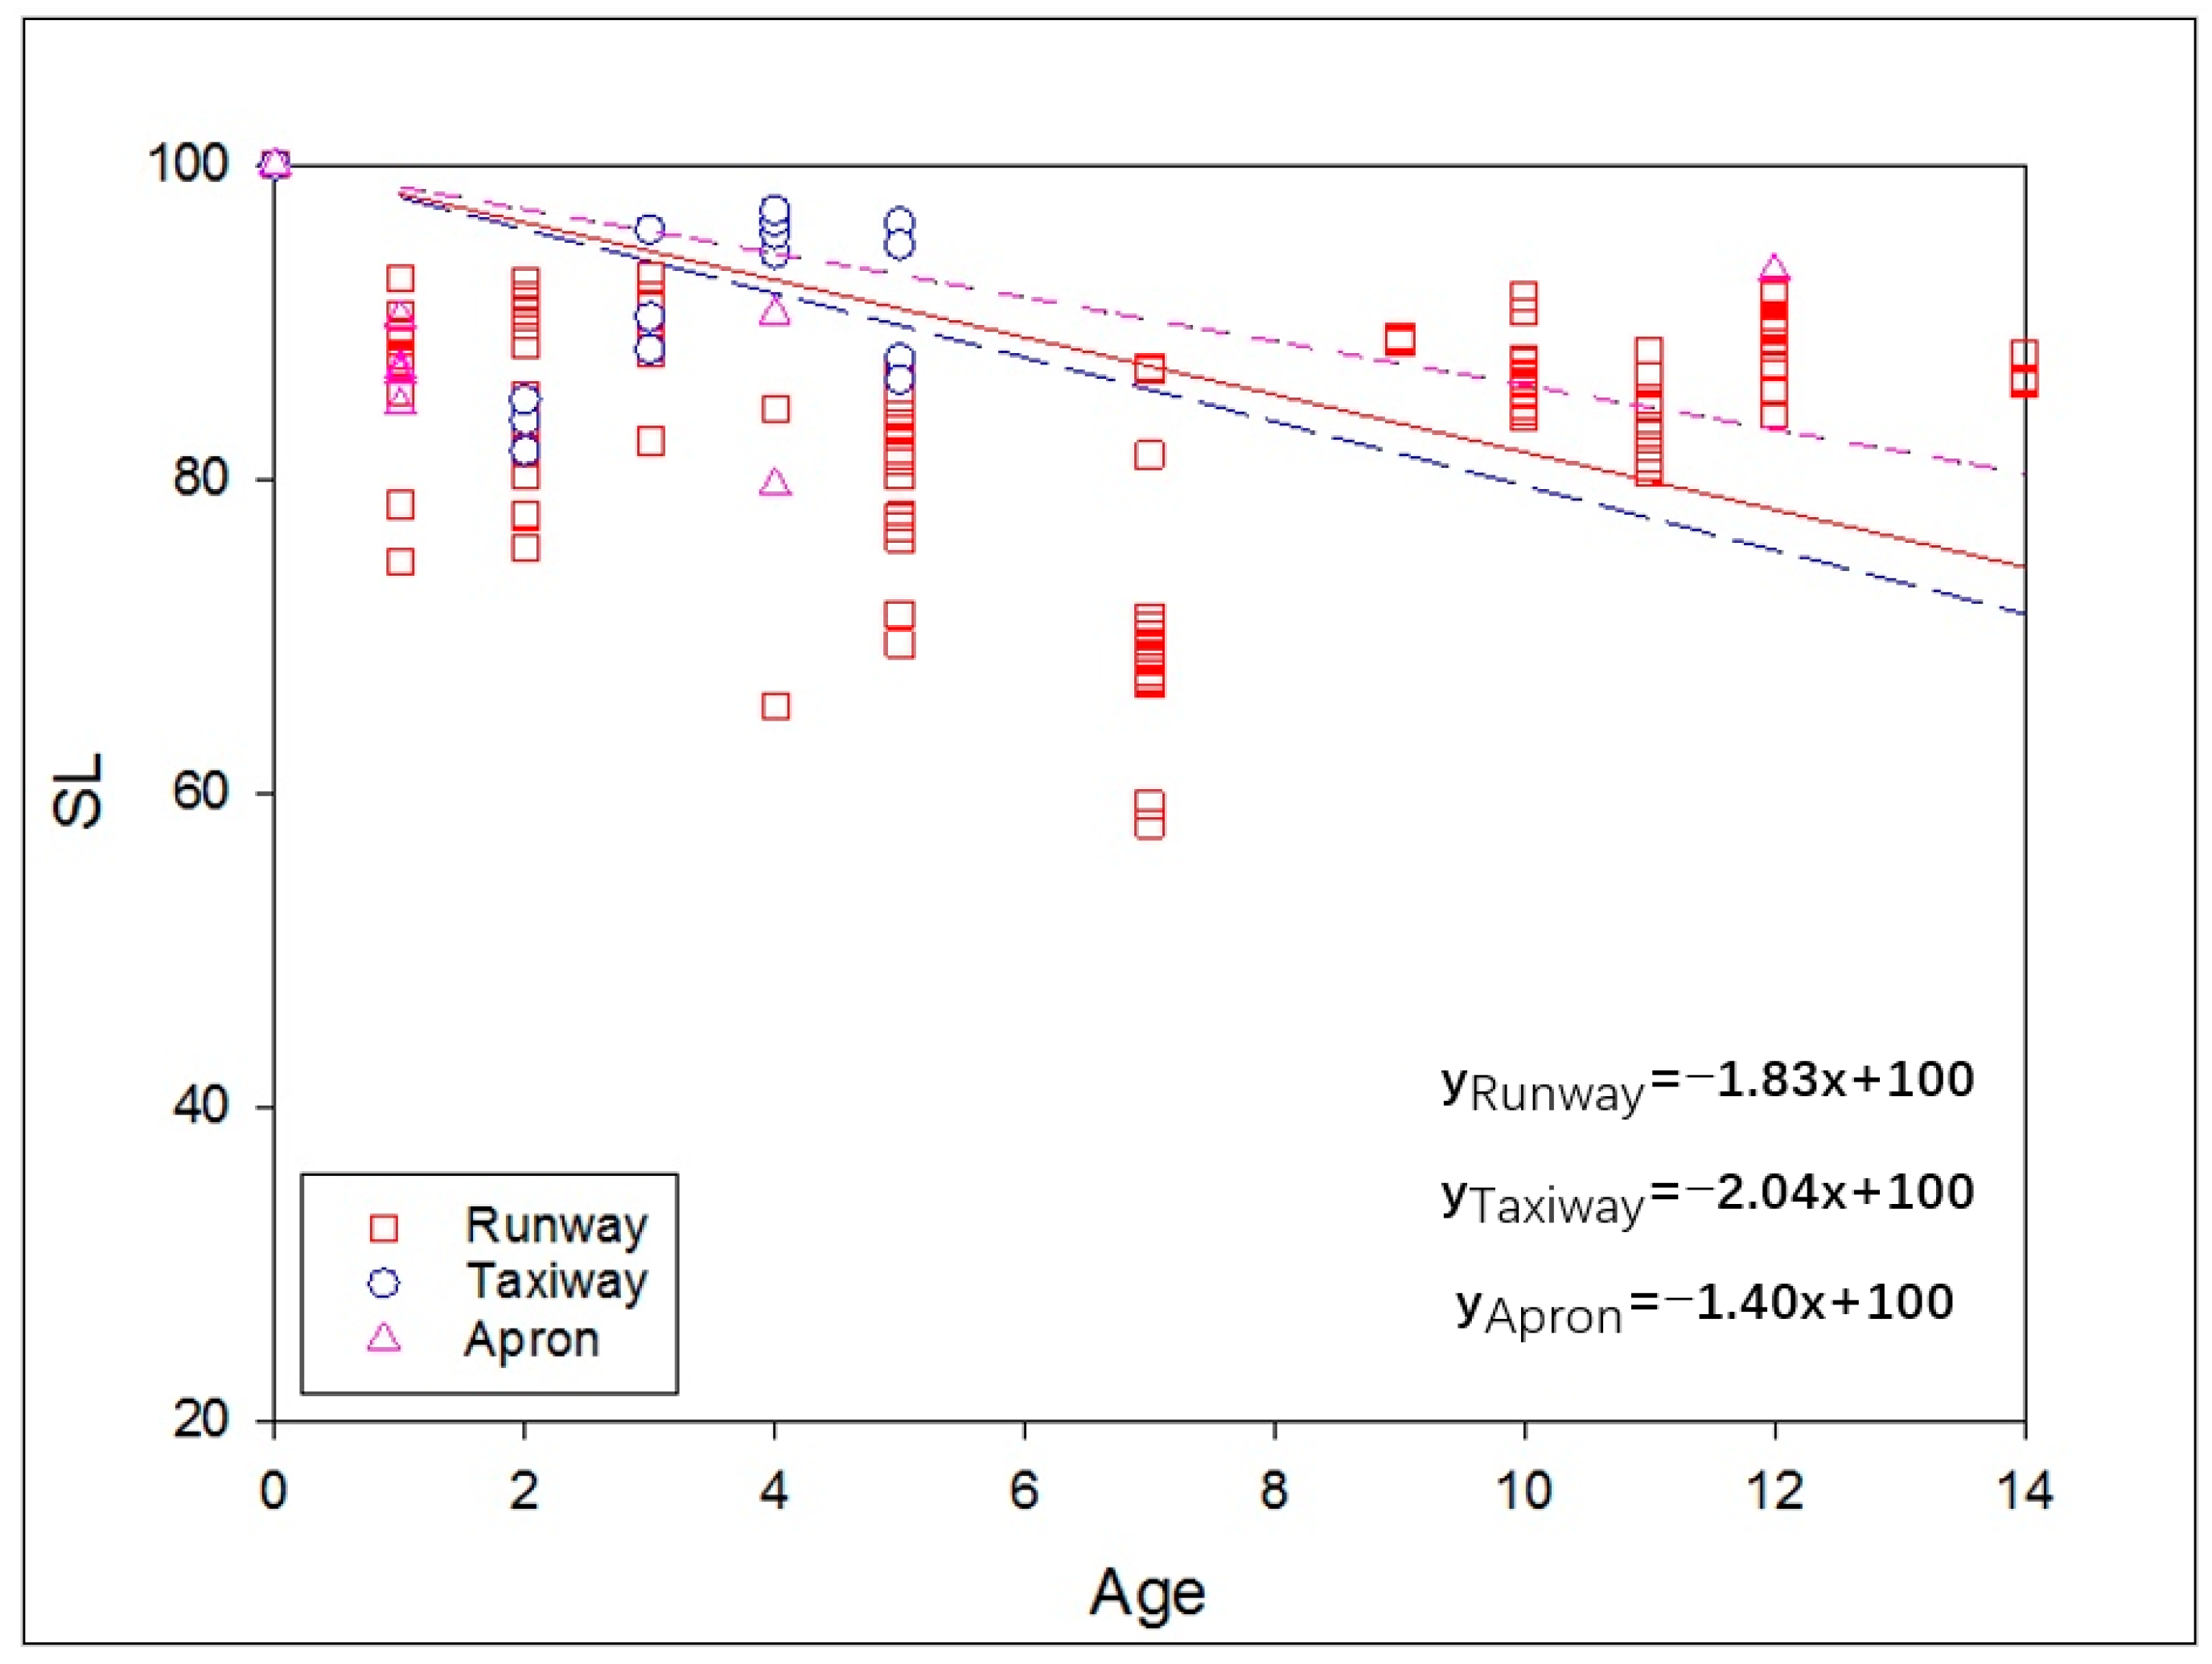
2.3. SL Performance Curve

A relationship between the maintenance history and SL scores was analyzed to develop performance curves for pavement serviceability. Data collection commenced after the establishment of the airport pavement management system in 2011, and given that regular assessments are conducted every five years, as of 2023, a maximum of three sets of evaluation data had been accumulated. To reflect the actual behavior of pavements, various curve shapes such as linear, nonlinear, and polynomial were considered. Considering the limited number of data and continuity with KAC’s existing analysis methodology, a linear model was selected in the initial stage of establishing PMS. It was assumed that the pavement would return to its original design condition (100 points) upon reconstruction or overlay. Figure 2 illustrates the SL performance curves for runways, taxiways, and aprons.

2.4. Decision Making Process for Airport Pavement Management System

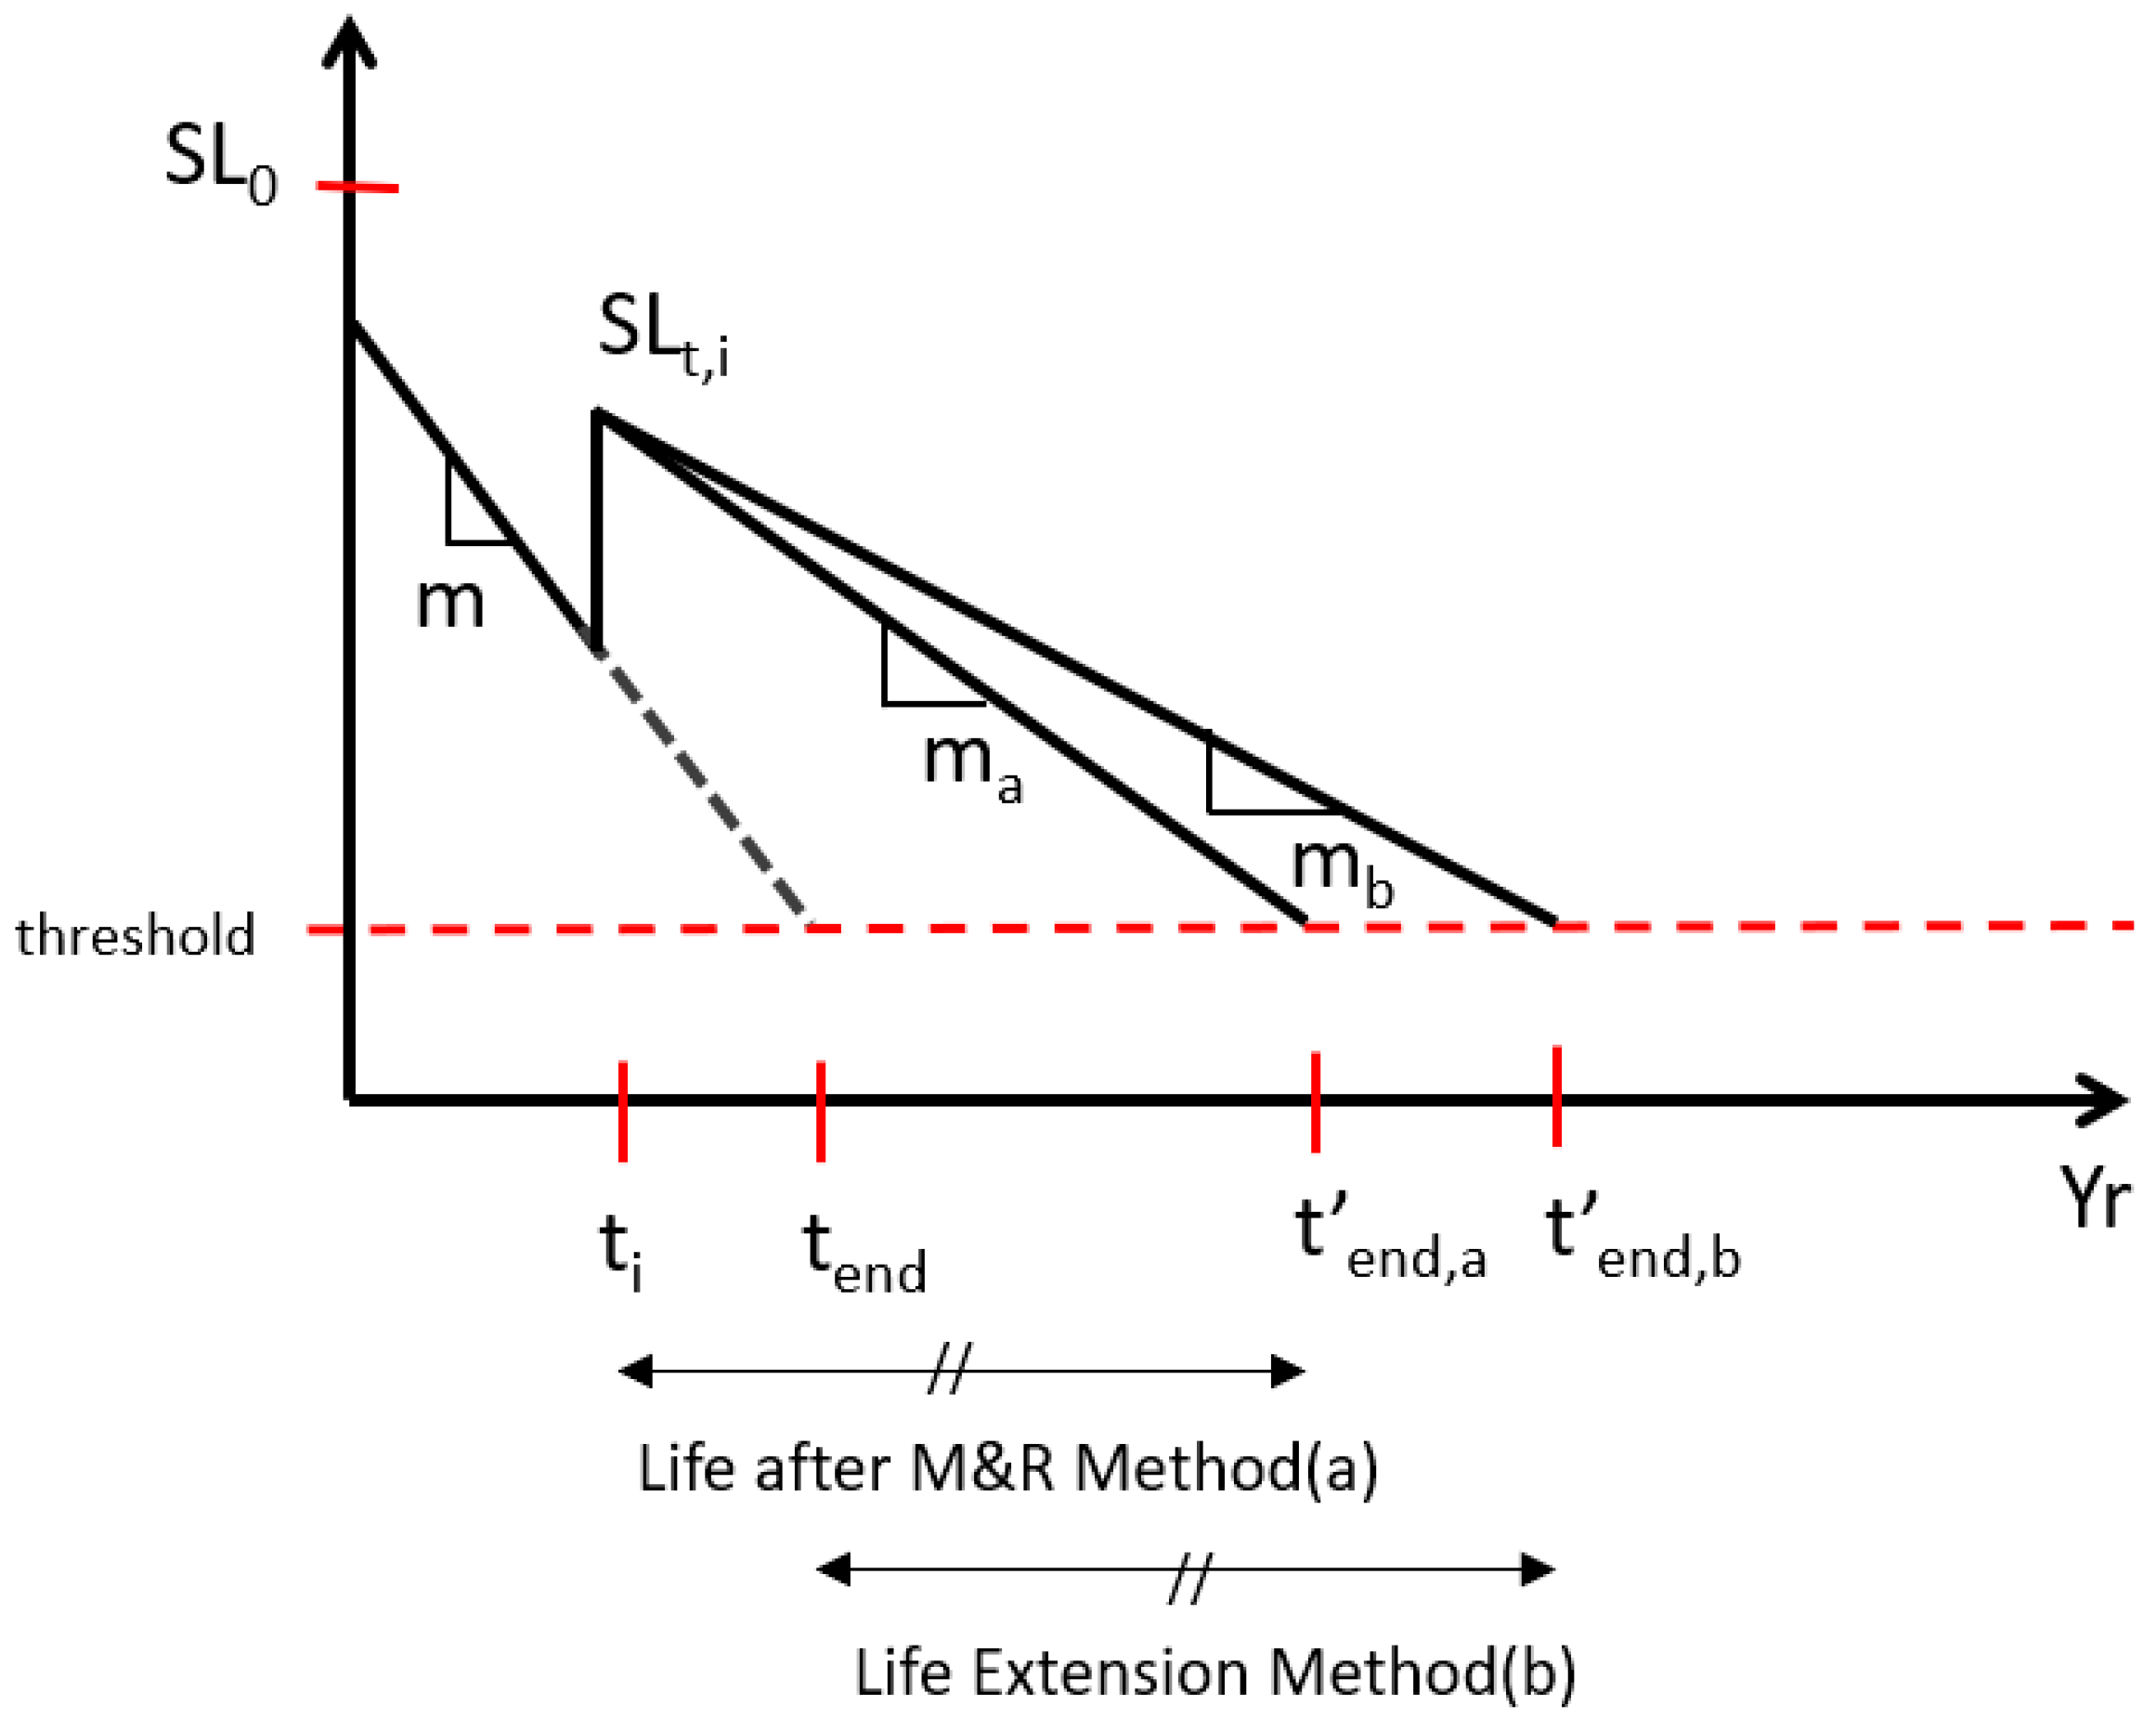
2.4.1. Determination of Cost and Effect for M&R Methods

For the stable and efficient operation of a pavement management system (PMS), it is crucial to quantify the costs and benefits of alternative maintenance methods and establish selection criteria [26]. The determination of pavement methods and costs was informed by domestic and international cases, including reports from agencies like the Minnesota Department of Transportation [27] and the Airport Cooperative Research Program (ACRP) [28], and academic papers such as Noruzoliaee [29], Limon Barua [30], and Hosseini [31]. Additionally, references were made to maintenance manuals from the Korea Expressway Corporation [32] and the Korea Airports Corporation [33].
Pavement maintenance methods are generally categorized into preventive maintenance, major rehabilitation, and reconstruction [11]. Among the major rehabilitation methods applied to Korean airport flexible pavements, 62% were 7.5 cm milling and overlay, 10% were 5 cm thin milling and overlay, and 14% were 10 cm to 25 cm milling and overlay [34]. To evaluate the effectiveness of various methods used for highway, this study selected resurfacing, partial repair, mill and overlay by thickness, patching, slurry sealing, fog sealing, and crack maintenance, as alternatives.
While primarily referring to the Korea Airports Corporation’s data, for methods with limited case studies, practical costs were determined by assigning higher weights to data from the Korea Expressway Corporation and the ACRP. The costs of other methods were distributed based on the least expensive method, crack maintenance (USD 2.35/m2), and the most expensive method, reconstruction (USD 105.75/m2), as references. Preventive maintenance aims to extend the expected service life of the pavement, so the immediate recovery of the pavement condition is minimal. Through consultations with researchers from the Korea Expressway Corporation, the study assigned lifespan extension effects of 3.5 years, 4 years, 3 years, and 2 years, for patching, slurry sealing, fog sealing, and crack maintenance, respectively. For major rehabilitation methods like milling and overlay, it was assumed that the pavement condition increased to 95, and the expected service life extended up to 10 years. Thickness criteria of 5 cm, 7.5 cm, and 15 cm were selected for milling and overlay based on Korean pavement evaluation data. Resurfacing was assumed to fully restore the pavement’s structural capacity, resulting in an SL recovery level of 100 and an extended service life of 30 years. During reconstruction implementation, it was considered that the affected section would be closed for 3 years, but the pavement condition would be maintained to prevent negativity for benefit calculation. Furthermore, it was assumed that as the number of applications accumulated, the expected lifespan extension effect diminished in a 5:3:2 ratio [35]. Cost and effect of the M&R methods by each alternative are presented in Table 1 below.

2.4.2. Benefit

User benefits for benefit-to-cost (B/C) analysis are defined as shown in Equation (5). The most common method for calculation is the area under the pavement condition curve (AUC) between the PCI, international roughness index (IRI), and the threshold scores [36]. In this paper, we considered the delay effects due to traffic closure, specifically applying it to the reconstruction maintenance method among the three maintenance method categories. Based on domestic experience, especially in airports with high traffic volumes, unit costs for minimizing traffic closure times were 2.4 times higher for pre-cast methods and 3.5 times higher for rapid-setting methods, compared with 7.5 cm milling and overlay [24]. User benefits due to preventing traffic closure were calculated at USD 670/m² compared with partial repairs.
B = λ A U C ( 1 λ ) d e l a y   c o s t
where AUC = area under curve and λ = factor on number of runways and traffic volume.
The traffic volume groups were categorized as high, medium, and low groups, based on the number of annual departures in equivalent B737-900ER aircraft. The distribution of airport groups in South Korea was 23% for high traffic, 62% for medium traffic, and 15% for low traffic. The λ coefficient was determined based on the traffic volume group and the number of runways (Table 2). As λ increased, the importance of method application became higher compared with closure effects. The highest λ values were observed in the C traffic group and when there were three or more runways. Conversely, under opposite conditions, the reduction in the closure effect was most significant, with the most extreme case being when traffic was high and there was only one runway.

2.4.3. Optimization Method

Traditional network optimization methods are divided into top-down and bottom-up approaches for distributing budgets based on pavement condition assessments at each airport and determining pavement maintenance methods through detailed investigations. In this paper, we adopted a dual optimization bottom-up approach that first generates a set of possible alternatives through single facility (section) optimization and then prioritizes them through multi-facility optimization.
The objective function of the optimization problem is to maximize the total B/C ratio of all evaluation sections within the network. Here, B represents benefits, C represents costs, i represents facilities, x represents integer coefficients, L represents the set of applicable pavement maintenance methods for homogeneous sections, and K represents the number of homogeneous sections. The constraints include that the total cost of the selected set of maintenance methods cannot exceed the total budget and only one maintenance method set can be chosen for each section. Here, t represents one year, and N represents the analysis period. The optimization technique selected for this purpose was brute force, and the coding was performed in Python.
M a x i m i z e .   i = 1 L K B C i x i , ( x { 0 , 1 } )
subject to:
i = 1 L K [ x i ( t = 1 N C t , i ) ] T B  
i = 1 L K x i = 1 ,   f o r   a l l   k = 1 ,   2 ,   ,   K
To improve practicality of conventional optimization, additional logic is required which considers the current and predicted pavement conditions. The homogeneous sections were classified into CC I, II, and III, where CC I refers to pavements that have already failed at the time of evaluation, CC II refers to pavements that are predicted to fail within the analysis period, and CC III refers to pavements that are not expected to reach the threshold within the analysis period.
The budget conditions were divided into three cases. The first case was when there was insufficient budget to rehabilitate CC I. The second case was when there was enough budget to rehabilitate CC I, but not sufficient to cover all of CC II. The last case was when there was enough budget to fully rehabilitate CC II. Although the last case could be further divided into cases where the budget was insufficient or sufficient for CC III, they were considered the same in terms of applying network optimization methods.
This approach, termed condition cases optimization (CCO), is summarized in Figure 3 based on budget and initial conditions.
In cases where the budget was very limited to cover CC I, ranking was determined based on the minimum cost among alternatives rather than B/C analysis. The minimum required budget to cover CC I was calculated, but as it may have been insufficient to address all possible methods, priorities were determined based on cost within the budget range. In the second case, prioritization was based on B/C analysis. After allocating the necessary budget for CC I, 10% of the remaining budget was evenly distributed among airports. This was assumed to cover minimal maintenance such as pavement surface cleaning and foreign object debris (FOD) removal. With the remaining amount, the applicable CC II and corresponding methods were selected, and similar to the first case, the minimum budget required to cover CC II was reported. In this case, priorities were determined based on B/C rather than minimum cost method, to maximize efficiency by achieving the highest total B/C. In the third condition where there was sufficient budget for CC II rehabilitation, network optimization was conducted. Network optimization could be performed either at the headquarters or individually by each airport. In other words, through initial optimization analysis, the necessary budget for each airport was allocated. Airports can either follow these results, or based on their philosophy, utilize SUS, SAFE, and COMF as reference scores within their allocated budget to conduct optimization and apply maintenance and rehabilitation methods to homogeneous sections accordingly.

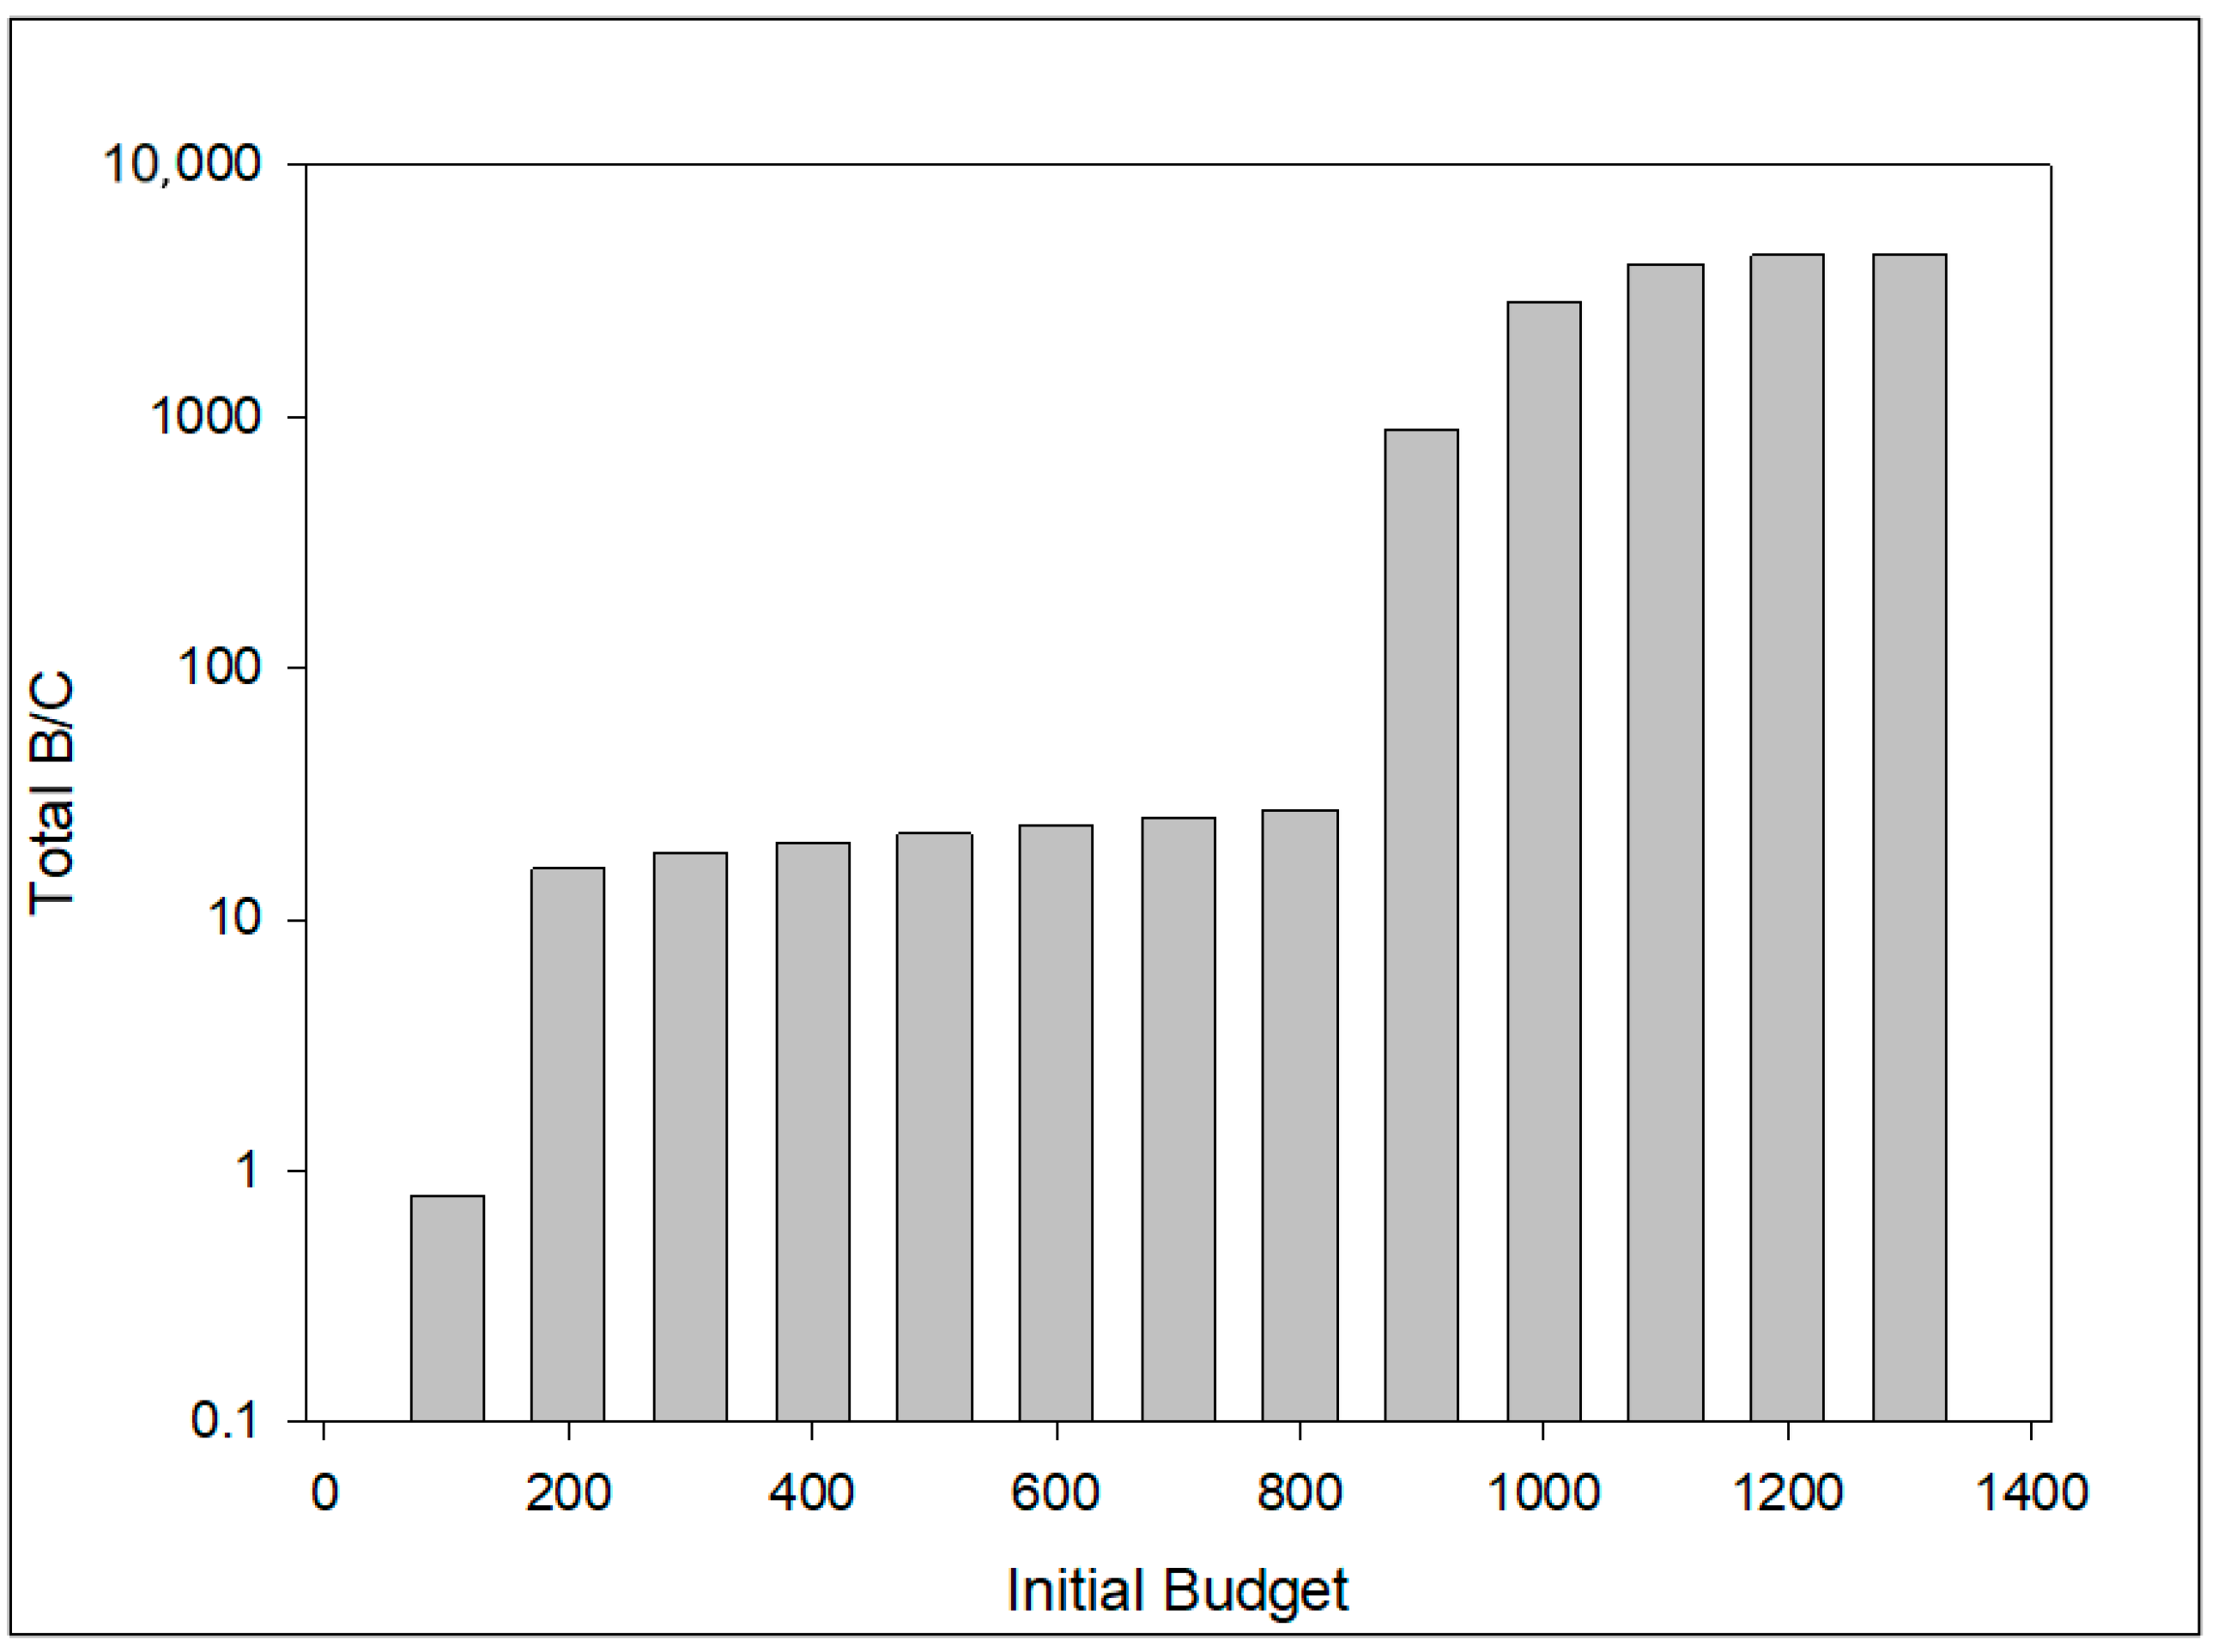
2.4.4. Sensitivity Analysis
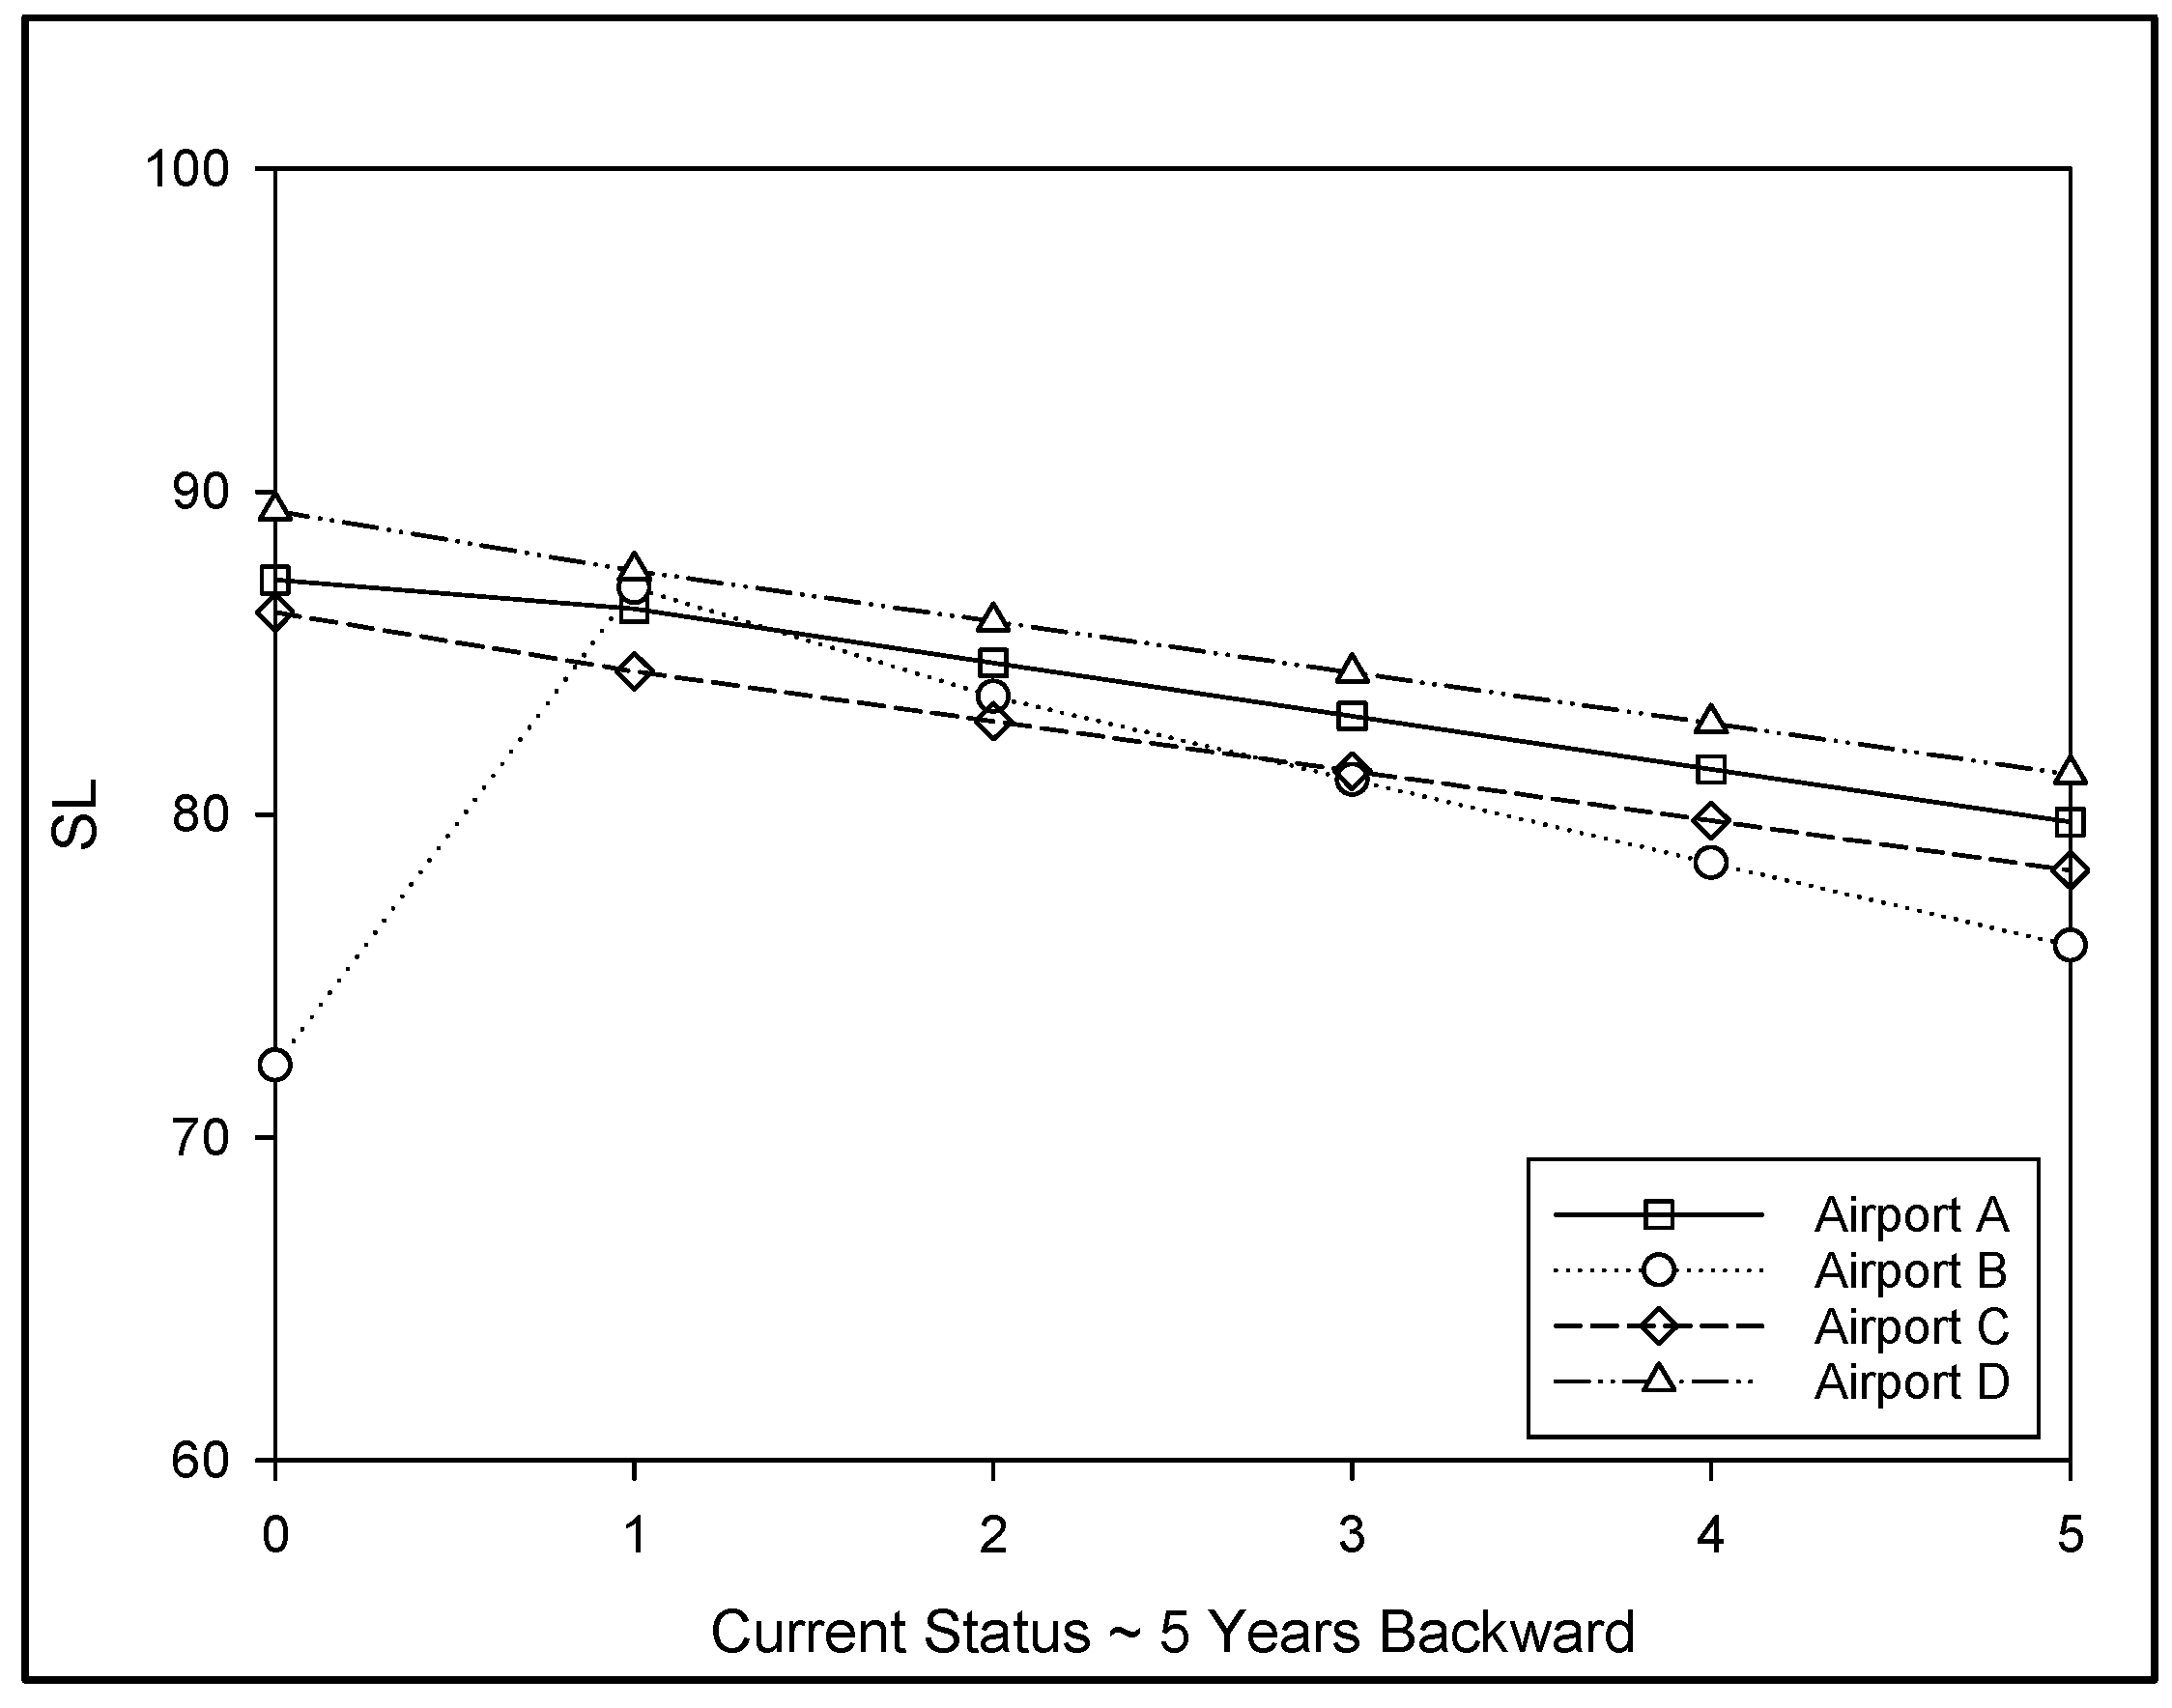
Sensitivity analysis was conducted by varying input variables for flexible pavement. For comparison, we included the results for do-nothing (DN) and network optimization (NO), which represent the application of the conventional network optimization. Analysis was performed using variables such as the minimum SL threshold, budget, analysis period, the lifespan extension effect after method application, and M&R cost, as shown in Table 3. For the minimum SL threshold, we examined cases with ±15 points around the SL of 65 points, specifically considering thresholds of 50 and 80 points. Regarding the budget, we initially applied a value of USD 1000 and tested variations of ±10% and ±20%. We expanded the analysis period from the initial 5 years, to 7 and 10 years. To calculate the change in the slope of the serviceability level (SL) performance curve after M&R, we divided the analysis into two cases: one where the overall lifespan was extended and another where the lifespan was extended for a specific number of years from the time of method application (Figure 4), where S L 0   = SL score at the evaluation, m = original slope of SL performance curve, i   = M&R method, t i   = time when M&R method i is applied, S L t , i   = SL score at t i , t e n d   = original time of end of life, t e n d , a = time of end of life after applying method i (life after M&R method), t e n d , b = time of end of life after applying method i (life extension method), m a = slope of the SL performance curve after applying method i = t h r e s o l d S L t , i t e n d , a t i (life after M&R method), and m b = slope of the SL performance curve after applying method i = t h r e s o l d S L t , i t e n d , b t e n d (life extension method).
Furthermore, we examined the results by varying the expected lifespan extension level after method application and the costs associated with each method by ±20%. The lifespan extension effect was increased or decreased by 20%, and this effect was also adjusted by the same ratio for second and third applications of the method.
Table 4 shows the input data used for analysis, namely, five airports with different traffic volume, lambda value, and section conditions. The minimum value of SL was 40 and the maximum value was 100. Considering the experience, we distributed more than 70% of the sections with an SL score of 85 or higher. Sections for simulating rather deteriorated condition were scored in the range of 65 to 75.
The analysis results are presented in Table 5 and Table 6. Table 5 shows total B/C and final SL scores from original values. Differences in percentage among sensitivity analysis are also presented in Table 6. Total budget allocation showed significant variations in CCO’s total B/C. When it decreased by 10%, there was approximately a halving effect, and when it decreased by 20%, it dropped sharply by 2%. When analyzing the two methods of lifespan extension effects, NO and CCO methods exhibited a more than twofold difference in total B/C, with no significant difference in SL after the analysis period (5 years). When extending the analysis period from 5 years, to 7 and 10 years, NO’s total B/C increased, while CCO’s B/C was higher than that for 5 years, particularly showing the highest value at the 7-year analysis period. After the analysis period, SL showed a similar decrease rate for all alternatives.
When adjusting the costs for maintenance methods, a 20% cost reduction resulted in an approximately 1.3-fold increase in total B/C. However, when costs increased by 20%, particularly in the case of CCO, it showed a significant decrease of 8% compared with the initial value, indicating high sensitivity.

3. Case Study

We compared the average SL at the end of the analysis period with the DN scenario using actual pavement evaluation data from 164 homogeneous flexible pavement sections, including runways, aprons, and taxiways. Table 7 provides information on airport-specific equivalent annual takeoff traffic, traffic groups, branch configurations, λ weights, and the number of sections corresponding to CC I, II, and III. In the case of Airport C, there were two sections falling under CC I, while for CC II, Airport A had three sections, and Airport C had fifteen sections. Annual traffic was converted using the B737-900ER aircraft, and λ values were determined based on the runway numbers and traffic group, with respective values of 0.6, 0.2, 0.4, and 0.7.
When analyzed under the condition of sufficient budget, the annual average SL over the years is as shown in Figure 5. For DN, the average SL decreased steadily over time, starting from an initial average of 86 points and reaching approximately 76 points after 5 years. When the NO method was applied, the SL increased to 87 points in the subsequent years after the analysis, gradually declining to about 80 points. Considering the domestic airport pavement, which is generally well-maintained, it seems reasonable that there was little difference in the numerical values.
To examine the effect of the budget—one of the advantages of the decision-making method presented in this paper—the total B/C was evaluated while incrementally increasing the budget from 0 to 2400 in increments of 400 (as shown in Figure 6). Initially, for the CC I, where immediate maintenance is required, the B/C was around 1. Afterward, for CC II, it increased to approximately 50 after a budget of 200. However, for CC III, starting from 800, the B/C rapidly increased to 10,000 or more. This steep increase likely occurred because high-scoring CC III segments, which were initially in good condition, began to be included in the maintenance targets, leading to a rapid increase in the B/C.

4. Conclusions

The objective of this study was to develop a rational and efficient airport pavement management system. The condition cases optimization (CCO) method was introduced which addresses the limitations of conventional network optimization and enhances its practical applicability. It categorizes pavement conditions into three groups, allowing for the allocation of resources based on the current state of the pavement. The method accommodates varying budget constraints, making it adaptable to the financial realities of different airports. It offers strategies for decision-making under different budget scenarios, ensuring that airport managers can make informed choices. The sensitivity analysis conducted in the study emphasizes the method’s flexibility and adaptability. It identifies key factors that influence decision outcomes, such as the initial budget, maintenance method costs, and SL threshold scores. The CCO method’s applicability was validated using evaluation data from four South Korean airports. Results of the case study demonstrate that the proposed procedure can be effectively utilized in field. In summary, the study’s findings underline the potential of the CCO method as an effective decision-making tool for airport pavement management.

Author Contributions

Conceptualization, Y.C. and W.L.; methodology, J.L. and S.R.; software, I.J.U. and Y.C.; validation, W.L., S.R. and Y.C.; formal analysis, I.J.U.; investigation, S.R.; resources, Y.C.; data curation, J.L. and W.L.; writing—original draft preparation, S.R.; writing—review and editing, W.L. and Y.C.; visualization, W.L.; supervision, Y.C. and W.L.; project administration, Y.C. All authors have read and agreed to the published version of the manuscript.

Funding

This research was supported by the BK21 FOUR (Fostering Outstanding Universities for Research) research team “SURE”. The APC was funded by the Ministry of Education (MOE, Korea) and National Research Foundation of Korea (NRF).

Institutional Review Board Statement

Not applicable.

Informed Consent Statement

Not applicable.

Data Availability Statement

The data presented in this study are available in the article.

Conflicts of Interest

The authors declare no conflict of interest.

References

  1. Federal Aviation Administration. Advisory Circular No. 150/5380-6C Guidelines and Procedures for Maintenance of Airport Pavements; FAA: Washington, DC, USA, 2014. Available online: https://www.faa.gov/regulations_policies/advisory_circulars/index.cfm/go/document.information/documentID/1026067 (accessed on 10 October 2014).
  2. Karballaeezadeh, N.; Zaremotekhases, F.; Shamshirband, S.; Mosavi, A.; Nabipour, N.; Csiba, P.; Várkonyi-Kóczy, A.R. Intelligent Road Inspection with Advanced Machine Learning; Hybrid Prediction Models for Smart Mobility and Transportation Maintenance Systems. Energies 2020, 13, 1718. [Google Scholar] [CrossRef]
  3. Federal Aviation Administration. Advisory Circular No. 150/5320-6G Airport Pavement Design and Evaluation; FAA: Washington, DC, USA, 2021. Available online: https://www.faa.gov/airports/resources/advisory_circulars/index.cfm/go/document.current/documentnumber/150_5320-6 (accessed on 7 June 2021).
  4. Hachiya, Y.; Watanabe, T.; Kanno, M. Development of Airport Pavement Optimal Rehabilitation Timing System and Its Application to Airports in Japan. In Airfield and Highway Pavement 2013: Sustainable and Efficient Pavements; ASCE: Reston, VA, USA, 2013; pp. 640–649. [Google Scholar] [CrossRef]
  5. Laguado Lancheros, J.; Wolfert, A.R.M.; van Nederveen, G.A.; Koutamanis, A.; Mooren, F. Airport Pavement Management Decision Making: A Prioritization Tool to Select Pavement Sections Requiring M&R Treatment. Master’s Thesis, Delft University of Technology, Delft, The Netherlands, 2018. [Google Scholar]
  6. Di Mascio, P.; Moretti, L. Implementation of a pavement management system for maintenance and rehabilitation of airport surfaces. Case Stud. Constr. Mater. 2019, 11, e00251. [Google Scholar] [CrossRef]
  7. International Civil Aviation Organization. Doc 9157 Aerodrome Design Manual Part 3—Pavements; ICAO: Montreal, QC, Canada, 2022. [Google Scholar]
  8. Fwa, T.F.; Chan, W.T.; Hoque, K.Z. Multi objective optimization for pavement maintenance programming. J. Transp. Eng. 2000, 126, 367–374. [Google Scholar] [CrossRef]
  9. Li, D.-F.; Yang, J.-B. Fuzzy linear programming technique for multiattribute group decision making in fuzzy environments. Inf. Sci. 2004, 158, 263–275. [Google Scholar] [CrossRef]
  10. Golabi, K.; Kulkarni, R.B.; Way, G.B. A statewide pavement management system. Interfaces 1982, 12, 5–21. [Google Scholar] [CrossRef]
  11. Hudson, W.R.; Haas, R.; Uddin, W. Infrastructure Management; McGraw: New York, NY, USA, 1997. [Google Scholar]
  12. Mahmood, M.S. Network-Level Maintenance Decisions for Flexible Pavement Using a Soft Computing-Based FRAMEWORK. Ph.D. Thesis, Nottignham Trent University, Nottignham, UK, 2015. [Google Scholar]
  13. Augeri, M.G.; Colombrita, R.; Greco, S.; Lo Certo, A.; Matarazzo, B.; Slowinski, R. Dominance-based rough set approach to budget allocation in highway maintenance activities. J. Infrastruct. Syst. 2011, 17, 75–85. [Google Scholar] [CrossRef]
  14. Chou, J.S. Applying AHP-based CBR to estimate pavement maintenance cost. Tsinghua Sci. Technol. 2008, 13, 114–120. [Google Scholar] [CrossRef]
  15. Pantha, B.R.; Yatabe, R.; Bhandary, N.P. GIS-based highway maintenance prioritization model: An integrated approach for highway maintenance in Nepal mountains. J. Transp. Geogr. 2010, 18, 426–433. [Google Scholar] [CrossRef]
  16. Hugo, F.; Scholtz, W.J.; Sinclair, M.; Curtayne, P.C. Management of pavement rehabilitation. Eur. J. Oper. Res. 1989, 42, 129–141. [Google Scholar] [CrossRef]
  17. de la Garza, J.M.; Akyildiz, S.; Bish, D.R.; Krueger, D.A. Network-level optimization of pavement maintenance renewal strategies. Adv. Eng. Inform. 2011, 25, 699–712. [Google Scholar] [CrossRef]
  18. Wu, Z.; Flintsch, G.W.; Chowdhury, T. Hybrid multiobjective optimization model for regional pavement-preservation resource allocation. Transp. Res. Rec. 2008, 2084, 28–37. [Google Scholar] [CrossRef]
  19. Ouyang, Y.; Madanat, S. Optimal scheduling of rehabilitation activities for multiple pavement facilities: Exact and approximate solutions. Transp. Res. Part A Policy Pract. 2004, 38, 347–365. [Google Scholar] [CrossRef]
  20. Priya, S.; Uthra, R.A. Deep learning framework for handling concept drift and class imbalanced complex decision-making on streaming data. Complex Intell. Syst. 2021, 9, 3499–3515. [Google Scholar] [CrossRef]
  21. Hwasoo, Y.; Yoonjin, Y.; Samer, M. Algorithms for bottom-up maintenance optimisation for heterogeneous infrastructure systems. Struct. Infrastruct. Eng. 2012, 9, 317–328. [Google Scholar] [CrossRef]
  22. Lee, J.; Madanat, S. Jointly optimal policies for pavement maintenance, resurfacing and reconstruction. Euro J. Transp. Logist. 2015, 4, 75–95. [Google Scholar] [CrossRef]
  23. Timothy, P.; Scott, M. Validation of FAA-Proposed Airport Pavement Serviceability Level Index Components. In Proceedings of the Transportation Research Board 2023 Annual Meething, Washington, DC, USA, 11 May 2023. [Google Scholar] [CrossRef]
  24. Korea Airports Corporation. Development of Serviceability Level and Improvement of Back-Calculation; Research Project Report; KAC: Seoul, Republic of Korea, 2019. [Google Scholar]
  25. Mahmoodzadeh, S.; Shahrabi, J.; Pariazar, M.; Zaeri, M.S. Project selection by using fuzzy AHP and TOPSIS technique. Int. J. Ind. Manuf. Eng. 2007, 1, 270–275. [Google Scholar]
  26. Pedigo, R.D.; Roberts, F.L.; Hudson, W.R.; Haas, R.C. Pavement Management: The Network-Level Decision Process (Abridgment). Transp. Res. Rec. 1980, 766, 1–5. [Google Scholar]
  27. Hill, L.; Cheetham, A.; Hass, R. Development and implementation of a pavement management system for Minnesota. Transp. Res. Rec. 1991, 1311, 230–241. [Google Scholar]
  28. Airport Cooperative Research Program. ACRP Synthesis 22 Common Airport Pavement Maintenance Practices; Transportation Research Board: Washinton, DC, USA, 2011. [Google Scholar] [CrossRef]
  29. Noruzoliaee, M.; Zou, B. Airfield Infrastructure Management Using Network-Level Optimization and Stochastic Duration Modeling. Infrastructures 2019, 4, 2. [Google Scholar] [CrossRef]
  30. Barua, L.; Zou, B. Planning maintenance and rehabilitation activities for airport pavements: A combined supervised machine learning and reinforcement learning approach. Int. J. Transp. Sci. Technol. 2022, 11, 423–435. [Google Scholar] [CrossRef]
  31. Hosseini, S.A.; Smadi, O. How Prediction Accuracy Can Affect the Decision-Making Process in Pavement Management System. Infrastructures 2021, 6, 28. [Google Scholar] [CrossRef]
  32. Korea Expressway Corporation. Korea Expressway Design and Evaluation Guidelines; KEC: Seoul, Republic of Korea, 2021. [Google Scholar]
  33. Korea Airports Corporation. Upgrade of Korean Airport Management System (KAPMS); Research Project Report; KAC: Seoul, Republic of Korea, 2010. [Google Scholar]
  34. Korea Airports Corporation. Analytical Logic Improvement Research for Upgrading Airport Pavement Management System (APMS); Research Project Report; KAC: Seoul, Republic of Korea, 2022. [Google Scholar]
  35. Lim, Y.H. Improvement of Project Level PMS and Development of Network Level PMS of National Highway in Korea. Ph.D. Thesis, Chung-Ang University, Seoul, Republic of Korea, 2003. [Google Scholar]
  36. Irfan, M.; Khurshid, M.B.; Iqbal, S.; Khan, A. Framework for airfield pavements management—An approach based on cost-effectiveness analysis. Eur. Transp. Res. Rev. 2015, 7, 13. [Google Scholar] [CrossRef]
Figure 1. Proposed airport pavement management system architecture.
Applsci 13 13167 g001
Figure 2. SL performance curve for flexible pavement.
Applsci 13 13167 g002
Figure 3. Step-by-step condition cases optimization decision-making strategy.
Applsci 13 13167 g003
Figure 4. Comparison of life extension method (a), and life after M&R method (b).
Applsci 13 13167 g004
Figure 5. Trend of annually averaged SL.
Applsci 13 13167 g005
Figure 6. Trend of total B/C according to initial budget condition.
Applsci 13 13167 g006
Table 1. Cost and effect of the M&R methods used in the analysis.
CategoryAlternativesUnit Cost
(USD/m2)
SL after
Implementation
Life Extension (Year)
1st2nd3rd
ReconstructionReconstruction105.7510030--
Major
Rehabilitation
15 cm M/OL *78.96951064
7.5 cm M/OL *56.4084.83.2
5 cm M/OL *47.00532
Preventive MaintenancePatching58.75-3.5--
Slrry seal16.454--
Fog seal9.403--
Crack sealing2.352--
* M/OL = milling and overlay.
Table 2. λ factor for number of runways and traffic volume.
Number of Runways123 or More
Traffic Volume HighMedLowHighMedLowHighMedLow
λ0.20.30.40.60.70.70.80.80.9
1 − λ0.80.70.60.40.30.30.20.20.1
Table 3. Values for sensitivity analysis.
VariablesNegativeOriginal ValuePositive
SL threshold506580
Initial Budget (USD)800900100011001200
Analysis Period (year) 5710
Life Extension (%)−20%Refer Table 1+20%
M&R Cost−20%Refer Table 1+20%
Definition of Life extensionLife after M&R methodLife Extension method
Table 4. Information about sections used for the sensitivity analysis.
AirportABCDE
Annual Departures12,0008000450030002000
Number of Sections per BranchRunway = 15Runway = 15Runway = 15Runway = 15Runway = 15
Taxiway = 10Taxiway = 8Taxiway = 2Taxiway = 1Taxiway = 1
Apron = 8Apron = 2Apron = 1Apron = 1Apron = 1
λ0.70.40.40.40.6
CC I Sections32100
CC II sections73240
CC III sections2320151317
Table 5. Sensitivity analysis results (original value).
Total B/CSL at the End of the Analysis Period
NOCCODNNOCCO
3427.933178.5076.6581.0881.34
Table 6. Sensitivity analysis results (difference with original value).
VariablesInput ValueTotal B/C Difference (%)SL at the End of the Analysis
Period Difference (%)
NOCCODNNOCCO
Budget20%100.03107.88100.00100.53100.21
10%100.03107.88100.00100.53100.21
0%100.00100.00100.00100.00100.00
−10%99.9454.33100.0099.0999.47
−20%99.902.44100.0098.6798.93
Definition of
“Life Extension”
Life after M&R250.81266.68100.0091.2991.91
Life extension100.00100.00100.00100.00100.00
Analysis period5 years100.00100.00100.00100.00100.00
7 years343.07369.9995.0696.0295.71
10 years426.99233.4287.6389.7988.97
Life extension
effect
−20%99.41108.40100.0099.0399.20
0%100.00100.00100.00100.00100.00
20%100.5172.94100.00100.74100.42
M&R cost−20%125.04134.85100.00100.53100.21
0%100.00100.00100.00100.00100.00
20%83.258.48100.0098.6799.20
SL threshold40231.03458.69100.0096.8096.70
65100.00100.00100.00100.00100.00
8034.090.53100.00100.35100.20
Table 7. Information about sections used for the case study.
AirportABCD
Annual Departures45,83214568135,192
Number of Sections per BranchRunway: 42
Taxiway: 10
Apron: 7
Runway: 10Runway: 25Runway: 64
Taxiway: 6
λ0.60.20.40.7
CC I Sections0020
CC II sections30150
CC III sections5610870
Disclaimer/Publisher’s Note: The statements, opinions and data contained in all publications are solely those of the individual author(s) and contributor(s) and not of MDPI and/or the editor(s). MDPI and/or the editor(s) disclaim responsibility for any injury to people or property resulting from any ideas, methods, instructions or products referred to in the content.

