Article

Using Level-Based Multiple Reasoning in a Web-Based Intelligent System for the Diagnosis of Farmed Fish Diseases

by
Konstantinos Kovas
1,
Ioannis Hatzilygeroudis
1,*,
Konstantinos Dimitropoulos
1,
Georgios Spiliopoulos
2,
Konstantinos Poulos
3,
Evi Abatzidou
2,
Theofanis Aravanis
1,
Aristeidis Ilias
1,
Grigorios Kanlis
3 and
John A. Theodorou
3
1
Department of Computer Engineering & Informatics, University of Patras, 26504 Patras, Greece
2
Kefalonia Fisheries S.A., 28200 Lixouri, Greece
3
Department of Fisheries & Aquaculture, University of Patras, 30200 Mesolonghi, Greece
*
Author to whom correspondence should be addressed.
Appl. Sci. 2023, 13(24), 13059; https://doi.org/10.3390/app132413059
Submission received: 17 October 2023 / Revised: 29 November 2023 / Accepted: 30 November 2023 / Published: 7 December 2023
(This article belongs to the Special Issue Knowledge and Data Engineering)

Abstract

:
Farmed fish disease diagnosis is an important problem in the fish farming industry, affecting quality of production and financial losses. In this paper, we present a web-based intelligent system that tackles the problem of fish disease diagnosis. To this end, it uses multiple knowledge representation and reasoning methods: rule-based, case-based, weight-based, and voting. Knowledge, which concerns the diagnosis of sea bass diseases, was acquired from experts in the field and represented in the form of decision trees. The diagnostic process is performed in two stages: a general one and a specialized one. In the general stage, a level-based diagnosis is performed, where environmental parameters, external signs, and internal signs are successively examined, and the three most probable diseases are identified. In the specialized stage, which is optional, a specialized expert system is used for each of the resulting diseases, where additional parameters concerning laboratory tests (microbiological, microscopic, molecular, and chemical) are considered. The general stage is the most useful, given that it can be performed on-site in real-time, whereas the specialized one requires time-consuming lab tests. The system also provides explanations for its decisions. Evaluation of the general-stage diagnostic process showed a top-3 accuracy of 78.79% on expert test cases and 94% on an artificial dataset.

1. Introduction

Fish farming is an extensive business activity all over the world. Fish farming management is a complicated task. One of the main problems to tackle is the diagnosis of fish disease. The occurrence of diseases in fish farms restricts the quality of production and has an economic impact on fish farm operations [1,2]. On the other hand, the problem itself requires special skills and expertise to be solved [3], which most farmers lack. Therefore, it is necessary to develop systems that can automatically or semi-automatically diagnose or help in diagnosing fish diseases. Given that for solving the problem of fish disease diagnosis, human expertise is necessary, artificial intelligence (AI) techniques should be employed [4]. There are two general AI approaches that could be used in such a system: the knowledge representation (KR) approach and the machine learning (ML) approach [4].
The KR approach consists of representing knowledge and the way an expert (or many experts) uses it in making diagnoses of fish diseases. Its most practical representative is the expert system (ES) approach. An ES represents expert knowledge, usually in the form of if-then rules, and employs an inference engine to produce conclusions (diagnoses). To build an expert system, corresponding knowledge should be acquired from experts and other knowledge sources and represented in the knowledge base of the system [5]. There are also other representatives, like case-based reasoning (CBR), where new cases are compared with (validated) old cases, stored in a case base, to find a solution for the new case; here, similarity metrics play a crucial role [6].
Given that the problem of making fish disease diagnoses can be considered a classification problem, machine learning (ML) approaches can be used to solve it. ML approaches seek out models, called classifiers, that can identify fish diseases based on suitable data. There are various “traditional” ML models, like decision trees (DTs), neural networks (NNs), or statistical models, like support vector machines (SVM), k nearest neighbors (kNN), etc. To be able to build such a model, an adequate dataset consisting of real cases is required for its training [7].
Recently, a modern approach called deep learning (DL) has become very popular due to its very successful results. Deep learning neural networks (DLNNs) are complex neural networks that require very large datasets to be trained [8]. The Convolutional Neural Network (CNN) is the basic deep learning architecture used as the basis for more complex DLNNs. Its main domain of success is image classification [9,10].
A full diagnosis of fish disease should take into account a variety of parameters: environmental, clinical, microbiological, microscopic, and molecular [3]. The difficulty in using ML approaches for fish disease diagnosis is the lack of real datasets that include all necessary features. It is very difficult to find an adequate number of records of diseased fish cases, as you can find for human patients in hospitals. Also, it is difficult to find the required number of images of diseased fish to use DL methods. On the other hand, even if the required number of images can be found, an image-based diagnosis is not wholly accurate. On the other hand, ML and DL methods cannot give any explanation about their outputs (decisions), while explanations are very desirable in such systems [11]. So, although the expert system approach is an old one, it is still necessary as a primary framework for full fish disease diagnosis [12].
Therefore, in this paper, we propose and present a web-based intelligent system for farmed European sea bass disease diagnosis that uses a combination of the ES approach with other KR approaches and a level-based diagnostic process. It can be regarded as an implementation of the general architecture proposed in [12]. Our main focus is on the hybrid reasoning scheme introduced here.
The contributions of this paper are the following:
  • A novel knowledge acquisition and representation method.
  • Introduction of a level-based diagnostic process for farmed fish diseases.
  • Introduction of a novel integration of reasoning approaches for disease diagnosis.
  • Integration of an image recognition system in the diagnosis process.
The structure of this paper is as follows: Section 2 presents background knowledge on knowledge representation and reasoning methods, whereas Section 3 presents a literature review on intelligent systems for diagnosing animal diseases. Section 4 deals with the knowledge acquisition process from ichthyology experts, the diagnostic process, the used diagnostic methods, and the image recognition system. Section 5 focuses on the user interface of the system, whereas Section 6 presents the system evaluation. Finally, Section 7 concludes this paper.

2. Background Knowledge

There are a variety of knowledge representation and reasoning (KRR) methods used in intelligent systems that make automated diagnoses. Systems for automated diagnoses are different from decision support systems, where a human is involved in the decision cycle. The most common KRR methods used in intelligent systems for animal disease automated diagnosis, as evidenced by the corresponding literature review (see next section), are rule-based reasoning, certainty factors-based reasoning, Bayes probabilistic reasoning, case-based reasoning, and ontology-based reasoning. In this section, we briefly present the basics of those methods.

2.1. Rule-Based Representation and Reasoning

Symbolic rules are the oldest and most popular KRR method used by experts and generally in intelligent diagnostic systems. Their popularity comes from the fact that they are natural representations of human knowledge, which makes it easy to comprehend the represented knowledge. The basic structure of a diagnostic rule is the following:
      if e1 and e2 and … en
then h
where each ei represents an evidence statement (e.g., symptom presence) and h represents the hypothesis (e.g., a disease). The evidence statements of a rule are connected to each other with logical connectives, commonly with “and”. When the evidence statements of a rule hold (or are observed), the hypothesis is derived, and the rule is said to be fired. Rules represent general knowledge regarding a domain. The following is an example rule from the domain of fish disease diagnosis:
                 R: if fish-weight > 15 and mouth-lower-jaw is deformed and anorexia is yes
then fish-disease is ceratothoa
In such systems, there are two basic inference strategies: forward chaining and backward chaining. The first is more common and natural for such cases; it starts from the evidence statements (known facts) and goes towards the hypotheses (derived facts), eventually ending up with the searched disease(s). Technically, the rules that can fire (i.e., their evidence statements hold) are found and produce their hypotheses, until a disease related hypothesis is reached. For an extensive treatment of rule-based reasoning see [5] (ch. 7) or [13] (ch. 2).

2.2. Rules with Certainty Factors

Given that in many situations, things are not always certain, there is a need to represent that uncertainty. Certainty may refer to a rule itself or to evidence statements. Rules provided by experts may not be 100% certain. Certainty Factors (CFs), introduced in the expert system MYCIN [14], are an old, empirical, but widely used method of dealing with uncertainty in rule-based systems.
CFs can take values in the interval [−1, 1], where “−1” means “totally uncertain”, “1” means “totally certain”, and “0” means “undefined” (this is an impractical case). Usually, CFs have positive values. The above rule is presented below, with a certainty factor of 0.7 (CFR = 0.7):
               R: if fish-weight > 15 and mouth-lower-jaw is deformed and anorexia is yes
then fish-disease is ceratothoa (0.7)
This means that when the rule is fired, the fact that “fish disease is ceratothoa” is derived with a certainty of 0.7. When using CFs, more than one rule with the same hypotheses but different evidence statements may be used. In such a case, if we have, let say, two rules, R1 and R2, with certainties CFR1 and CFR2, the common hypothesis is derived with a certainty CFR1R2 calculated by the following formula (which can be used for more rules consecutively), given that CFR1 and CFR2 are positive:
CFR1R2 = CFR1 + CFR2 (1 − CFR1)
In cases where the truth of the evidence is not totally certain, the certainty of the hypothesis is reduced. For example, in the above rule, if we have the following CFs for the three antecedents: CF1 = 0.6, CF2 = 0.8, and CF3 = 1.0, the CF of the hypothesis will be calculated as follows:
CF = CFe × CFR1, CFe = min (CF1, CF2, CF3)
given that we have only the “and” connective in the evidence statements. So, CF = min (0.6, 0.8, 1.0) × 0.8 = 0.6 × 0.8 = 0.48 (<0.7).
In practice, the CFs of elicited rules are given by the expert(s) during the design phase, whereas the CFs of the evidence statements are given by the user(s) of the system during its running phase. For an extensive treatment of rule-based reasoning, see [5] (ch. 8) or [13] (ch. 3).
In most diagnostic systems that use CFs, especially those dealing with fish diseases, the CFs of the evidence statements are given by the experts during the design of the system as representing the importance of the corresponding evidence (symptom) in deriving the hypothesis and are treated as normal CFs [15,16]. This is not absolutely correct, because the semantics of a CF are not related to its importance but to the uncertainty of the symptom. Therefore, in such cases, they should be treated in a different way (see our approach in Section 4.3.3).

2.3. Probabilistic Reasoning with Bayes Theorem

As we saw above, the interpretation of a rule in diagnostic systems is as follows:
if e (evidence)
    then h (hypothesis)
which is exactly the diagnostic task of an expert: given some medical evidence, derive a corresponding hypothesis (disease). This is a case of abductive reasoning, which does not assure a 100% correct conclusion. That is, a hypothesis is concluded with some probability. The answer to the question of whether we can compute that probability is the Bayes theorem, expressed by the following formula:
p h / e = p e / h × p ( h ) p ( e )
where p(h/e) is a conditional or posterior probability, which represents the probability that hypothesis h holds given that evidence e holds (or is observed). A more convenient formula (from a computational point of view) for the Bayes theorem is the following:
p h / e = p ( e / h ) × p ( h ) p e / h × p h + p ( e / ¬ h ) × p ( ¬ h )
given that e depends on the mutually exclusive h and ¬h.
Given that in reality there are multiple evidence (e.g., symptoms) and more than one hypothesis (disease), Bayes developed a generalization of the above theorem for n elements of evidence and m hypotheses, as follows:
p ( h i / e 1 e 2 e n ) = p ( e 1 / h i ) × p ( e 2 / h i ) × × p ( e n / h i ) × p ( h ) k = 1 m p ( e 1 / h k ) × p ( e 2 / h k ) × × p ( e n / h k ) × p ( h k )
which holds when h1, h2, …, hm are mutually exclusive and exhaustive, and e1, e2, …, en are mutually exclusive, exhaustive, and conditionally independent of any hi. In practice, the required probabilities are given by the experts. Then, all conditional probabilities p(hi/e1e2en) are calculated, and the hypothesis with the largest conditional probability is proposed as the conclusion. For an extensive treatment, see [13] (ch. 3).

2.4. Case-Based Reasoning

The main idea of case-based reasoning (CBR) is to store a large set of previous (solved) cases with their solutions in a case base (or case library) and use them to deal with (solve) new (similar) cases [6,17]. There is no specific way to represent stored cases. Various schemes can be used for that, like semantic nets, frames, objects, patterns, and even rules.
CBR works in a way that can be represented by the so-called CBR cycle [16]: (a) retrieve (the most similar case), (b) reuse (that case to create a solution), (c) revise (the solution to adapt to the case at hand), and (d) retain (the produced case as a new case).
Whenever a new input case has to be dealt with, the case-based system performs an inference following the above four phases. In the retrieval phase, the system retrieves from the case base the most relevant stored case(s) to the new case. In the reuse phase, a solution for the new case is created based on the most relevant case(s) retrieved. The revise phase validates the correctness of the proposed solution, perhaps with the intervention of the user. Finally, the retain phase decides whether the knowledge learned from the solution of the new case is important enough to be incorporated into the system’s case base.
Similarity metrics are used for assessing the relevance of the existing cases to the new cases, such as ‘Jaccard’, ‘Sorensen–Dice’, ‘Otsuka–Ochiai’, ‘Simpson’, ’Kulczynski2’, etc. There are various methods that use the above metrics, like the nearest neighbor approach, which is most commonly used for small cases.

2.5. Ontology-Based Representation and Reasoning

An ontology refers to a formal representation of knowledge within a domain. It defines a set of concepts and the relationships between them, providing a structured and organized framework for understanding a specific domain of knowledge. It is tightly related to the Semantic Web. Key components of an ontology are:
  • Concepts (domain entities organized in hierarchies, regarded as classes)
  • Relationships (between concepts)
  • Properties (attributes of the concepts that define them)
  • Axioms or Rules (logical statements that hold true in the domain)
  • Individuals (specific entities, regarded as instances of classes)
Reasoning with ontologies means making explicit the implicit knowledge represented in the ontology. Ontologies are based on the description logic model. The types of reasoning that can be accomplished in an ontology are:
  • Class hierarchy reasoning
  • Concept subsumption
  • Property restriction inference
  • Consistency checking
  • Rule-based reasoning
  • Logic-based reasoning
OWL is a semantic web language for constructing ontologies on the web. SWRL is a semantic web language for constructing first-order rules. SWRL rules are often used for producing new knowledge based on the knowledge explicitly represented in an ontology. For a comprehensive introduction to ontological reasoning, see [18].

3. Related Work

A variety of intelligent systems have been recently developed that deal generally with animal disease diagnosis and specifically with fish disease diagnosis. As a matter of fact, most of them use some kind of rule-based reasoning.
The authors in [19] use rules with certainty factors (CFs) in their conclusions for the diagnosis of horse diseases. Conditions of the rules, which represent symptoms of the diseases, are assigned a weight factor given by the experts. A CF is also assigned to each condition by the users during system running. Additionally, there is a threshold for the conclusion CF, over which the conclusion is acceptable.
The system in [20] is an expert system for fish disease diagnosis that uses case-based reasoning combined with an expert symptom scoring method. Both methods are used after the input of symptoms, and their results are compared. If the results are different, the system shows the symptoms of both diseases to the user and asks for re-entering symptoms until common results are produced. If the results are the same, then the case similarity metric is checked; its value should be between 0.65 and 0.95. If it is not, the user is asked either to accept it, despite the low similarity, or re-enter symptoms.
The system in [21] uses rule-based representation to relate symptoms to diseases, elicited from experts in the field. A forward-chaining strategy for dog disease diagnosis is proposed.
The Expert System in [15] is based on the CFs method for diagnosing Catfish Diseases. It does not use rules but works directly with CFs. Symptoms are associated with diseases of Catfish and a weight is associated with each symptom, representing its influence on the associated diseases. The user is asked to specify the symptoms, and the system calculates the CFs of all affected diseases. The disease with the largest CF is the most certain. The MYCIN expert system’s calculation formulas are used. However, there are two problems with this paper. First, the provided CFs (weights) have only two different values (0.7 and 0.8). Second, the same weight for each symptom is considered for all diseases, which may not be reasonable.
The system in [22] concerns the diagnosis of cattle diseases, where a hybrid approach is employed. Case-based reasoning (CBR) is primarily used, and if it fails, rule-based reasoning (RBR) takes over. Domain knowledge is represented via an ontology and a relational database. Discrete weight values are assigned to the specified symptoms. The nearest neighbor approach is used for assessing case similarity.
The System of Diagnosing Koi’s Fish Disease [23] uses rules with CFs for knowledge representation and reasoning. A Koi fish disease-symptoms association table is used for extracting rules. The weights of the symptoms were specified by numerical interpretation of the uncertain terms (e.g., not probably, maybe not, probably, almost certainly) used by the experts and considered as CFs of corresponding rule antecedents. Also, rule CFs were assigned in the same way. The users can complete an input form by choosing the symptoms of the koi fish and answering some questions regarding the symptoms. After the validation is over, a solution is presented, along with a level of confidence.
The system in [24] includes an ontology that represents knowledge elicited from experts and concerns concepts such as disease, symptom, body system, treatment, etc., implemented in OWL. The system uses rule-based reasoning for the diagnosis of cattle diseases based on the symptoms provided by the user. Symptoms are assigned weights, representing their significance in the diagnosis. Rules are implemented in SWRL.
An expert system for the diagnosis of chicken diseases is presented in [25]. The system uses the Bayes theorem for making diagnoses in a forward-chaining way. The required probabilities are given either by experts or taken from statistical reports.
A pure CBR model is used in [26] for fish disease diagnosis. Knowledge elicited from experts and other sources was formulated in 10 cases concerning 6 diseases and 15 symptoms, mainly concerning external clinical signs, and considered the golden cases. The Euclidean distance metric is used for estimating case similarities. The system was evaluated with a set of 40 new cases and achieved an accuracy of 95% compared with the diagnosis results of an expert. The case base looks quite simplistic.
In [27], the authors created an expert system for diagnosing diseases of the freshwater Betta fish. They use a forward-chaining rule-based approach, where rules are produced from a disease-symptom association table completed by experts in the field and related sources of knowledge, which is then converted into a decision tree. Only external clinical signs are considered.
The system in [28] uses a forward-chaining rule-based approach for Catfish disease diagnosis. Again, a disease-symptom association table is used for extracting production rules. The system provides an interface for problem data input and a result display after a diagnosis is performed. Only external clinical signs are considered.

4. Materials and Methods

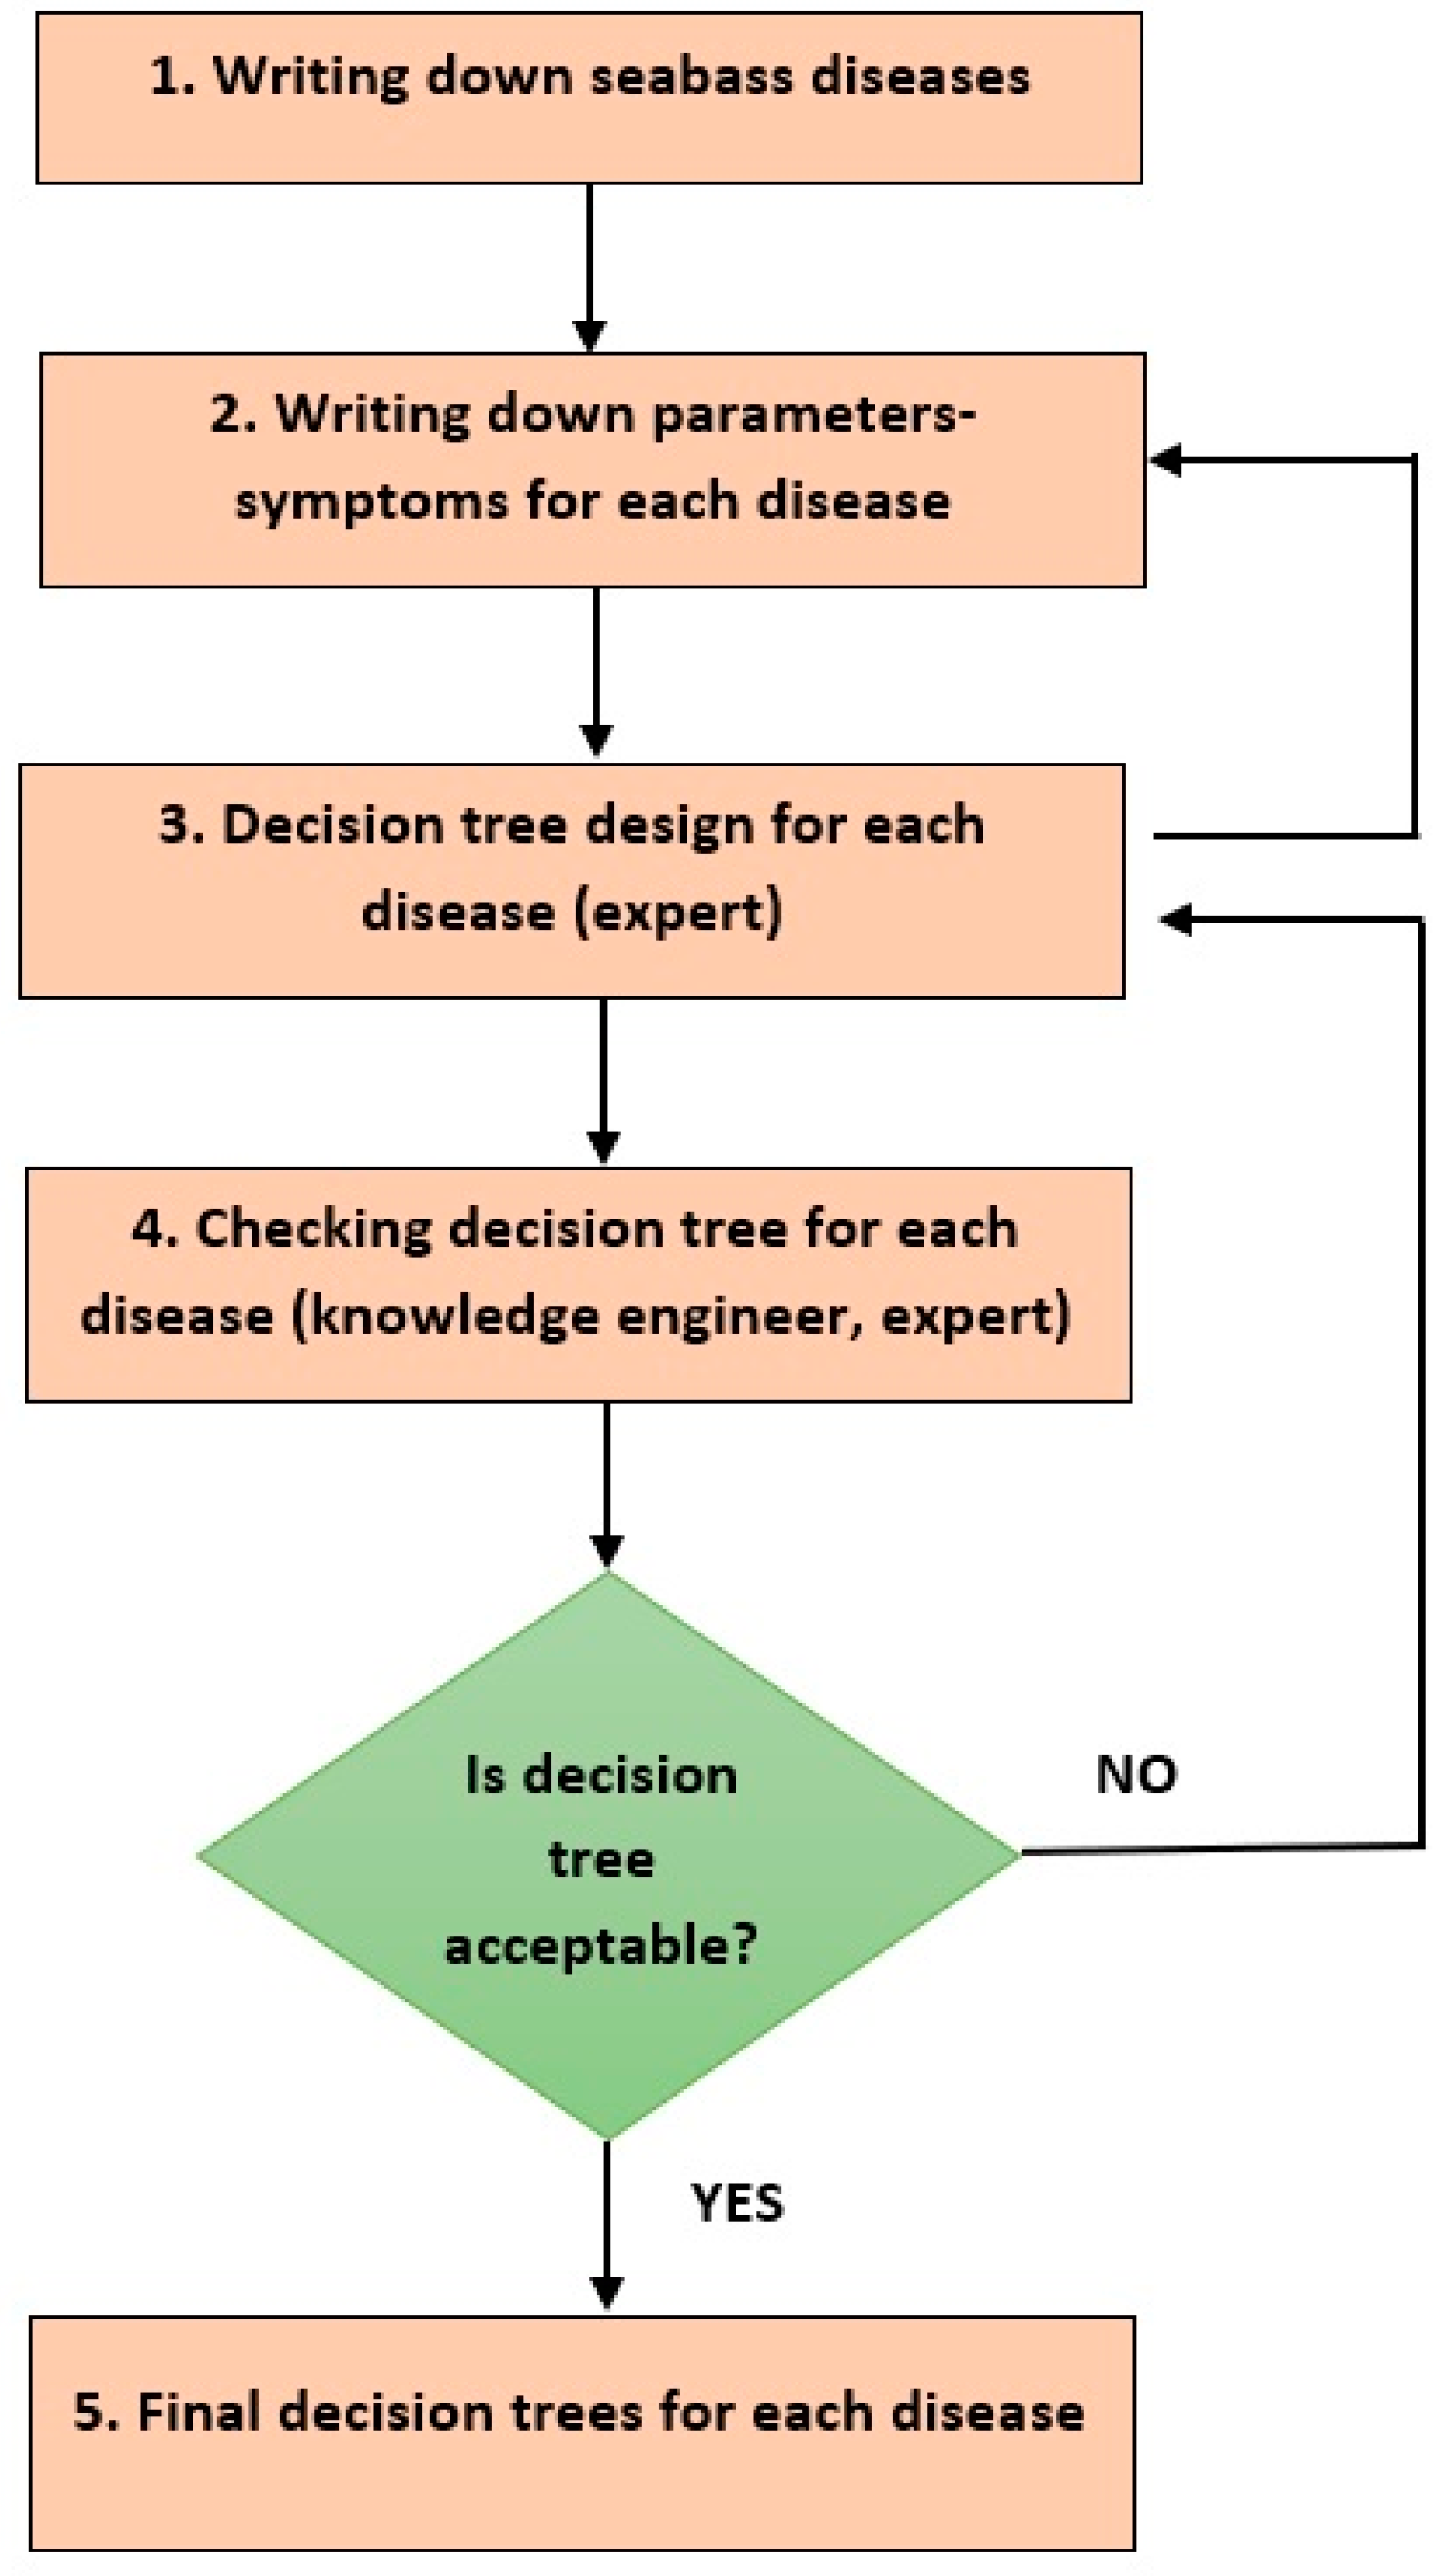
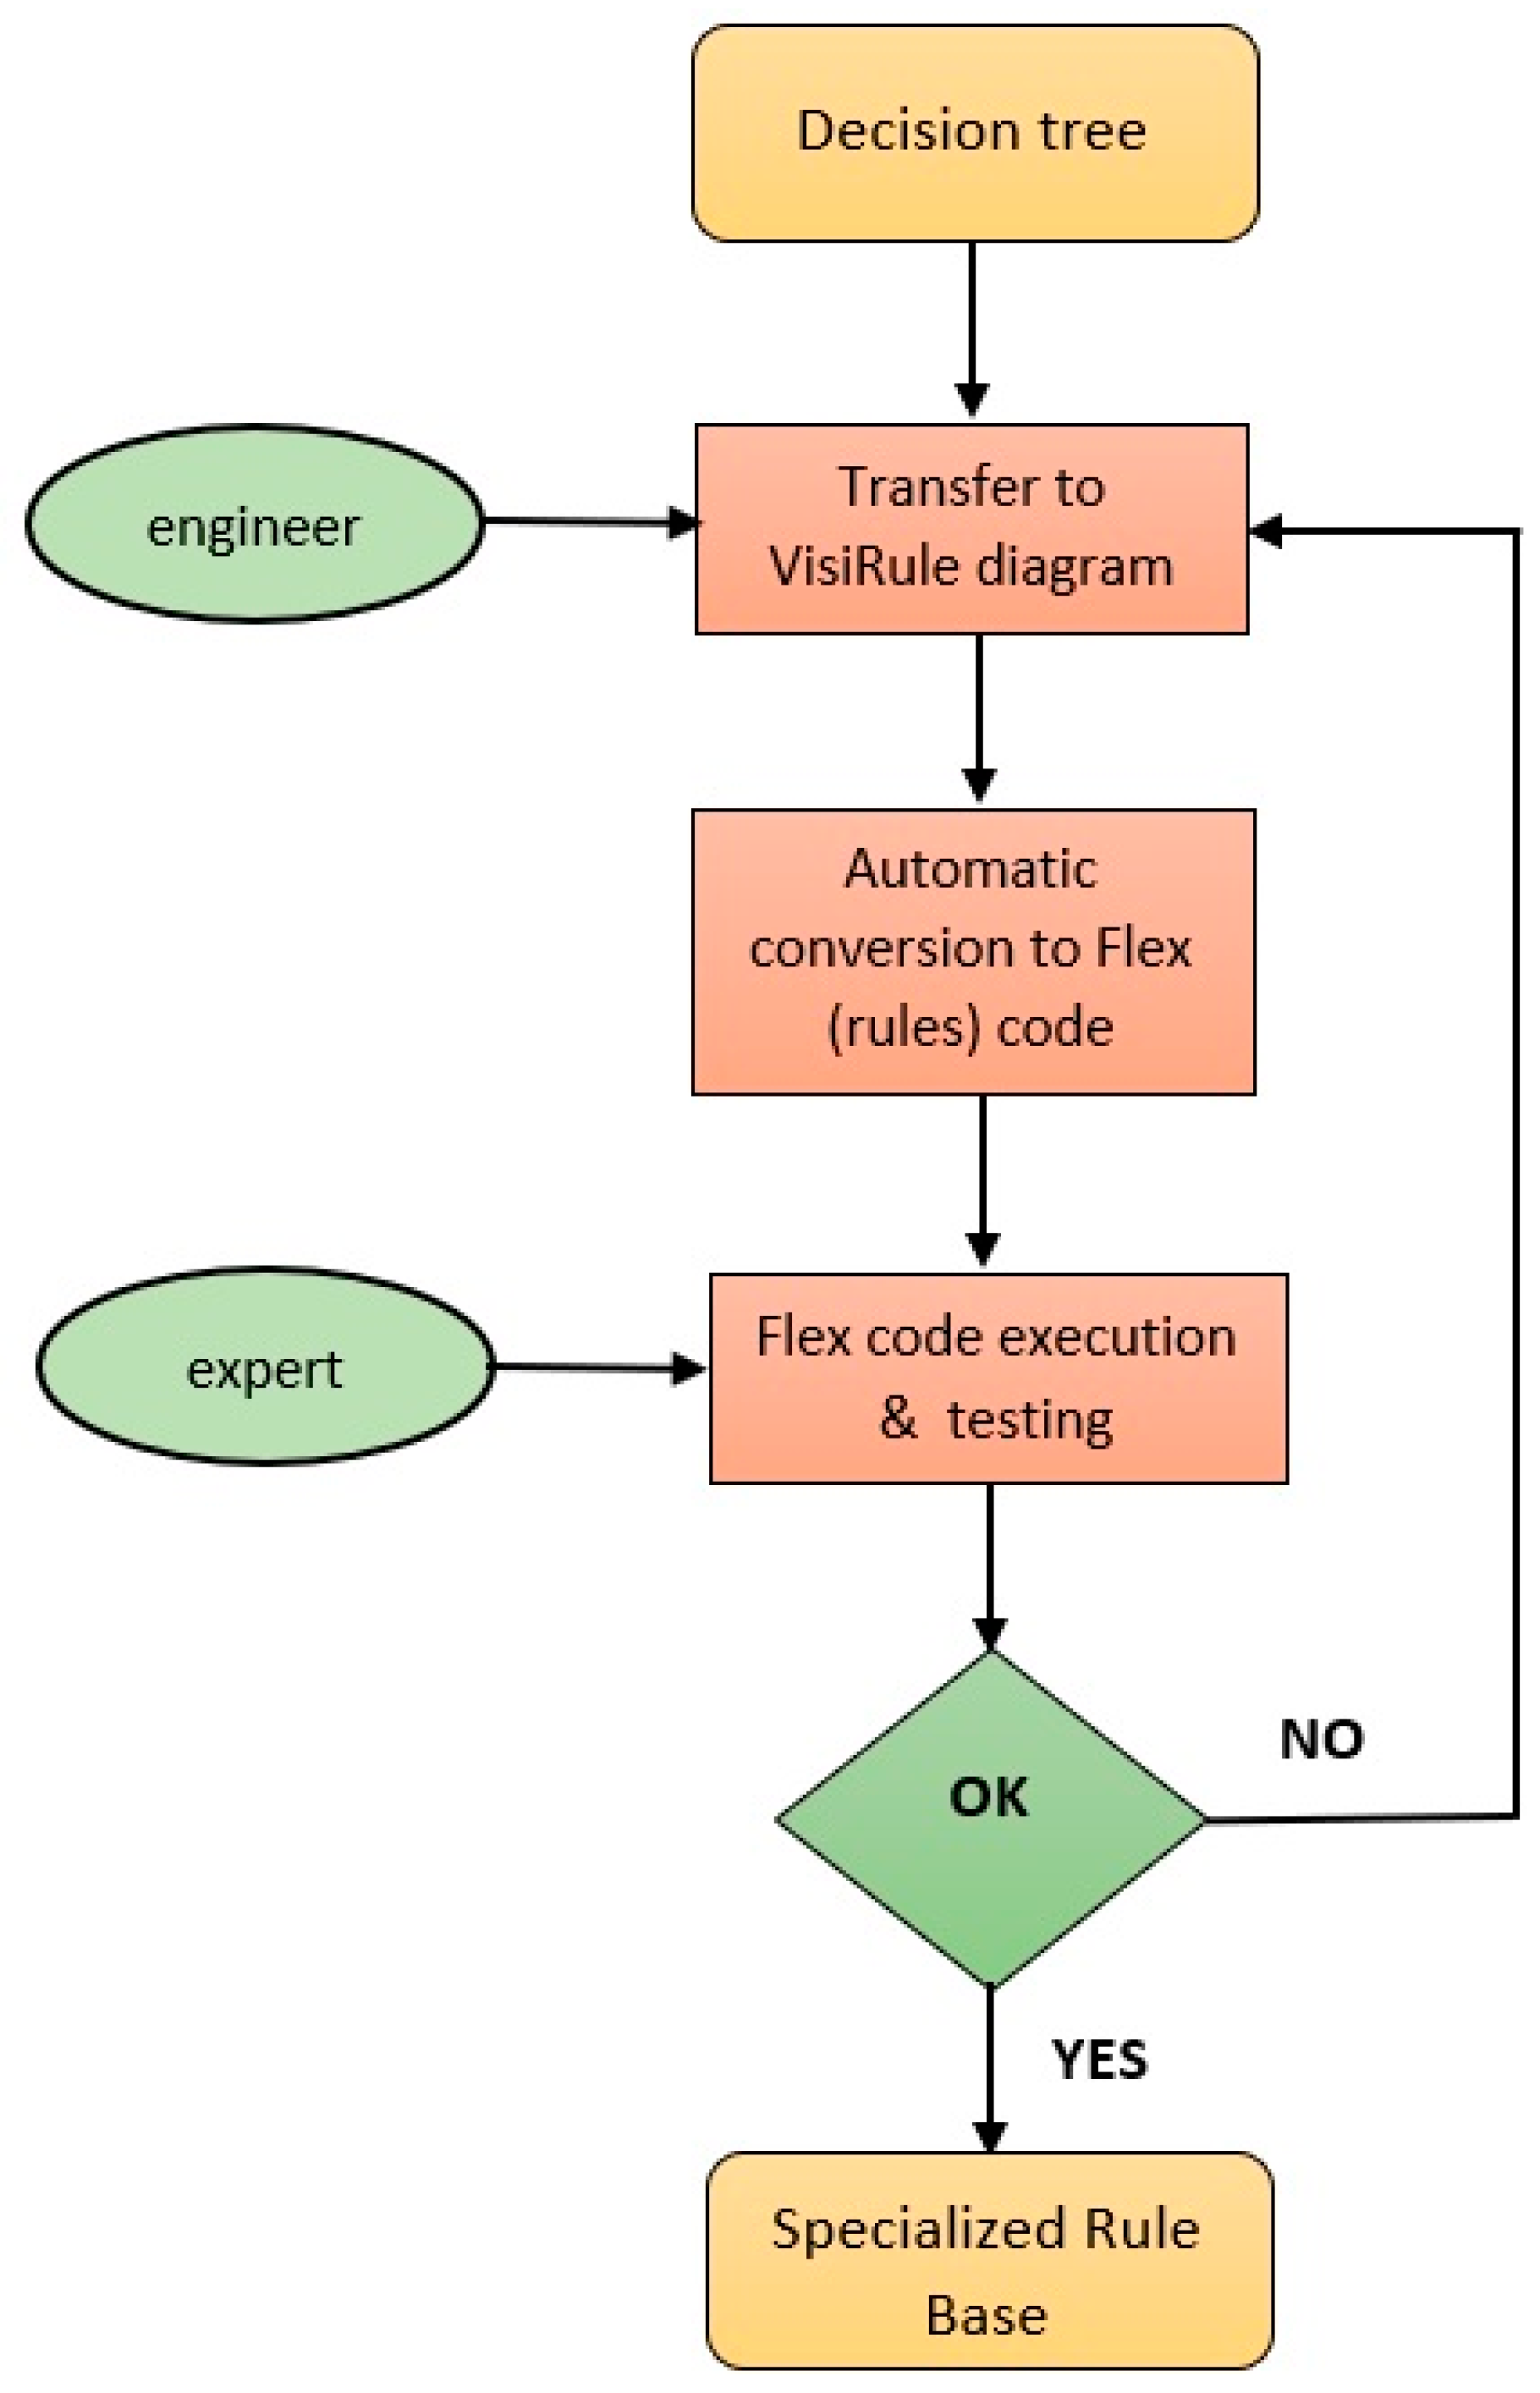
4.1. Knowledge Acquisition and Representation

There are various sources of knowledge to acquire such knowledge, such as the world wide web, databases, atlases, etc., but the main source of diagnostic knowledge is the experts in the field. Knowledge elicitation from experts for the creation of expert systems is a difficult process and is a bottleneck in the development process of such systems. Experts are not always able to convey this knowledge through verbal descriptions because it is not easy to put into words something that has become their experience and acts most of the time automatically, unconsciously. To overcome this difficulty, various methods are used to obtain this knowledge, such as interviews, observation, questionnaires, charts, etc.
In our case, we used the interview and decision tree methods to capture the knowledge of the experts involved in the project. Several interviews were conducted with all four fish pathologists, who were instructed how to record the European sea bass disease diagnosis procedures in decision trees, upon which subsequent successive interviews were conducted, in order to arrive at the final trees, which were converted to production rule sets in the expert disease diagnosis system. There were various problems, which were overcome. One of them was the adaptation of each side (engineers, ichthyologists) to the technical terminology of the other, but also of the ichthyologists among themselves. There was difficulty in understanding the decision trees by ichthyologists, which was gradually overcome. Figure 1 illustrates the process followed for knowledge acquisition from fish pathologists.
First, the European sea bass diseases were recorded. These diseases are shown in Table 1. The list is not exhaustive but includes a major part of sea bass diseases. Also, metabolic diseases were not analyzed further because such an analysis was not considered necessary. Then, the parameters and symptoms related to the diagnosis of each sea bass disease were recorded.
Then, the process of creating the decision trees for each disease began. Project Fish Health Specialists (FHSs) were given standard decision tree diagrams and explained how to design and operate them. The first diagrams had difficulties. It was observed that the semantics of the decision trees had not been understood by FHSs, and therefore several sessions of correcting the trees took place. The systematic effort to record the reasoning dures as well as a re-evaluation of the parameters/symptoms recorded. This is illustrated in Figure 1 by the feedback to step 2 from step 3.
In Table 2, the parameters and the symptoms related to the disease Myxobacteriosis are presented as an example.
Also, after each change to a decision tree, there was a validation check of the tree with itself but also in relation to other related trees, which usually led to changes in the previous design of the tree; this was repeated until we arrived at a fully acceptable tree. This iterative process is captured in the flowchart in Figure 1 by the decision element after step 4 and the feedback arrow to step 3. Figure 2 shows an example of a decision tree, that of Myxobacteriosis.
The representation of the decision trees generated by the knowledge elicitation from the experts was carried out utilizing the VisiRule (https://www.lpa.co.uk/vsr.htm (accessed on 30 September 2023)) tool. This tool is ideal for such cases, as it allows for easy drawing of decision trees through its graphical interface. So, all the decision trees were captured through VisiRule. VisiRule is a graphical tool to develop and deliver rule-based expert systems, created by LPA (https://www.lpa.co.uk/ind_hom.htm (accessed on 30 September 2023)). The user can draw from the VisiRule graphical interface a decision tree and define the points where the program will request a value for one of the variables, the type of data they receive (e.g., numeric or alphanumeric), and how the flow of the decision-making line branches, depending on their value, leading to the diagnosis result (leaves of the tree). After the decision tree is finalized as a diagram in VisiRule, it can be exported as an expert Flex rule-based system (https://www.lpa.co.uk/flx.htm (accessed on 30 September 2023)), which practically contains Prolog code. This code can be executed in the LPA Prolog runtime environment to insert values into the required input variables and output diagnostics.
Figure 3 illustrates the process of creating a rule-based expert system for each decision tree through VisiRule. Each decision tree is transferred by the knowledge engineer to a corresponding VisiRule diagram, which is then converted into Flex rules automatically by the VisiRule system. To test the correct transfer of the decision tree to VisiRule, Flex code is executed and tested by the expert(s) in a recursive way. These expert systems are called specialized expert systems (SESs) because of their adaptation to a particular disease and constitute the golden standard diagnostic model.

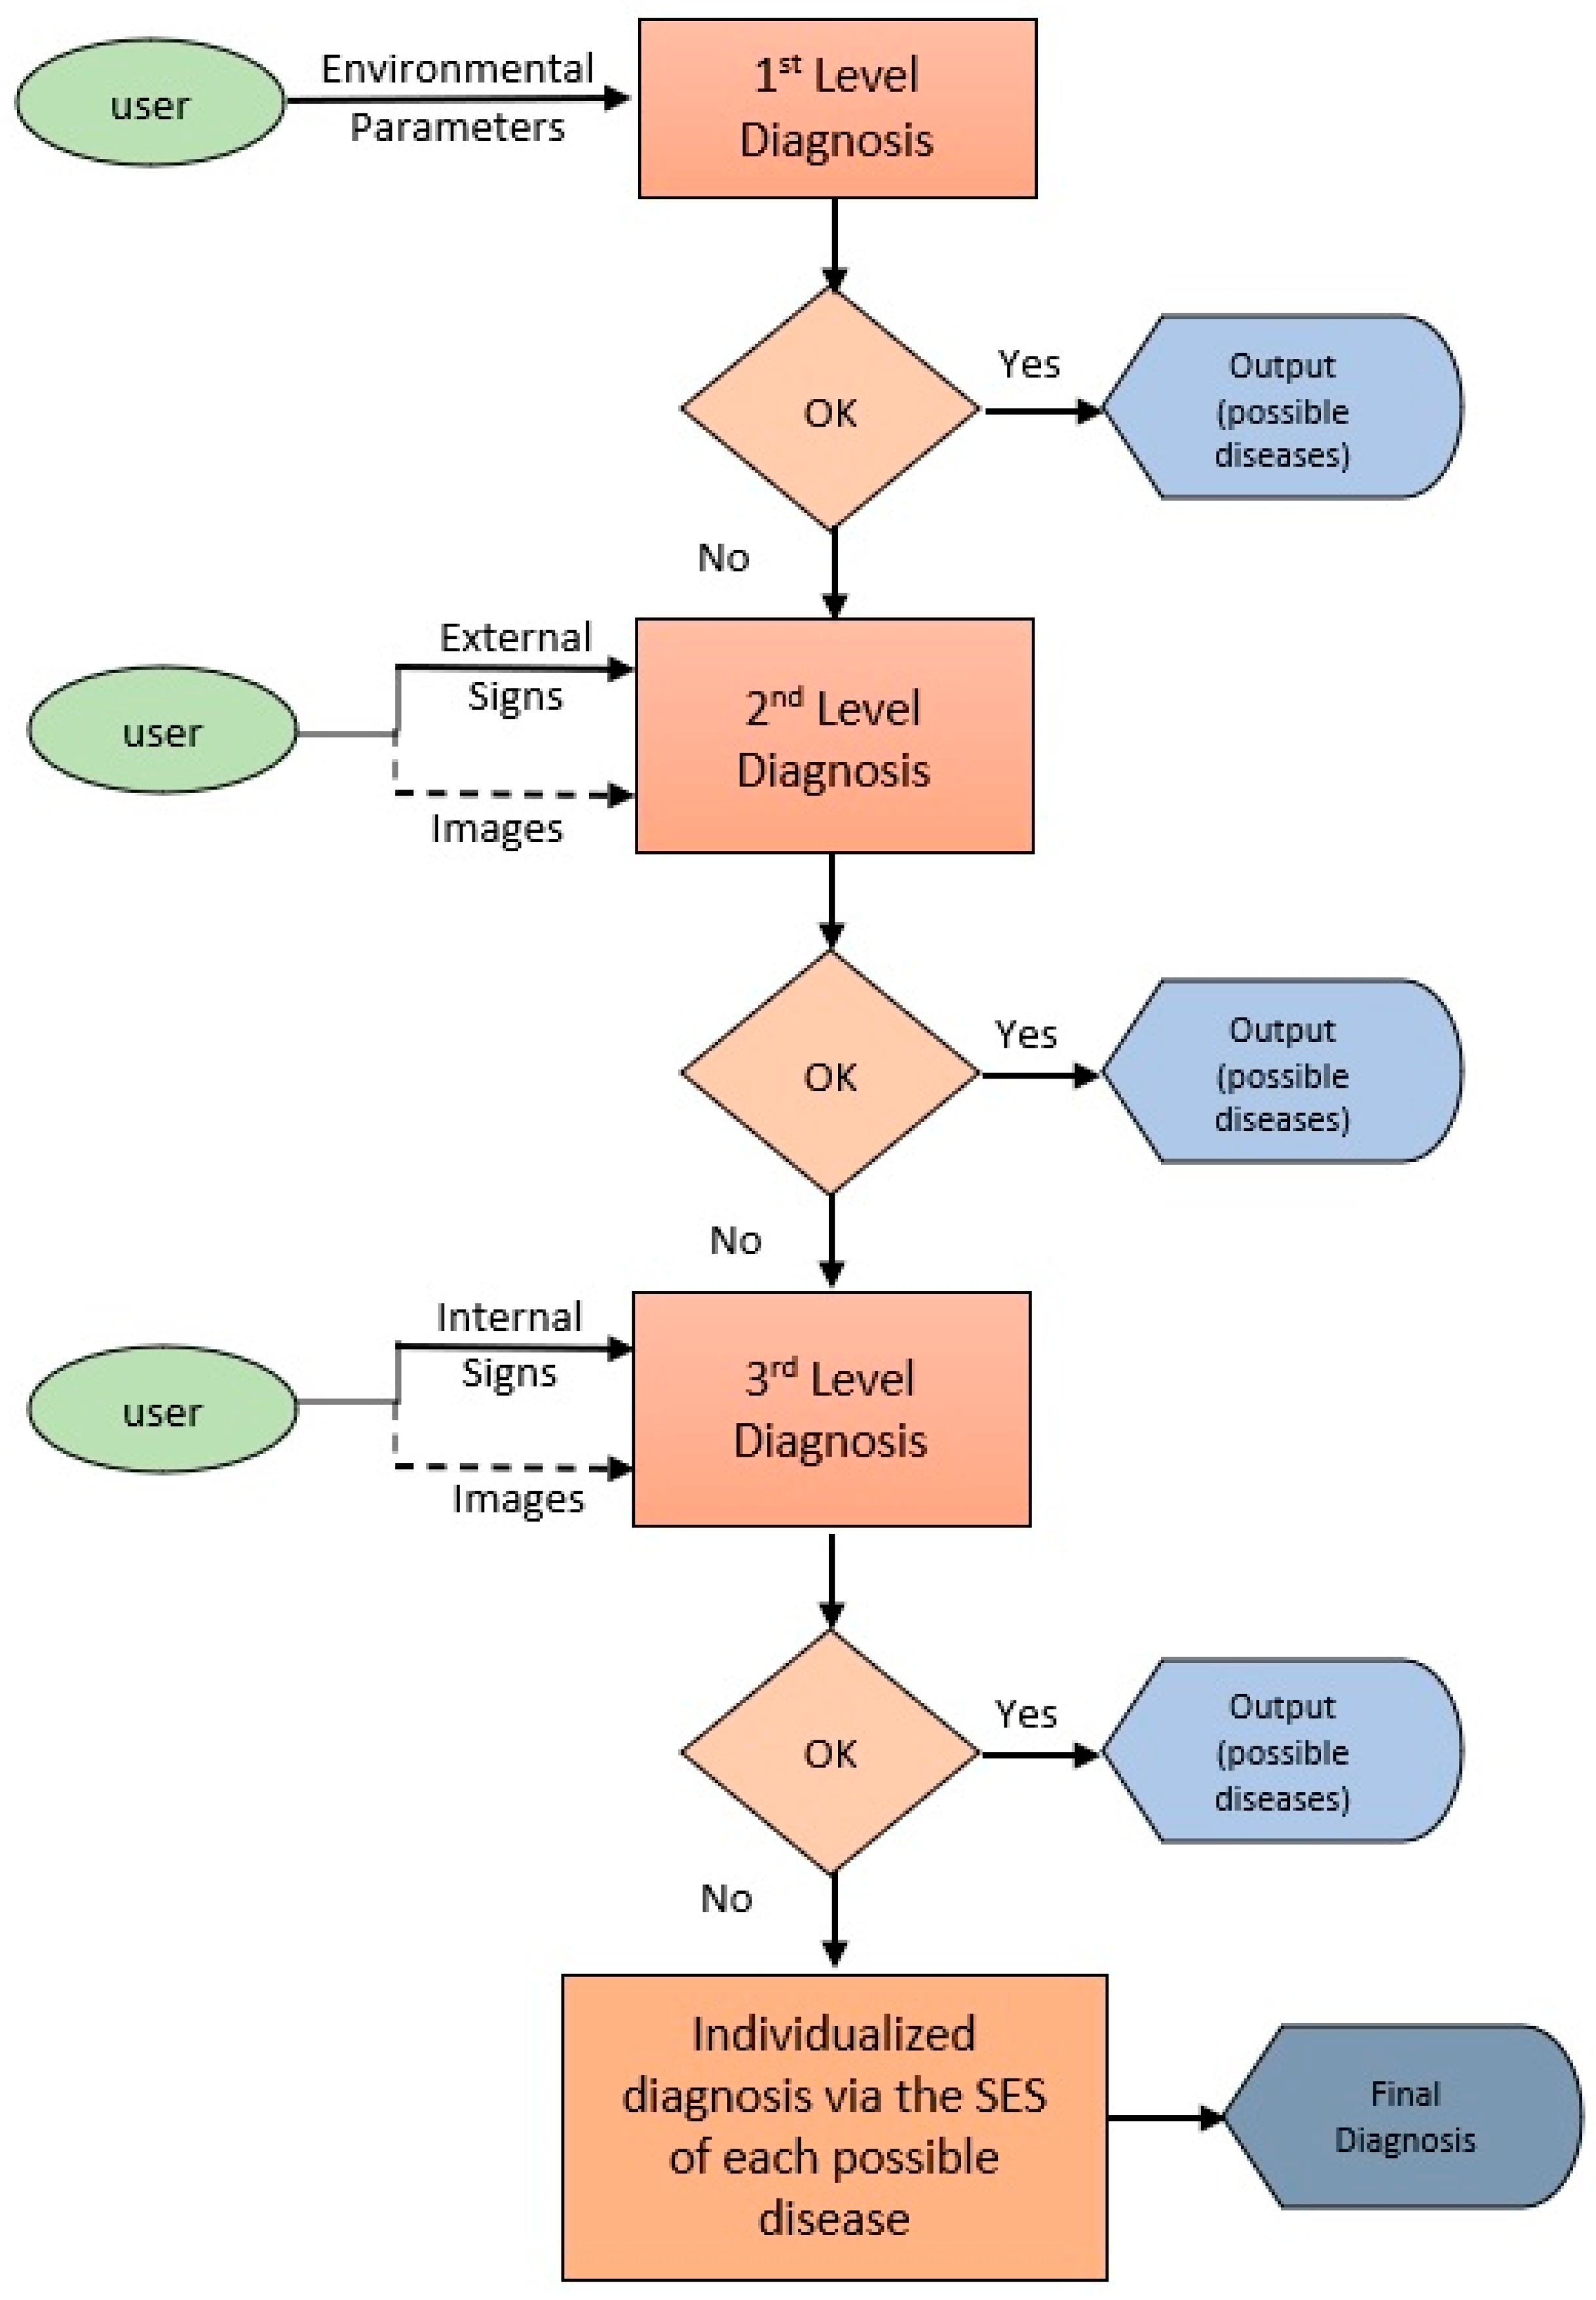
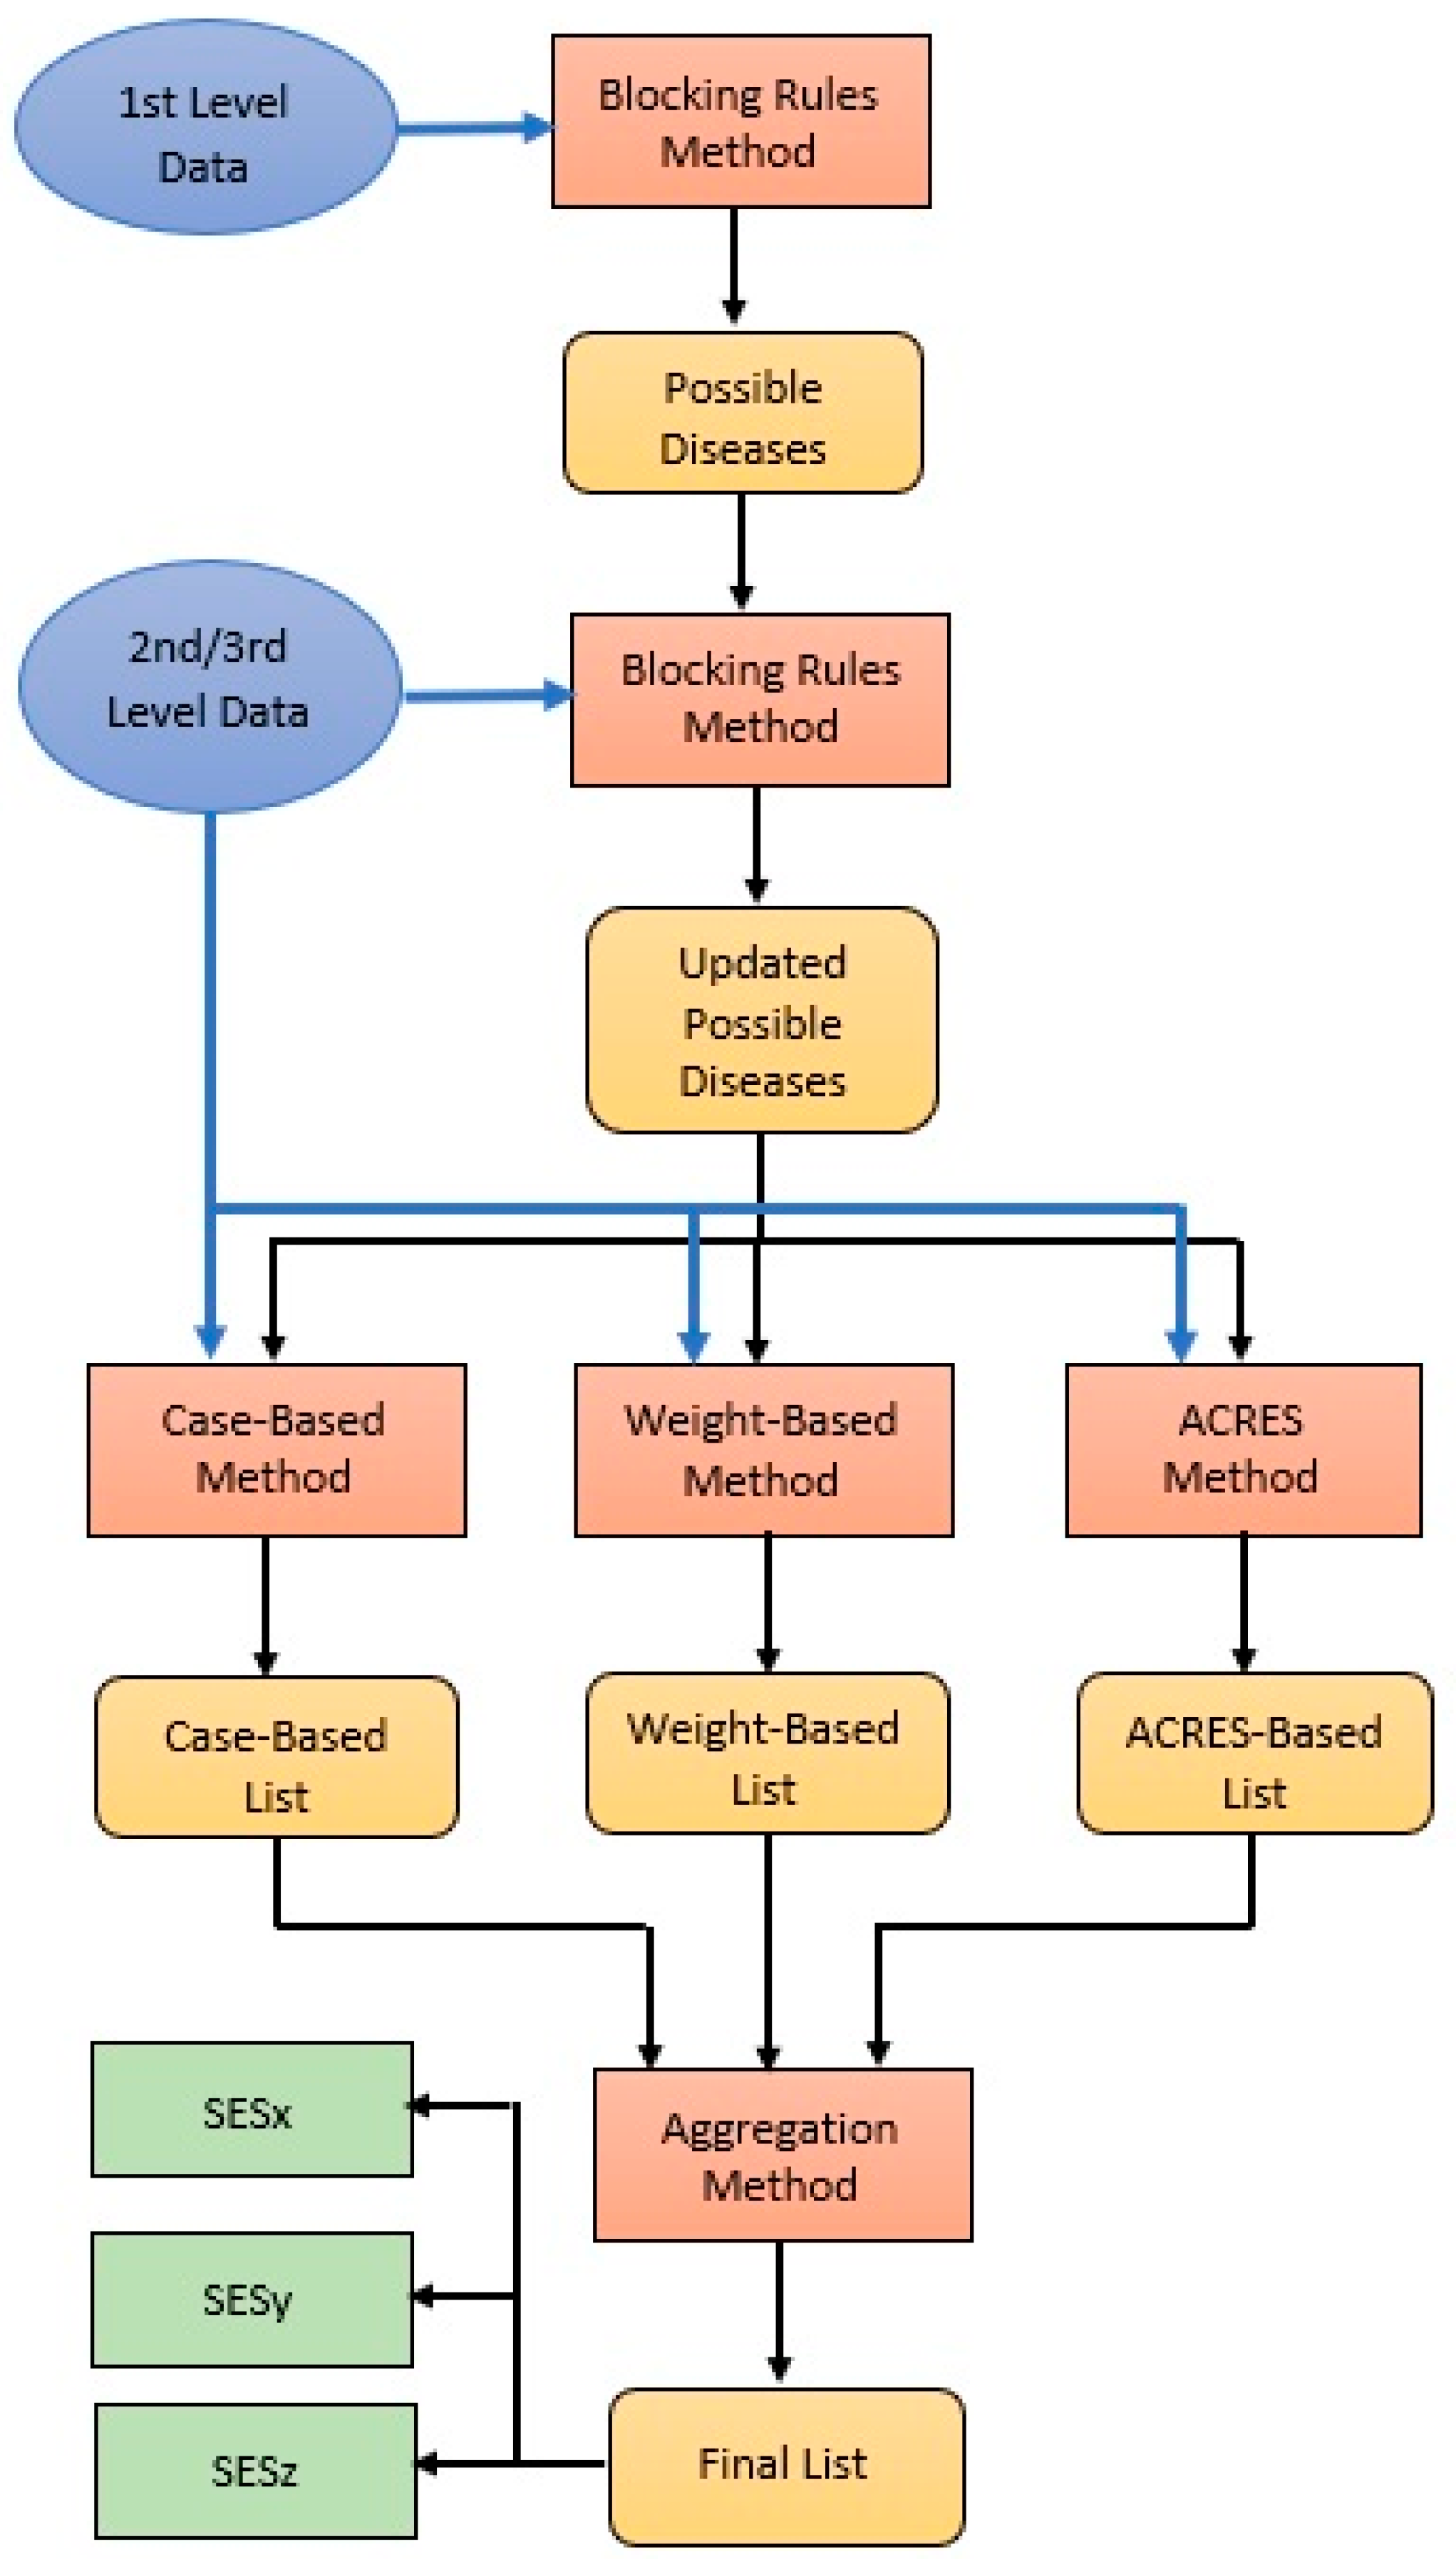
4.2. Diagnostic Process

The above-produced diagnostic SESs are autonomous; that is, each one of them is dedicated to one disease. Each SES essentially represents the steps that one must follow to arrive at a diagnosis for the particular disease. Each system usually starts with questions about environmental parameters, such as temperature or the average weight of the fish, continues with questions about external clinical symptoms and observations from the image of the fish inside the cage, then proceeds with questions about symptoms of internal organs, the answers of which require an operation on the fish, and ends up with questions related to the results of microbiological, microscopic, or other specialized laboratory tests. In practice, it is not convenient to use the individual diagnostic systems (decision trees) independently because one would have to start exploring the trees one by one until arriving at the possible disease(s). Also, in most cases, a quick, real-time decision based on elements that can be available on-site is desirable. This is why an attempt was made to unify, in some way, the individual systems and produce a general diagnostic system based on environmental, external, and internal clinical signs, that is, parameters whose values can be specified on-site. This general diagnostic system produces an ordered list of the three most probable diseases. After that, if required, the user can proceed with the corresponding three SESs to finalize the decision; so, in this way, the number of systems (diseases) to be examined is reduced.
In order to realize such a method, it was initially necessary to unify the parameters—symptoms—used in the decision trees. It is noted that the decision trees for each disease were designed with the participation of several experts, and the same practical symptoms were represented by different or slightly different phrases (terminologies) in the tree for each disease. So, an attempt was made to unify these expressions into one. The list of parameters progressed as we recorded the diagnoses as decision trees. Furthermore, for better presentation and use in the diagnostic process, they were divided into different categories. The final diagnostic parameters/symptoms and their categories are presented in Table 3.
Based on the above remarks and the way different categories of parameters were used in the decision trees, we concluded to use a level-based diagnostic process. So, we distinguish four levels of the diagnostic process (see Figure 4). At the 1st Level Diagnosis, only the environmental parameters (i.e., water temperature and fish average weight) are considered. They are quite crucial parameters whose values can exclude some diseases for further investigation. So, after the 1st level diagnosis, a reduced number of diseases are passing for consideration at the next level diagnosis.
At the 2nd Level Diagnosis, the external clinical symptoms are considered, distinguished in behavioral and physiological terms (Table 3). The user gives as input information about the observed external symptoms and/or their values (depending on the type of the symptom). In some cases, the user may provide an image of a fish, and the system calls the image recognition unit (see Section 2.4) to automatically extract the required information. The output of this level is a list of possible diseases, ordered from the most probable to the least probable. The number of diseases may be further reduced.
At the 3rd Level Diagnosis, the internal clinical symptoms are considered, distinguishing between gills and internal organs related symptoms (Table 3). The user gives as input information about the observed external symptoms or their values (depending on the type of the symptom). In most cases, the user may provide an image of a fish organ section. Then, the system calls the image recognition unit (see Section 2.4) to automatically extract the required information. The output of this level is a list of possible diseases, ordered from the most probable to the least probable. The number of diseases may be further reduced.
At the Final Level Diagnosis, if necessary, the user calls, one by one, the SESs of the diseases in the order provided in the output list.

4.3. Diagnostic Methods

4.3.1. Blocking Rules

To reduce the diseases under consideration, specific rules were extracted from the decision trees, which have as assumptions (conditions) parameters and/or values of parameters that are necessary for a disease to be possible. Each of these rules can be used to exclude one of the diseases if the necessary conditions are not met. Therefore, they are called blocking rules.
Here is an example of the coding for one of these rules (in JASON format):
{
“id”: “13”,
“disease”: “ceratothoa”,
“symptoms”: “anorexia, mouthDeformity, gillMucous”,
“min”: “1”,
“level”: 2
},
The above rule states that if at least one of the three symptoms (anorexia, mouthDeformity, gillMucous) does not apply, then the disease “ceratothoa” is excluded. It is also stated to be about level 2 symptoms/parameters.
A total of 41 blocking rules have been extracted from the decision trees, distributed between the three decision levels. So, given the input values for the parameters in the table above, the subsystem first performs a process based on these 41 rules. Each blocking rule, as we mentioned, describes some conditions that are considered necessary for the diagnosis of a disease. So, every rule that is NOT activated excludes a corresponding disease. At the end, the process returns a list of excluded diseases along with metadata that can be used to justify/explain the exclusion. Essentially, for each disease, the information from the rule that excluded it is contained. Accordingly, the list of remaining (probable) diseases is provided, again with justification information (which rules were tested).
Here is an example code of the information produced after the exclusion of the disease “ceratothoa” due to the rule we quoted above, which also contains an explanation of the exclusion.
{
“disease”: “ceratothoa”,
“symptoms”: [“anorexia”, “mouthDeformity”, “gillMucous”],
“symptomsLabeled”: [“Anorexia”, “Lower Mouth Deformities”,
       “Mucous Discharge in the Gills”],
“minVal”: “1”,
“label”: “CERATOTHOA (PARASITE)”,
“explanation”: “It is excluded because at least 1 of the following symptoms must be present: <b>Anorexia</b>, <b>Mouth side deformities</b>, <b>Mucous secretions in the gills</b>.”
}
In this way, an explainability feature is given to the system.

4.3.2. Case Based Ordering (CBO)

For those diseases that were not excluded by the previous method, the system calculates and displays an indicative ranking (from the most likely disease to the least likely). Again, based on the information captured in the decision trees, the system provides for each disease the symptoms associated with it. Thus, it can make a comparison for each of the possible diseases between its symptoms and the symptoms given by the user and derive a similarity metric so that it can rank them. Specifically, a record was made for each disease of the symptoms found in the check points of the corresponding decision tree. Thus, a table was formed where each row represents a symptom and each column a disease. Table 4 depicts an indicative part of the table, showing the associated symptoms for 4 of the 12 diseases (where “X” means the presence of a symptom/parameter, whereas categorical values are displayed).
The knowledge in this table has been implemented as cases in JSON format, one for each disease in the table. E.g., the JSON record for CERATOTHOA is:
{
DISEASE”: “ceratothoa”,
weightLoss”: false,
deaths”: false,
anorexia”: true,
lethargy”: false,
swimActivity”: false,
colorDarkening”: false,
discoloring”: false,
mouthDeformity”: true,
finTailRot”: false,
scalesLoss”: false,
bleeding”: false,
stomatitis”: false,
ulcers”: false,
scoliosis-lordosis-hypercalcifications”: false,
gillDiscoloring”: false,
gillMucous”: true,
anemicGills”: false,
granulomatosis”: false
}
From the above JSON descriptions, instances containing the list of symptoms associated with the respective disease are generated. For example, the list of symptoms for “ceratothea” disease is as follows:
[‘anorexia’, ‘mouthDeformity’, ‘gillMucous’]
These cases are called basic cases and stored in the case base. Also, user input is captured as a list of symptoms, called an input case, as in the following example:
[‘deaths:no’, ‘anorexia’, ‘lethargy’, ‘swimActivity:normal’,
‘swimBladderControlLoss’, ‘colorDarkening’, ‘visionDifficulties’]
In this method, diseases are ranked based on some similarity metric, which represents the degree of similarity between the user input case and the disease base case based on the reported symptoms and has a value in [0,1].
Existing similarity metrics are based on three key metrics:
  • a: number of common elements in the two lists
  • b: number of elements present only in the user list (user provided symptoms)
  • c: number of items present only in the disease list (disease symptoms)
We considered several metrics for case similarity, like ‘Jaccard, ‘Sorensen–Dice’, ‘Otsuka–Ochiai’, ‘Braun-Blanquet’, ‘Simpson’, ‘Sokal & Sneath’, and ‘Kulczynski2’. Having experimented with the above metrics, we realized that their similarity values sometimes differ substantially. So, we decided to exclude the two of them that produce the max and min values. The rest were divided into two groups with relatively similar values. Then, we chose one of each group so that their average values were close to the average values of the other two. The Jaccard and Kulczynski2 metrics [29] were chosen, which are calculated according to the following formulas:
jacc = a/(a + b + c) or = 1, if a = b = c = 0
kulcz2 = 1, if a = b = c = 0
kulcz2 = 0, if ((a = b = 0 ≠ c) or (a = c = 0 ≠ b))
kulcz2 = [(a/(a + b)) + (a/(a + c))], otherwise
The final similarity value is calculated as the average value of the values of the two metrics:
similarity = ½ (jacc + kulcz2)
The method returns a list of the diseases ordered on the basis of the similarity values of their base cases compared to the user input. This is a type of case-based reasoning (CBR) method that follows the standard CBR cycle: retrieve-reuse-revise-retain [6], where we use a novel combination of similarity metrics. Therefore, the system provides a facility for inserting new base cases (see Section 5) to implement the retain phase.
In addition to the similarity metric that was calculated, the process includes in the output information on how many and which were the common symptoms, as well as information on which symptoms of the disease were not considered at all by the user.
Essentially, in this method, the more common symptoms there are, the higher the metric will be, but at the same time, it decreases its value if the user declares some additional symptoms that are not related to the disease.

4.3.3. Method of Weights (WM)

This method uses some kinds of weights given by experts. After the symptoms related to each disease were determined and the decision trees were produced, the experts were asked to assign a value to each parameter/symptom, except those of the 1st decision level, showing how important the presence of the symptom is considered for the diagnosis of the corresponding disease, which is called the symptom significance factor (SSF). Those values were then normalized with the min-max technique so that their sum equals ‘1’ at each decision level. Based on SSFs, a level significance factor (LSFx) at each decision level x (x = 2, 3) is determined as the sum of the SSFs of the common (let say k) symptoms between those given by the user and those related to the disease:
L S F x = i = 1 k S S F i
The LSFx shows how important the given symptoms of level x are in diagnosing the disease. So, with this metric, not just how many common symptoms there are matters, but also how important they are. As it is obvious, additional symptoms not related to the disease do not contribute to the LSFx.
We indicatively present the “ceratothoa” disease with its SFSs:
{
“DISEASE”: “ceratothoa”,
“symptoms”: {
“anorexia”: “0.09”,
“mouthDeformity”: “0.73”,
“gillMucous”: “0.18”
}
In this case, we have the following input from the user at decision level 3:
[
‘deaths:no’,
‘anorexia’,
‘lethargy’,
‘swimActivity:normal’,
‘swimBladderControlLoss’,
‘colorDarkening’,
‘gillMucous’
]
the LSF3(ceratothoa) is calculated as LSF3(ceratothoa) = 0.09 + 0.18 = 0.27, given that ‘anorexia’ and ‘gillMucous’ are the common symptoms and have as SSFs ‘0.09′ and ‘0.18′ respectively.
For each level x, for each disease, a level certainty factor (LCFx) has also been determined by the expert, showing how certain a decision about the disease is at that level if based only on the symptoms up to that level. If we have a LSF3(ceratothoa) at level 3, calculated as above, and LCF3(ceratothoa) is the corresponding level certainty factor, then we define the decision certainty factor for ceratothoa at level 3 (DCF3(ceratothoa)), which is calculated as follows:
DCF3(ceratothoa) = LSF3(ceratothoa) × LCF3(ceratothoa)
If LCF3(ceratothoa) = 0.8 was given by the expert, then DCF3(ceratothoa) = 0.27 ∗ 0.8 = 0.216.
Also, this is a novel method of reasoning using a combination of different significance or certainty factors. Existing expert systems [23,30,31,32] use the method of CFs based on MYCINs approach. To implement that approach, they ask the experts to assign a CF factor to each symptom, and the final CF is calculated based on those values. This approach has two problems: (a) the values assigned to each symptom by the expert(s) represent the significance of the symptom in diagnosing a disease, not the certainty of the observed value, which is the normal semantics of the CFs, and (b) each symptom is assigned one value independent of the disease, which is not valid. In our approach, the values assigned to symptoms are not considered CFs (because they are not); thus, their aggregate result is not calculated according to MYCINs policy, but they are added. Also, in our approach, the values assigned to a symptom may be different for different diseases. Additionally, they do not distinguish between levels of diagnosis and do not use level CFs.

4.3.4. The ACRES Method

ACRES is a tool that creates rule-based expert systems with CFs from datasets [33]. We used it for aphasia diagnosis in the past [34]. Because such data were not available in our fish-related case, we created a dataset from the decision trees based on blocking rules by producing all valid combinations of the values of the parameters/symptoms.
The ACRES training method is based on statistical data from the dataset, that is, how often the value combinations appear in the rule conditions for each disease. That dataset was used to build an ACRES rule-based system with CFs. This expert system returns a CF for each disease, which shows how certain it is that the corresponding disease prevails. So, the diseases are ranked according to those CFs (values in [0,1]). This expert system is used as a third method for producing a ranked list of possible diseases.

4.3.5. Aggregation Method (AGM)

The above three methods are applied in parallel at levels 2 and 3. After each level, if the user wants to conclude the diagnosis process, the results of the three methods are aggregated via an aggregation method, and a final ordered list is produced (see Figure 5).
We follow a kind of Majority Voting algorithm as the aggregation method. The input to the algorithm is three ordered lists, and the output is an ordered list of the three most probable diseases. The algorithm works as follows:
  • The most common of the three first ranked diseases in the three lists gets first in the final list. If all the first three are different, majority voting is applied to the three first ranked plus the three second ranked, and so on.
  • To determine the second disease in the final list, we apply majority voting to the first three and the second three diseases in the lists after removing the occurrences of the disease selected as first in the final list in the previous step in the same way.
  • This continues until the third most probable disease on the final list is determined.

4.3.6. Overall Diagnostic Process

As mentioned above, all three diagnostic methods are applied in parallel at all levels, except level one. Only blocking rules are applied to all levels. The overall diagnostic process is depicted in Figure 5.
At the first level, blocking rules for this level are applied, which reduces the number of candidate diseases. At the second level, again, the first blocking rules of this level are applied, which may further reduce the number of diseases. Consequently, the three diagnostic methods are applied to the updated list of candidate diseases, and three separate ordered lists are produced. Then, the aggregation method is applied, and a unified ordered list is produced from the three separate lists. This is repeated at level three, except if the user does not want to continue, is satisfied with the result, or cannot give further information. Corresponding Algorithm 1 describes the process.
Algorithm 1: Overall Diagnostic Process
input: L = [d1, d2, …, dn]: all diseases list,
BRx: blocking rules of level x ϵ {1,2,3},
x = 1: level counter,
exit = false
output: L = [dp1, dp2, …, dpm]: ordered possible diseases
1.
obtain Levelx user input;
2.
apply BRx, based on user input;
remove blocked di from L;
3.
x = x + 1;
4.
while x ≤ 3 do
obtain Levelx user input;
apply BRx, based on user input;
remove blocked di from L;
apply CBO to L and put result in LCBO;
apply WM to L and put result in LWM;
apply ACRES to L and put result in LACRES;
return LCBO, LWM, LACRES;
obtain user input for exit;
if exit = true then exit;
x = x + 1;
5.
apply AGM to LCBR, LWM, LACRES

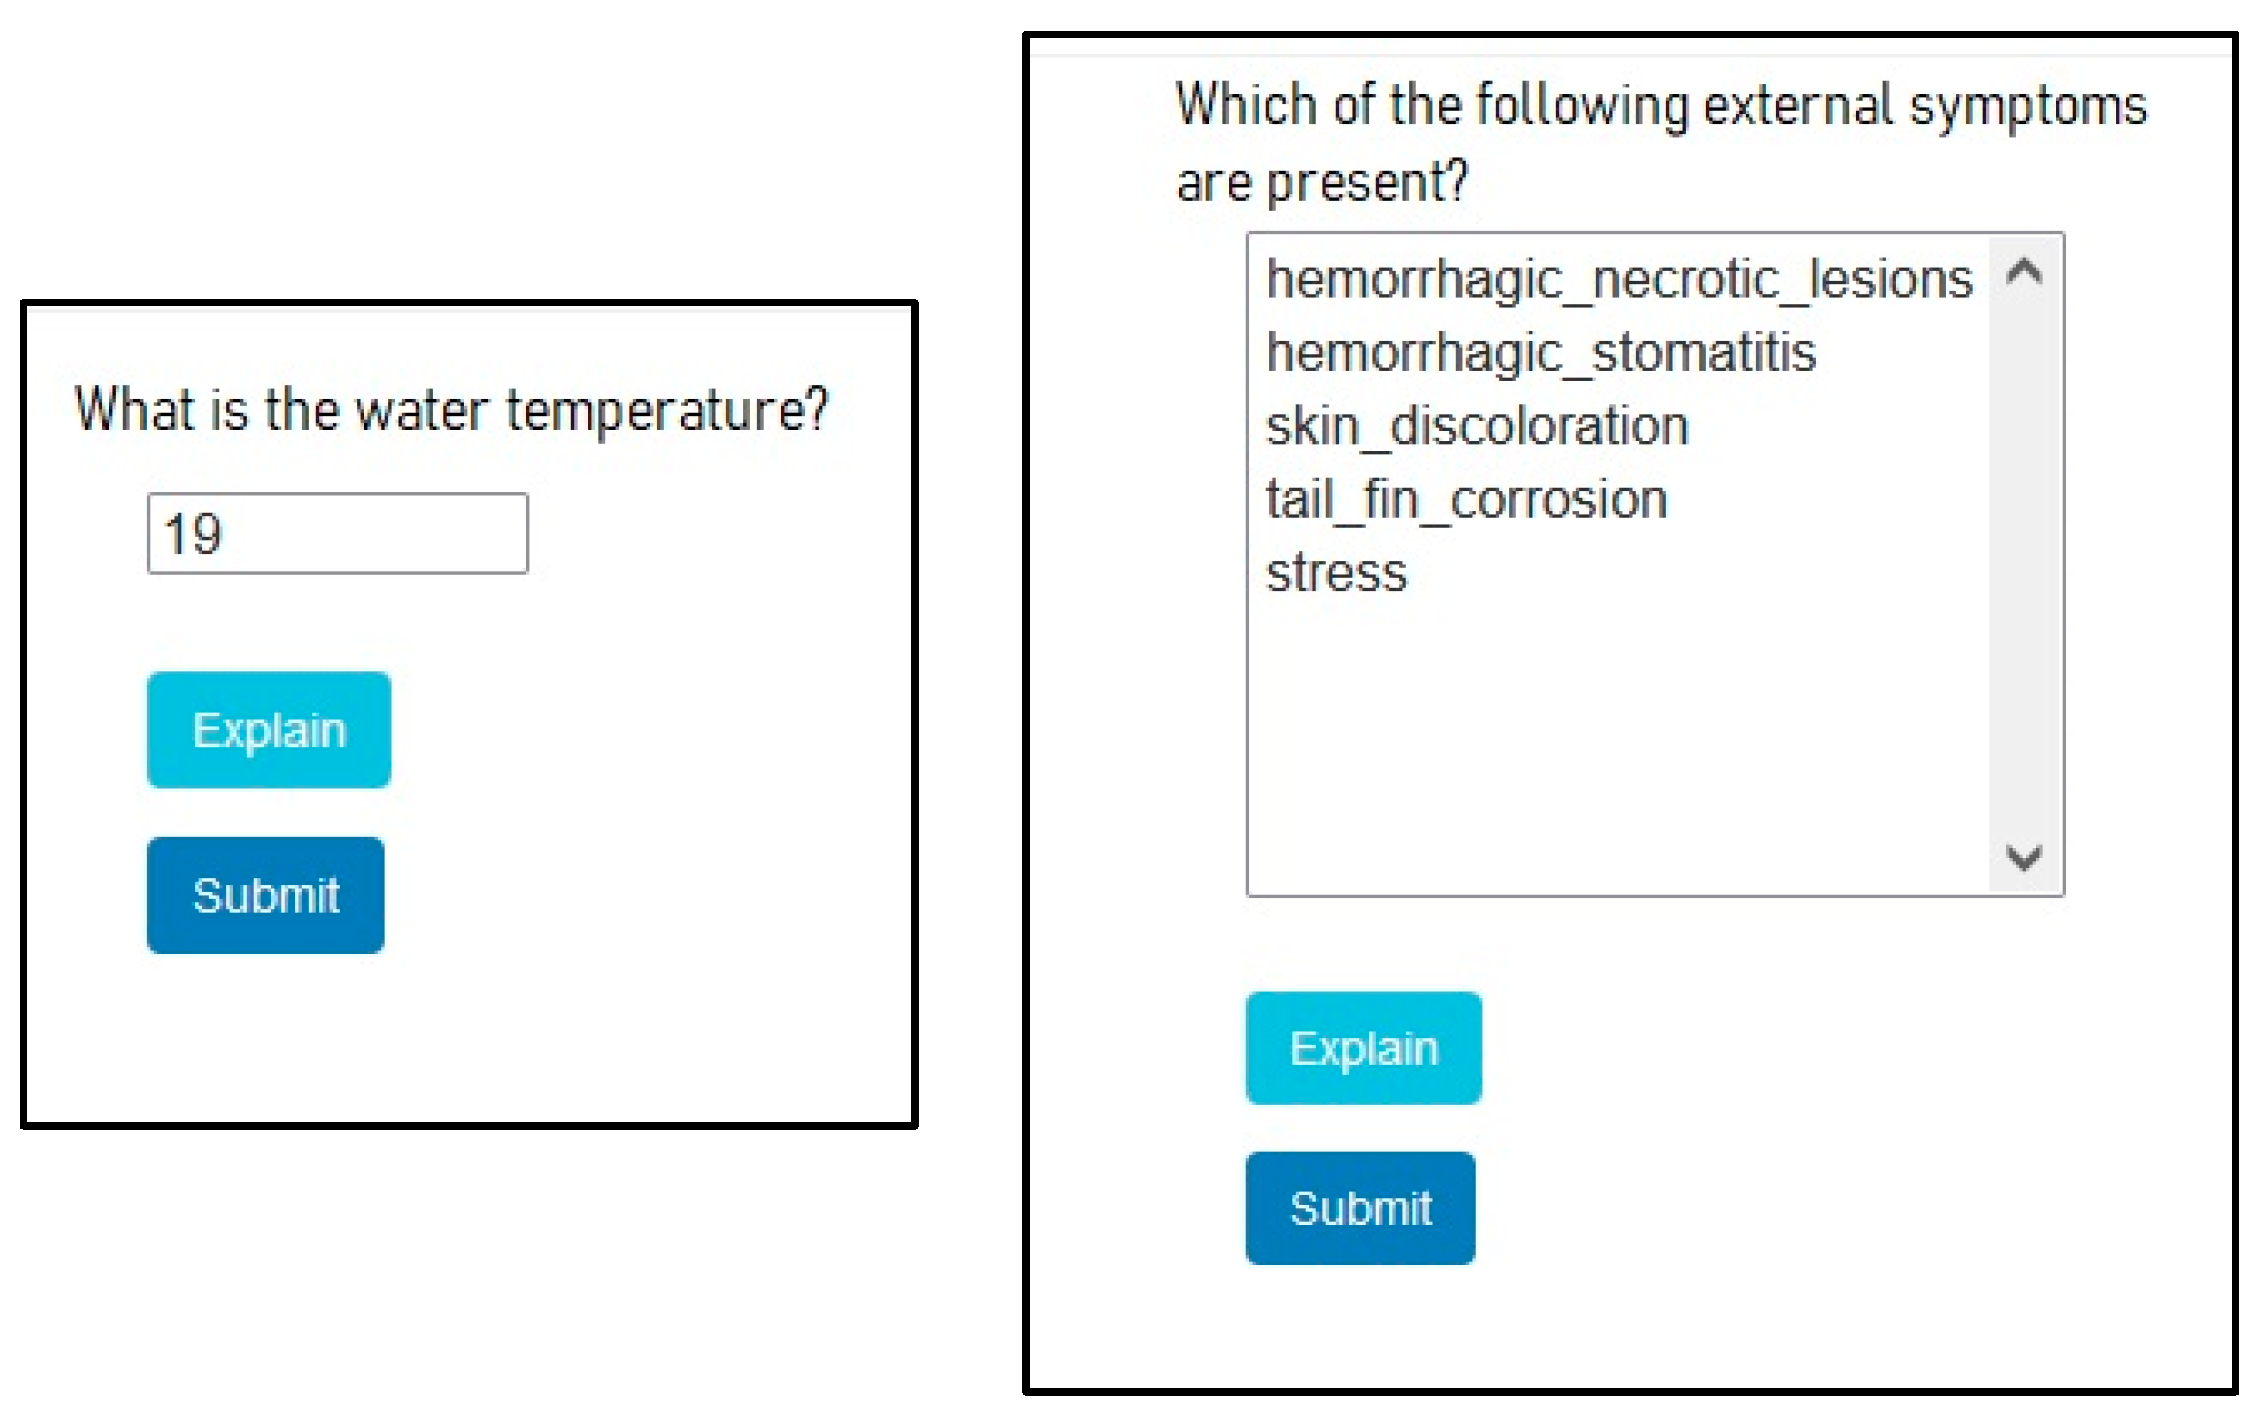
4.3.7. Specialized Expert Systems Based Diagnosis

When the final list of the most probable diseases is produced, the user has two options. The first option is to stop, given that the result is satisfactory. For example, such a case is the one where the first-ranked disease was first in all three lists and with a high degree of confidence. Another case is the one where the first two diseases are quite relative and the required treatment is similar.
The other option is to continue because the result is not satisfactory or a more secure result is required. In this case, the user activates corresponding SESs, one by one, until satisfaction is realized. SESs starts asking the user to input data from the beginning, ignoring the input provided until then. However, this time, the data concerns only parameters/symptoms concerning the specific disease. Also, SESs go beyond level three parameters to other level parameters not mentioned in Table 3. These parameters concern laboratory tests or experiments, are called laboratory parameters, and are presented in Table 5, where they are distinguished in microbiological, microscopic, molecular, and chemical terms.

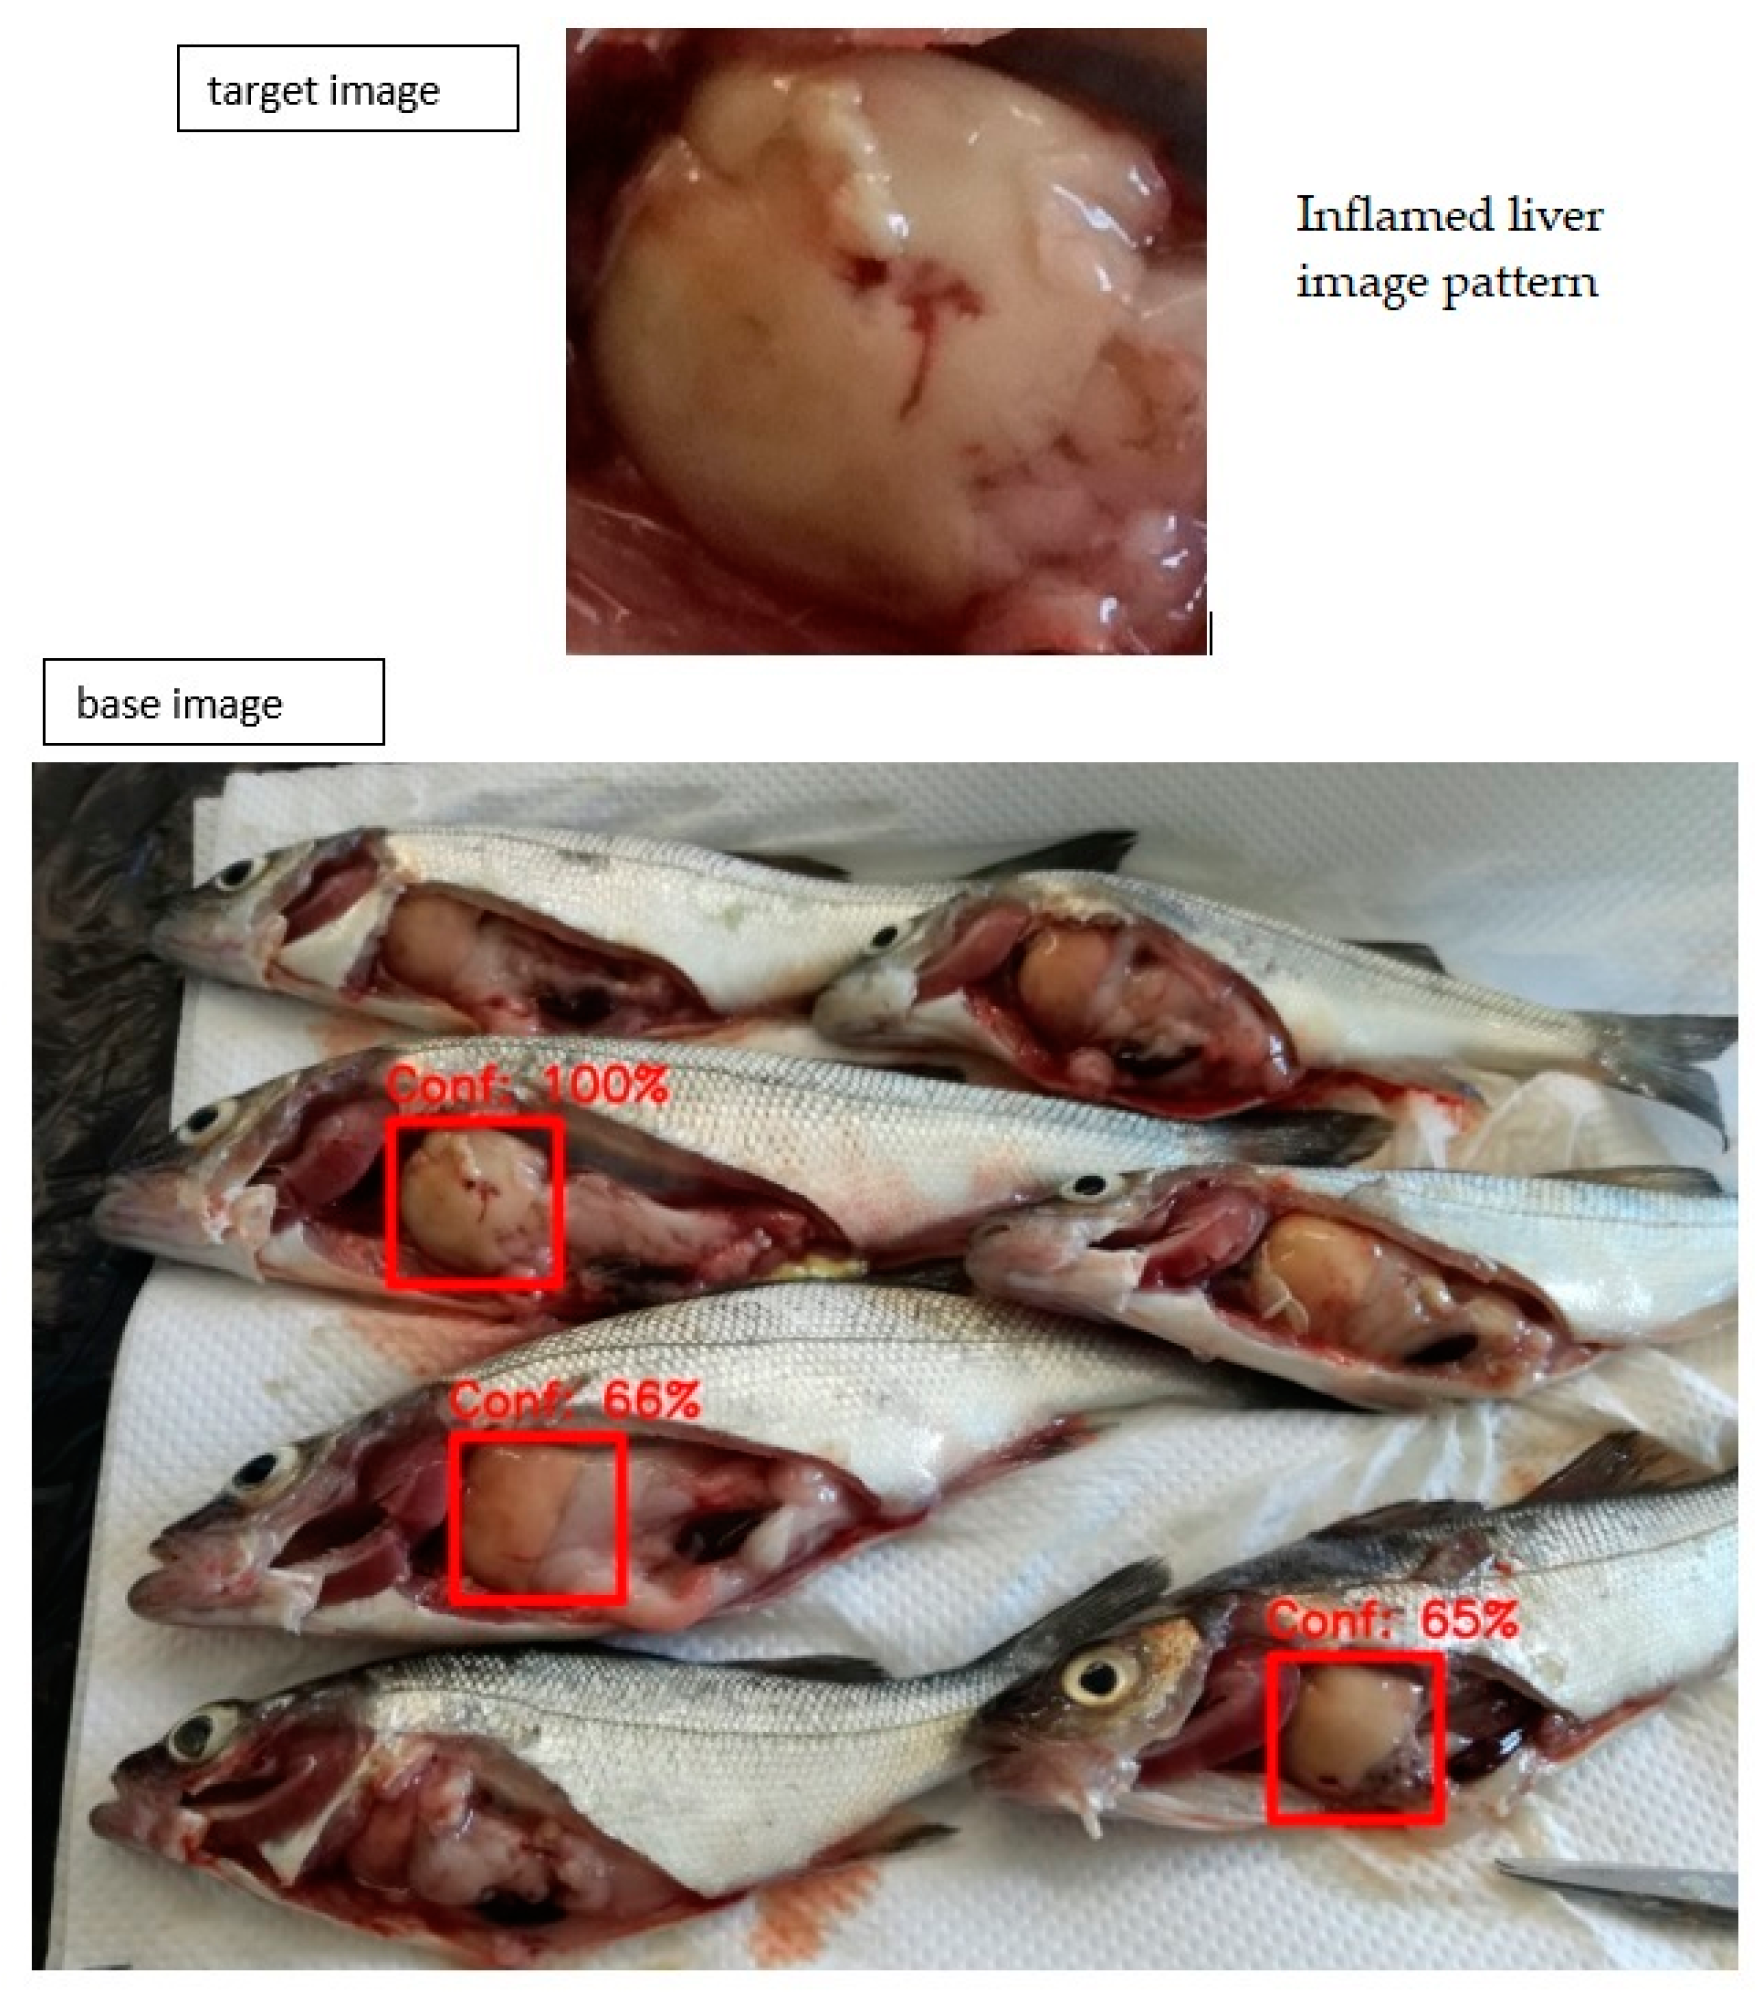
4.4. Image Recognition System (IRS)
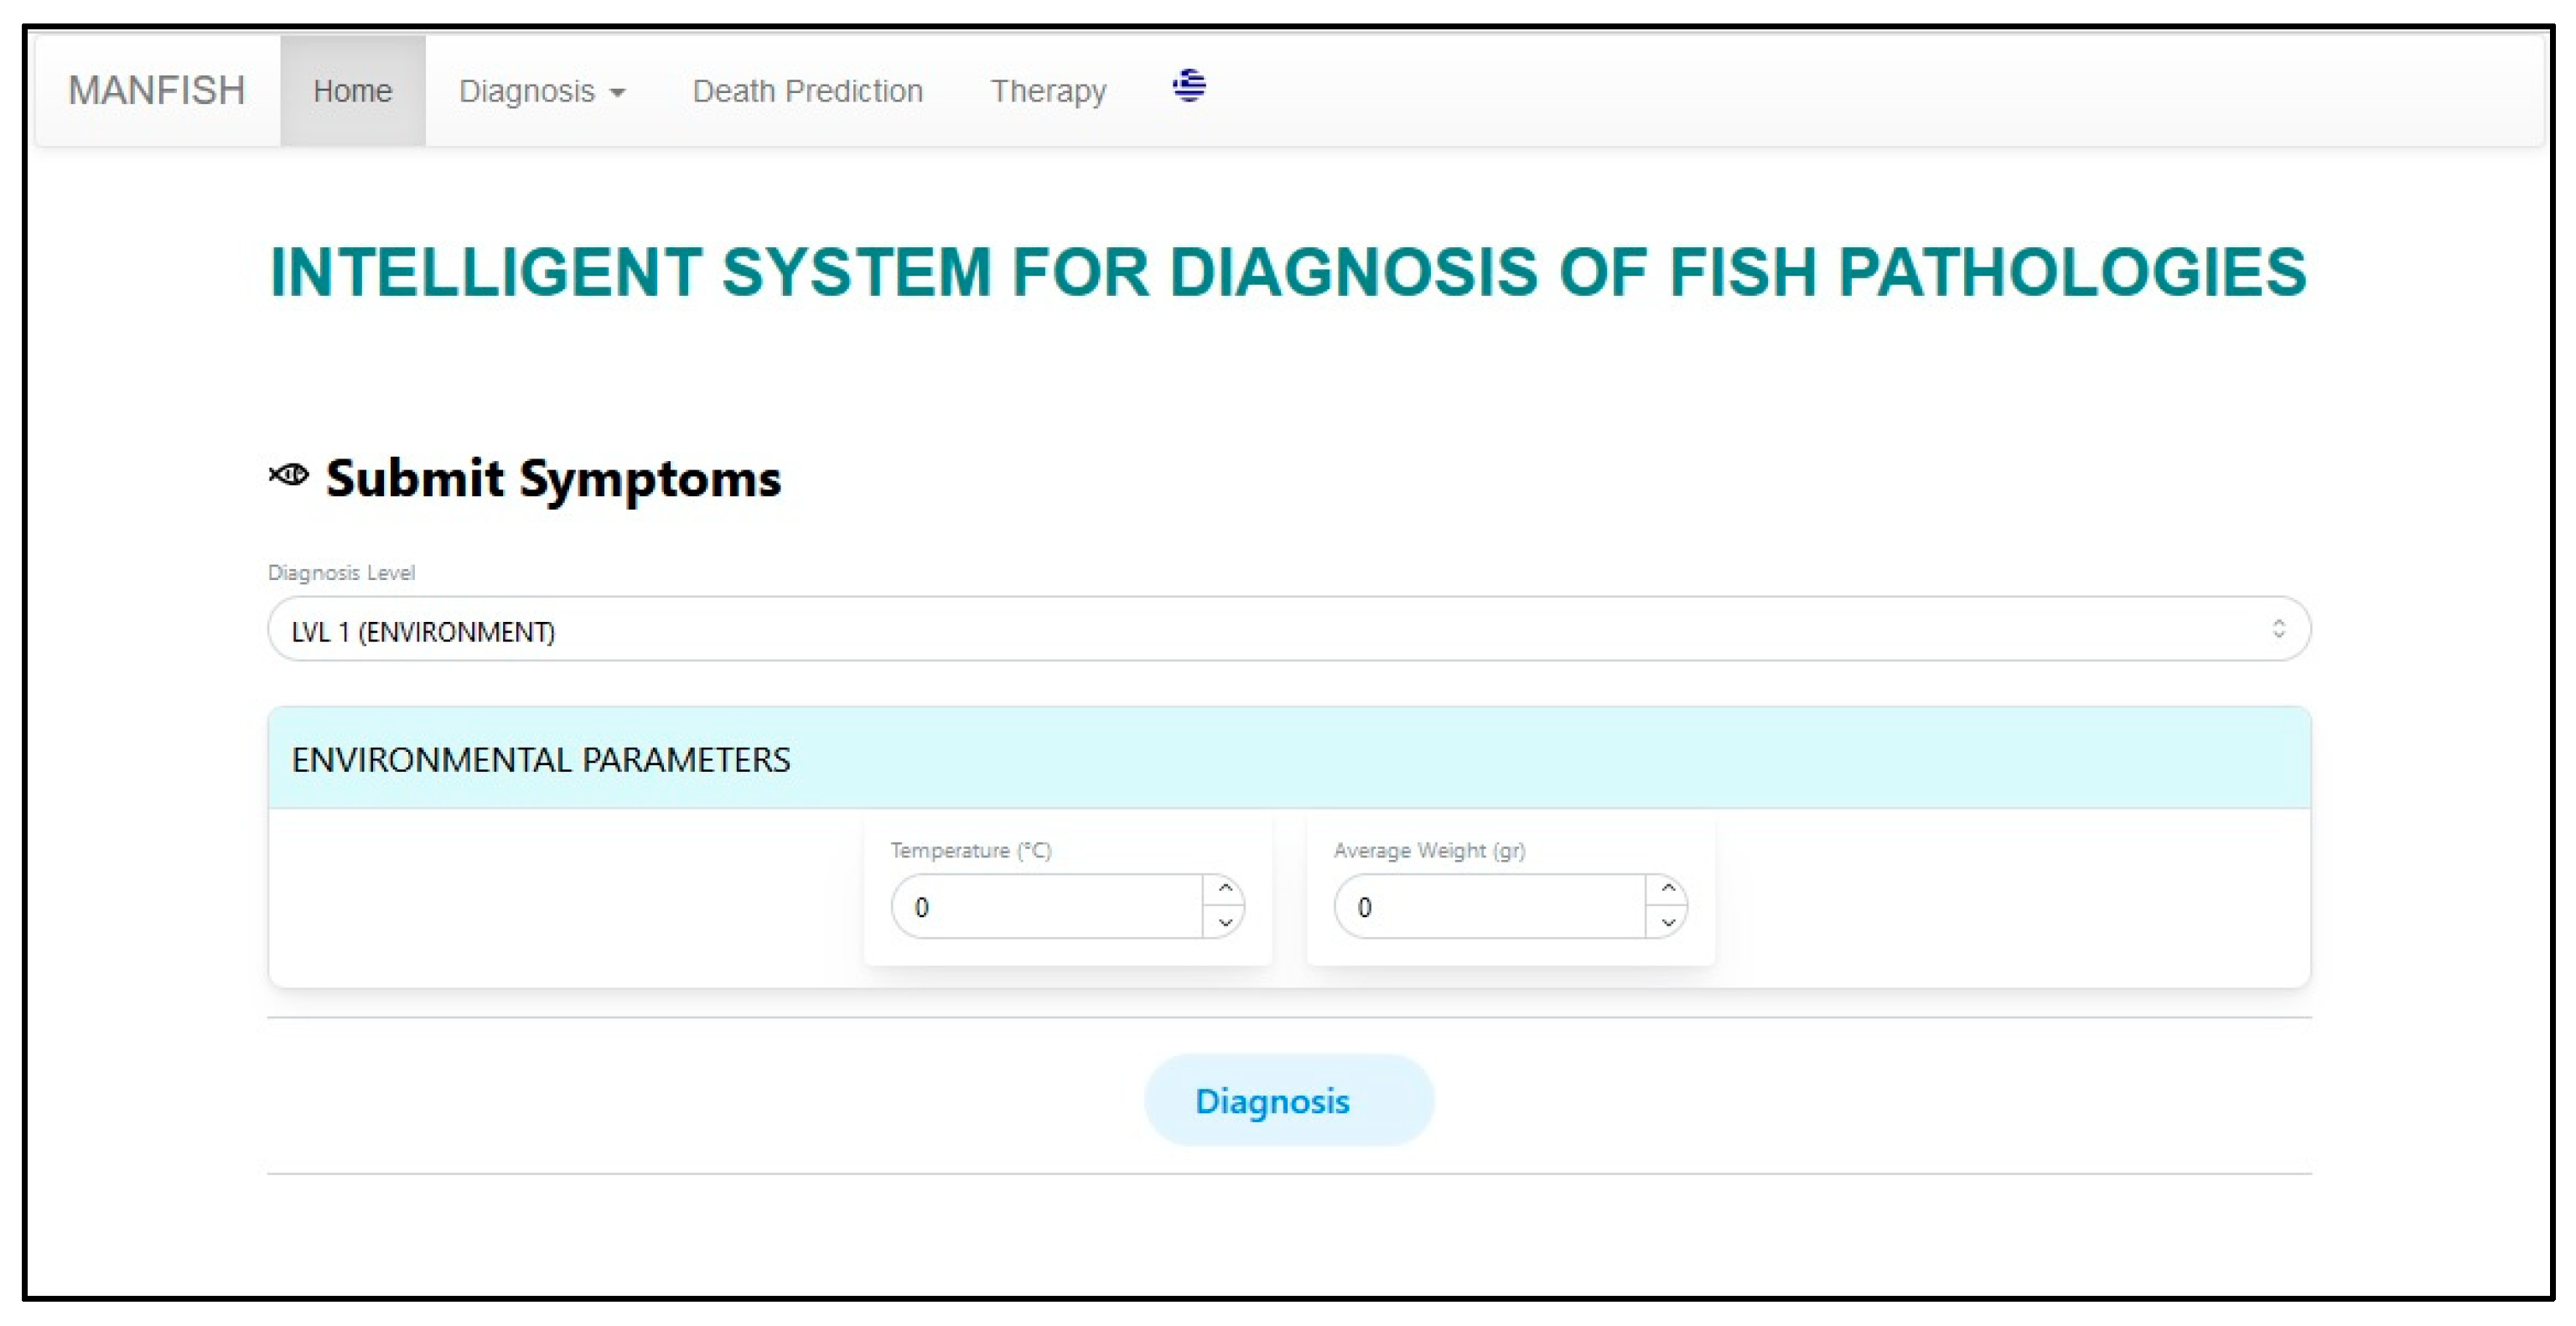
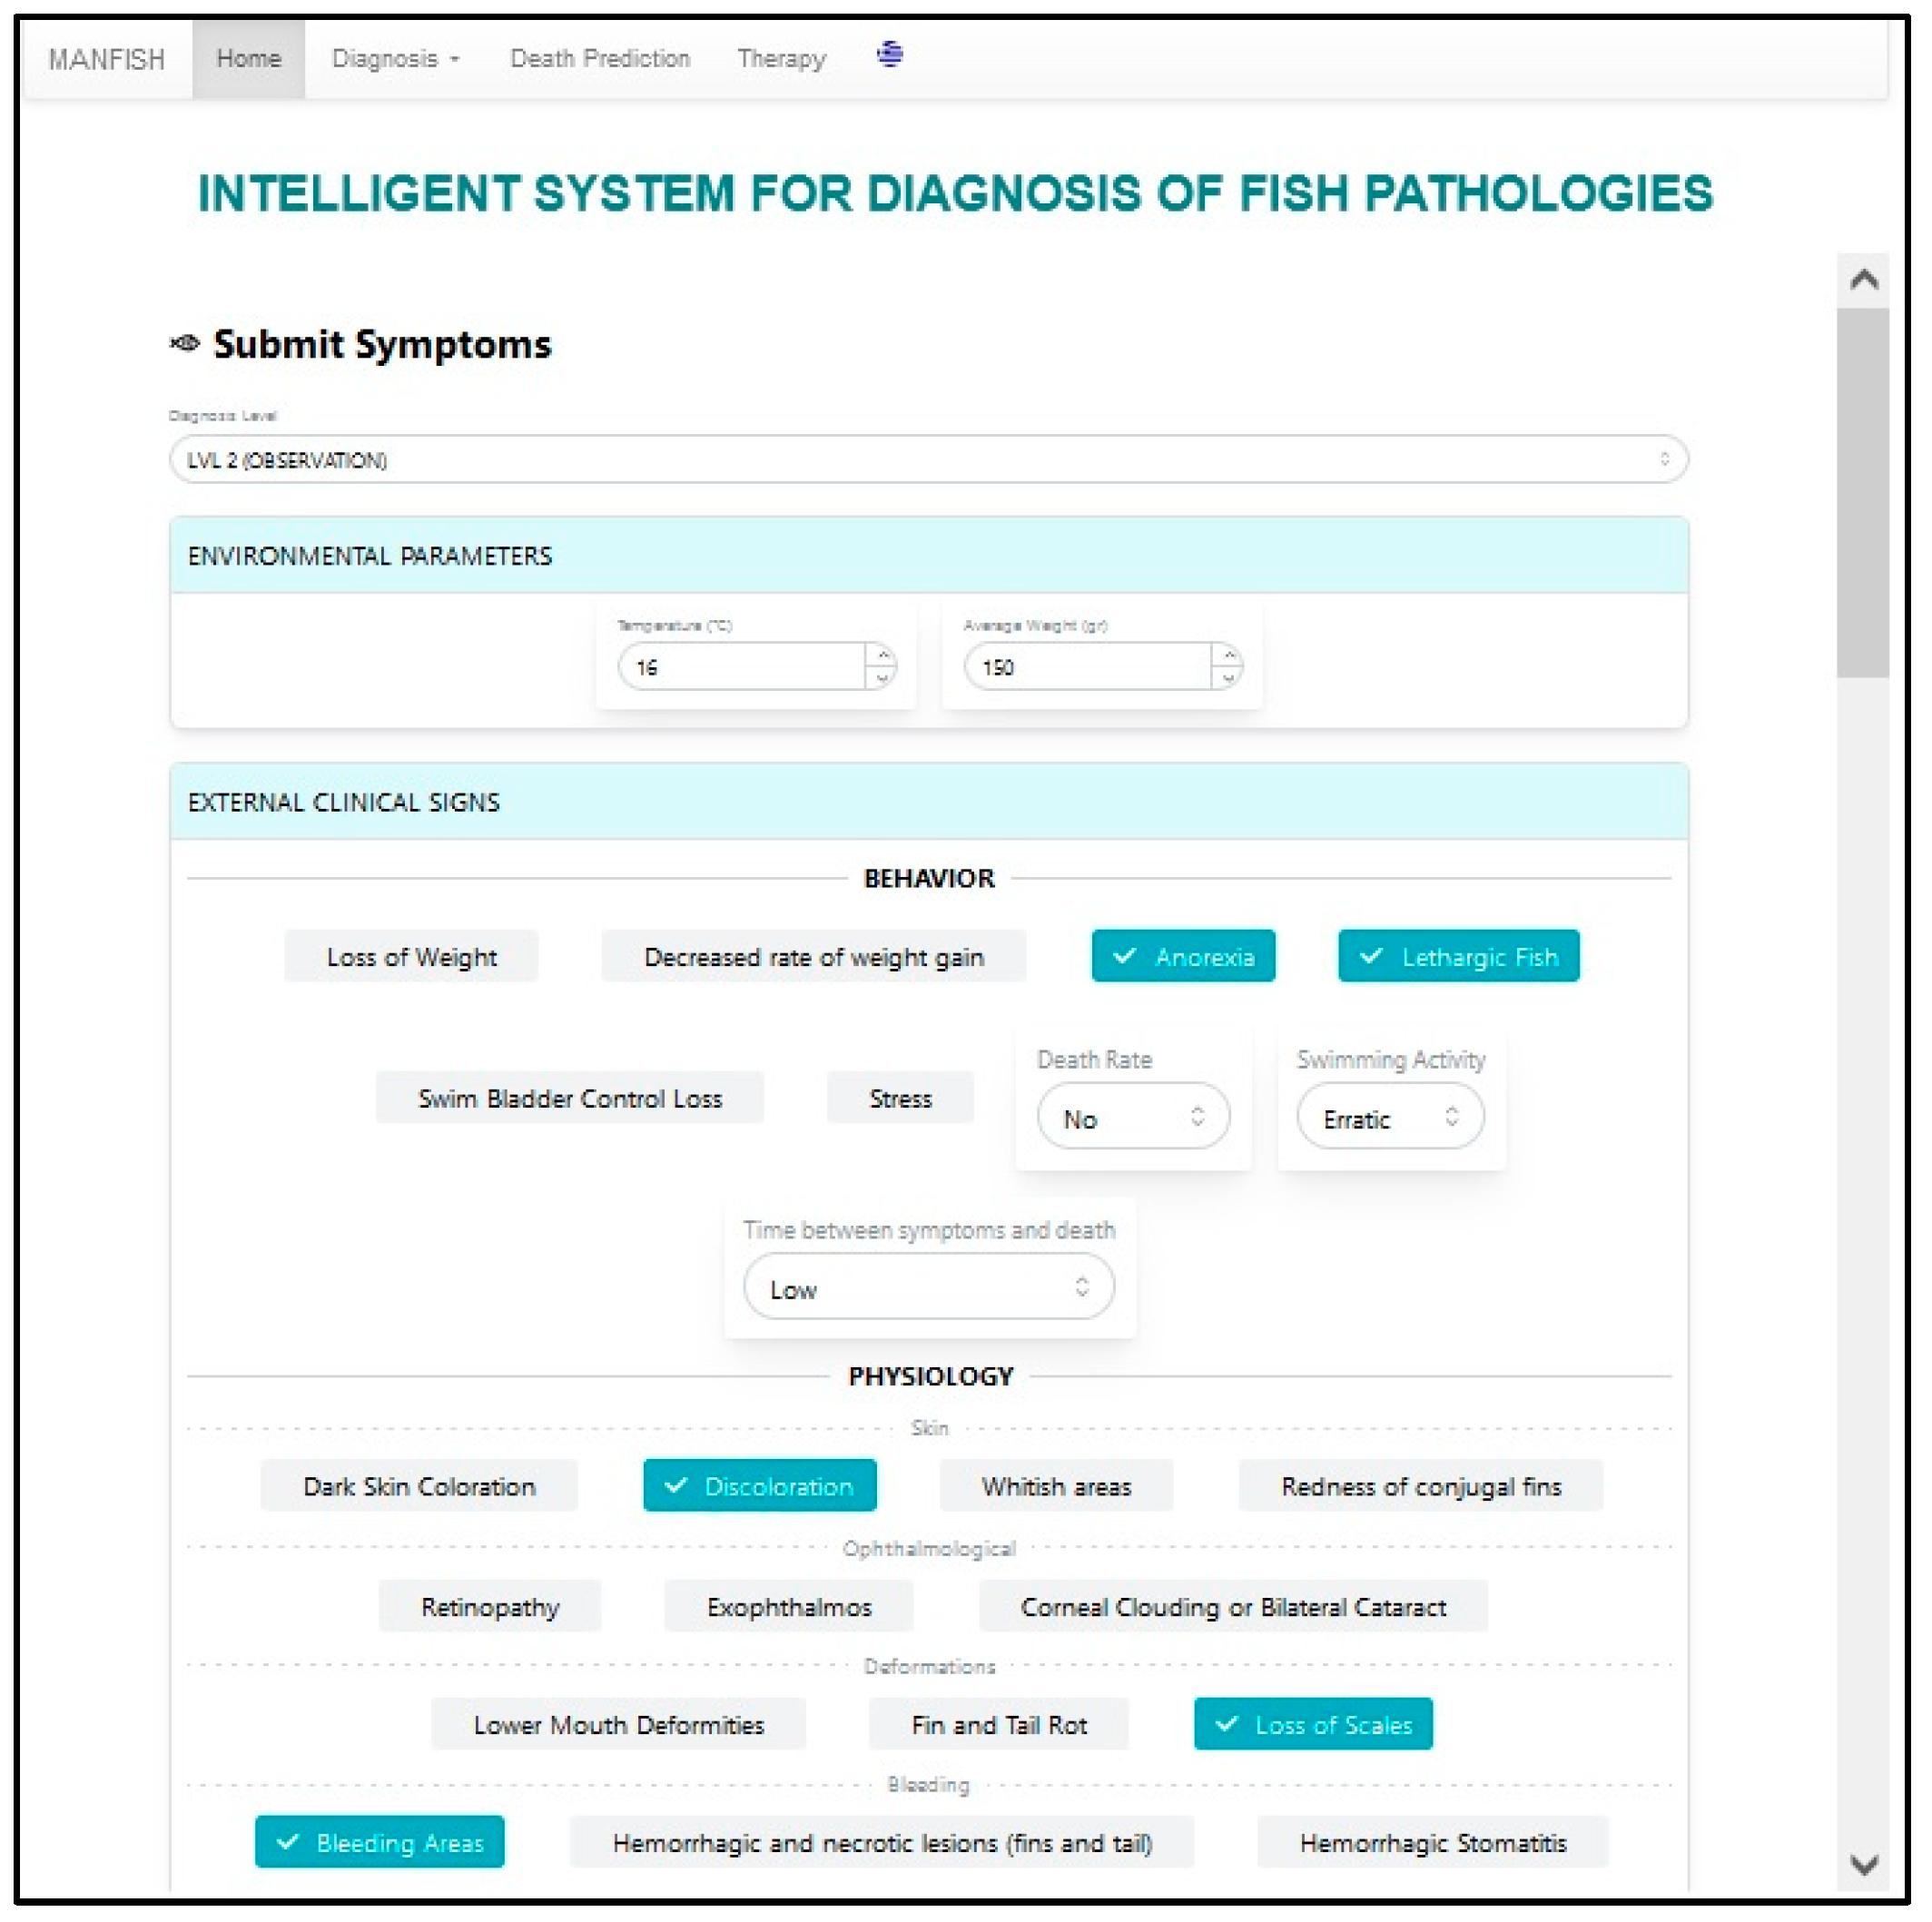
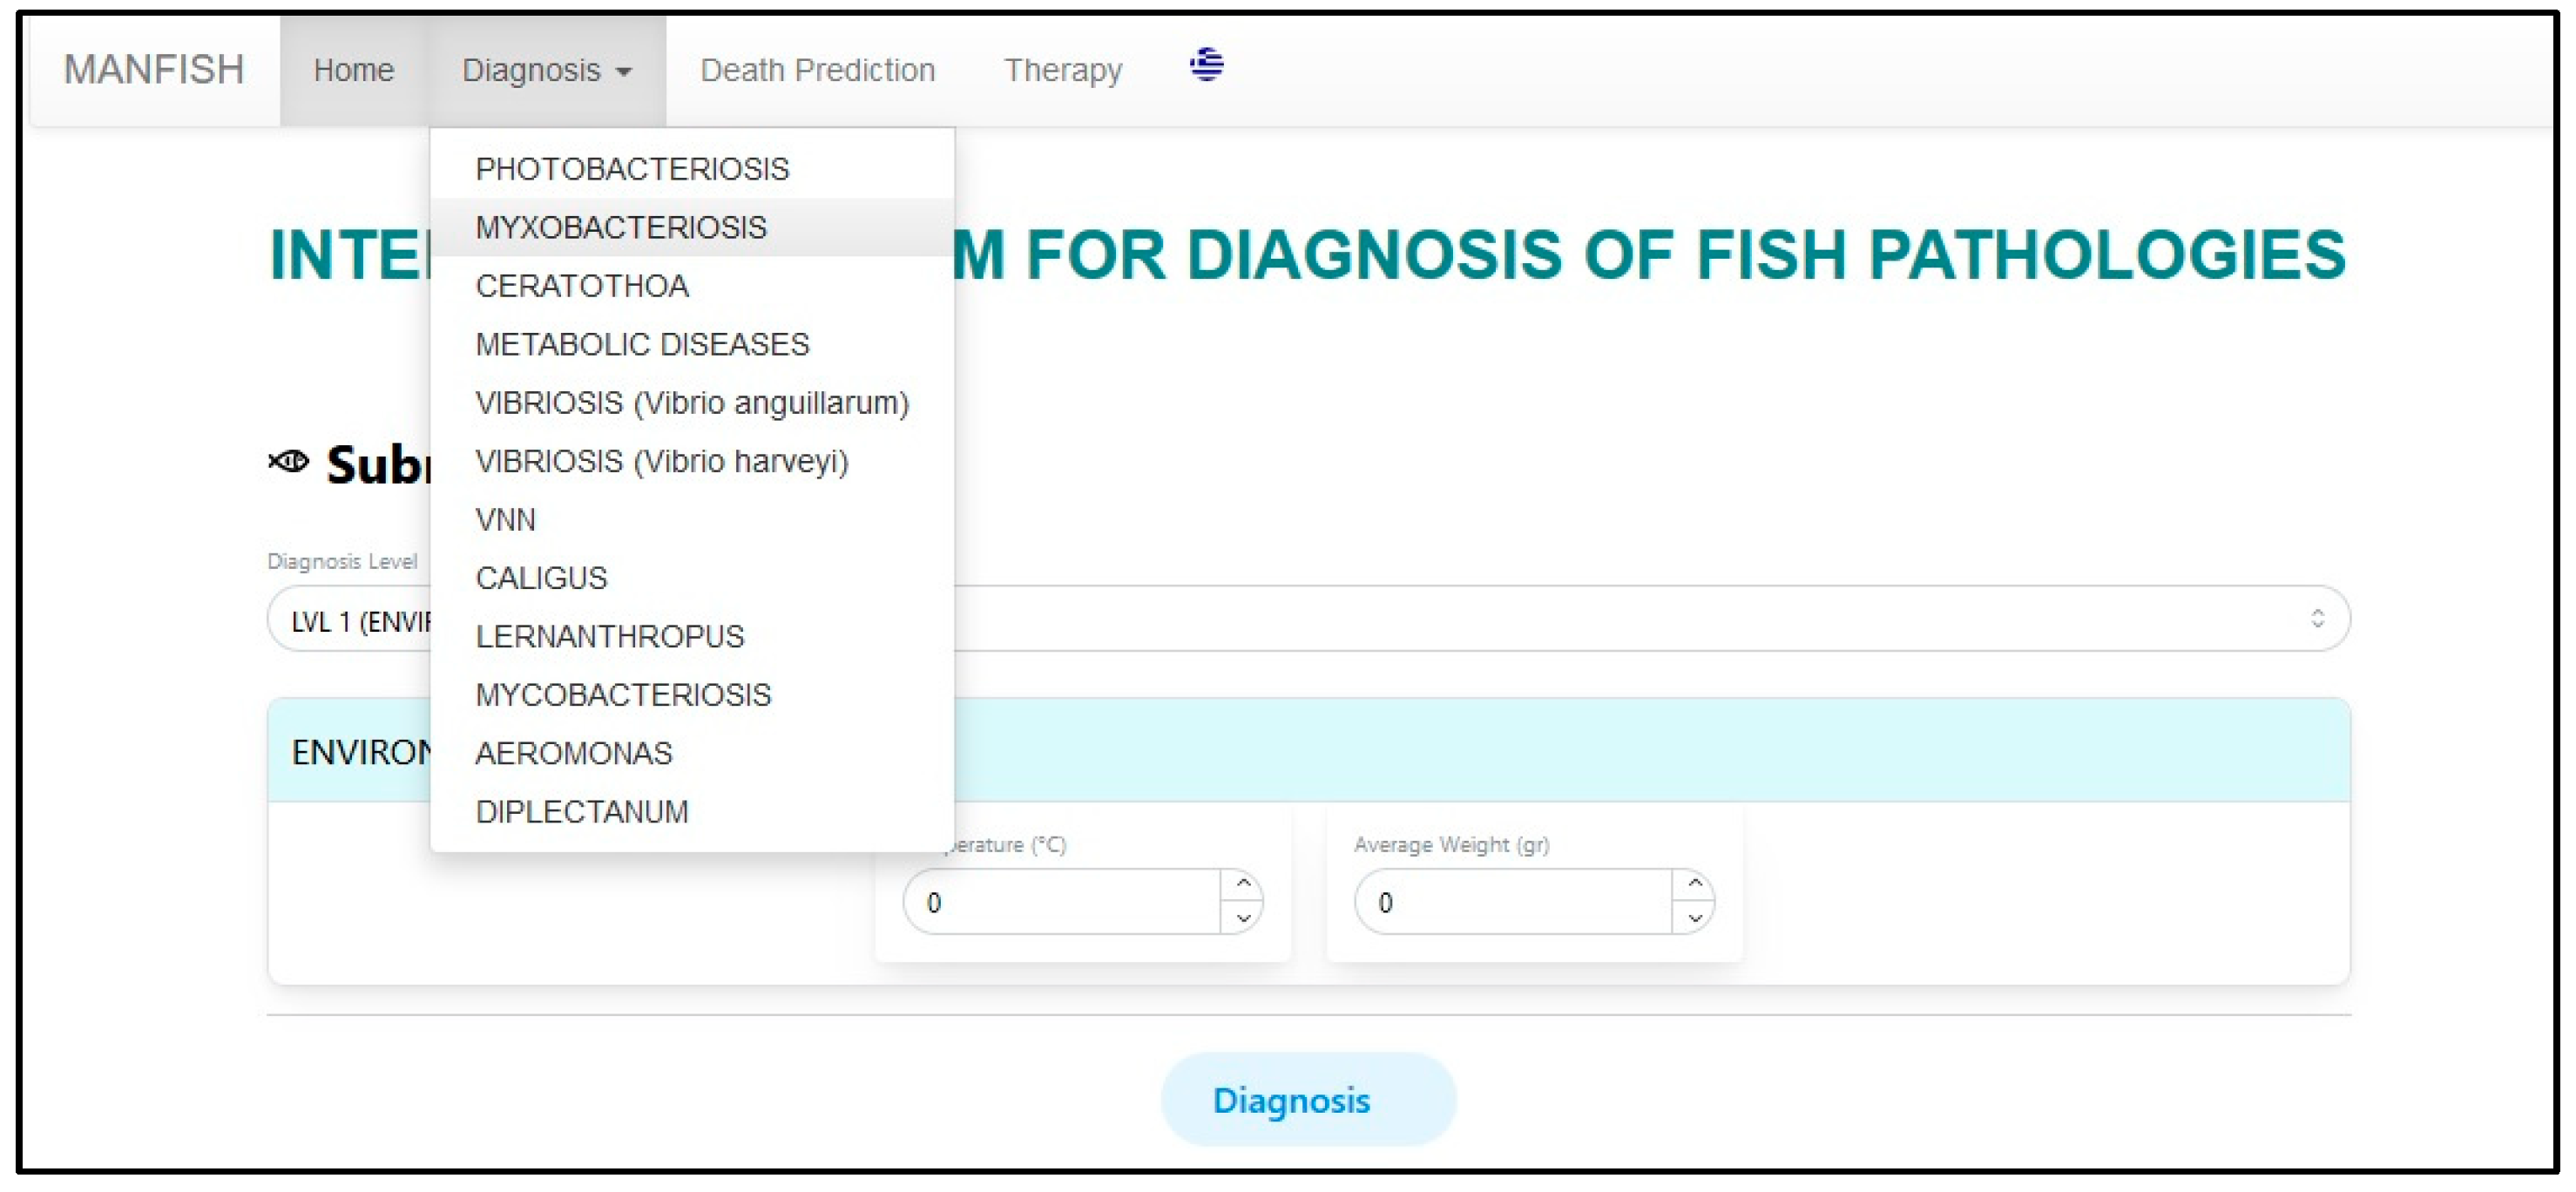
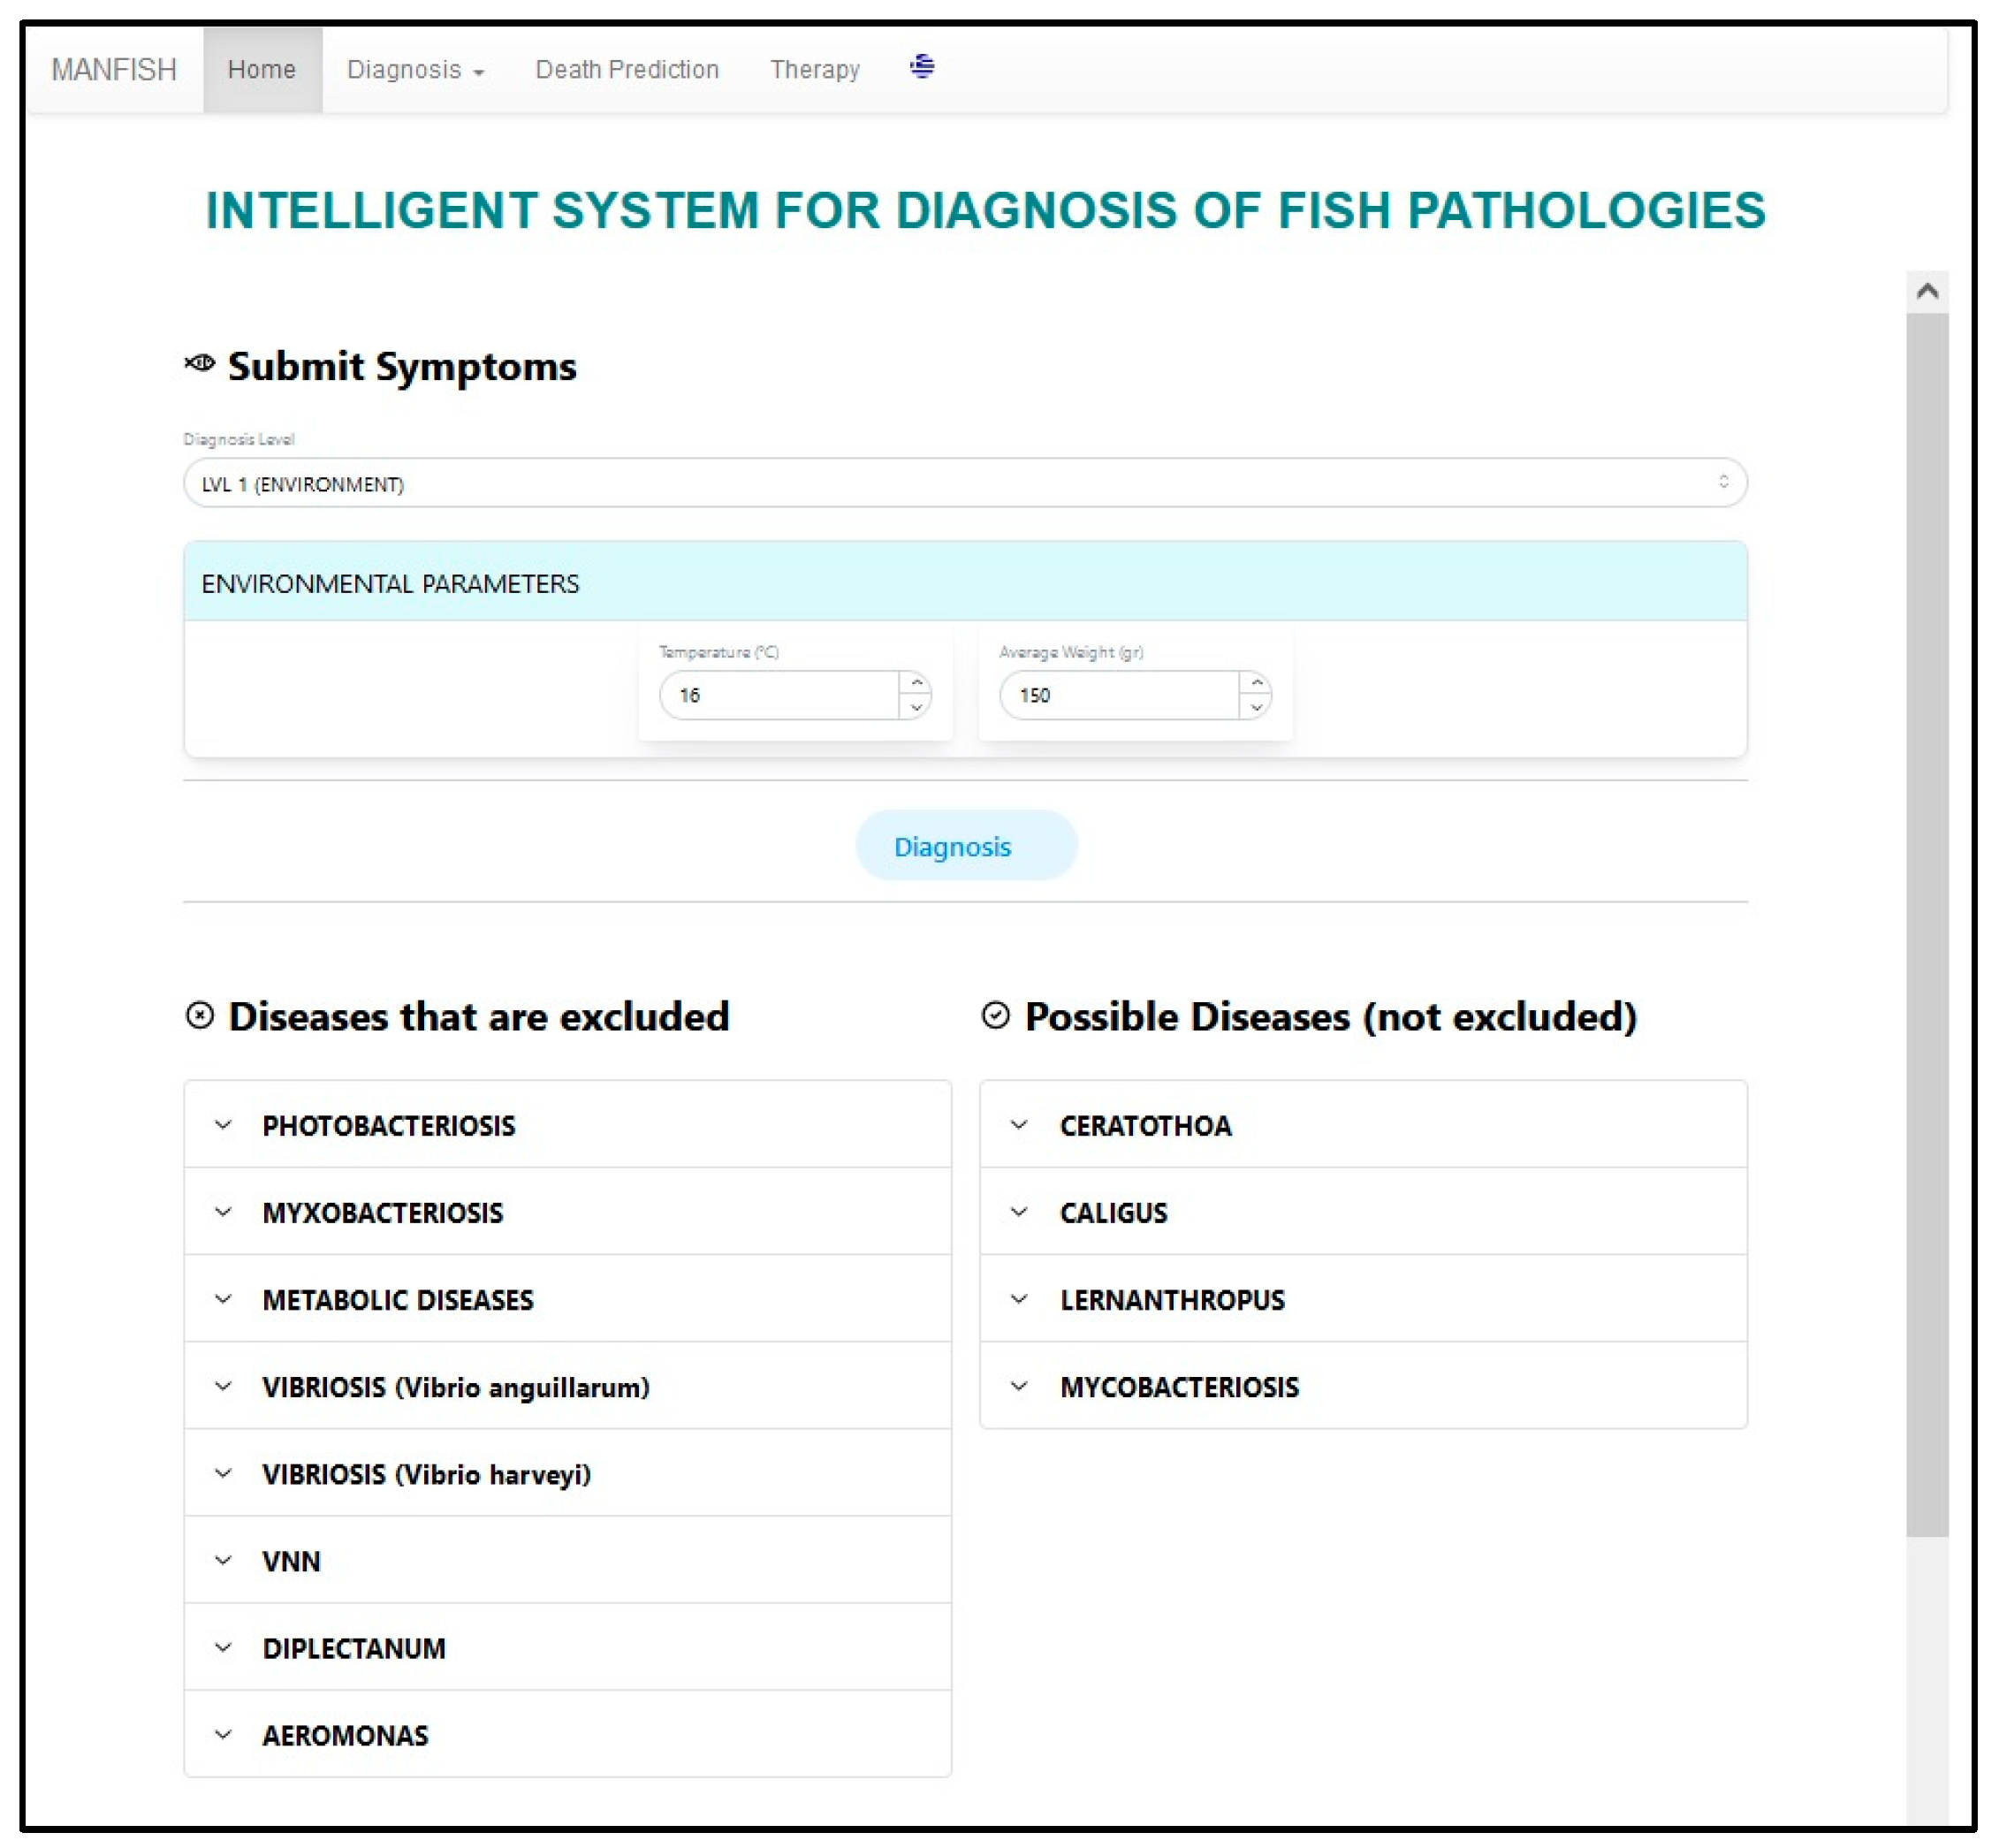
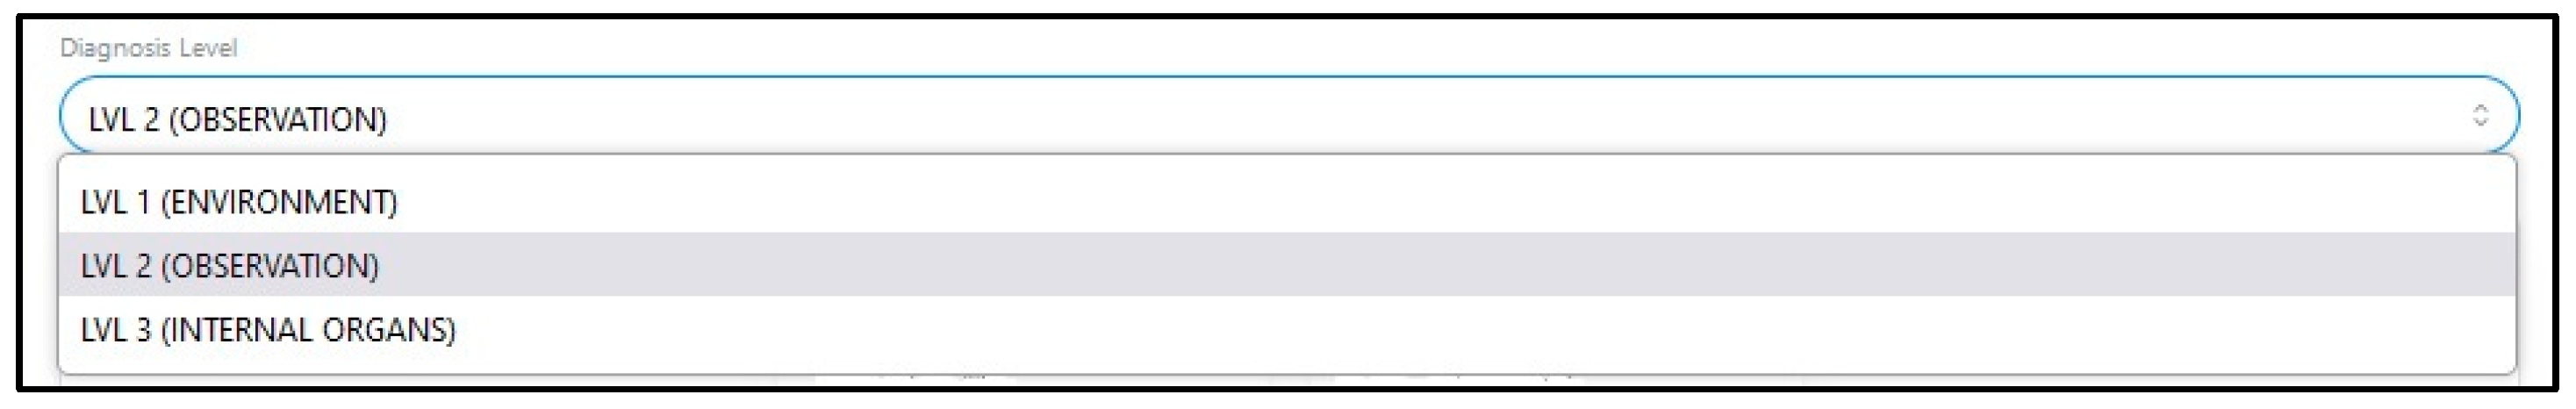
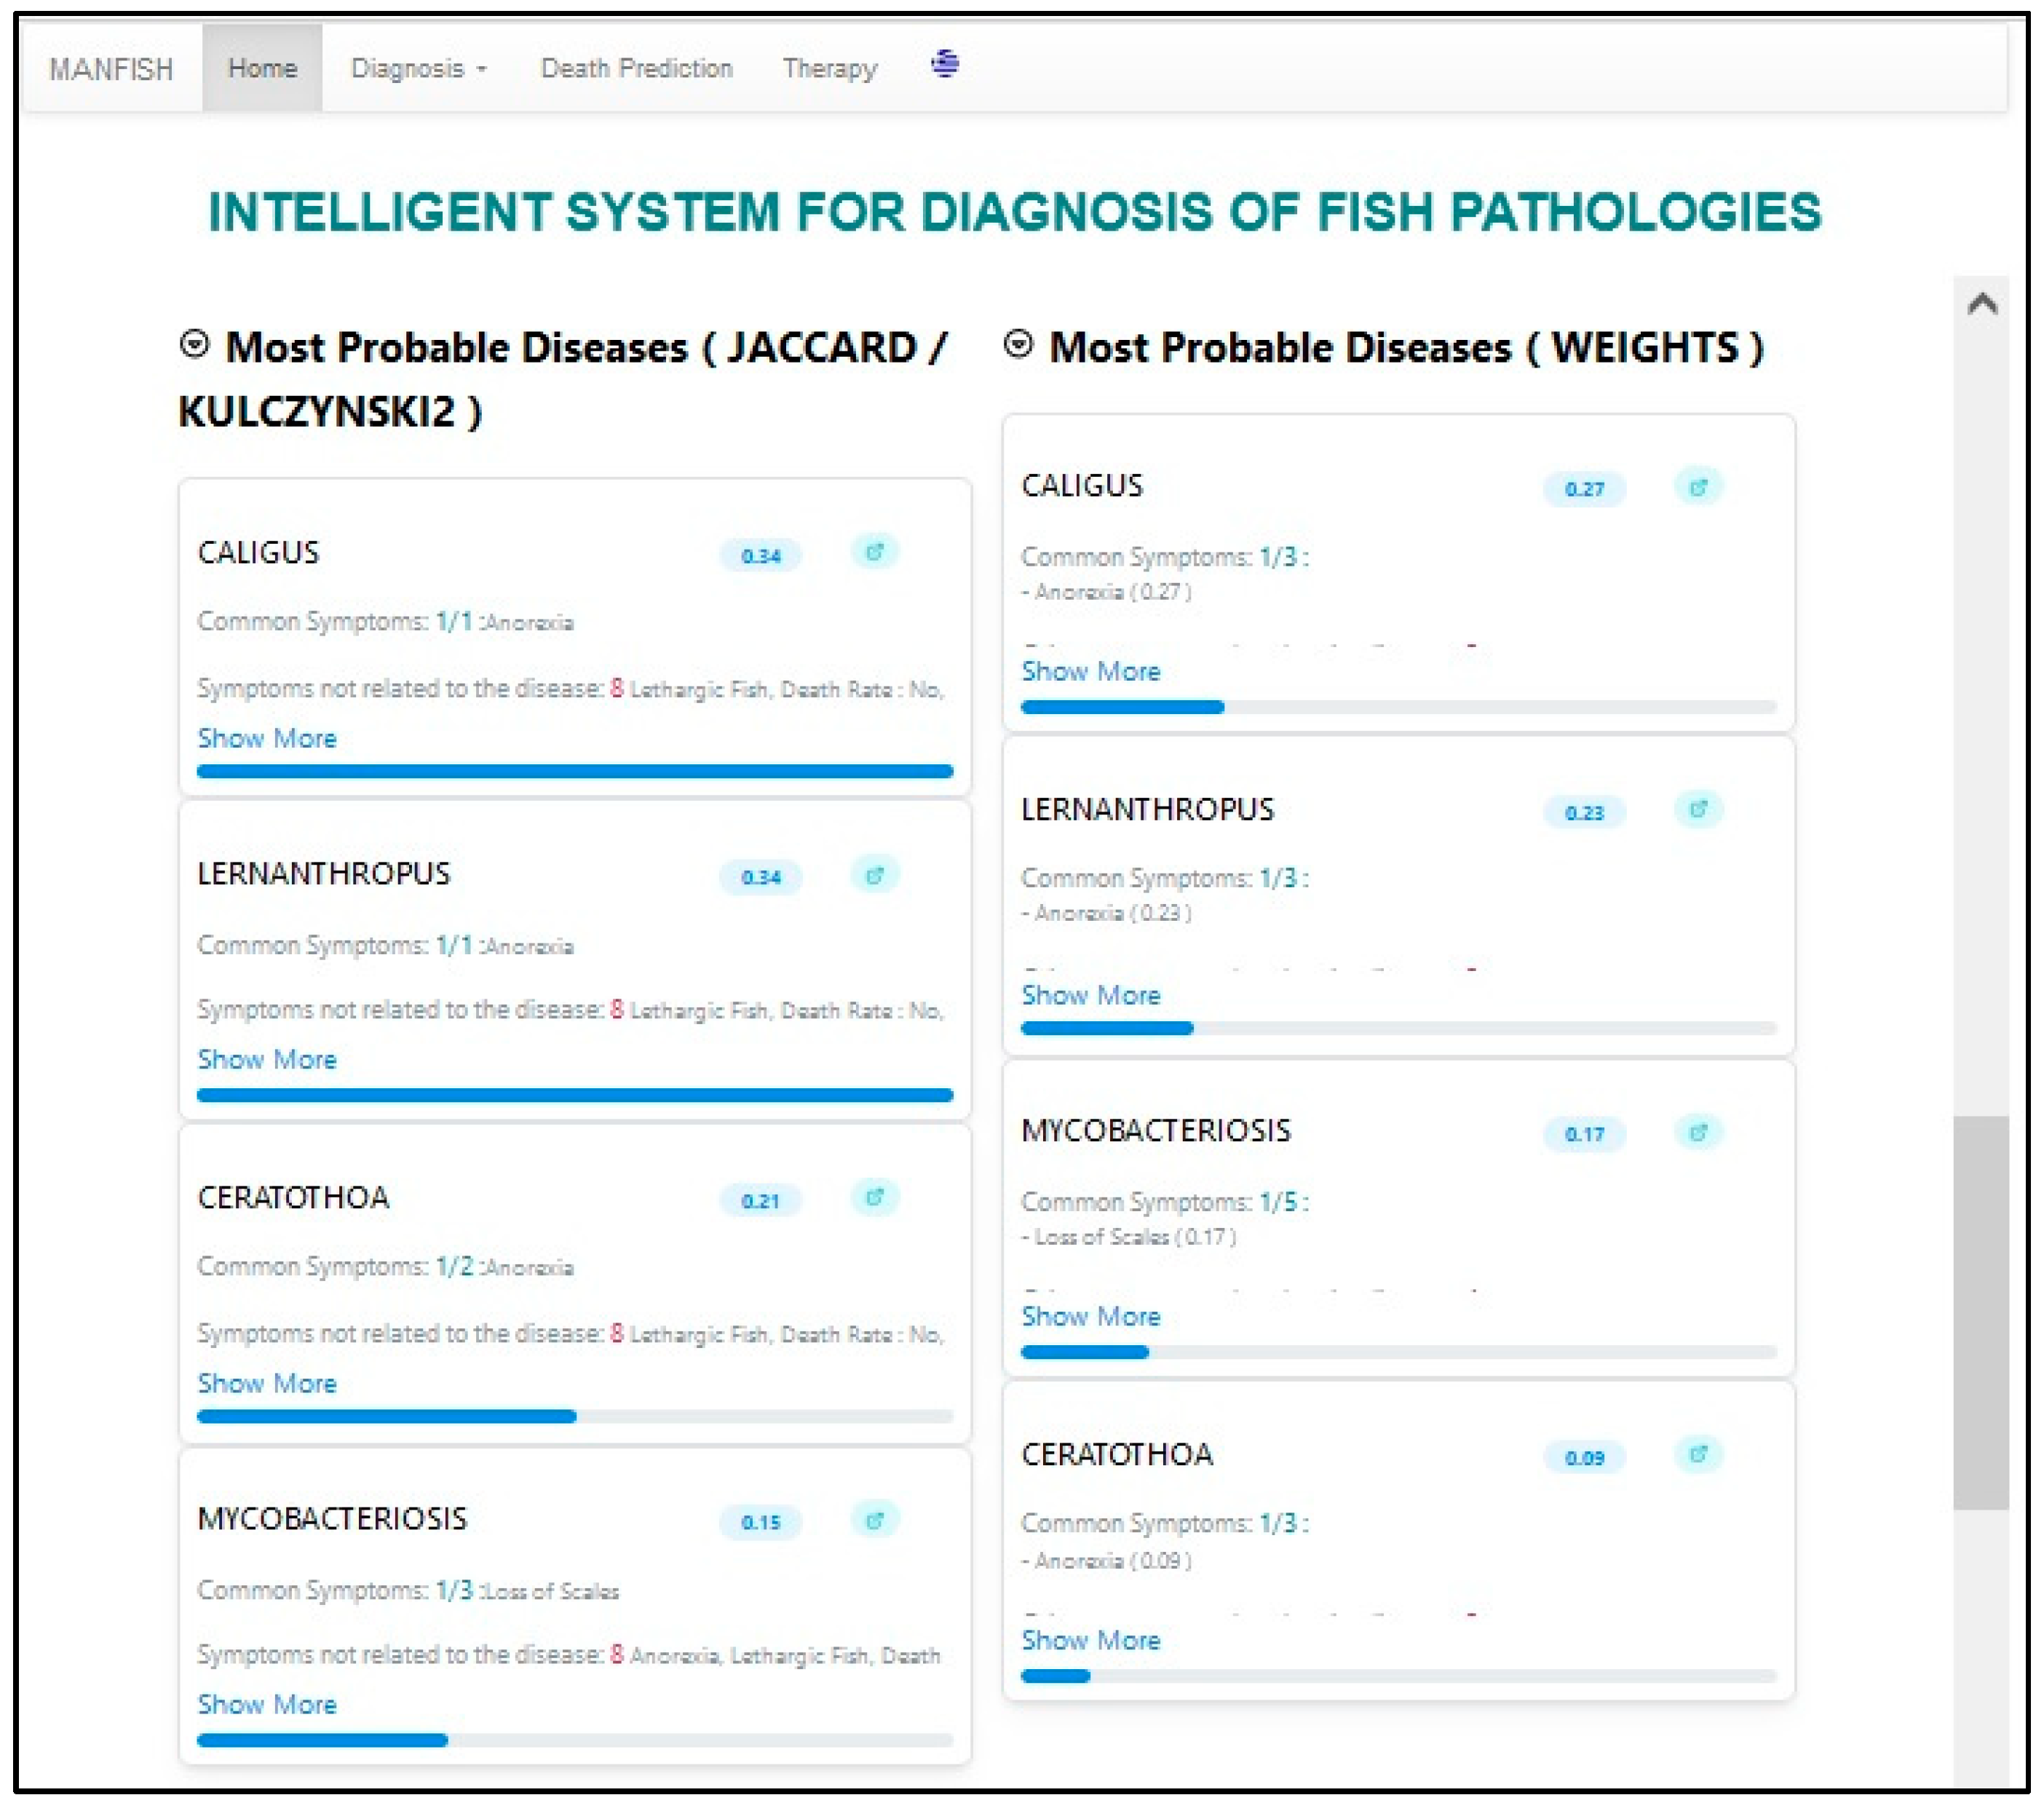
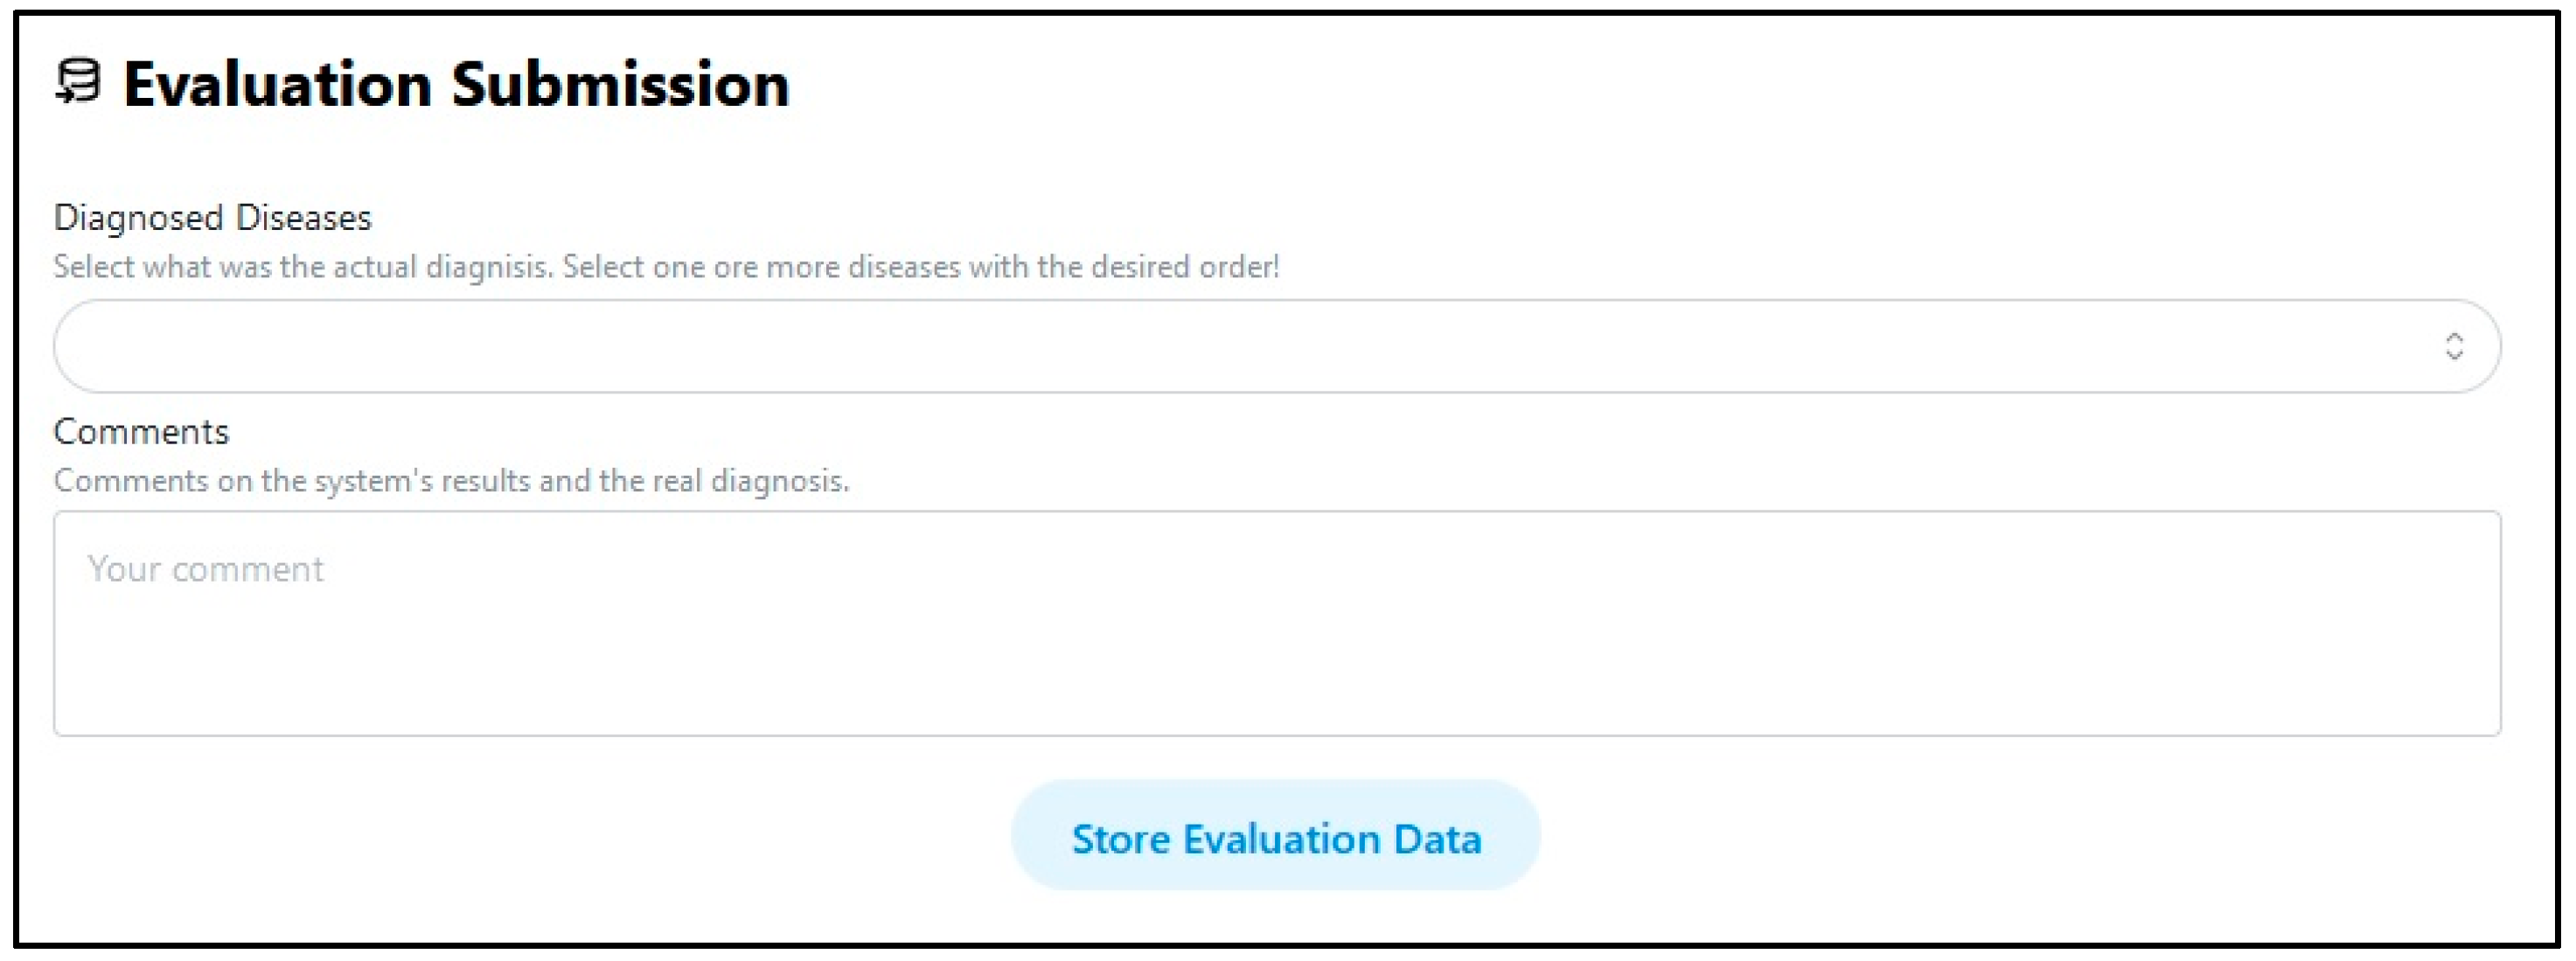
At certain points in the general diagnosis process, the existence of a symptom requires information from an image. For example, ‘whitish areas’ is such a symptom. In such cases, the user can look at the image and give an answer or call the IRS, giving as input that image.
IRS includes an image database that includes images called base images, which are diagnosed and validated cases of diseased fish associated with specific signs/symptoms. IRS takes as input an image from the user, called the target image, and tries to find which base image has a portion that matches the target image. If a match is found, it returns the base image spotted on the matched areas and shows a number indicating the percentage of certainty of matching, called confidence. A threshold can be set so that if confidence ≥ threshold, the matching is accepted and returned.
For the matching, an algorithm called Template Matching [35] has been implemented in Python’s OpenCV.
In Figure 6, an example result of the IRS is depicted. The threshold of confidence was set at 0.65. In the base image, several images of fish having inflamed liver are depicted, and some of them match the target image with different confidence levels (equal to or greater than 65%).

5. User Interface

The interface of the main page of the system is depicted in Figure 7, which includes the elements related to the first level (LVL 1) of diagnosis.
The user can use the values of the environmental parameters to reduce the possible diseases of the fish at hand. As soon as the user inserts the values and presses the “Diagnosis” button, the system displays the excluded and possible (not excluded) diseases (see Figure 8).
Afterwards, the user can proceed to the second diagnosis level (LVL 2) by selecting it, as depicted in Figure 9. After this has been conducted, the second-level data interface is unfolded, as presented in Figure 10, where the user selects the current second-level (external) symptoms/signs.
Pressing the “Diagnosis” button of the second level (not shown in Figure 10), the system operates and displays (a) the two lists (excluded and non-excluded diseases) after having applied the second level blocking rules, and (b) the three ordered lists of most probable diseases, as returned by the three diagnostic methods (CBO, WBM, and ACRES) applied to the above-produced non-excluded diseases (see in Figure 11 the two ordered lists). Each disease in each list is assigned a confidence factor related to the corresponding method.
Finally, a summary of results is displayed, where the three lists are summarized and the result of the aggregation method is displayed (see Figure 12).
The same things happen when the user proceeds to the third diagnosis level, after the user has inserted the (internal) symptoms of that level.
After the final list is produced, the user either accepts the result as valid or goes to further investigation through the specialized expert systems (SESs). The user selects a SES from the “Diagnosis” tab of the user interface menu, as shown in Figure 13, where the SES corresponding to “Myxobacteriosis” is chosen.
As soon as the SES is selected, it starts asking questions of the user to obtain values for its parameters. The SES questions follow the corresponding decision tree defined by the experts. As in the general system, questions in most trees start with questions related to environmental parameters and then proceed to external, internal, microbiological, microscopic, molecular, and chemical, if any (see Figure 14).
The microbiological, microscopic, molecular, and chemical parameter-related questions require the existence of laboratory results. If they do not exist, the user should stop processing and take care of obtaining those results.
In each question, there is a possibility of some explanation about why the question is asked (see the “Explain” button in Figure 14).
Apart from the above, the user interface provides another facility for expert users. They can provide a valid real disease case and store it in the system’s database as a base case (Figure 15). These cases can be used to constitute either a valid dataset, which progressively increases in size and is used from time to time for refining the system, or an improved case base for the CBO method.

6. System Evaluation

6.1. Expert Based Tuning and Evaluation

The system was given to three expert ichthyologists, two of them different from those who designed the decision trees, for evaluation. They created a set of 33 real, validated-characteristic test cases to be used for system evaluation. The evaluation was performed in two stages. The results of the first stage were used for system tuning. The results of the second stage, after system tuning, were reported as the performance of the system.
So, in the first stage, in 20 out of the 33 test cases, the system made correct diagnoses; that is, the correct result was within the three first diagnosed diseases by AGM, which means 60.6% success.
Examining the reasons for this rather low success, we found that it was due to a few ill-designed blocking rules, which we changed. Entering the test cases in the system after the changes showed success in 26 out of the 33 test cases, which means 78.79% success, which was a vast improvement. Notice that the test cases were not random but characteristic ones, which makes the success quite important. All experts declared that the system was easy to use and well suited to their concept of fish disease diagnosis.

6.2. Artificial Data Based Evaluation

Given the shortage of real data, we consider the decision trees designed by the experts to be the golden knowledge (ground truth) of our domain problem. So, to evaluate our system, we did the following:
Using the provided data from the experts (decision trees, symptoms per disease, and their weights), we generated an artificial dataset of test cases. Since real cases were not available, this dataset was crucial to test and implement additional ranking methods based on machine learning techniques and to evaluate all the implemented methods.
More specifically, the dataset generation algorithm generates random combinations of the input values (symptoms and environmental parameters), and for each one of them, it applies the blocking rules to isolate the valid diseases. If there is more than one possible disease available, the algorithm runs two ranking methods (based on the similarity of the symptoms and their assigned weights) and combines the results into a single score value. Then, it randomly selects one of the diseases, considering their scores (the disease with the higher score has the highest probability of being selected, but it is not guaranteed). The algorithm continues to generate cases until the specified maximum number of instances has been reached for all the diseases. The final dataset has 1793 cases, each one related to 36 features (diagnostic parameters) plus the class feature (disease).
Using a subset of the generated dataset (50%), we trained a rule-based expert system with certainty factors (CFs) using the tool and methodology of ACRES. The implemented Expert System can take as input a case and return a ranked list of the diseases, accompanied by a CF value.
Thus, the overall system for preliminary diagnosis based on symptoms, given a new case, isolates the possible diseases and performs three separate ranking approaches (case-based, weighted, and with the trained ACRES expert system) that are combined into a final one via a voting method.
The entire generated dataset was used to evaluate the system. Since the overall diagnostic process results in the three most probable diseases, we are interested in evaluating whether the process includes the right disease within that result. In Table 6, we present the evaluation results for each one of the ranking methods. The ‘Accuracy’ column shows the rate of the dataset cases that were correctly classified by their disease (the disease was the first one in the ranked list). The ‘Top-3 Accuracy’ column shows the rate of cases in which the disease was ranked in one of the first three positions, whereas the ‘Average Rank’ column shows the average rank of the correct disease in the list of predictions (a lower average rank indicates better performance).
The results in bold indicate that the aggregate method performed better than the individual ranking methods. They also show that although ACRES is better at diagnosing the right disease as first on the list, it is not in the top 3 cases where CBO does better.
Table 7 displays the results of the aggregate ranking for each one of the individual diseases. It shows (results in bold) that ‘pasteridiasi’ is the most difficult to diagnose disease in both cases, as first and in the top 3. This is consistent with the fact that its decision tree is one of the most complicated ones.
It is important to note that the CBO and WBM approaches perform similarly among different randomly generated datasets. On the other hand, the ACRES expert system (ES) performance depends on the similarity of the test dataset with the training dataset used to train the ES. If we use a smaller percentage of the dataset to train the ES, the performance is reduced. On the other hand, the dataset generation algorithm produces a very wide range of symptom combinations that may not actually be realistic. We believe that a real dataset of cases would include much more limited combinations of symptoms (following specific recurring patterns), and the proposed ES would perform even better. The system platform is temporarily hosted at http://aigroup.ceid.upatras.gr/manfish/ (accessed on 17 October 2023).

7. Conclusions

In this paper, we present the design, implementation, and evaluation of a web-based intelligent system for the diagnosis of farmed fish diseases. The system performs diagnosis in two stages: In the first stage, a general process based on all environmental, external, and internal parameters/symptoms is performed, resulting in an ordered list of the three most probable diseases. In the second stage, which is optional, the specialized expert systems of the resulted diseases can be used for more valid results, where additional parameters related to laboratory tests are considered. The system uses a novel hybrid approach that combines several methods for diagnosis, like rule-based, case-based, weight-based, and voting-based reasoning. The system was evaluated for the general process via an artificial dataset created from the decision trees provided by the experts. The results are very promising.
Of course, our hybrid approach can be easily used in any intelligent system that deals with the diagnosis of any animal disease (including humans) and generally in any system that deals with a classification problem and has similar requirements to farmed fish diagnosis.
A future research direction concerns further tuning of the system and evaluation based on real data to improve its performance, especially in diagnosing the first disease on the list. Another one is related to using deep learning techniques for the image recognition part of the system. Both directions, however, demand the gathering of adequate real datasets, which is not an easy task. A final direction concerns the use of ontologies for representing the domain knowledge of farmed fish diseases and ontological reasoning for making decisions on diseases.

Author Contributions

Conceptualization, I.H. and K.K.; methodology, K.K. and I.H.; software, K.K., K.D. and T.A.; validation, K.K. and K.D.; formal analysis, I.H. and K.K.; investigation, K.K., G.S., K.P., G.K. and A.I.; resources, G.S., K.P., G.K., E.A. and J.A.T.; data curation, K.K. and K.D.; writing—original draft preparation, I.H. and K.K.; writing—review and editing, K.K. and J.A.T.; visualization, I.H. and A.I.; supervision, I.H.; project administration, I.H. and J.A.T. All authors have read and agreed to the published version of the manuscript.

Funding

This work was supported by the action “Improving Competitiveness of the Greek Fish Farming Through the Development of Intelligent Systems for Disease Diagnosis and Treatment Proposal and Relevant Risk Management Supporting Actions (MIS 5067321).” EU-Greece Operational Program of Fisheries (EPAL) 2014–2020.

Institutional Review Board Statement

Not applicable.

Informed Consent Statement

Not applicable.

Data Availability Statement

The dataset used for the system evaluation was artificially created by authors of this paper and is available here: http://aigroup.ceid.upatras.gr/fish_dataset.xlsx (accessed on 17 October 2023).

Conflicts of Interest

Authors Georgios Spiliopoulos and Evi Abatzidou were employed by the company Kefalonia Fisheries S.A. The remaining authors declare that the research was conducted in the absence of any commercial or financial relationships that could be construed as a potential conflict of interest.

References

  1. Maldonado-Miranda, J.J.; Castillo-Perez, L.J.; Ponce-Hernandez, A.; Carranza-Alvarez, C. Chapter 19—Summary of economic losses due to bacterial pathogens in aquaculture industry. In Bacterial Fish Diseases; Academic Press: Cambridge, MA, USA, 2022; pp. 39–417. [Google Scholar]
  2. Sánchez, J.L.F.; Le Breton, A.; Brun, E.; Vendramin, N.; Spiliopoulos, G.; Furones, D.; Basurco, B. Assessing the economic impact of diseases in Mediterranean grow-out farms culturing European sea bass. Aquaculture 2022, 547, 737530. [Google Scholar] [CrossRef]
  3. Zrncic, S. (Ed.) Diagnostic Manual for the Main Pathogens in European Seabass and Gilthead Seabream Aquaculture; Options Méditerranéennes, Series B: Studies and Research, No. 75; CIHEAM: Zaragoza, Spain, 2020; p. 172. [Google Scholar]
  4. Li, D.; Li, X.; Wang, Q.; Hao, Y. Advanced Techniques for the Intelligent Diagnosis of Fish Diseases: A Review. Animals 2022, 12, 2938. [Google Scholar] [CrossRef]
  5. Grosan, C.; Abraham, A. Intelligent Systems-A Modern Approach; Springer: Berlin/Heidelberg, Germany, 2011. [Google Scholar]
  6. Richter, M.M.; Weber, R.O. Case Based Reasoning-A Textbook; Springer: Berlin/Heidelberg, Germany; New York, NY, USA; Dordrecht, The Netherlands; London, UK, 2013. [Google Scholar]
  7. Chatzilygeroudis, K.; Perikos, I.; Hatzilygeroudis, I. Machine Learning Basics. In Intelligent Computing for Interactive System Design: Statistics, Digital Signal Processing, and Machine Learning in Practice; Eslambolchilar, P., Komninos, A., Dunlop, M., Eds.; ACM: New York, NY, USA, 2021; pp. 143–193. [Google Scholar] [CrossRef]
  8. Aggarwal, C.C. Neural Networks and Deep Learning: A Textbook; Springer International Publishing AG: Berlin/Heidelberg, Germany, 2018. [Google Scholar]
  9. Zhao, S.; Zhang, S.; Liu, J.; Wang, H.; Li, D.; Zhao, R. Application of machine learning in intelligent fish aquaculture: A Review. Aquaculture 2021, 540, 736724. [Google Scholar] [CrossRef]
  10. Ahmed, S.; Aurpa, T.T.; Azad, A.K. Fish Disease Detection Using Image Based Machine Learning Technique in Aquaculture. J. King Saud Univ. Comput. Inf. Sci. 2022, 34, 5170–5182. [Google Scholar] [CrossRef]
  11. Sun, M.; Yang, X.; Xie, Y. Deep Learning in Aquaculture: A Review. J. Comput. 2020, 31, 294–319. [Google Scholar]
  12. Hatzilygeroudis, I.; Dimitropoulos, K.; Kovas, K.; Theodorou, J.A. Expert Systems for Farmed Fish Disease Diagnosis: An Overview and a Proposal. J. Mar. Sci. Eng. 2023, 11, 1084. [Google Scholar] [CrossRef]
  13. Negnevitsky, M. Artificial Intelligence-A Guide to Intelligent Systems, 3rd ed.; Pearsons Higher Education: River Street Hoboken, NJ, USA, 2010. [Google Scholar]
  14. Shortliffe, E.H.; Buchanan, B.G. A model of inexact reasoning in medicine. Math. Biosci. 1975, 23, 351–379. [Google Scholar] [CrossRef]
  15. Sumartono, I.; Arisandi, D.; Siahaan, A.P.U.; Aan, M. Expert System of Catfish Disease Determinant Using Certainty Factor Method. Int. J. Recent Trends Eng. Res. 2017, 3, 202–209. [Google Scholar] [CrossRef]
  16. Aamodt, A.; Plaza, E. Case-based reasoning: Foundational issues, methodological variations and system approaches. Artif. Intell. Commun. 1994, 7, 39–59. [Google Scholar] [CrossRef]
  17. Kolodner, J.L. Case-Based Reasoning; Morgan Kaufmann: San Mateo, CA, USA, 1993. [Google Scholar]
  18. Keet, C.M. An Introduction to Ontology Engineering. 2020 College Publications. Open Book. ISBN: 978-1-84890-295-4. Available online: https://people.cs.uct.ac.za/~mkeet/files/OEbook.pdf (accessed on 18 November 2023).
  19. Qin, H.; Xiao, J.; Gao, X.; Wang, H. Horse-Expert: An aided expert system for diagnosing horse diseases. Pol. J. Veter-Sci. 2016, 19, 907–915. [Google Scholar] [CrossRef] [PubMed]
  20. Sun, M.; Li, D. Aquatic Animal Disease Diagnosis System Based on Android. In Proceedings of the 9th IFIP WG 5.14 International Conference on Computer and Computing Technologies in Agriculture (CCTA), Beijing, China, 27–30 September 2016; pp. 115–124. [Google Scholar]
  21. Munirah, M.Y.; Suriawati, S.; Teresa, P.P. Design and Development of Online Dog Diseases Diagnosing System. Int. J. Inf. Educ. Technol. 2016, 6, 913–916. [Google Scholar] [CrossRef]
  22. Gebre-Amanuel, E.K.; Taddesse, F.G.; Assalif, A.T. Web Based Expert System for Diagnosis of Cattle Disease. In Proceedings of the 10th International Conference on Management of Digital EcoSystems (MEDES’18), Tokyo, Japan, 25–28 September 2018; ACM: New York, NY, USA, 2018; p. 8. [Google Scholar] [CrossRef]
  23. Fahrozi, W.; Harahap, C.B.; Syahputra, A.; Pane, R. Expert System of Diagnosing Koi’s Fish Disease by Certainty Factor Method. In Proceedings of the 2018 6th International Conference on Cyber and IT Service Management (CITSM), Parapat, Indonesia, 7–9 August 2018; pp. 1–5. [Google Scholar] [CrossRef]
  24. Alarcón-Salvatierra, A.; Bazán-Vera, W.; Samaniego-Cobo, T.; Anchundia, S.M.; Alarcón-Salvatierra, P. SE-DiagEnf: An Ontology-Based Expert System for Cattle Disease Diagnosis. In Technologies and Innovation. CITI 2018. Communications in Computer and Information Science; Valencia-García, R., Alcaraz-Mármol, G., Del Cioppo-Morstadt, J., Vera-Lucio, N., Bucaram-Leverone, M., Eds.; Springer Nature: Cham, Switzerland, 2018; Volume 883, pp. 70–81. [Google Scholar] [CrossRef]
  25. Sihotang, H.T.; Riandari, F.; Simanjorang, R.M.; Simangunsong, A.; Hasugian, P.S. Expert System for Diagnosis Chicken Disease using Bayes Theorem. J. Phys. Conf. Ser. 2019, 1230, 012066. [Google Scholar] [CrossRef]
  26. Tomatala, M.F.; Arundaa, R.; Damodalag, H. Fish Disease Diagnosis using Case-based Reasoning with Euclidean Distance. In Proceedings of the 4th International Conference of Vocational Higher Education (ICVHE 2019)—Empowering Human Capital Towards Sustainable 4.0 Industry, Manado, Indonesia, 3–4 September 2019; SCITEPRESS-Science and Technology Publications, LDA: Setúbal, Portugal, 2021; pp. 215–221. [Google Scholar]
  27. Mardiyanto, F.F.; Satria, F. Expert System for Diagnosis Diseases in Betta Fish Based on Android. Int. J. Artif. Intell. Robot. Technol. IJAIRTec 2021, 1, 35–44. [Google Scholar]
  28. Riyanto, E.D.; Prasetyo, E.; Zainal, R.F.; Rubaningtyas, R.; Setyatama, F.; Herulambang, W.; Alim, S.; Tias, R.F. Design of Expert System Diagnosis of Catfish Disease with Forward Chaining Method. J. Electr. Eng. Comput. Sci. 2022, 7, 1215–1222. [Google Scholar] [CrossRef]
  29. Cha, S.-H. Comprehensive Survey on Distance/Similarity Measures between Probability Density Functions. Int. J. Math. Models Methods Appl. Sci. 2007, 1, 300–307. [Google Scholar]
  30. Widians, J.A.; Puspitasari, N.; Febriansyah, A. Disease Diagnosis System using Certainty Factor. In Proceedings of the 6th International Conference on Electrical, Electronics and Information Engineering (ICEEIE 2019), Denpasar, Indonesia, 3–4 October 2019; pp. 303–308. [Google Scholar]
  31. Saputri, A.E.; Sevani, N.; Saputra, F.; Sali, R.K. Using Certainty Factor Method to Handle Uncertain Condition in Hepatitis Diagnosis. ComTech Comput. Math. Eng. Appl. 2020, 11, 1–10. [Google Scholar] [CrossRef]
  32. Muntiari, N.R.; Hanif, K.H. Application of The Certainty Factor Method for Diagnosing Osteoarthritis using The Python Programming Language. J. Adv. Health Inf. Res. JAHIR 2023, 1, 21–27. [Google Scholar] [CrossRef]
  33. Hatzilygeroudis, I.; Kovas, K. A Tool for Automatic Creation of Rule-Based Expert Systems with CFs. In IFIP Advances in Information and Communication Technology, Volume 339, Artificial Intelligence Applications and Innovations (AIAI-10); Springer: Berlin/Heidelberg, Germany, 2010; pp. 195–202. [Google Scholar]
  34. Konstantinopoulou, G.; Kovas, K.; Hatzilygeroudis, I.; Prentzas, J. An Approach using Certainty Factor Rules for Aphasia Diagnosis. In Proceedings of the 10th International Conference on Information, Intelligence, Systems and Applications (IISA 2019), Patras, Greece, 15–17 July 2019. [Google Scholar]
  35. Brunelli, R. Template Matching Techniques in Computer Vision: Theory and Practice; Wiley: Hoboken, NJ, USA, 2009; ISBN 978-0-470-51706-2. [Google Scholar]
Figure 1. Ichthyological Knowledge Elicitation Process.
Applsci 13 13059 g001
Figure 2. Decision tree for Myxobacteriosis diagnosis elicited from experts.
Applsci 13 13059 g002
Figure 3. Specialized rule-based expert system development.
Applsci 13 13059 g003
Figure 4. Level-Based Diagnostic Process.
Applsci 13 13059 g004
Figure 5. Overall Diagnostic Process Flow Diagram.
Applsci 13 13059 g005
Figure 6. An example of a target- and base-image matching result A splenomegaly image pattern is detected on fish images with different confidence levels.
Applsci 13 13059 g006
Figure 7. First level user interface.
Applsci 13 13059 g007
Figure 8. First level results example.
Applsci 13 13059 g008
Figure 9. Selecting the diagnosis level.
Applsci 13 13059 g009
Figure 10. Selecting symptoms on the second diagnosis level.
Applsci 13 13059 g010
Figure 11. Second diagnosis level results.
Applsci 13 13059 g011
Figure 12. Second diagnosis level summary of results.
Applsci 13 13059 g012
Figure 13. Selecting the “Myxobacteriosis” SES from the user interface.
Applsci 13 13059 g013
Figure 14. SES example questions.
Applsci 13 13059 g014
Figure 15. Storing a validated case.
Applsci 13 13059 g015
Table 1. Seabass diseases elicited from experts.
NoDiseaseCategory
1Aeromonas diseaseBacterial
2MycobacteriosisBacterial
3MyxobacteriosisBacterial
4PhotobacteriosisBacterial
5Vibriosis (Vibrio anguillarum)Bacterial
6Vibriosis (Vibrio harveyi)Bacterial
7CaligusParasitic
8CeratothoaParasitic
9DiplectanumParasitic
10LernanthropusParasitic
11VNNViral
12Metabolic DiseasesMetabolic
Table 2. Parameters/Symptoms of Myxobacteriosis elicited from experts.
Parameter/SymptomType (Values)
Temperaturenumeric
Lethargic fishboolean
Anorexiaboolean
Hemorrhagic stomatitisboolean
Skin color darkeningboolean
Skin discolorationboolean
Skin ulcersCategorical
(no, small, mild, large)
Hemorrhagic and necrotic skin changes in finsboolean
Hemorrhagic skin changes in tailboolean
Necrotic skin changes in finsboolean
Necrotic skin changes in tailboolean
Corrosion of tailboolean
Corrosion of finsboolean
Stressboolean
Table 3. Parameters/Symptoms of sea bass diseases elicited from experts.
(Sub)CategoryParameterType
Environmental
Temperaturenumeric
Average weightnumeric
External Clinical Signs (Symptoms)
BehavioralAnorexiaboolean
Lethargic fishboolean
Weight lossboolean
Reduced weight increase rateboolean
Swimming Bladder Control Lossboolean
Stressboolean
MortalityCategorical (zero, massive, nonmassive)
Swimming BehaviorCategorical (normal, alien, slow, fast)
Time between symptoms and deathsCategorical (normal, small, large)
PhysiologicalSkin color darkeningboolean
Skin discolorationboolean
Whitish areasboolean
Conjugal fins rednessboolean
Retinopathyboolean
Exophthalmosboolean
Corneal Cloudingboolean
Mouth lower jaw deformityboolean
Corrosion-Necrosis of Tail and Finsboolean
Scales Lossboolean
Bleeding areasboolean
Hemorrhagic and necrotic lesionsboolean
Hemorrhagic stomatitisboolean
Skin ulcersCategorical (no, small, mild, large)
Fins and Tail ulcersboolean
Scoliosis or Lordosis or Hypercalcificationboolean
Release of Mucus Fecal Castsboolean
Internal Clinical Signs (Symptoms)
GillsExcess gill mucousboolean
Gill discoloringboolean
Anemic gillsboolean
Local changesboolean
INTERNAL OrgansPseudoenteritisboolean
Splenomegalyboolean
Granulomatosisboolean
Inflamed liverboolean
Table 4. Table of correlations of parameters/symptoms and diseases (part).
SymptomsPhoto-BacteriosisMyxo-BacteriosisMyco-BacteriosisCeratothoa
Weight loss X
Mortality (deaths)nomass, mass
AnorexiaXX X
Lethargic fish X
Swimming Behaviornormal, alien
Color DarkeningXX
Skin discoloration X
Mouth Lower Jaw Deformity X
Fins and tail corrosion X
Scales Loss X
Stomatitis X
Skin ulcers XX
Gill mucous X
Anemic gills X
Granulomatosis X
Table 5. Laboratory Examination Parameters.
Laboratory Parameters
Microbiological
GRAM Stain
Bacterial Culture
Viral Culture
Antibiogram
Urinary adhesion
Blood test
Biochemical API test
Microscopic
Gills microscopic examination
Histopathological examination
Molecular
PCR test
Chemical
Chemical examination
Table 6. Methods evaluation results.
MethodAccuracyTop-3 AccuracyAverage Rank
CBO0.5110.9191.825
WBM0.4350.8971.982
ACRES0.6220.9091.743
AGM0.6580.9401.569
Table 7. AGM results per disease.
DiseaseAccuracyTop-3 AccuracyAverage Rank
pasteridiasi0.3220.7622.399
mixovaktiridiasi0.6730.9401.547
metavolika0.8000.9601.327
don-vibrio-anguil0.7070.9671.473
don-vibrio-harv0.6600.9471.580
egkefalopatheia0.7000.9731.407
ceratothoa0.7201.0001.333
galicus0.5200.9331.773
diplectanum0.5200.8402.007
lernantropus0.6270.9731.493
mycobacteriosis0.7730.9871.353
aeromonada0.8600.9931.180
Disclaimer/Publisher’s Note: The statements, opinions and data contained in all publications are solely those of the individual author(s) and contributor(s) and not of MDPI and/or the editor(s). MDPI and/or the editor(s) disclaim responsibility for any injury to people or property resulting from any ideas, methods, instructions or products referred to in the content.

