1. Introduction
The weather has seasonal changes in Korea, and the outside minimum temperatures in the cold regions drop below −25 °C in the winter. High-speed railway tunnels have been constructed in the cold regions, and freezing-related damage, such as the obstruction of drainage flow and freezing groundwater leakage, has occurred recently. Most mountainous railway tunnels are designed with waterproofing membranes since groundwater exists on the backside of the tunnels. The related tunnel standards and existing studies were analyzed to predict freezing groundwater inside a tunnel.
Other countries located in cold regions suggest tunnel design standards for anti-freezing. The Road Design Procedure in Japan (2018) suggests installing anti-freezing materials between the concrete lining and the waterproofing membrane from the tunnel entrance to 100 m length [
1]. The road tunnel standards from the Norwegian Public Roads Administration (2004) recommend installing anti-freezing materials from the tunnel entrance to 200 m~300 m. However, for long tunnels, freezing damage should be evaluated individually [
2].
Existing studies used measurement and numerical analysis to determine inside air and lining temperatures. Wenbo Li et al. (2015) measured the lining surface temperature in the Hongfu tunnel and simulated it using FEM analysis with ANSYS for a 1-year temperature cycle [
3]. Hee-Su Son et al. (2017) also investigated the back side of the tunnel temperature using the FEM program under the daily average air temperature applied constantly. The maximum frost depth changed depending on the thickness and thermal properties of the tunnel structures [
4]. Since then, studies have been conducted on the inside air temperature variation with influencing factors related to airflow motion. Pengyu Zhao et al. (2020) installed thermometers at the vault, waist, and side walls for the total tunnel length (L = 2910 m). The closer the tunnel bottom, the lower the inside air temperature measured. The air temperature in the tunnel caused by intermittent traffic winds or natural winds blowing into the tunnel was transient [
5]. Park et al. (2021) also measured the air temperature and showed that it returned to the original state within 30 min after a train passed [
6]. Yimin Wu et al. (2020) investigated road tunnels (L = 875 m~4905 m) in North China to analyze the inside air temperature over time. The inside air temperature field fluctuated daily, which led to freeze–thaw cycles on the lining and a lesser effect on the outside air temperature as the tunnel length increased [
7].
Long tunnels should be evaluated to specify the freezing damage according to the overseas standard. However, the existing studies on air temperature variation inside a tunnel focus on its measurement and change cycle for one year. The air temperature inside tunnels changes depending on various influencing factors, such as the outside air temperature, inlet wind speed, tunnel across-area, tunnel length, etc. Korean mountainous tunnels have certain conditions, including a surrounding ground depth exceeding 20 m and a generally low inlet wind speed at the tunnel entrance during the winter season. Therefore, the air temperature inside the tunnel is mainly closely affected by the outside air temperature and the tunnel length. The minimum air temperature inside a tunnel, which affects groundwater freezing has been presented along the tunnel length after analyzing the daily air temperature variation inside the tunnel.
2. Background
2.1. The Process of Freezing inside a Tunnel
The air temperature inside the tunnel is warmer than the outside in winter due to ground heat. The ground temperature rises as it goes deeper from the surface and maintains a constant temperature at a depth of 5 to 10 m [
8,
9,
10]. The tunnels in mountainous areas have a ground depth of 20 m or more, and the air temperature inside the tunnels remains constant due to the surrounding ground depth [
4,
11]. The railway tunnels in the mountainous areas in Korea are surrounded by rock with a small permeability coefficient and are designed with a waterproofing membrane to prevent the groundwater from flowing into the tunnel. The hydrogeological conditions can be assumed to be fully saturated and have no head loss conditions. Existing studies have measured the air temperature inside the tunnels, which rises nonlinearly from the entrance to the midpoint along the tunnel length [
5,
12]. Therefore, it is reasonable to analyze the tunnel half-length, assuming that the weather conditions are identical at both entrances, as shown in
Figure 1a. The air temperature changes inside the tunnel irregularly according to the change in the airflow motion. The inside air temperature changes by the intermittent traffic winds or natural winds blowing into the tunnel are transient [
5]. The ventilation systems of railway tunnels are generally not operated unless it is an emergency. The lengths of mountain tunnels in Korea are mostly over 1 km, and the inlet wind speed is generally very low at the tunnel entrance in the winter. The ground temperature flowing inside a tunnel is constant due to geothermal heat, so the air temperature inside the tunnel predominantly influences the outside air temperature and the tunnel length. The inside air temperature variation by the tunnel length is transferred to the back side of the tunnel lining differently, and then freezing and thawing are repeated (
Figure 1b). Therefore, the tunnel backside temperature was estimated through thermal analysis, after the daily inside air temperature variation by the tunnel length was analyzed using the actual measurements.
The minimum temperature that freezes the groundwater on the back side of the tunnel waterproofing membrane was predicted based on Fourier’s law for searching for freezing damage inside a tunnel. In the typical design of a drainage tunnel, a waterproofing membrane should be installed between the concrete lining and the shotcrete to prevent groundwater leakage [
13]. If the groundwater on the back of the waterproofing membrane becomes frozen in winter, it causes damage due to the volume expansion of the frozen water and the flow obstruction in the drainage system. The minimum temperature that freezes the groundwater behind the waterproofing membrane was predicted based on thermal conduction to estimate the freezing damage inside a tunnel.
2.2. Fourier’s Law
Thermal conduction is presented with the energy flow caused by the temperature difference between materials. Heat is transferred from high temperatures (
) to low temperatures (
), and energy equilibrium between materials appears after a certain period, as shown in
Figure 2a.
Figure 2b shows that the heat transfer occurs inside a tunnel between the warm surrounding ground heat and the cold air temperature inside a tunnel in the winter (
→
). The rate of heat transfer is proportional to the area and the temperature gradient (
) according to Fourier’s law [
14].
The rate of heat transfer can be expressed as in Equation (1). The heat flows from high temperature to low temperature and has a negative sign according to the second law of thermodynamics [
15]. The railway tunnel for drainage was designed in the order of concrete lining, waterproofing membrane, and shotcrete. The freezing problems in the tunnel can be solved by the LUSAS Thermal Program with the correlations of the air temperature inside the tunnel, the ground temperature, and the tunnel structures.
Here, : The rate of heat transfer; : Thermal conductivity of the material; : Area; : Temperature difference; : Thickness.
3. Air Temperature Change inside the Tunnel in Winter
3.1. Characteristics of Ground Temperature and outside Air Temperature in Winter
3.1.1. Ground Temperature in Korea
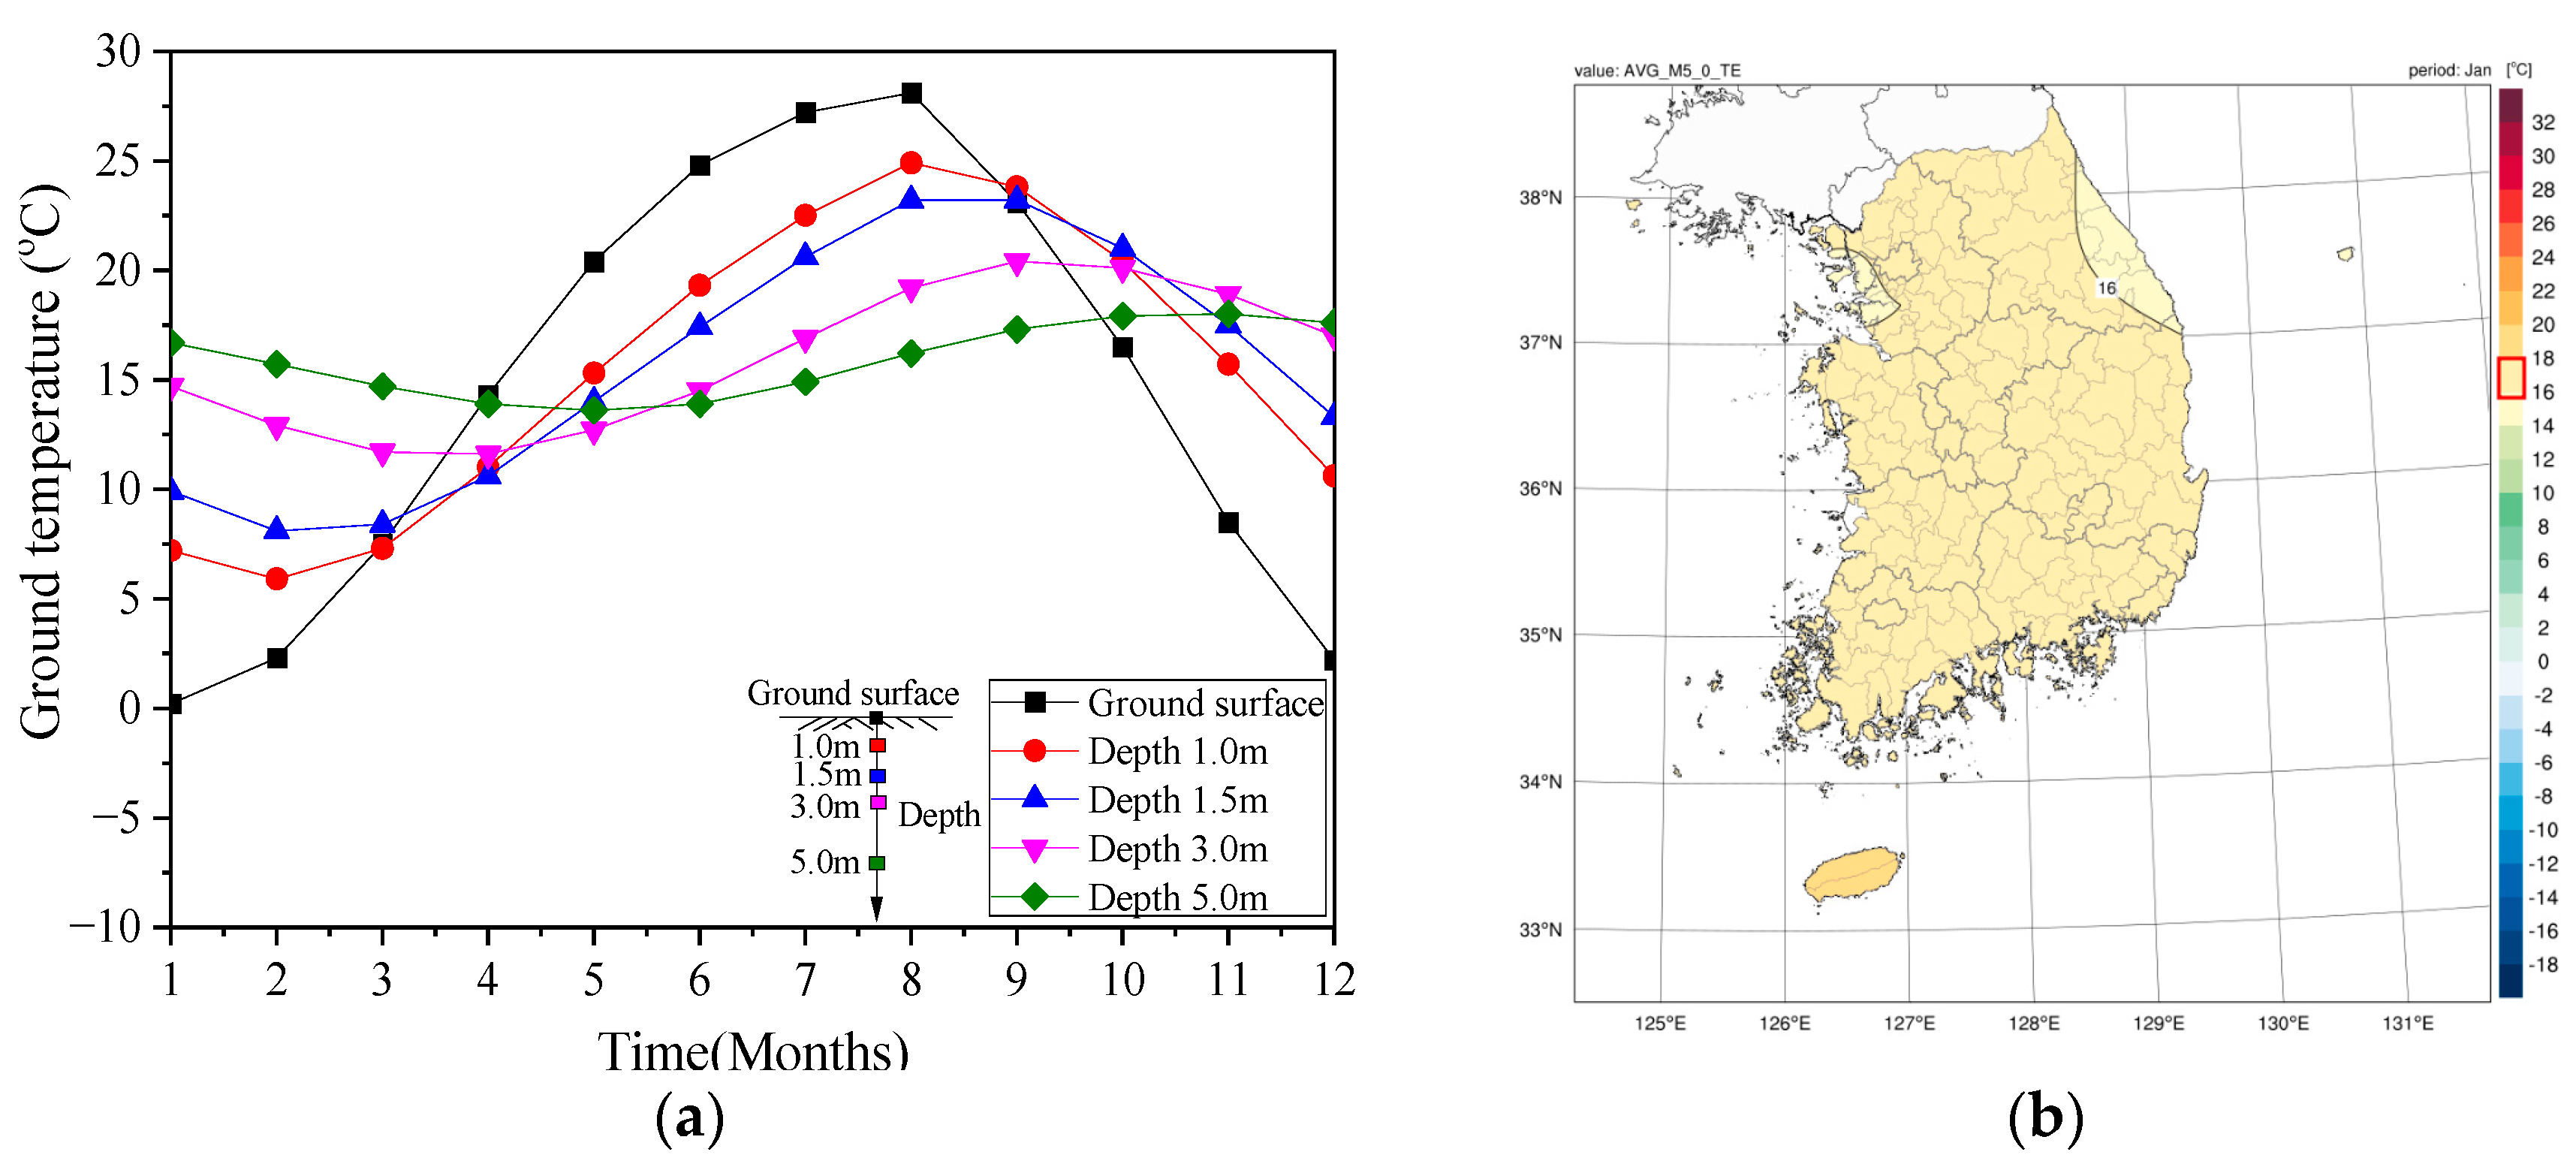
Since Korea has seasonal weather conditions, the ground temperature also changes with the seasons. The Korea Meteorological Administration (KMA) measures ground temperatures from the surface to a depth of up to 5 m. The measured data provided the average ground temperature for the last 30 years (1991 to 2020), as shown in
Figure 3 [
16]. The surface ground temperature has a periodic function for 12 months. The minimum temperature was 0.2 °C in January, and the maximum temperature was 28.1 °C in August. The daily average outside air temperature drops below freezing beginning from November to December, and the freezing temperature lasts up to 4 months. The ground temperature at a depth of 5 m ranged from 15.7 °C to 18.0 °C, and the average value was 17.0 °C during the freezing period.
Figure 3b shows the ground temperature distribution at a depth of 5 m in January when the lowest temperature is recorded the most. The ground temperature is constant in most areas except some areas in the northeast.
3.1.2. Outside Air Temperature Variation with DTR
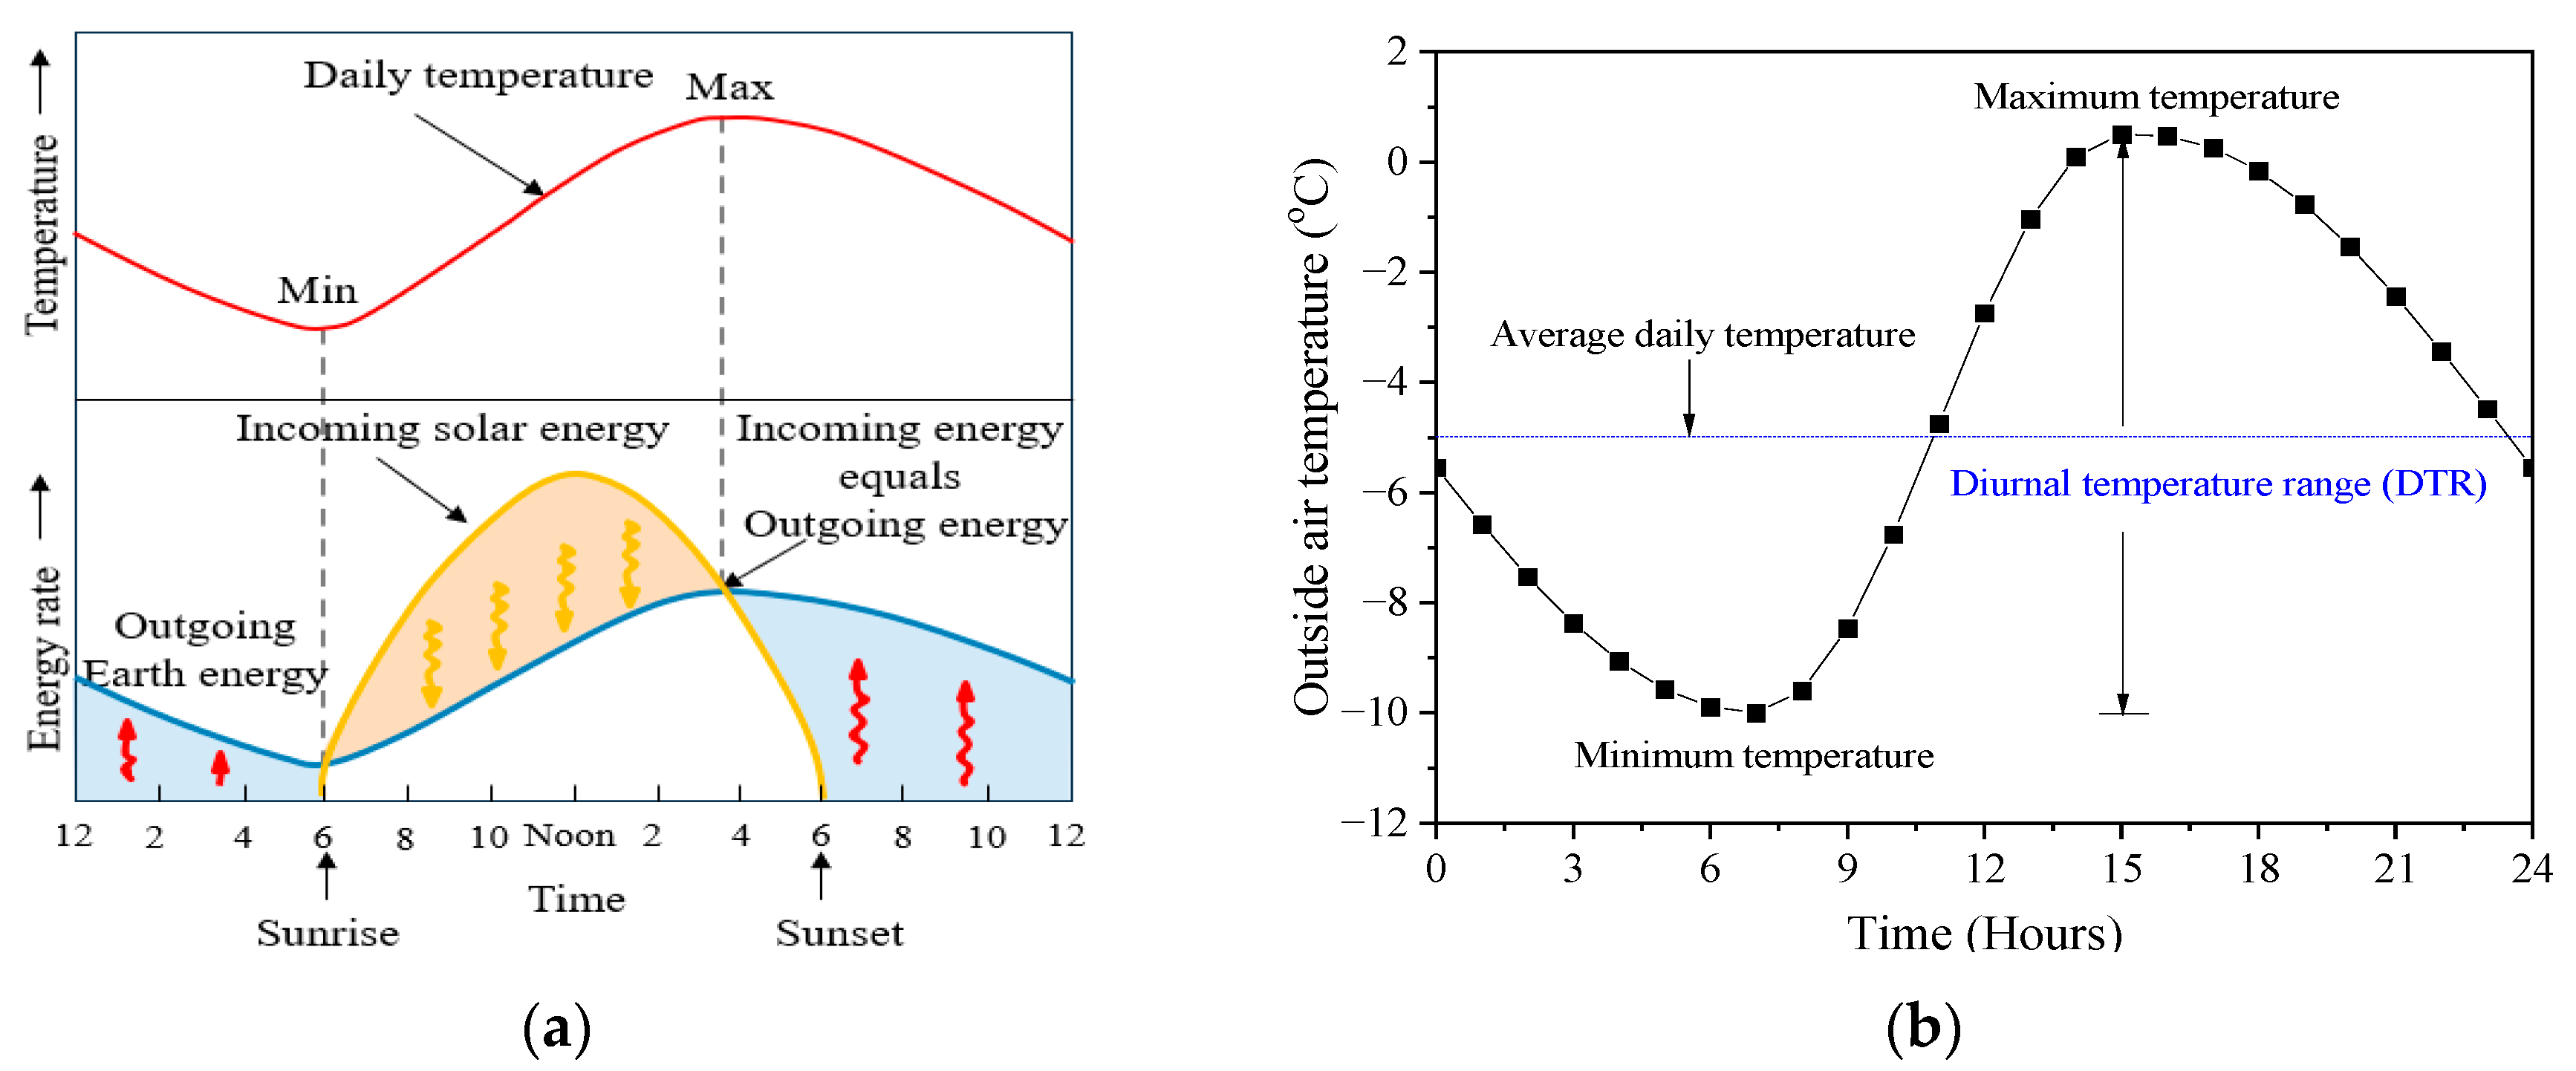
The daily variation in the outside air temperature is controlled by incoming energy from the sun and outgoing energy from the Earth’s surface [
17]. The minimum and maximum temperatures are reached depending on the energy rate change, as shown in
Figure 4a. The air temperature has a diurnal temperature range (DTR) and changes over time in a day. The daily minimum temperature (
) and maximum temperature (
) are measured primarily at 7:00, before sunrise, and around 15:00, just before sunset in the winter. Therefore, the air temperature in the winter shows that peak values occur at the time of the maximum and minimum temperatures and change periodically, as shown in
Figure 4b.
Meteorological data for the last 30 years (1991–2020) was surveyed to analyze a change in the DTR during the winter, as shown in
Table 1. The highest diurnal temperature range (DTR) was 14.8 °C in Uiseong, located in the southeast, and the lowest DTR was 7.3 °C in Incheon, located in the northwest. The average DTR was 10.5 °C in the winter.
The air temperature inside the tunnel is affected by the outside air temperature variation, and the DTR inside a tunnel also changes according to the tunnel length. This study analyzed the DTR correlation between the outside and inside temperatures of the tunnel using the measurements. The change pattern of the DTR was simplified and applied to the heat transfer analysis.
3.2. DTR Correlation between outside and inside Air Temperature by the Tunnel Length
3.2.1. Site Measurement
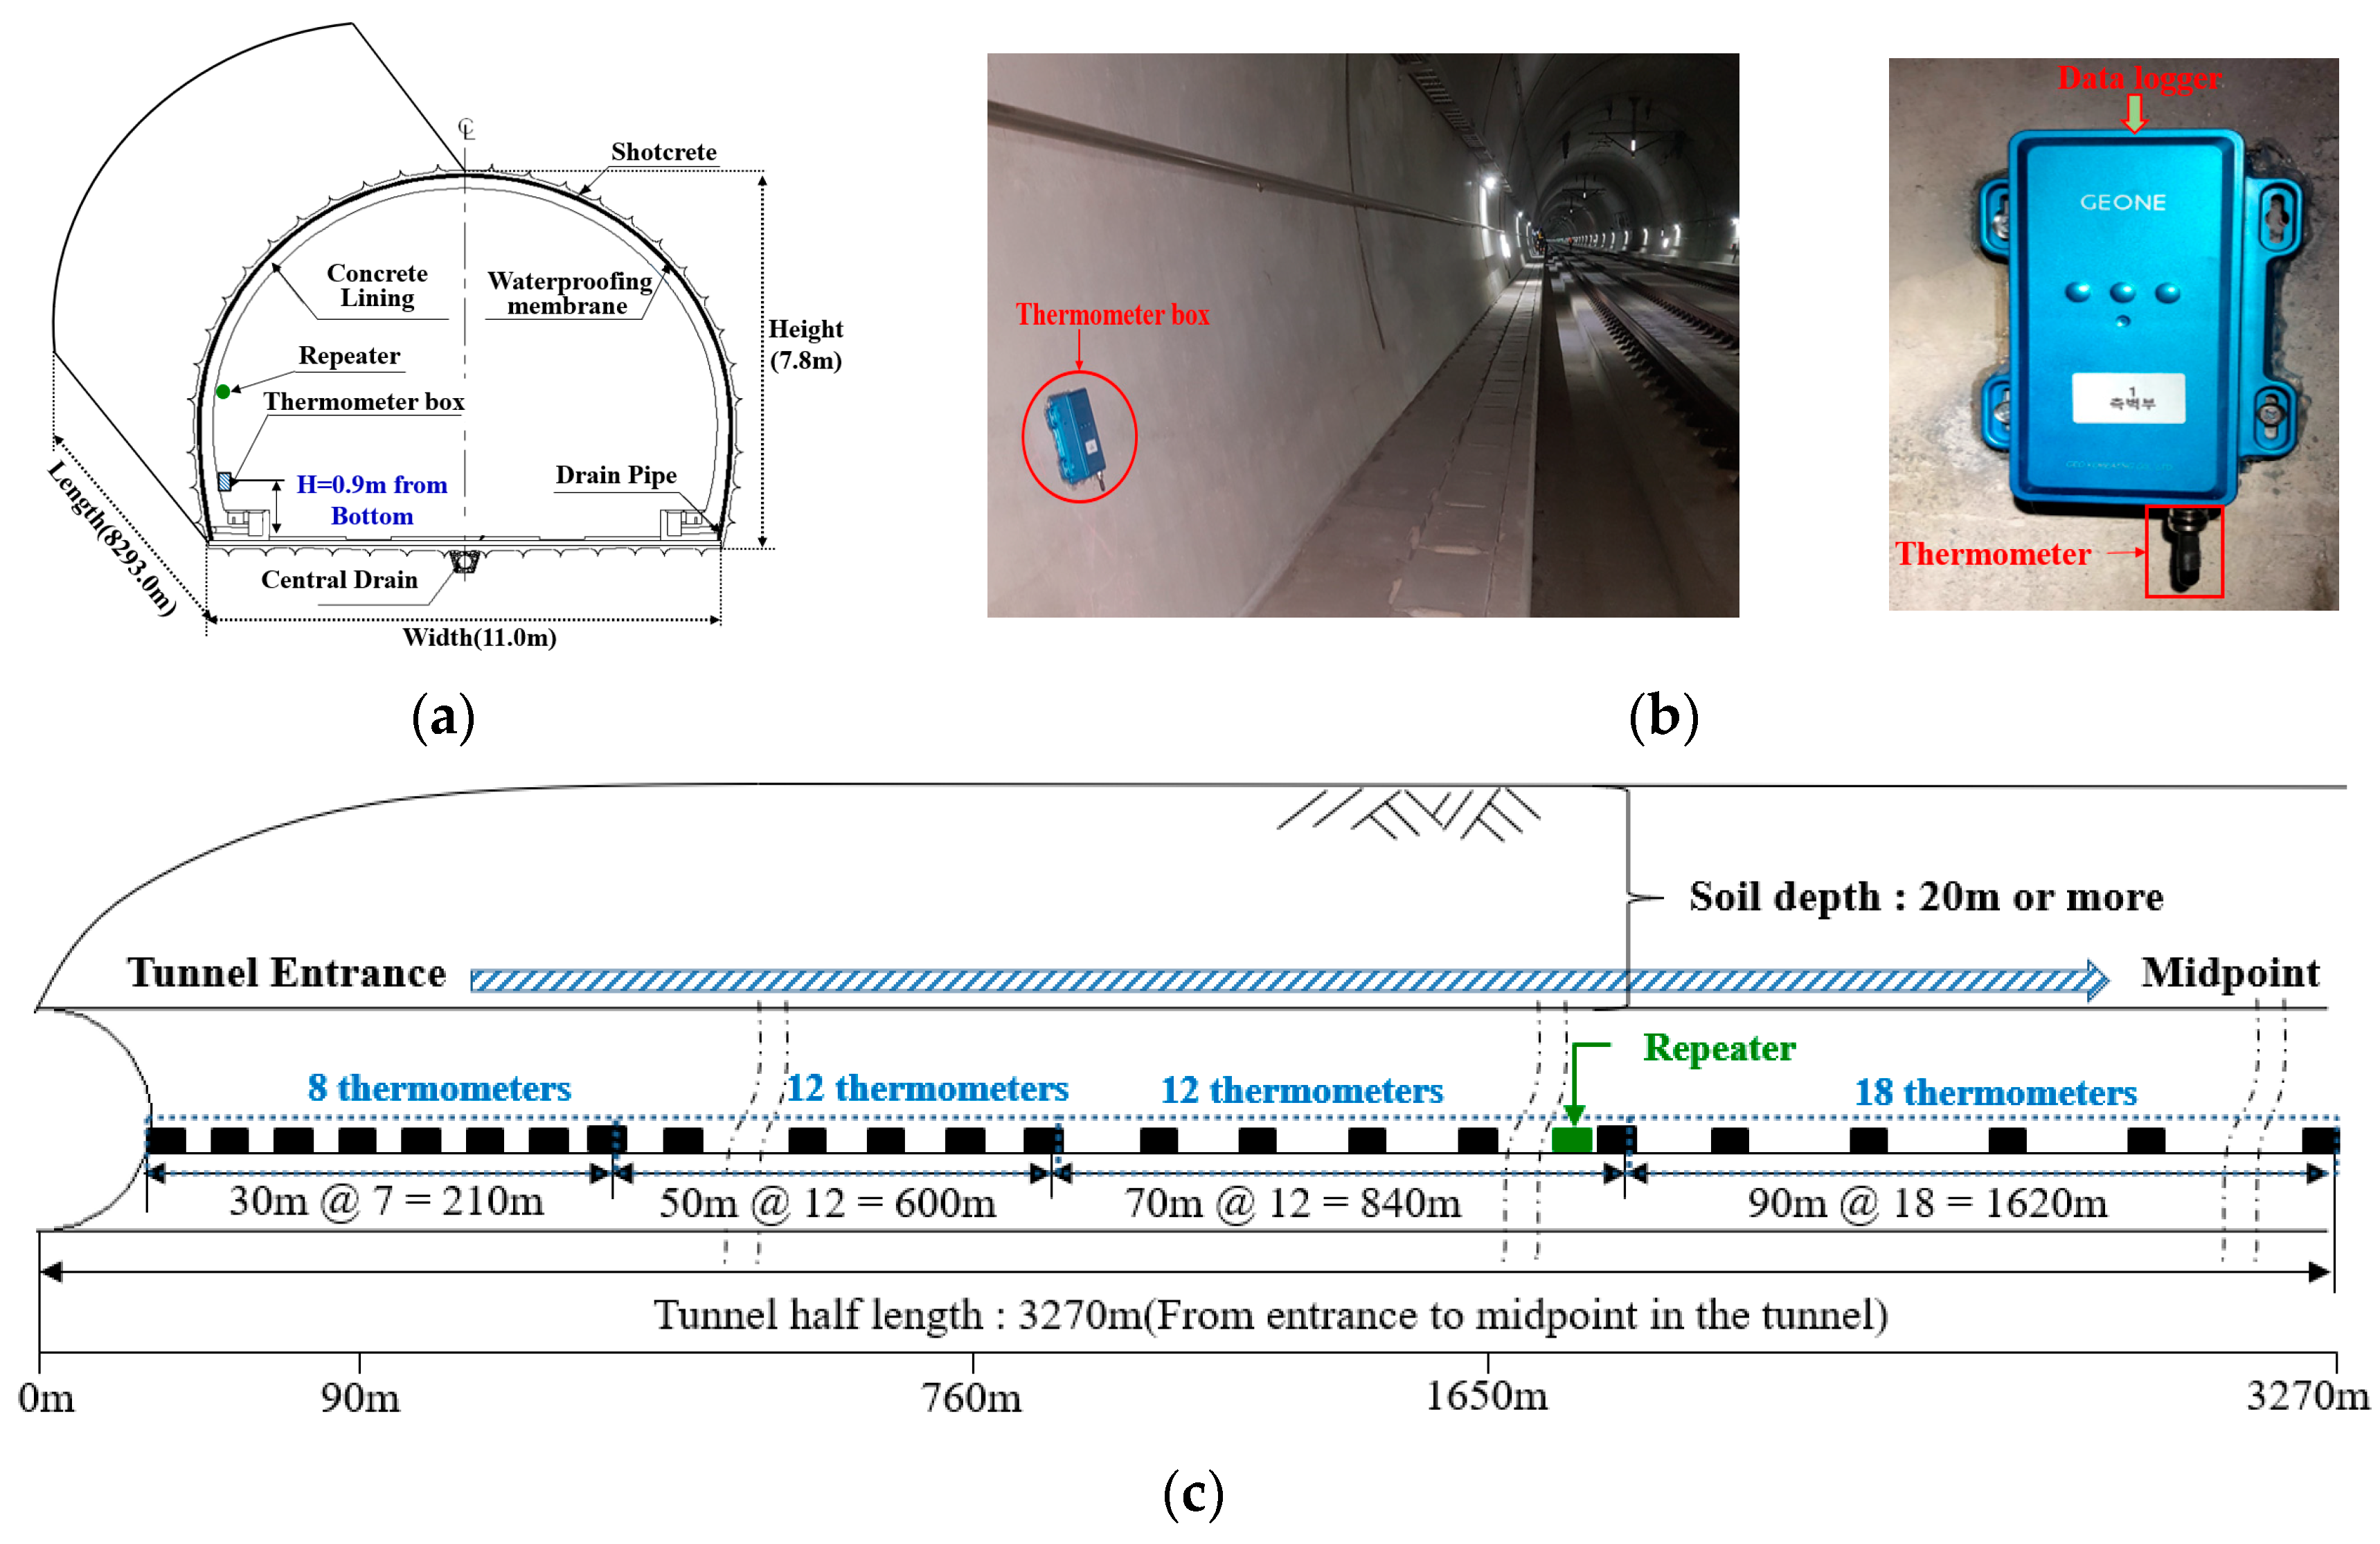
The air temperature variation inside the tunnel was measured in a railway tunnel located in a cold region. The measured tunnel was designed as a double-track tunnel with a width, height, and length of 11 m, 7.8 m, and 8293 m, respectively, as shown in
Figure 5a. Cold air is denser than warm air, so thermometers are installed at the lower part of the tunnel. Therefore, thermometers were installed at a height of 90 cm from the tunnel bottom, as shown in
Figure 5b. The measurement distance selected was from the tunnel entrance (0 m) to the midpoint (3270 m) considering the trend in the air temperature distribution. Fifty thermometers and one repeater were installed, as shown in
Figure 5c. The thermometer box consists of a thermometer sensor and a data logger. After each thermometer sensor measured the air temperature inside the tunnel over time, the data were transmitted to the repeater through a data logger. The accumulated data in the repeater were transmitted to a remote program. The inlet wind speed at the tunnel entrance was an average of 1 m/s during the measurement period (February 2019). The ventilation system was not operated during the measuring period since it was only used for emergencies.
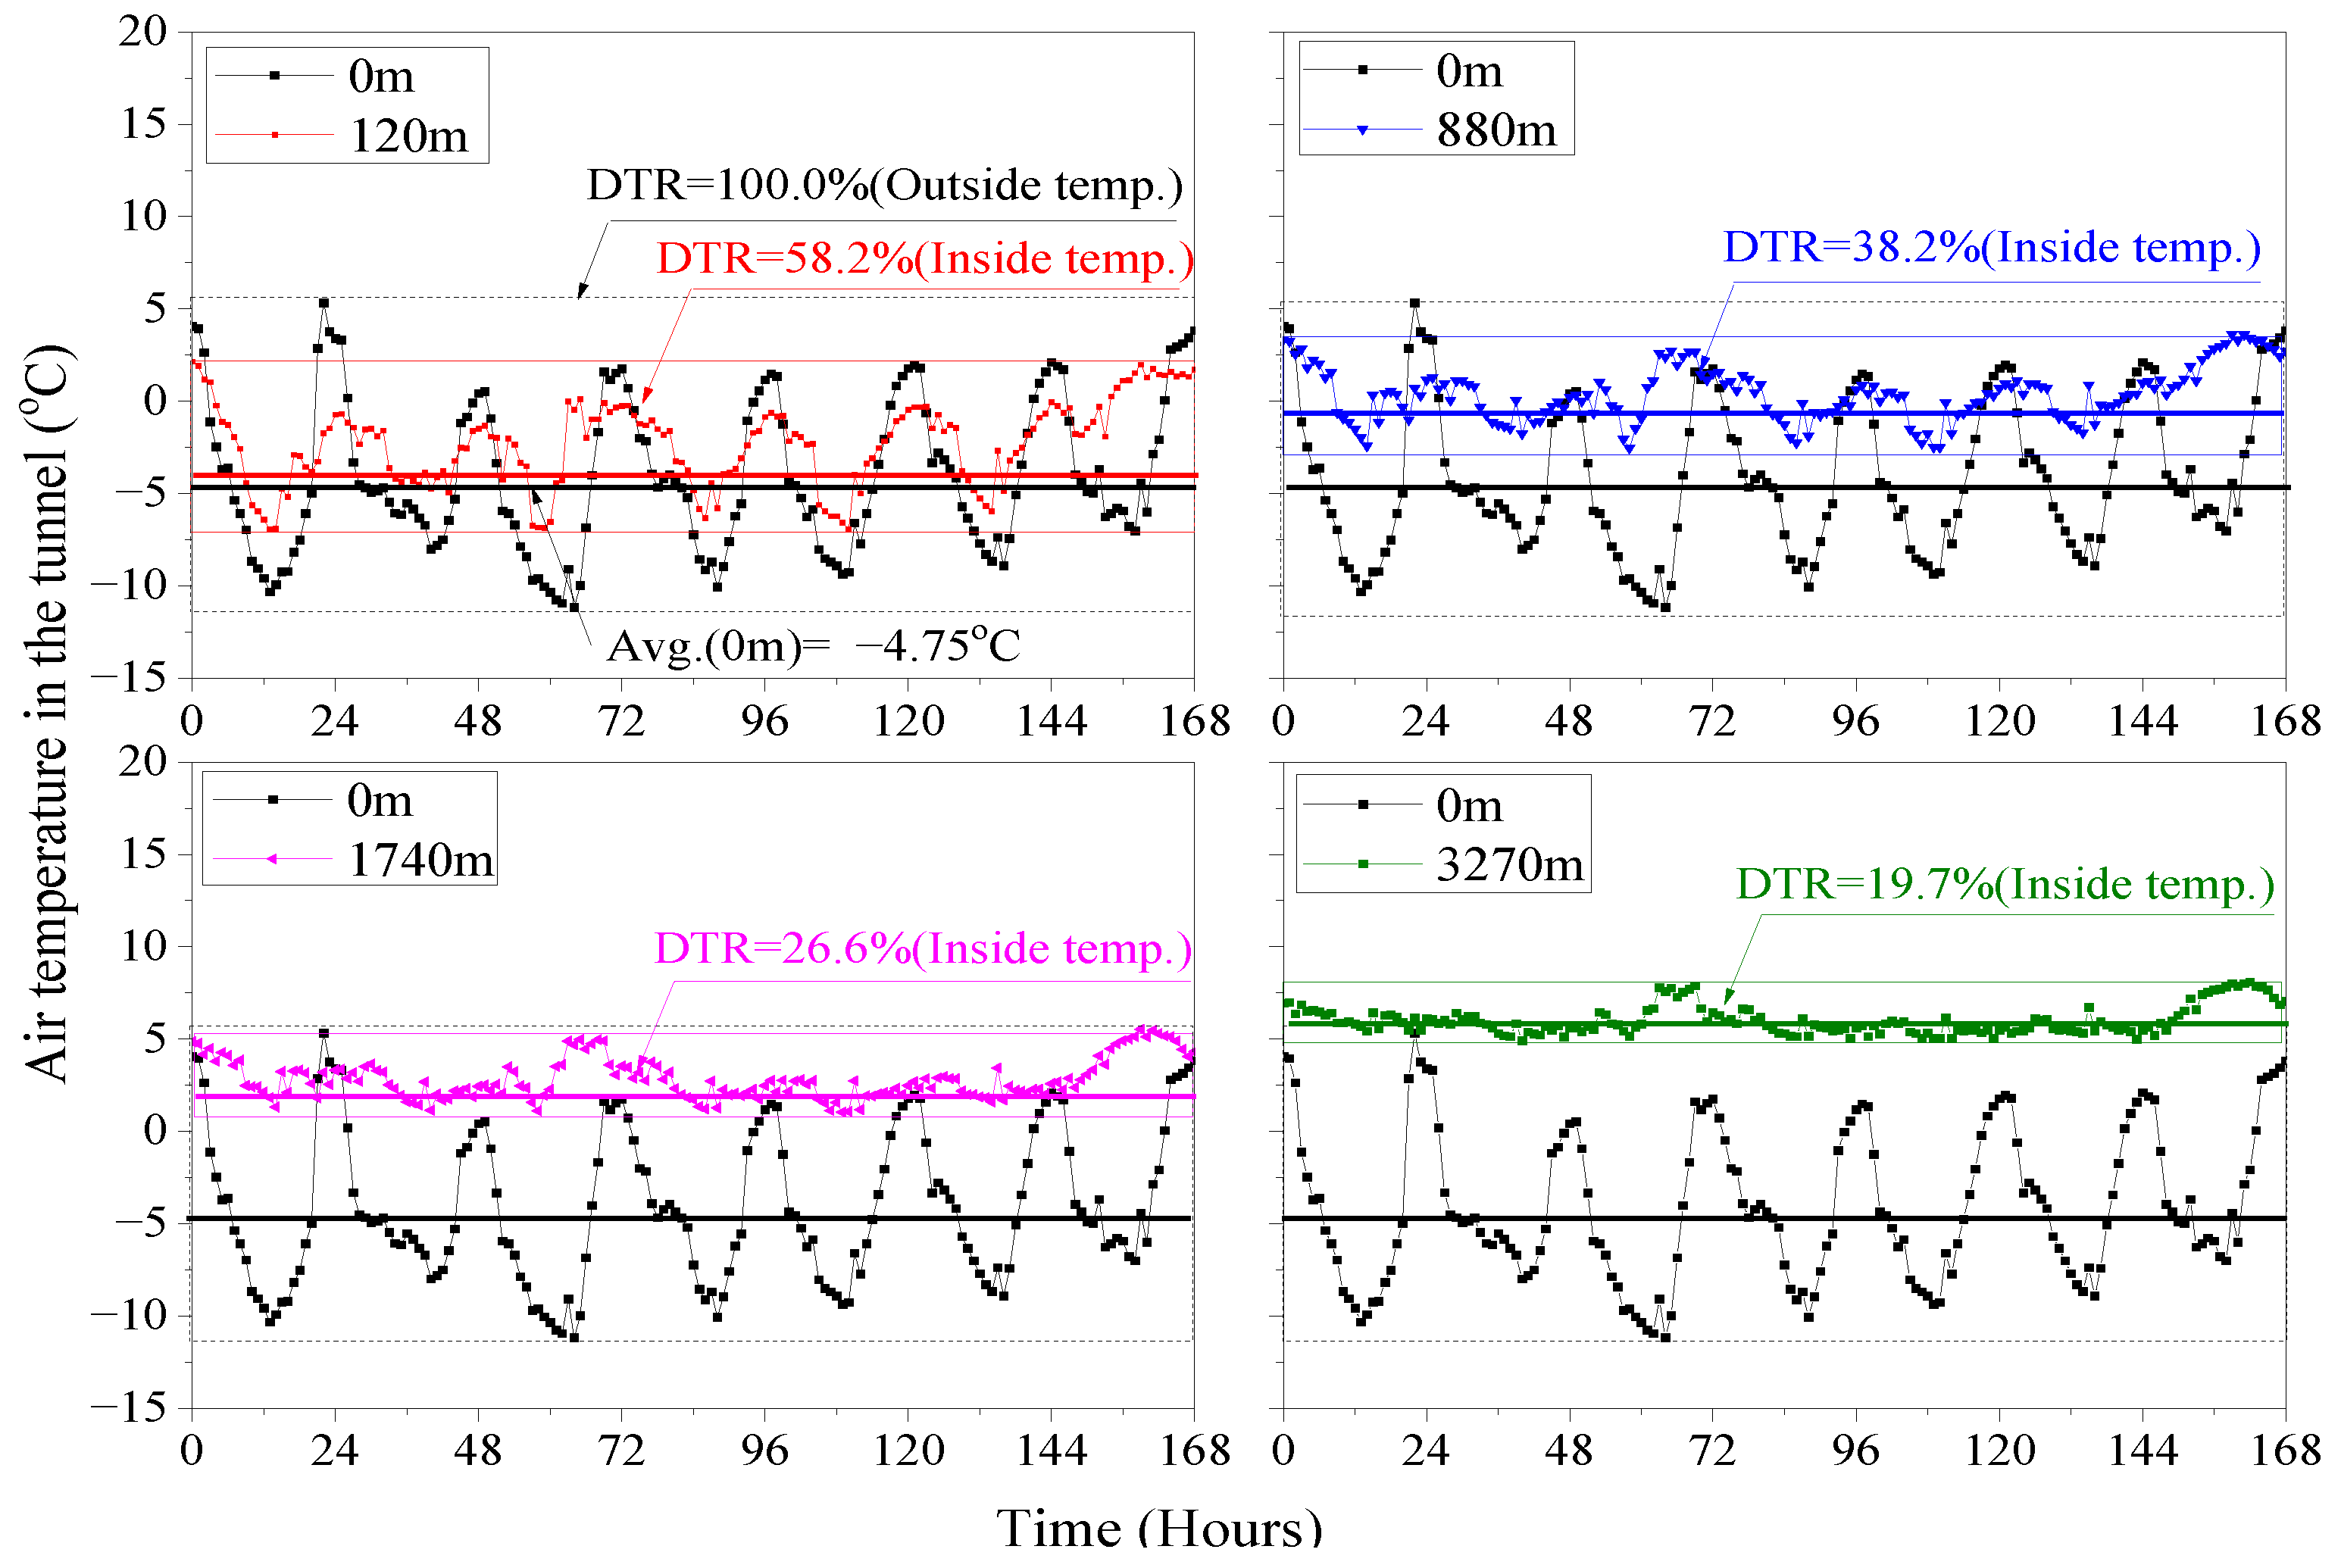
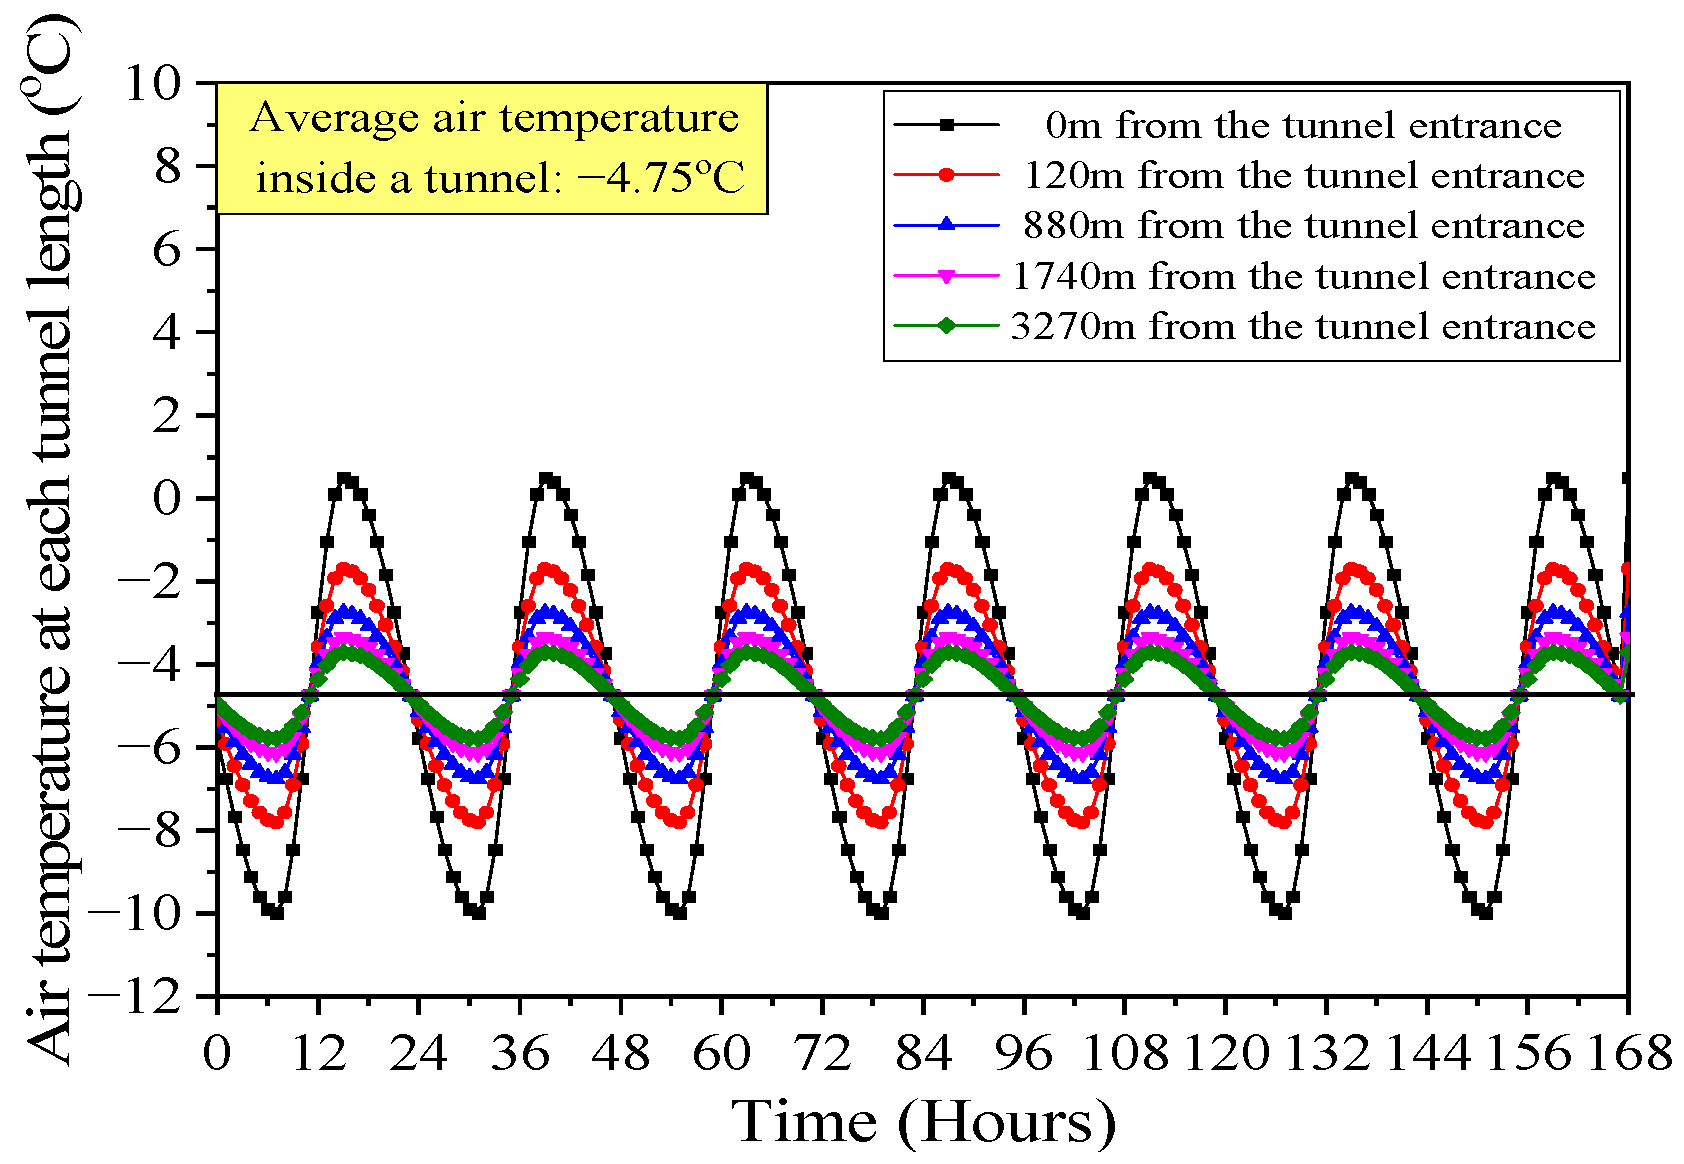
The data were selected when the outside air temperature maintained a constant diurnal temperature range (DTR) and a minimum temperature to analyze the change in the air temperature inside the tunnel. In the case of the measured data, the minimum outside air temperature dropped below −8 °C and lasted for about 6 to 7 days from 8 February 2019. The air temperature change by the tunnel length (0 m, 120 m, 880 m, 1740 m, and 3270 m) from the entrance is shown in
Figure 6. The relationship between the minimum outside and inside air temperatures was analyzed. The minimum temperature at the tunnel entrance dropped to between −11.2 °C and −8.01 °C and gradually increased toward the tunnel midpoint. The DTR inside the tunnel decreased as the tunnel length increased from the entrance.
3.2.2. Prediction of Diurnal Temperature Range (DTR) Change by Tunnel Length
The measurement results of the correlation between the outside and inside air temperatures are shown in
Figure 7. Assuming the diurnal temperature range (DTR) of the outside air temperature was 100%, the DTR decreased to 58.2% at 120 m from the tunnel entrance, 38.2% at 880 m, 26.6% at 1740 m, and 19.7% at 3270 m, respectively.
The DTR reduction rate by the tunnel length is shown in
Figure 8. The reduction rate of the outside air temperature rapidly and nonlinearly decreased to 60% within 90 m from the tunnel entrance. The graph decreased gradually from 90 m to 3270 m. The DTR reduction rate of the tunnel length over 3270 m could be estimated from the trend line expressed in
Figure 8.
The air temperature inside the tunnel changes according to the outside air temperature and has its own DTR with each tunnel length. The cosine function was derived to express the air temperature variation inside a tunnel, as shown in
Figure 9. The periods of the daily minimum and maximum temperatures vary depending on the region. A day (24 h) was divided into the increasing section (
) and the decreasing section (
), as shown in Equation (2). For example, in Korea, the occurrence time for the daily minimum air temperature in the winter is 7:00, and the occurrence time for the maximum air temperature is 15:00. Therefore,
is 8 h,
is 16 h, the phase shift (
) of the increasing section is −1, and the phase shift (
) of the decreasing section is 15. As the tunnel length becomes longer, the inside air temperature decreases by the DTR reduction rate (
). The inside air temperature variation over time can be simplified through Equation (2).
Here, : Air temperature variation inside a tunnel; : Average air temperature inside a tunnel; : DTR reduction rate by each tunnel length; : Daily outside air temperature difference; : Time (Hours); : Period ( for increasing graph (), for decreasing graph (; : Phase shift when the period = (Min temp. Occurrence time—, when the period = (Max temp. Occurrence time).
Based on an average inside air temperature of −4.75 °C, the temperature variation can be simplified using the DTR inside each tunnel length, as shown in
Figure 10.
4. Freezing Prediction of Minimum Air Temperature by Tunnel Length
4.1. Verification of Numerical Analysis Model Reliability
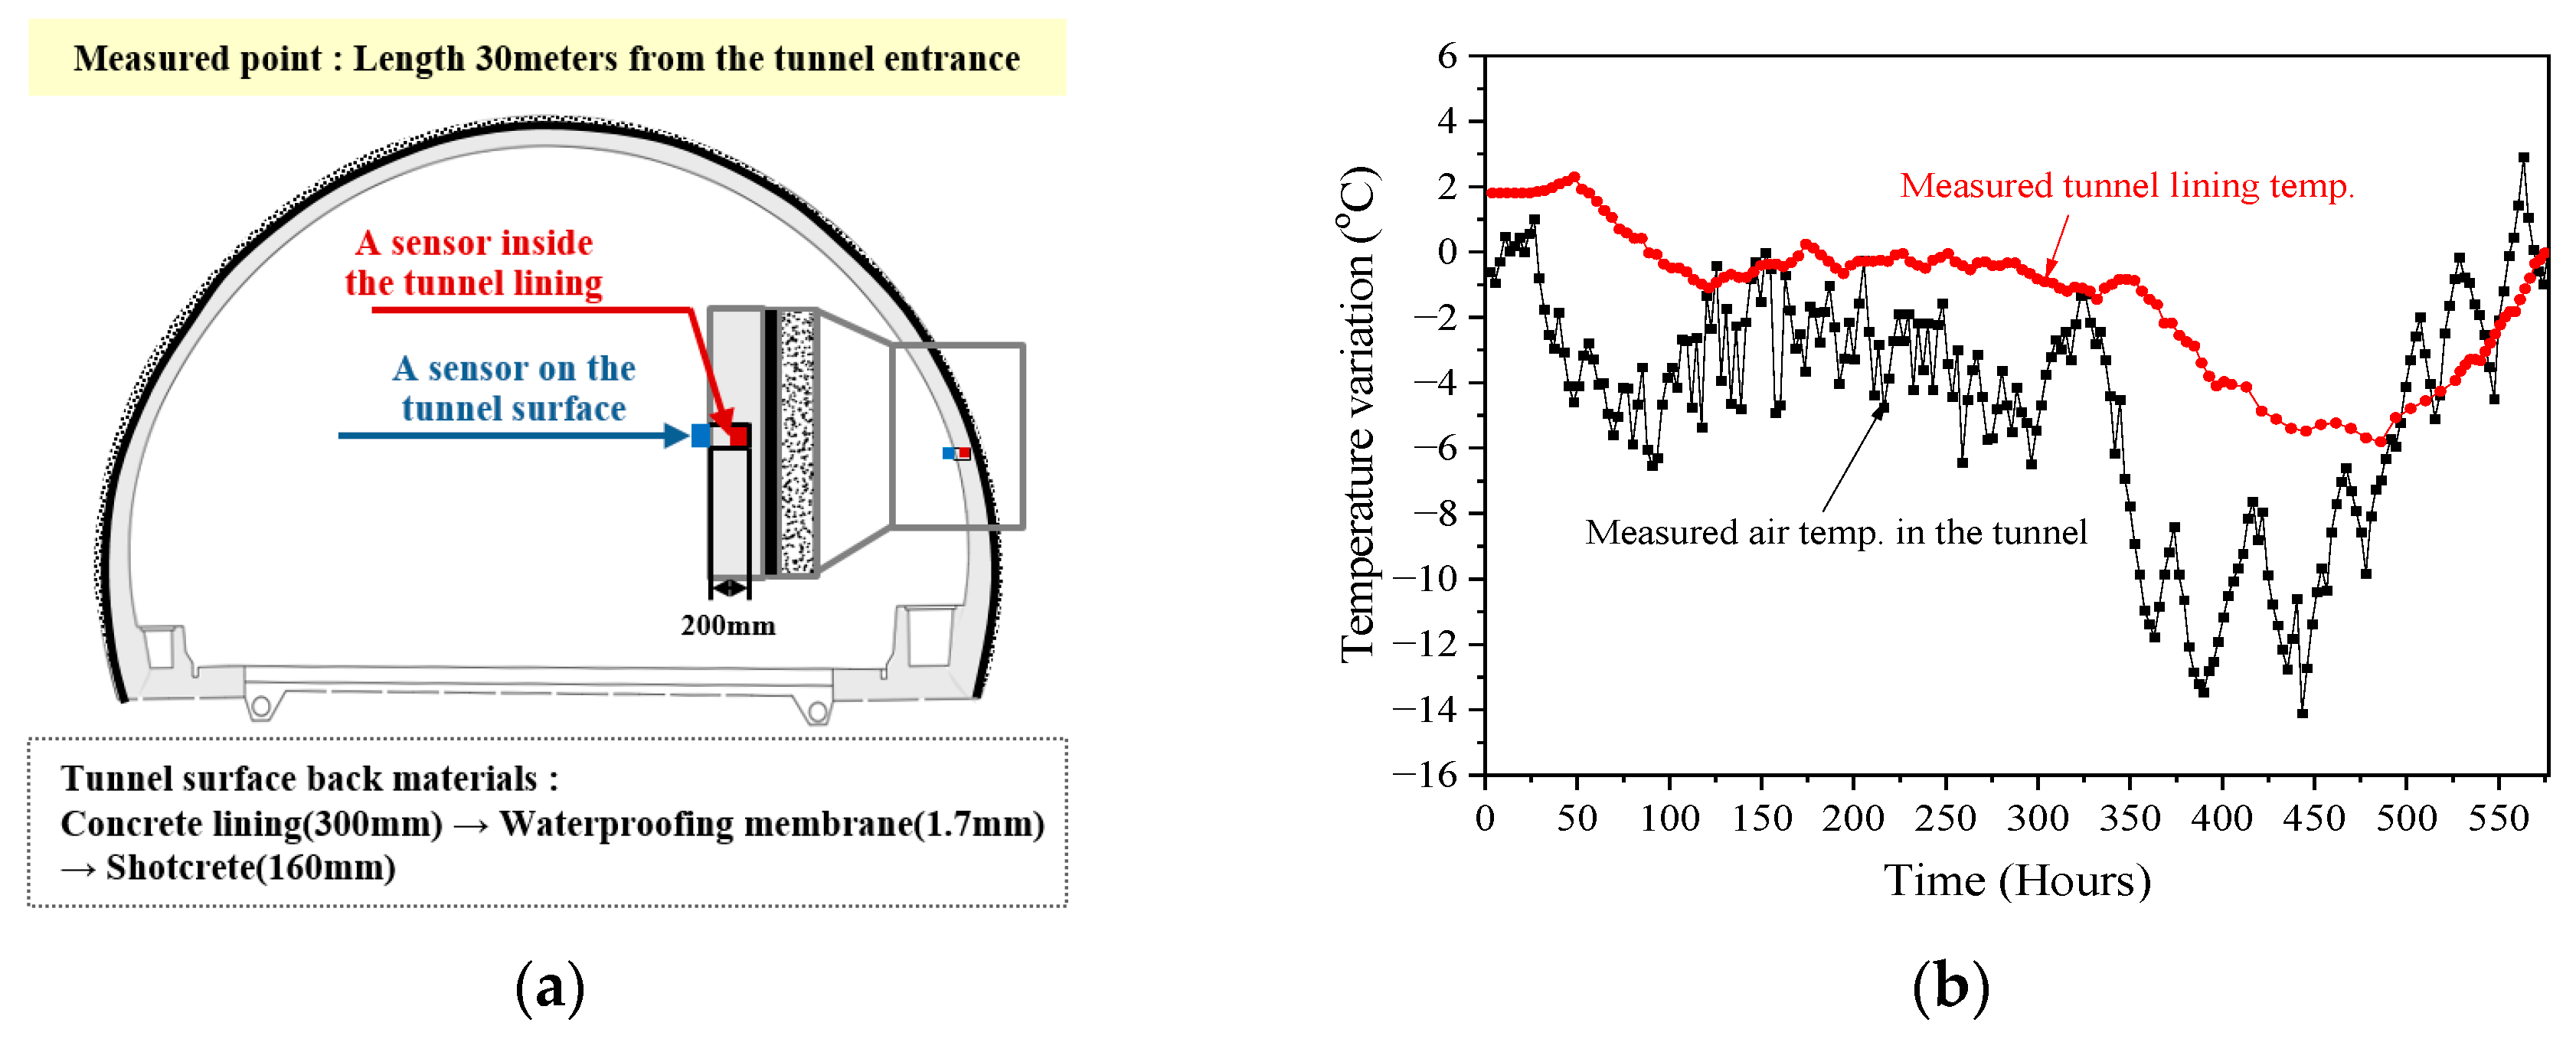
The measured railway tunnel in this study has been operating and drilling inside the concrete lining was restricted for safety reasons. The Hwaak Tunnel lining temperature (Kim et al. (2011)) data near the measured tunnel were used to verify the reliability of the heat transfer analysis model. Kim et al. (2011) measured the inside air and the concrete lining temperatures at a length of 30 m from the entrance of the Hwaak Tunnel to analyze the freezing damage [
18]. Since the waterproofing membrane could be torn by the thermometer installation, the concrete lining temperature was measured by installing a thermometer at a thickness of 200 mm from the concrete lining surface, as shown in
Figure 11a. The air and concrete lining temperature variations at a 30 m length from the tunnel entrance were measured for about 24 days from 15 January 2007. The air temperature inside the tunnel was 2.9 °C~−14.1 °C, and the concrete lining temperature was 2.3 °C~–5.8 °C, as shown in
Figure 11b.
The reliability of the numerical analysis was verified using the Hwaak Tunnel measurement data. The 2D model in this study was performed in LUSAS Thermal analysis (Finite Element Analysis). The number of elements was determined through the mesh sensitivity. The temperature inside the tunnel converged to a constant value when the elements were over 42,773. In the model of this study, the number of elements was set to 69,340 (size = 10 cm) to investigate a specific point from the tunnel surface.
The tunnel structures were modeled identically to the actual Hwaak Tunnel structures with a concrete lining (300 mm), a waterproofing membrane (1.7 mm), and shotcrete (160 mm) [
19]. The surrounding rock material is granite gneiss, which was applied to the numerical analysis conditions. The previous research and experimental data for the thermal properties of each construction material in the tunnel were used for the numerical analysis, as shown in
Table 2 [
18,
20,
21,
22,
23,
24].
The results showed that the back of the tunnel waterproofing membrane temperature
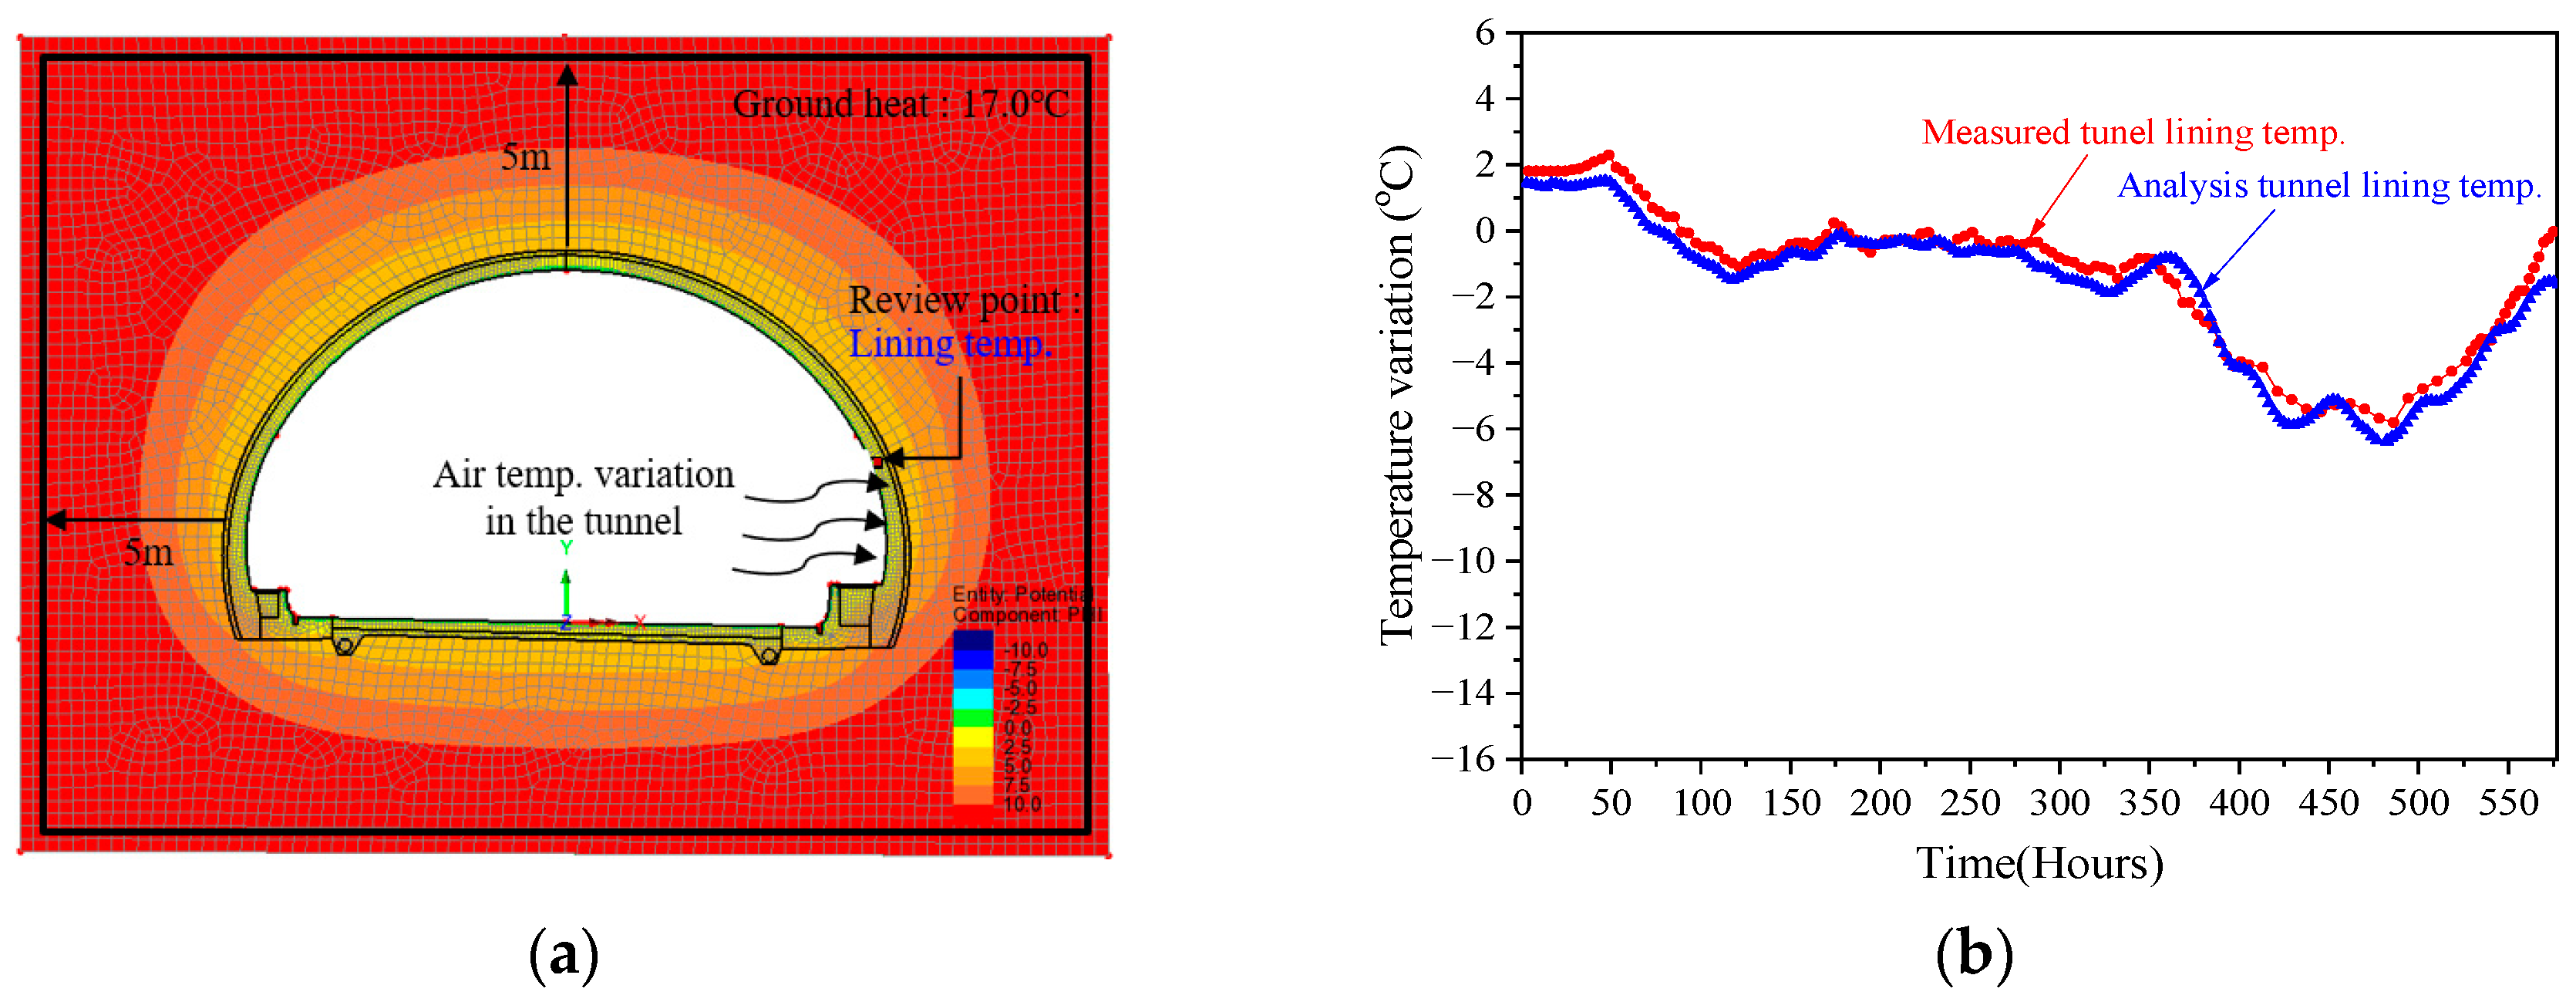
The boundary condition was set to a constant temperature since the modeled tunnel is surrounded by ground and is located deep enough to have constant geothermal conditions. An average ground temperature of 17.0 °C for the last 30 years at a depth of 5 m from the surface was set as a fixed temperature, as shown in
Figure 12a. The data measured for 576 h (
Figure 11b) were applied to the numerical model as the air temperature variation inside the tunnel at a 30 m length from the entrance.
The results showed that the range of the concrete lining temperature variation was 1.5 °C~–6.3 °C at a thickness of 200 mm from the lining surface, as shown in
Figure 12b. The numerical analysis results appeared similar to the field measurement values, and the error range was ±1.0 °C. Therefore, this model can be used to investigate temperature changes on the backside of the tunnel during the winter.
4.2. The Freezing Temperature at the Tunnel Entrance
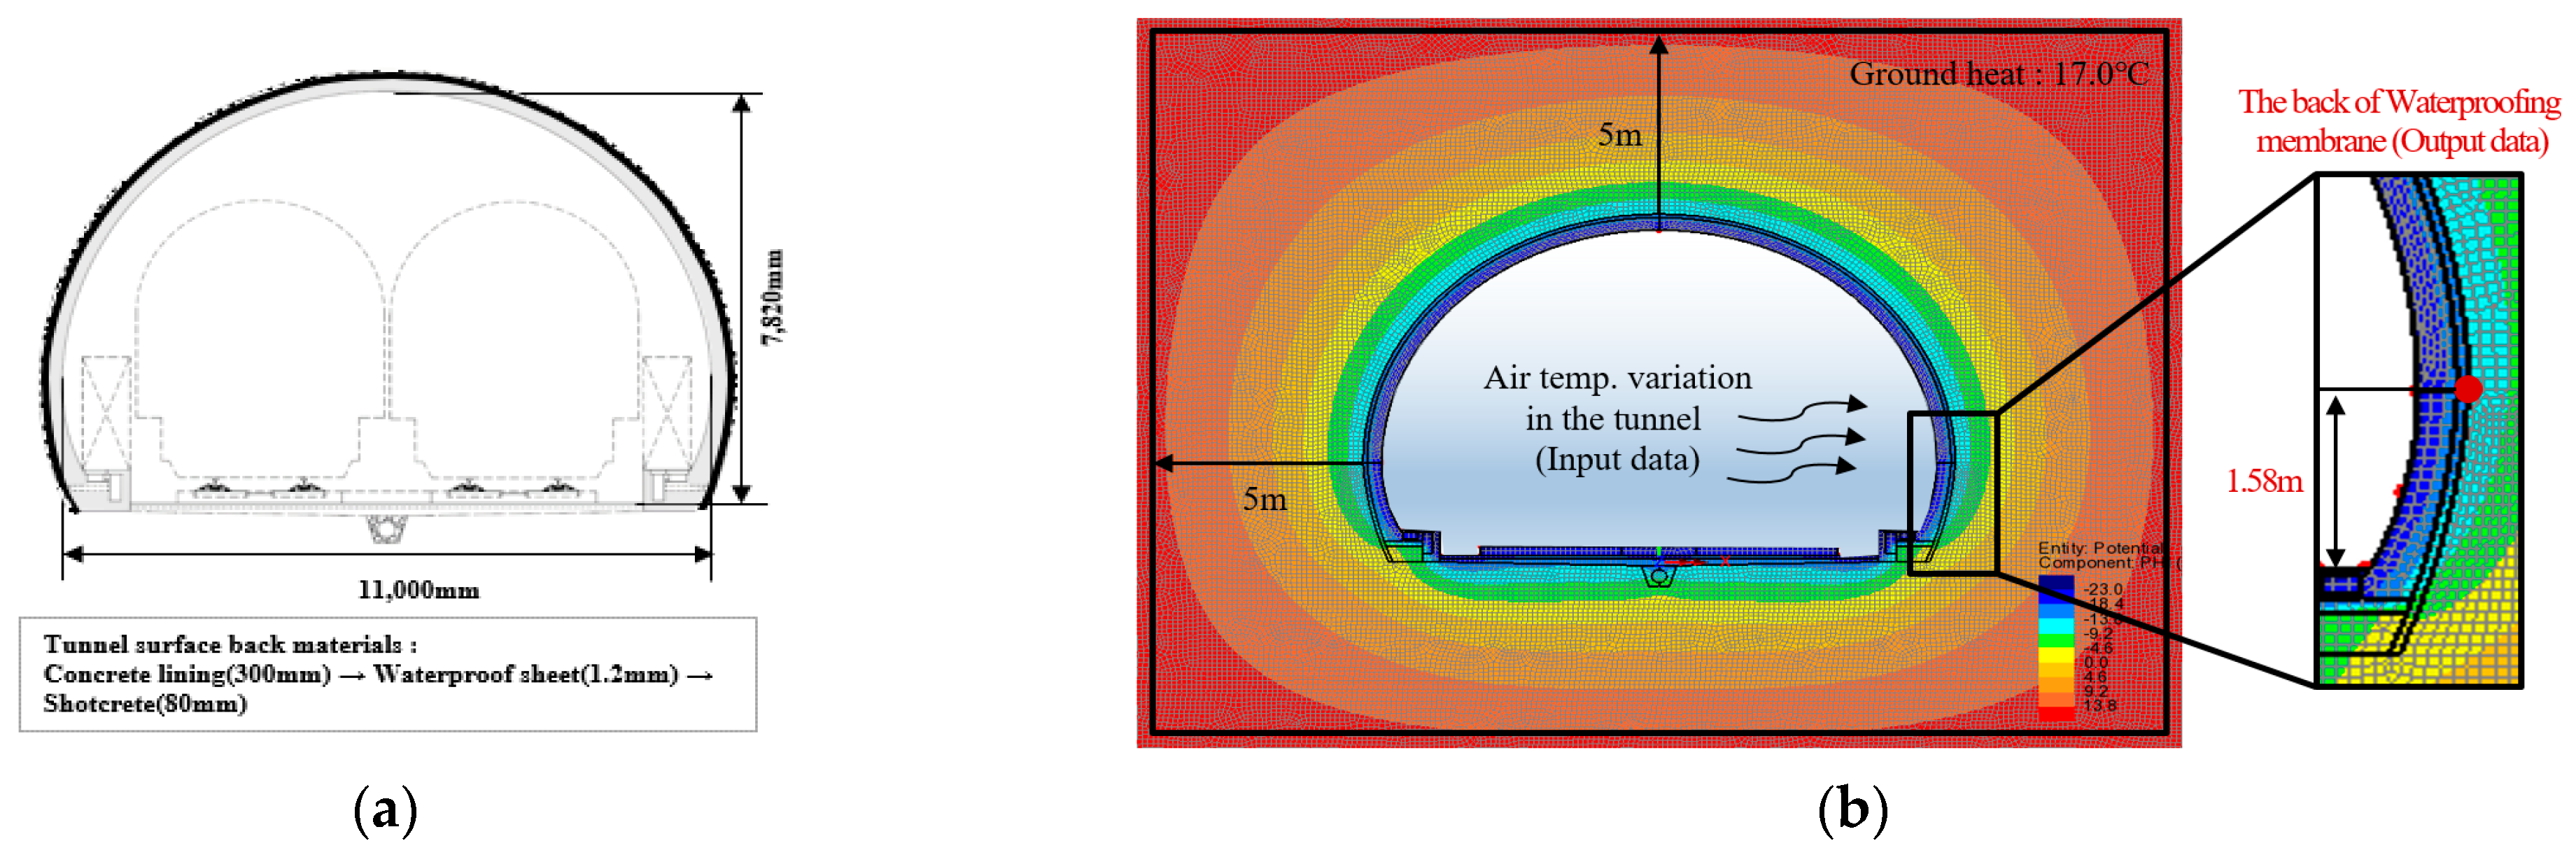
The standard Korean railway tunnel section and inside air temperature changes were applied to the numerical analysis to investigate the freezing conditions. The high-speed railway lines are mainly designed as double-track tunnels, and the inner cross-section is 11.0 m wide and 7.82 m high. When the mechanical properties of the rock surrounding the tunnel are normal, the tunnel structure is usually designed with a concrete lining (300 mm), a waterproofing membrane (1.2 mm), and shotcrete (80 mm), which are modeled as shown in
Figure 13a. The previous research and experimental data were applied to the thermal properties of the tunnel structures, which are summarized in
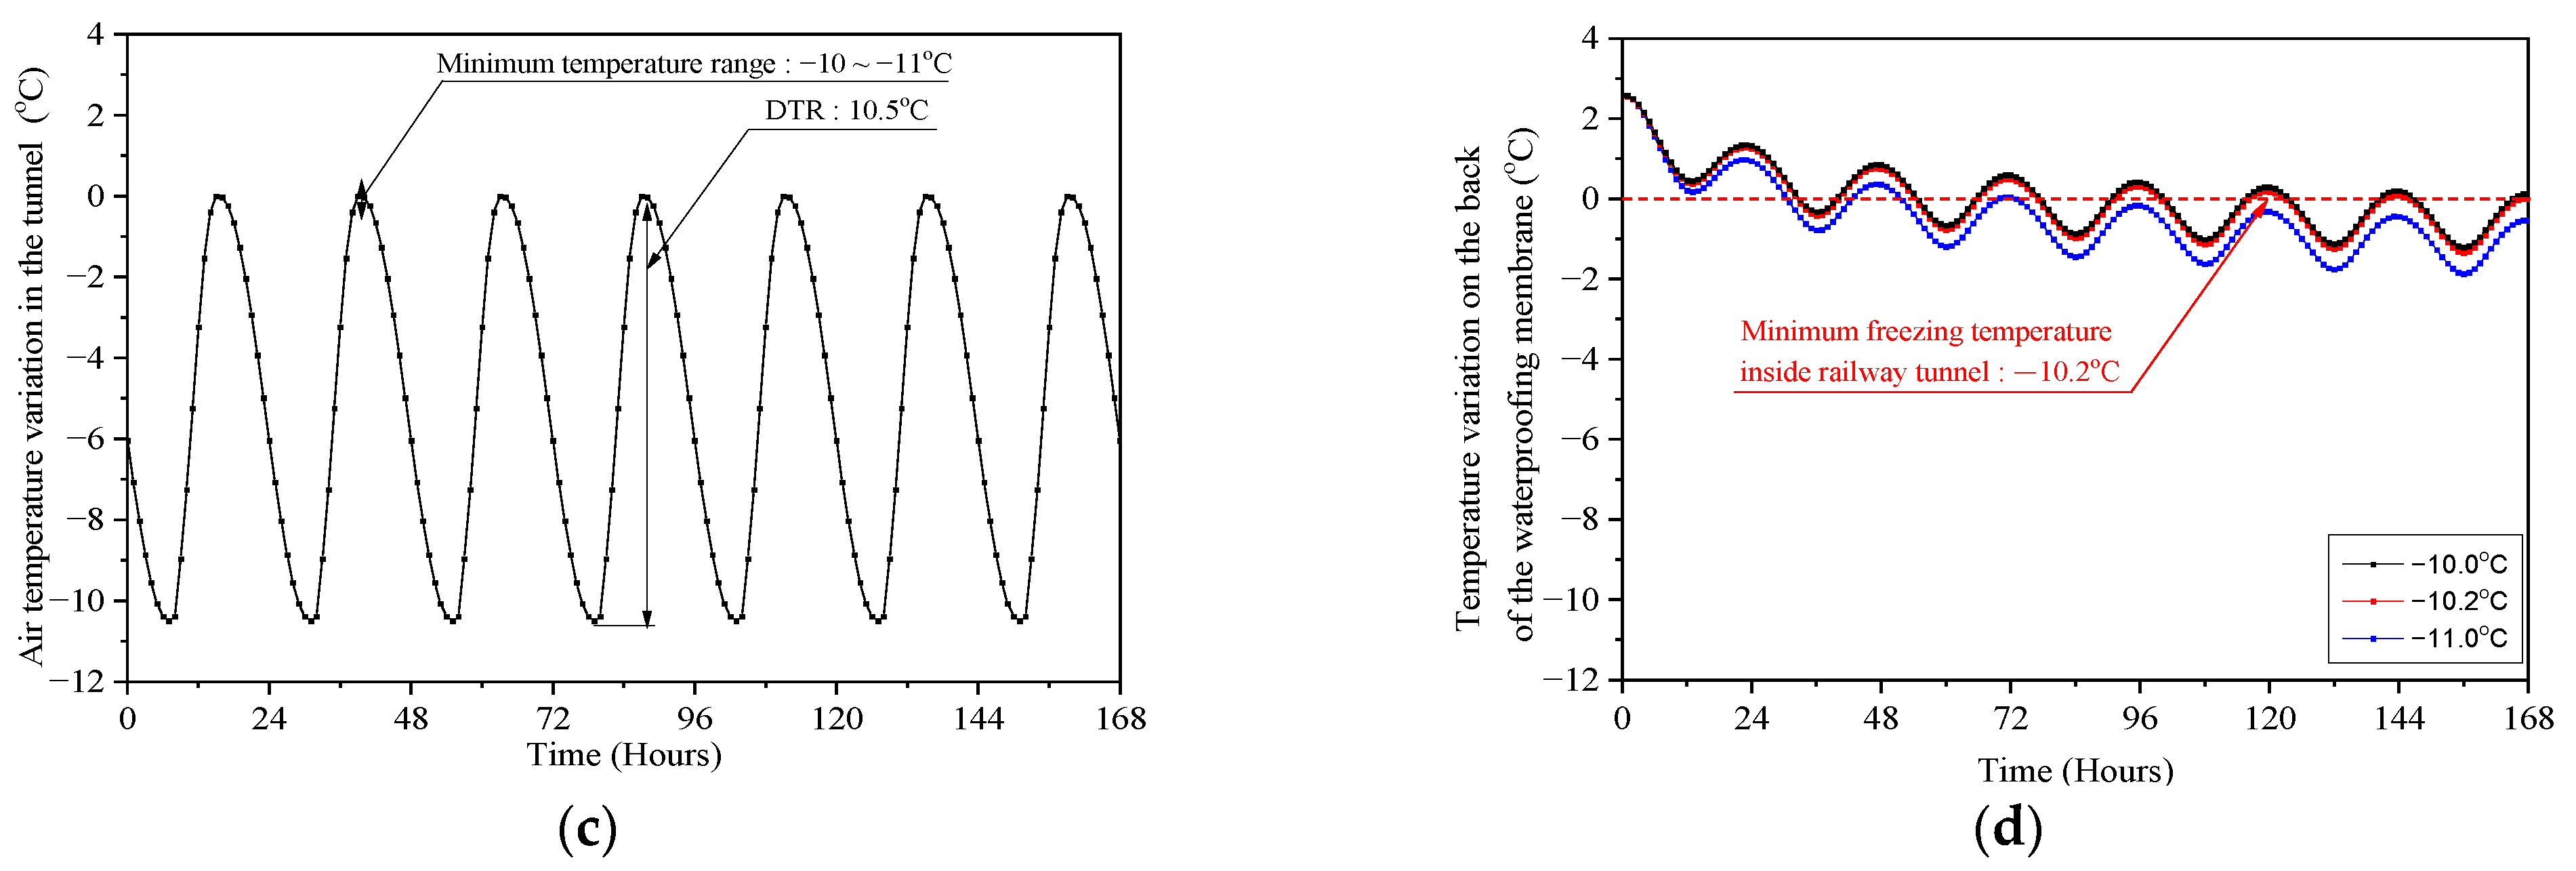
Table 2. The ground temperature at a depth of 5 m from the tunnel surface was set to 17.0 °C as a temperature boundary condition. A 24-h periodic function with the diurnal temperature range (DTR = 10.5 °C) was set for the temperature change inside the tunnel entrance. Assuming that the minimum temperature inside the tunnel lasts for 7 days, the temperature on the backside of the waterproofing membrane at the tunnel entrance was investigated.
The results showed that the back of the tunnel waterproofing membrane temperature underwent repeated freezing and thawing due to the diurnal temperature range (DTR). The freeze–thawing was repeated when the minimum inside air temperature was −10.0 °C at the tunnel entrance. When the minimum temperature dropped to −10.2 °C, the back of the waterproofing membrane froze constantly without thawing after 146 h. It took 74 h to freeze the groundwater at the back of the waterproof membrane when the minimum inside air temperature was −11.0 °C.
4.3. Relationship between DTR and Minimum Air Temperature by Tunnel Length
The DTR of the outside air temperature in the winter was 10.5 °C, and the DTR for each tunnel length was calculated by considering the DTR reduction rate, as shown in
Figure 8. The DTR was 5.0 °C at 500 m from the tunnel entrance, which decreased by 47.6%. The DTR at a tunnel length of 2500 m was 2.2 °C, and the DTR at a tunnel length of 5000 m was 1.6 °C, as shown in
Figure 14a. Complete freezing without thawing occurred after 147 h on the back of the waterproof membrane when the minimum inside air temperature was −7.0 °C for 7 days at a tunnel length of 500 m, as shown in
Figure 14b. The freezing conditions in the other locations are shown in
Figure 14c,d.
Figure 15 shows the minimum air temperature for constant freezing without thawing of the back of the waterproof membrane by each tunnel length. Ice formation on the back of the waterproof membrane occurred below the minimum inside air temperature of −10.2 °C at the tunnel entrance. The minimum air temperature increased as the tunnel length increased, and freezing occurred at the minimum tunnel inside air temperature of −4.9 °C for a tunnel length of 4500 m or more (more than 9 km in total length). The DTR in the tunnel decreased far from the tunnel entrance, and the minimum air temperature increased as the tunnel length increased. Since the range of the diurnal air temperature change inside the tunnel converged at a constant range from about 1500 m or more from the tunnel entrance, the minimum temperature for freezing was also shown to plateau.
5. Conclusions
The geothermal heat of mountain tunnels is transferred to the air inside the tunnel because the surrounding ground depth is high. However, the inside air temperature changes due to the outside air temperature under a low inlet wind speed. Therefore, the minimum air temperatures causing the freezing of the groundwater behind the waterproof membrane are presented along the tunnel length.
Field measurements were performed in the mountain railway tunnel to analyze the air temperature inside the tunnel according to the outside air temperature. The results show that the air temperature increased nonlinearly far from the tunnel entrance. Furthermore, the change in the diurnal temperature range (DTR) inside the tunnel rapidly decreased to 60% from the entrance to 90 m, and the graph decreased gradually from 90 m to 3270 m. The daily cycle equation of the air temperature variation was derived using the cosine function, and air temperature variation by each tunnel length can be predicted using the outside temperature change.
Thermal conduction analysis inside the tunnel was performed using a FEM program, and the freezing on the back of the waterproofing membrane within the typical drainage tunnel was investigated. Ice formation on the back of the waterproof membrane occurred below the minimum inside air temperature of −10.2 °C at the tunnel entrance. The minimum air temperature increased as the tunnel length increased, and freezing occurred at the minimum tunnel inside air temperature of −4.9 °C for a tunnel length of 4500 m or more.
The freezing inside a tunnel can be predicted by measuring the inside air using these results, and the freezing damage section can be determined.
Author Contributions
Conceptualization and methodology, S.L. and M.S.; software, S.L. and J.K.; validation, S.P. and J.K.; investigation, S.L., S.P. and J.K.; data curation, S.L.; writing—original draft preparation, S.L.; writing—review and editing, S.P. and K.-H.C.; supervision, M.S. and K.-H.C.; project administration, K.-H.C. All authors have read and agreed to the published version of the manuscript.
Funding
This study was financially supported by Seoul National University of Science and Technology.
Institutional Review Board Statement
Not applicable.
Informed Consent Statement
Not applicable.
Data Availability Statement
Data is contained within the article.
Conflicts of Interest
The authors declare no conflict of interest.
References
- Hokkaido Development Bureau. Road Design Procedure, I-4-28; Hokkaido Development Bureau: Sapporo, Japan, 2018.
- Vegvesen Vegdirektoratet, S. Road Tunnels: Standard [Manual 021E]; Norwegian Public Roads Administration, Road Tunnels; Statens Vegvesen: Oslo, Norway, 2004; pp. 11–105. ISBN 82-7207-540-7.
- Li, W.B.; Wu, Y.; Fu, H.; Zhang, J. Long-term continuous in-situ monitoring of tunnel lining surface temperature in cold region and its application. Int. J. Heat Technol. 2015, 33, 39–44. [Google Scholar] [CrossRef]
- Son, H.-S.; Jun, K.-J.; Yune, C.-Y. Numerical Analysis of Frost Depth behind the Lining of Road Tunnel in Gangwon Province. J. Korean GEO-Environ. Soc. 2017, 18, 15–23. [Google Scholar]
- Zhao, P.; Chen, J.; Luo, Y.; Li, Y.; Chen, L.; Wang, C.; Hu, T. Field measurement of air temperature in a cold region tunnel in northeast China. Cold Reg. Sci. Technol. 2020, 171, 102957. [Google Scholar] [CrossRef]
- Yoonsik, P.; Sehee, L.; KookHwan, C. Temperature Distribution of Railway Tunnels in Winter. J. Korean Soc. Hazard Mitig. 2021, 21, 199–205. [Google Scholar]
- Wu, Y.; Xu, P.; Li, W.; Wang, Z.; Cai, Z.; Shao, S. Distribution rules and key features for the lining surface temperature of road tunnels in cold regions. Cold Reg. Sci. Technol. 2020, 172, 102979. [Google Scholar] [CrossRef]
- Monteith, J.L.; Unsworth, M.H.; Webb, A. Principles of environmental physics. Q. J. R. Meteorol. Soc. 1994, 120, 1699. [Google Scholar] [CrossRef]
- Zhang, G.; Xia, C.; Sun, M.; Zou, Y.; Xiao, S. A new model and analytical solution for the heat conduction of tunnel lining ground heat exchangers. Cold Reg. Sci. Technol. 2013, 88, 59–66. [Google Scholar] [CrossRef]
- Williams, G.P.; Gold, L.W. Ground Temperatures; Canadian Building Digest, No. CBD-180; National Research Council of Canada: Ottawa, ON, Canada, 1976. [CrossRef]
- Kim, J.; Kwon, O.-I.; Baek, Y.; Kim, C.-Y. A Study on the Variation of Ground Safety Factor by Earthworks. J. Eng. Geol. 2014, 24, 333–341. [Google Scholar] [CrossRef]
- Zhao, P.; Chen, J.; Luo, Y.; Chen, L.; Li, Y.; Wang, C. Investigation of the insulation effect of thermal insulation layer in the seasonally frozen region tunnel: A case study in the zuomutai tunnel, China. Adv. Civ. Eng. 2019, 2019, 4978359. [Google Scholar] [CrossRef]
- Authority, Korea Rail Network. KR C-12060: Drainage and Waterproofing; Korea Rail Network Authority: Daejeon, Republic of Korea, 2022. [Google Scholar]
- Cengel, R.A. Introduction to Thermodynamics and Heat Transfer; McGraw-Hill: New York, NY, USA, 2008. [Google Scholar]
- Andersland, O.B.; Ladanyi, B. Frozen Ground Engineering; John Wiley & Sons: Hoboken, NJ, USA, 2003. [Google Scholar]
- Administration, K.M. Open MET Data Portal. Available online: https://data.kma.go.kr/resources/html/en/aowdp.html (accessed on 14 January 2022).
- Ahrens, C.D. Meteorology Today: An Introduction to Weather, Climate, and the Environment; Cengage Learning Canada Inc.: Toronto, ON, Canada, 2015. [Google Scholar]
- Kim, D.-Y.; Lee, H.-S.; Sim, B.-K. A study on the design of tunnel lining insulation based on measurement of temperature in tunnel. J. Korean Tunn. Undergr. Space Assoc. 2011, 13, 319–345. [Google Scholar]
- Authority, Korea Rail Network. KR C-12040: Concrete Lining; Korea Rail Network Authority: Daejeon, Republic of Korea, 2021. [Google Scholar]
- Park, J.; Kim, H.; Lee, Y.M.; Song, M.-Y. A study on thermal conductivities of rocks in Korea. In Proceedings of the Academic Conference of the Korean Society for New and Renewable Energy, Jeju, Republic of Korea, 22 June 2007; pp. 449–451. [Google Scholar]
- Lee, J.; Choi, K. Analytical Studies on Thermal Properties and Heat Transfer in Concrete at High Temperatures. In Proceedings of the Korea Concrete Institute Annual Spring Conference, Daegu, Republic of Korea, 11 October 2007; pp. 195–198. [Google Scholar]
- Singh, R.M.; Bouazza, A. Thermal conductivity of geosynthetics. Geotext. Geomembr. 2013, 39, 1–8. [Google Scholar] [CrossRef]
- Misra, R.; Bansal, V.; Agrawal, G.D.; Mathur, J.; Aseri, T. Transient analysis based determination of derating factor for Earth Air Tunnel Heat Exchanger in winter. Energy Build. 2013, 58, 76–85. [Google Scholar] [CrossRef]
- Harvey, P.D. Engineering Properties of Steel; ASM international: Almere, The Netherlands, 1982. [Google Scholar]
- Laboratory, M.H.T. Fluid Properties Calculator. Available online: http://www.mhtl.uwaterloo.ca/old/onlinetools/airprop/airprop.html (accessed on 3 October 2021).
| Disclaimer/Publisher’s Note: The statements, opinions and data contained in all publications are solely those of the individual author(s) and contributor(s) and not of MDPI and/or the editor(s). MDPI and/or the editor(s) disclaim responsibility for any injury to people or property resulting from any ideas, methods, instructions or products referred to in the content. |
© 2023 by the authors. Licensee MDPI, Basel, Switzerland. This article is an open access article distributed under the terms and conditions of the Creative Commons Attribution (CC BY) license (https://creativecommons.org/licenses/by/4.0/).


