1. Introduction
The quality of the railway infrastructure is fundamentally important for infrastructure companies as well as the customers and passengers. Infrastructure companies are responsible for keeping their infrastructure assets in good, reliable, and serviceable condition. For this purpose, German infrastructure companies receive funding for the replacement of infrastructure from the German federal government. This funding is regulated in a contract between the government and infrastructure companies, the so-called Leistungs- und Finanzierungsvereinbarung (LuFV) [
1]. In addition to replacement, infrastructure companies also perform maintenance to preserve and improve the condition of assets.
Most railway infrastructure companies receive financial support from public funds. Expenditure per person is particularly high in Luxembourg [
2] and Switzerland [
3], for example. In Switzerland, the financing and expansion of the railway infrastructure are provided by the Railway Infrastructure Fund and the Strategic Railway Infrastructure Development Program. The federal government uses the funds to finance the railway infrastructure costs. This includes the operation, maintenance, and expansion of the railway infrastructure [
4]. The infrastructure assets of the railway stations are also part of the railway infrastructure in Switzerland according to Article 62, Paragraph 1 of the Railway regulations in Switzerland [
5].
To be able to measure the quality of the infrastructural assets, quality indicators in Germany are defined in the LuFV. Quality indicators are used to ensure reasonable financial input and good infrastructure conditions. Different quality indicators are used for various railway infrastructure assets. For track infrastructure, several indicators are used to describe the condition of the infrastructure [
6]. In [
7], the quality indicators for the assessment of station infrastructure are described.
However, since the correlation between financial funding and infrastructure quality was previously unknown, railway infrastructure companies were asked to scientifically establish a cause–effect relationship in the newly adopted LuFV III [
7]. This cause–effect relationship should be bidirectional and transparent in order to determine future target values and budgets for respective quality indicators. A bidirectional relationship means that both the infrastructure quality expected, using a fixed financial budget for replacement and maintenance measures, and the budget required for a specified target quality can be calculated. To determine the expected quality for a certain budget, the overall financial budget must be given as input. More specifically, the total budget must be distributed among the different infrastructure assets. Various scenarios can be generated for budget allocation to infrastructure assets. In addition to budget allocation, the prioritization of the measures required is also an elementary part of the cause–effect relationship. The cause–effect relationship can be used to analyze different strategies for budget allocation and the prioritization of measures.
To establish a cause–effect relationship between financial budget and infrastructure quality, both degradation functions and the effects of maintenance and replacement measures must be defined. In this paper, the cause–effect-relationship for the railway station infrastructure assets of DB Station&Service AG—the German infrastructure operator for railway stations—is discussed. Station infrastructure includes assets and facilities at passenger stations. Track facilities that serve railway operations are not part of the station infrastructure and will not be considered. This paper aims to describe different budget allocation and prioritization strategies and to analyze their effect on measured quality indicators.
An elementary component of the development of a cause–effect relationship as described, alongside replacement and maintenance with their effects and costs, is the degradation of investigated infrastructure. Models reproducing degradation have been widely studied in different contexts. Prakash et al. [
8] classify degradation models for different kinds of civil infrastructure into four basic categories and provide a review of their particular use cases. They distinguish physics-based approaches, which rely on mathematical models to calculate the mechanisms leading to degradation; knowledge-based models in cases when complexity is so high that expert knowledge must be incorporated; data-driven models; and hybrid models, as a combination of the ones previously mentioned.
In connection with railway infrastructure, there are several examples of degradation or entire life cycle models of the different model types, which are applied in different contexts. The German infrastructure manager DB Netz AG, which analyses the cause–effect relationship as well, is currently considering the degradation of its infrastructure assets via various approaches. Jacke et al. [
9] use a prediction approach to describe degradation for bridges and tracks, whereas switches, interlockings, and railway crossings are each modelled using a risk approach. In this context, specific quality indicators of different infrastructural assets are considered. In [
10], Emunds et al. describe the prediction of failures in interlockings in Germany using regressions.
Sadri et al. [
11] use a frequency-domain approach to assess the influence of track stiffness on their degradation. Khajehei et al. [
12] implement an artificial neural network to model track degradation and to identify the key factors that have the heaviest impact on track degradation.
In [
13], degradation models for the different infrastructure elements relevant to line sections are developed and used to optimize maintenance strategies. However, the focus of this paper is on station infrastructure and not on line infrastructure. Simandl [
14] investigates the parameters that influence the actual service life of railway bridges, taking into account the varying degradation of different materials.
Only a few publications have dealt with the degradation of station infrastructure so far. Maus et al. [
15] researched the modeling of degradation functions for station infrastructure and described a data-based modeling approach in detail. The focus is on data evaluation to separate aging effects from maintenance influence.
Also, concerning different prioritization approaches, there are studies in which methods for the determination of the most effective strategies are developed. In [
16], factors considered in the prioritization of maintenance measures and existing methods for the prioritization are reviewed. The authors state that an analytical hierarchy process, the use of priority criteria or matrices, and failure mode and effect analysis are the most commonly applied methods to schedule maintenance. Harnly [
17], for example, describes how equipment inspection can be integrated into a procedure with the assessment of failure consequences in operation to evaluate the total risk for the equipment used. Similarly, Kumar and Chaturvedi [
18] investigate the risk associated with failure modes of equipment. They not only use historical data but also predicted data and compare the resulting maintenance order to the existing maintenance schedule with an example of a gearbox in a steel plant.
However, the modeling of complete life cycles for infrastructure depends on a multitude of infrastructure characteristics and quality indicators. These characteristics often strongly vary, depending on what kind of element is considered. This is why it is difficult to find a general model that applies to a variety of different infrastructure types and to transfer existing models to railway infrastructure assets. In addition, the assessment of the most effective maintenance strategy is dependent on external and problem-specific factors, such as feasible maintenance strategies in the investigated scenario or available data. Furthermore, there are only a few applications in which degradation or life cycle models are matched to entrepreneurial specifics, such as different prioritization and budget allocation approaches. In most cases, only one or two of the factors mentioned are considered.
To our best knowledge, no scientific relationship between available financial funds and expected infrastructure quality has yet been identified for station infrastructure. This correlation is elaborated upon in this paper. To this end, this paper first describes an approach to mapping the degradation of station infrastructure based on Maus et al. [
15]. This deterministic data-driven model is then used for an in-depth analysis of the impact of different strategies on the expected quality of infrastructure. For this purpose, the quality measurement of station infrastructure is first described, and then different maintenance and replacement strategies, in terms of different prioritization and budget allocation approaches, are compared with each other.
2. Method to Measure Railway Station Infrastructure Quality
At DB Station&Service AG, and thus for the infrastructure of railway station assets, one of the quality indicators currently used is the assessment of asset quality (“Bewertung Anlagenqualität” (BAQ)). The BAQ is a quality indicator that describes the quality of the infrastructure using a nationwide grade. To yield this grade, single infrastructure assets are first graded and then are aggregated for all assets in the DB Station&Service AG network. The scale of the grade ranges from 1 (best possible quality) to 6 (poorest possible quality). The following section describes the basic idea of the method applied for the determination of the BAQ grade. The details of the determination of the BAQ grade, however, are described in the LuFV III [
7].
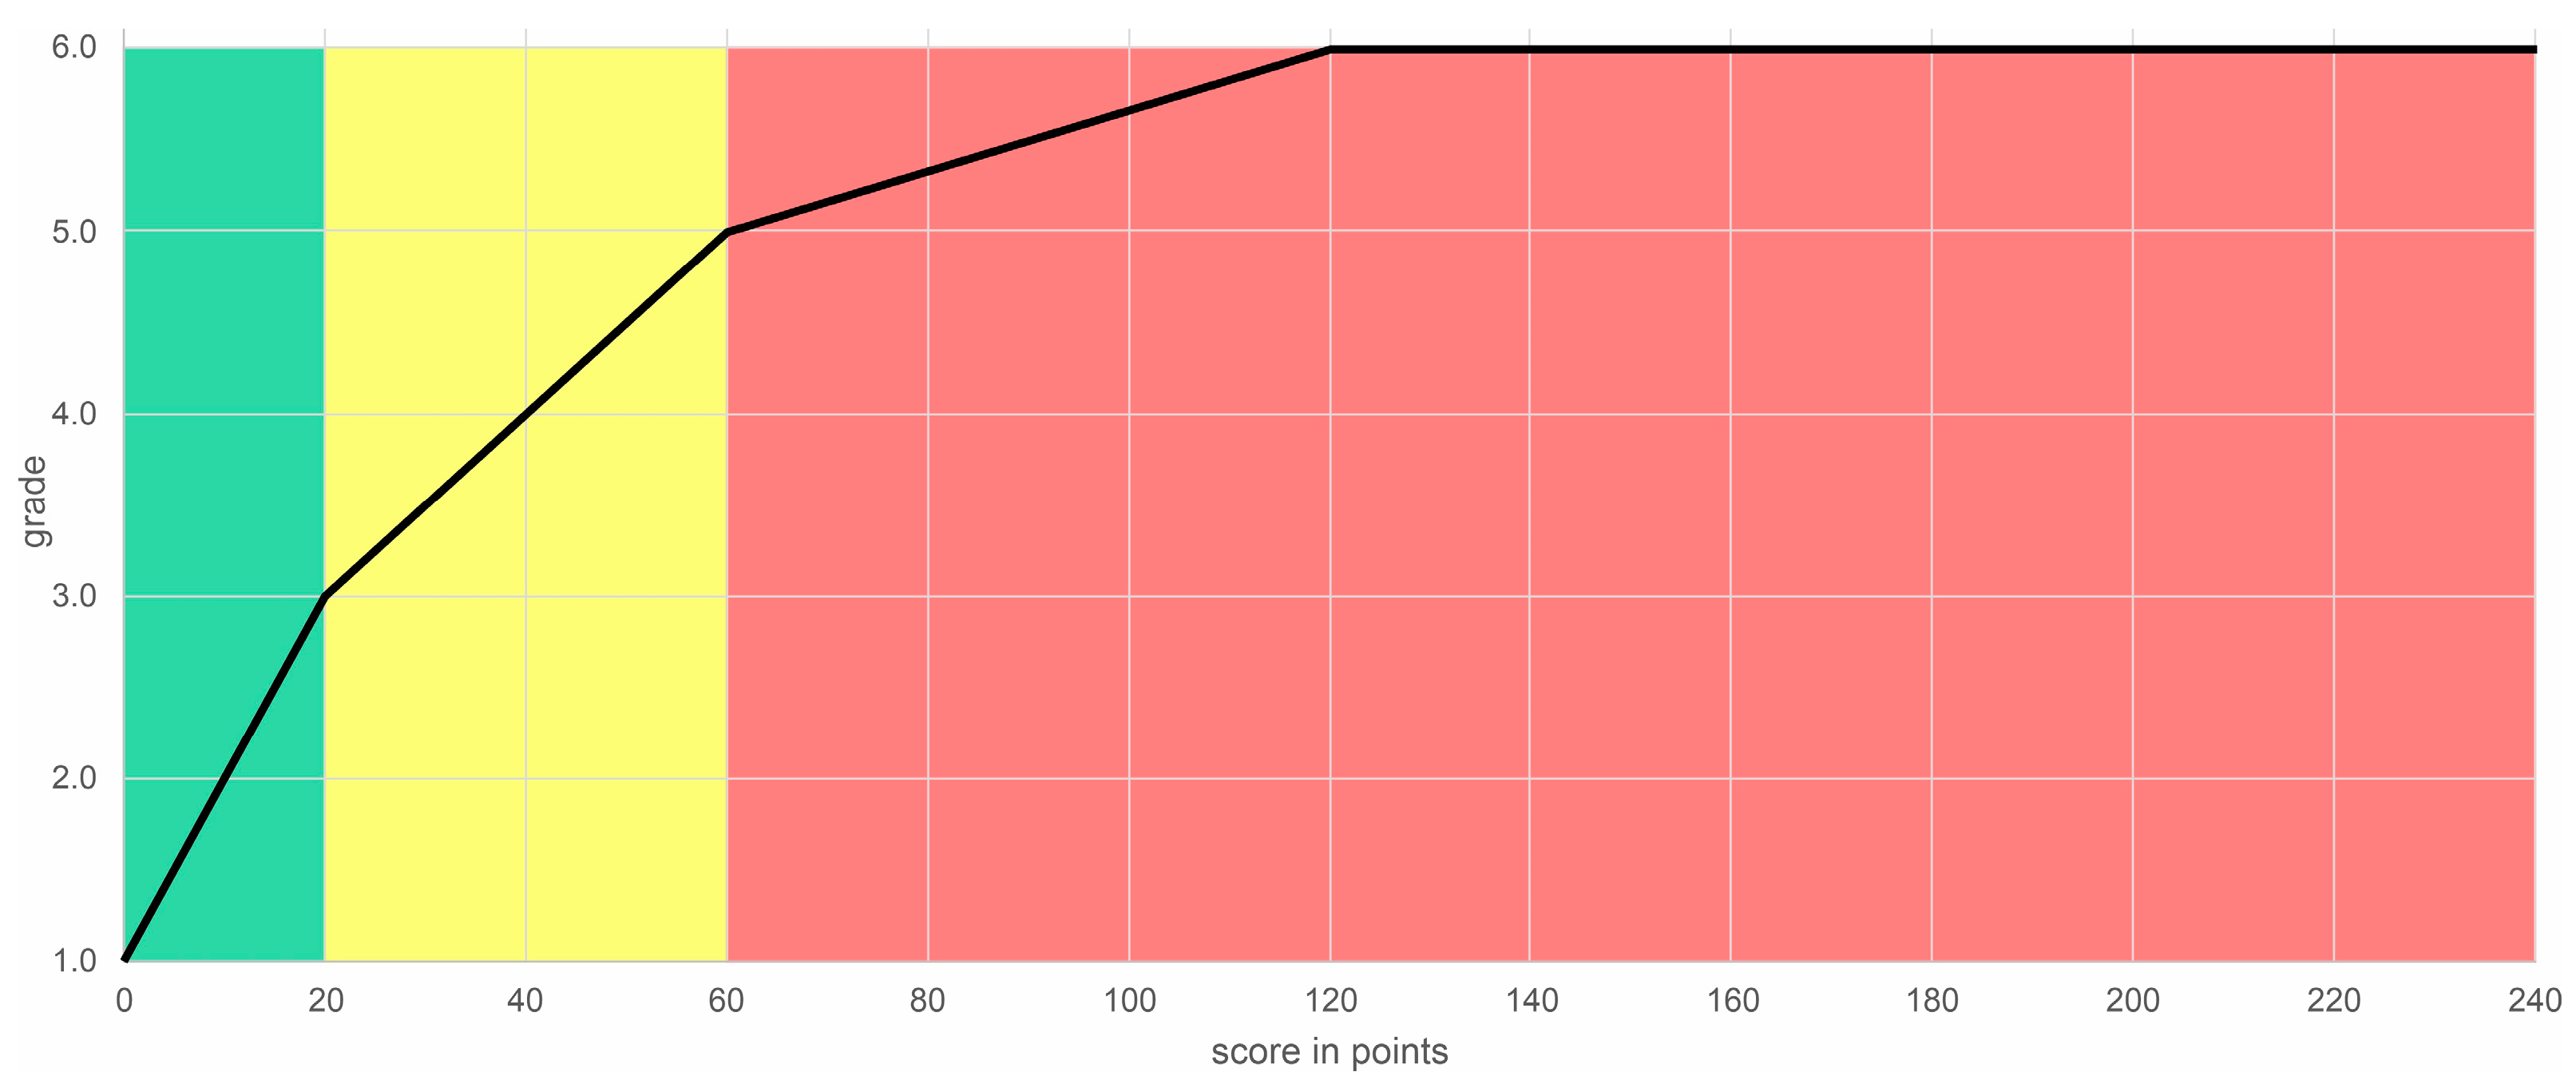
For BAQ grade determination, individual assets (e.g., a platform) are first assessed by employees of DB Station&Service AG. The abrasion and damage to the individual assets observed are converted into a score. For this purpose, different reference damages and weights of the damages on the components of the assets are used, which are individual for each asset. After weighting the different components of an asset, the asset receives a score. This score can then be converted into a grade. The score ranges from 0–240 points, with zero points representing the best possible rating. In
Figure 1, the correlation between the score and the grade of an asset is depicted. In the green area, the infrastructure assets are in very good to good condition. In the yellow area, the quality is still satisfactory to sufficient, while in the red area the quality is poor to unsatisfactory.
After the determination of the grade for each individual asset, a grade for the entire station is determined from the grades of the individual assets in a station. For this purpose, asset classes are formed. An asset class consists of all assets of the same type. The grade for each asset class in the station is first calculated as the arithmetic mean of all individual assets of this asset class. Some of these asset classes are further combined into asset groups. The “station buildings” and the “platform equipment” form such asset groups and are then divided into different asset classes, as shown in
Table 1. Other asset classes form their asset group. The process for calculating the grades is specified in LuFV III [
7] and is described in the following Equations (1)–(4).
The grades for the asset groups are added up to one group grade according to their weighting (Equation (1) [
7]). Here, the factor
q indicates the weighting within an asset group:
Not every asset group includes multiple classes. Platforms, for example, form their own asset group and are hence weighted as 100%. The grades of the asset groups are then aggregated according to their weighting, and the grade of a station is determined.
Table 1 shows all relevant infrastructure classes, asset groups, and their weightings for the aggregation of the BAQ grade of one station. The grade for a station is calculated according to Equation (2) [
7]. If an asset class is not present at a railway station, the remaining weightings must each be reweighed according to their current weighting so that the sum of the weightings still amounts to 100%. The remaining percentages are distributed among the other classes in proportional shares according to their previous weighting. Thus, if an asset class is missing, the platforms, for example, receive 30% of the missing shares of the weighting. The factor
p indicates this weighting within the station.
To calculate the nationwide grade in the next step, all of the stations are assigned to groups according to the volume of passengers using this station. For each passenger volume group, the mean of the grades of all stations assigned to this group is formed (see Equation (3) [
7]). These mean values are weighted with a factor for the corresponding group (see
Table 2).
The sum of these weighted averages results in a nationwide BAQ grade. The equation for calculating the nationwide BAQ grade is given in Equation (4) [
7].
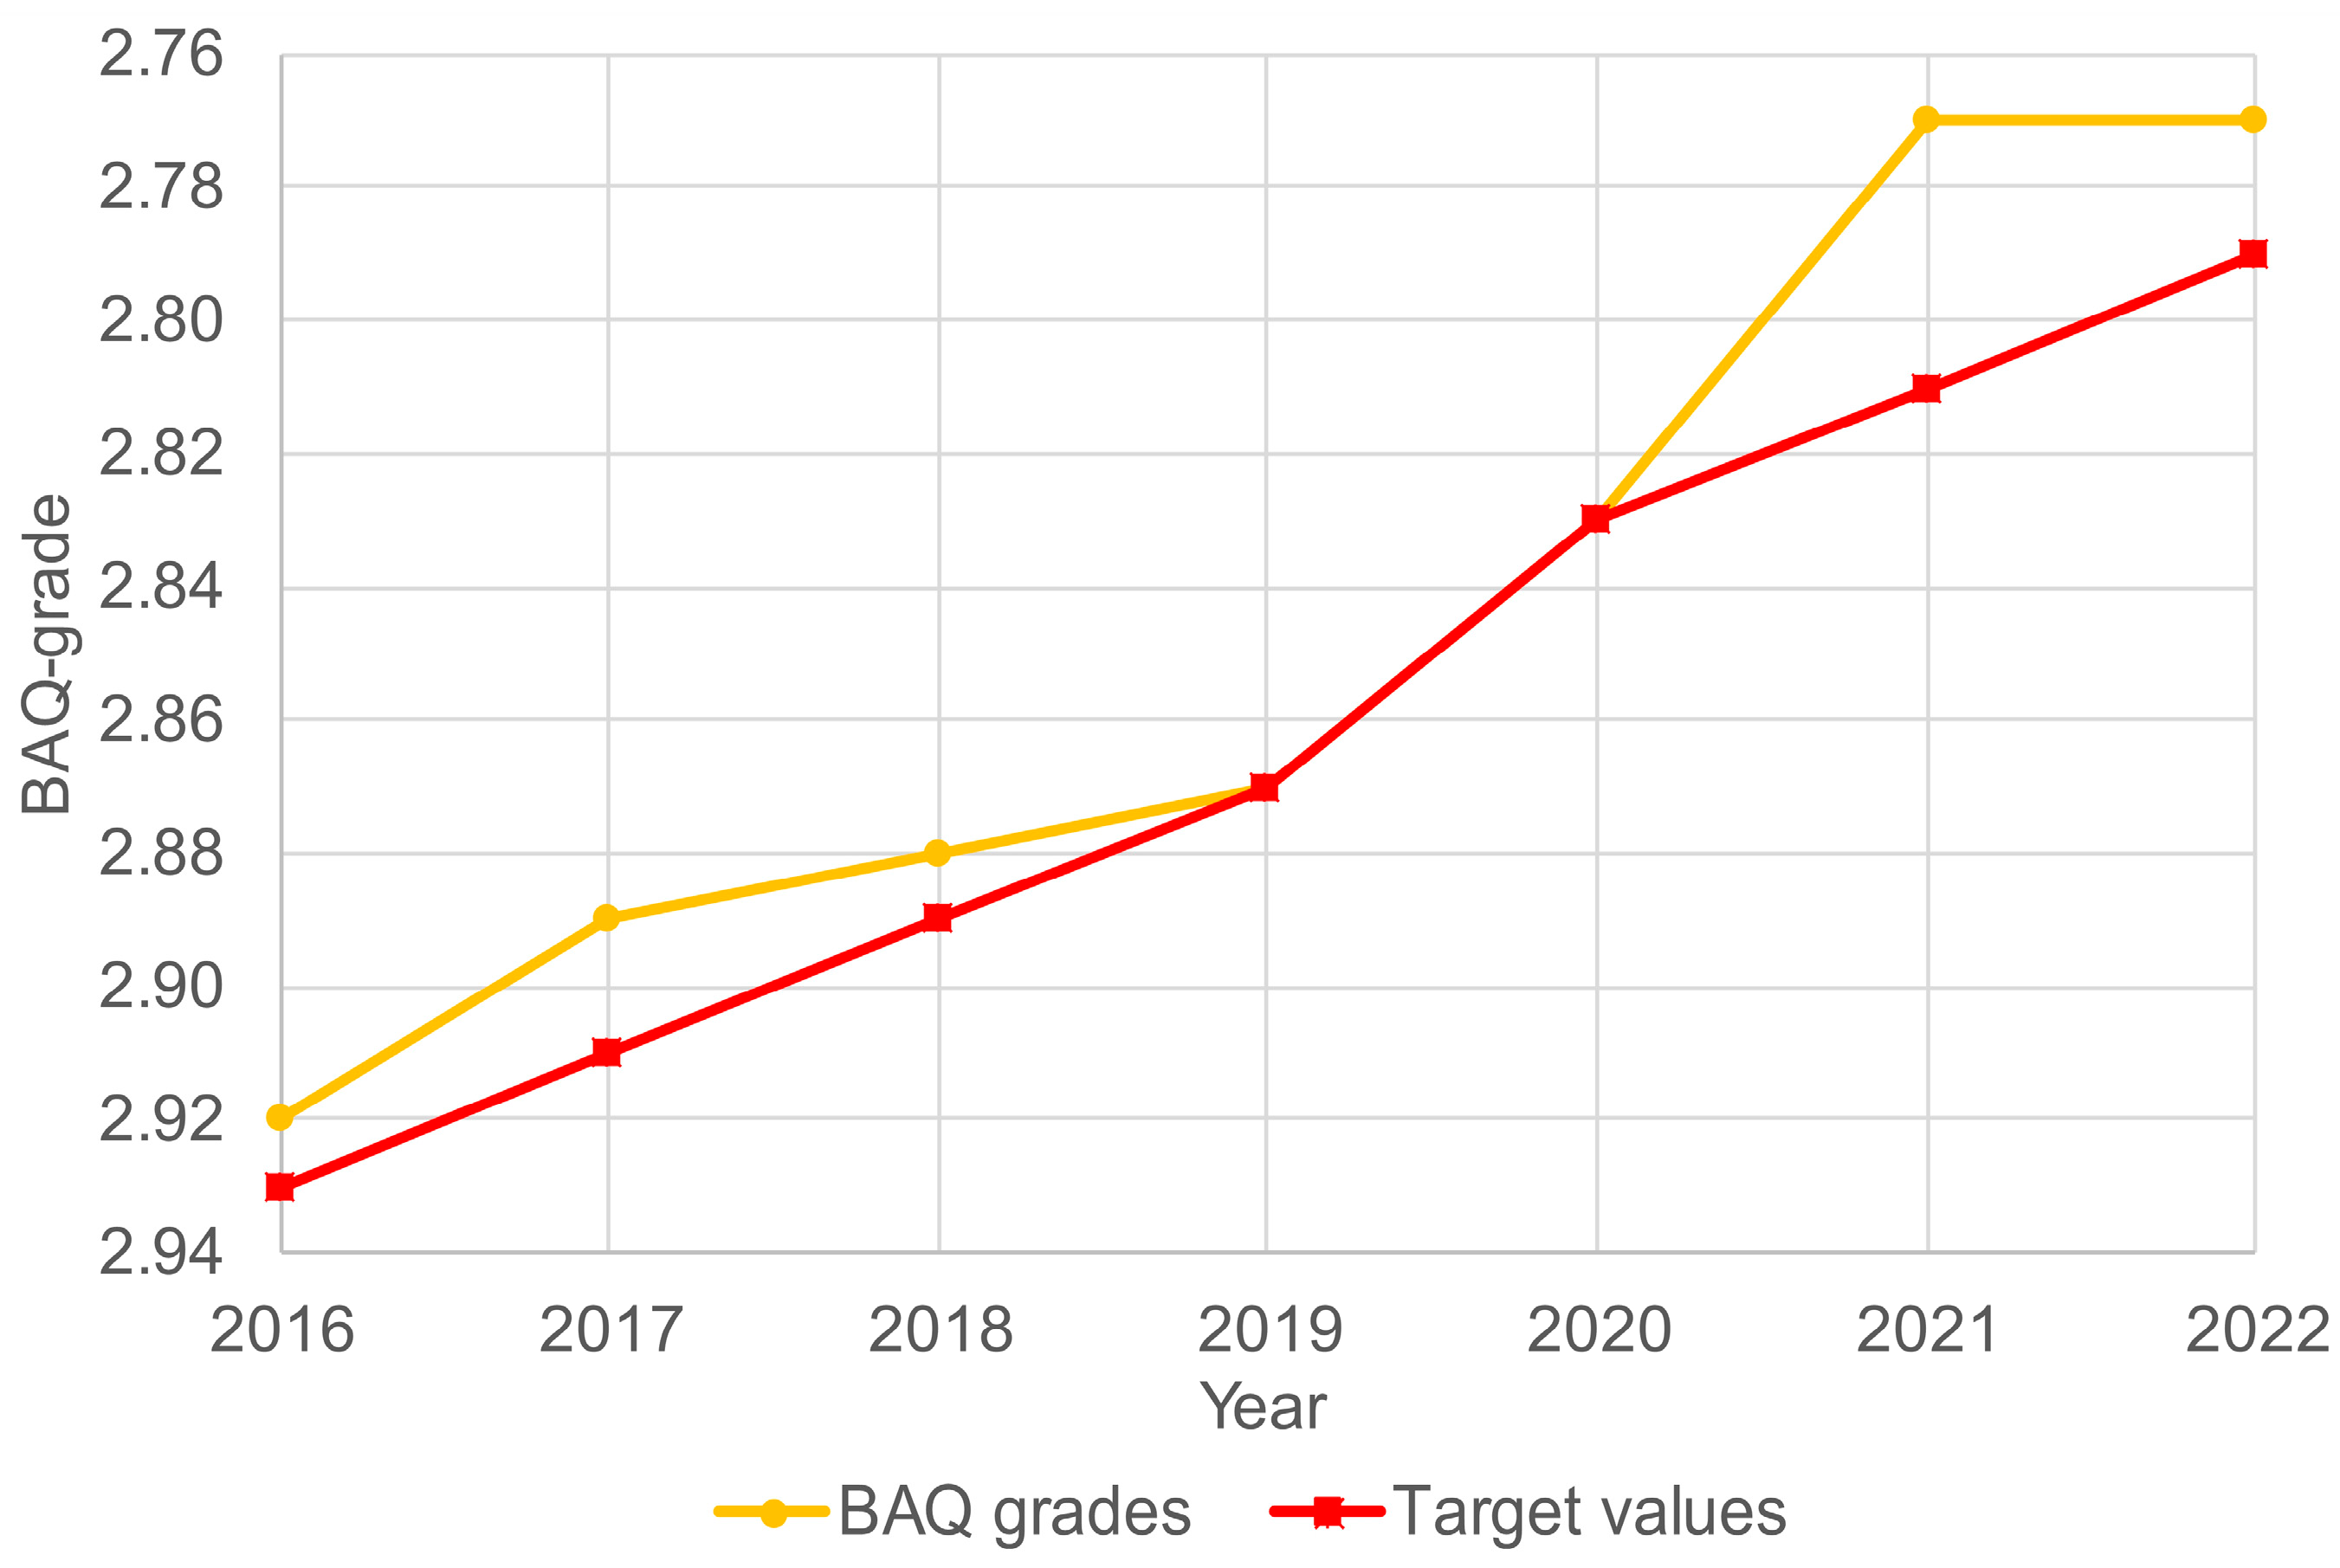
The nationwide BAQ grade is determined annually and compared to the targets of the LuFV. The BAQ grade is reported in an infrastructure asset quality report (“Infrastrukturzustands- und -entwicklungsbericht”) [
19,
20]. The historical development (2016–2022) of the nationwide BAQ grade and its corresponding target values are shown in
Figure 2. There has been a steady improvement in the nationwide grade from a grade of 2.92 in 2016 to a grade of 2.77 in 2022. The target is an annual improvement of 0.02 grade points. In 2020, there was a change from LuFV II to LuFV III. This resulted in a one-off deviation from the improvement rate.
After providing a definition of the infrastructure quality of railway stations, the following section contains a discussion of the methodology for modelling degradation functions and the effect of the measures. These two aspects form the main elements of the cause–effect relationship.
3. Methods
The core of the cause–effect relationship is a model describing the development of the asset quality, which is dependent on the asset age as well as on maintenance and replacement measures. For the development of this model, quality assessments for each asset of the railway station infrastructure, as described in
Section 2, are used. In this section, the available data basis is first described, followed by a description of the model derivation in the Model derivation section, concluding with a description of how the model can be used for the quality prediction of single assets in the integration of the developed model into a cause–effect relationship.
3.1. Data Basis
Measurements are available for each of the different asset classes (
Section 2) for the period from 2009 to 2020. On the one hand, each asset is regularly evaluated in time intervals specified for each asset class, and on the other hand, an evaluation is performed after an asset has received a replacement or a substantial maintenance measure. Consequently, the substantiality of a maintenance measure is defined by costs above a certain threshold. This means that the time interval between two quality measurements differs between assets of the same class, as well as for different classes. Furthermore, reactive and preventative maintenance measures are distinguished. Reactive maintenance measures are used to repair short-term failures and damage. Preventative measures, on the other hand, serve to prevent failures or damage before they occur.
Table 3 shows an example extracted from the data records for two different assets (platform and elevator). In addition to the information on the asset, such as the individual identifier (asset number), the corresponding asset class, the year of construction, and the service life, information on its quality measurement is also required for the evaluation. The reason for the quality measurement and the result of the measurement are also relevant information, in addition to the date, which is used to calculate the age of the asset during the measurement. A total of 321,626 measurements from the years 2009–2020 are available for the asset classes considered.
For evaluating available data on quality assessments due to maintenance, replacement measures, or routine, each class is considered separately, as the assets of different classes are diverse in their characteristics. This analysis aims to separate the assets’ quality degradation over time and quality improvement as an effect of maintenance measures. In this process, the scores of the assets are analyzed before being converted into a grade.
However, data are only available for a limited time period, which does not cover the service times of each asset class; thus, the history of the assets is partially unknown. Therefore, the impact of maintenance measures cannot be directly separated from age-based degradation in the data, since historical—hence, unknown—maintenance measures influence current asset quality. Consequently, available asset scores might be biased towards better quality than the quality that is explainable by the data.
Instead of extracting net degradation data, maintenance measures and the circumstances under which these are performed are analyzed in detail. As only maintenance measures over a specific financial threshold are tracked, the scores of an asset can improve from one quality assessment to another without this improvement being explicitly related to a particular maintenance measure in the data.
Therefore, in the approach described here, measurements declared as maintenance in the data are not the only ones considered maintenance measures, but all measurements that lead to an improvement in scores are considered as such.
3.2. Model Derivation
In the setting described, the average asset quality just before and just after the assets received a maintenance measure is determined. The values are thereby determined for every asset age for each class, and reactive and preventative measures are considered collectively to generate a larger database of maintenance measures.
The evaluation of the maintenance measures using the method described shows that both the condition of an asset just before a maintenance measure and just after evolve approximately logarithmically with their age. Therefore, for the construction of the model, a logarithmic fit of the form
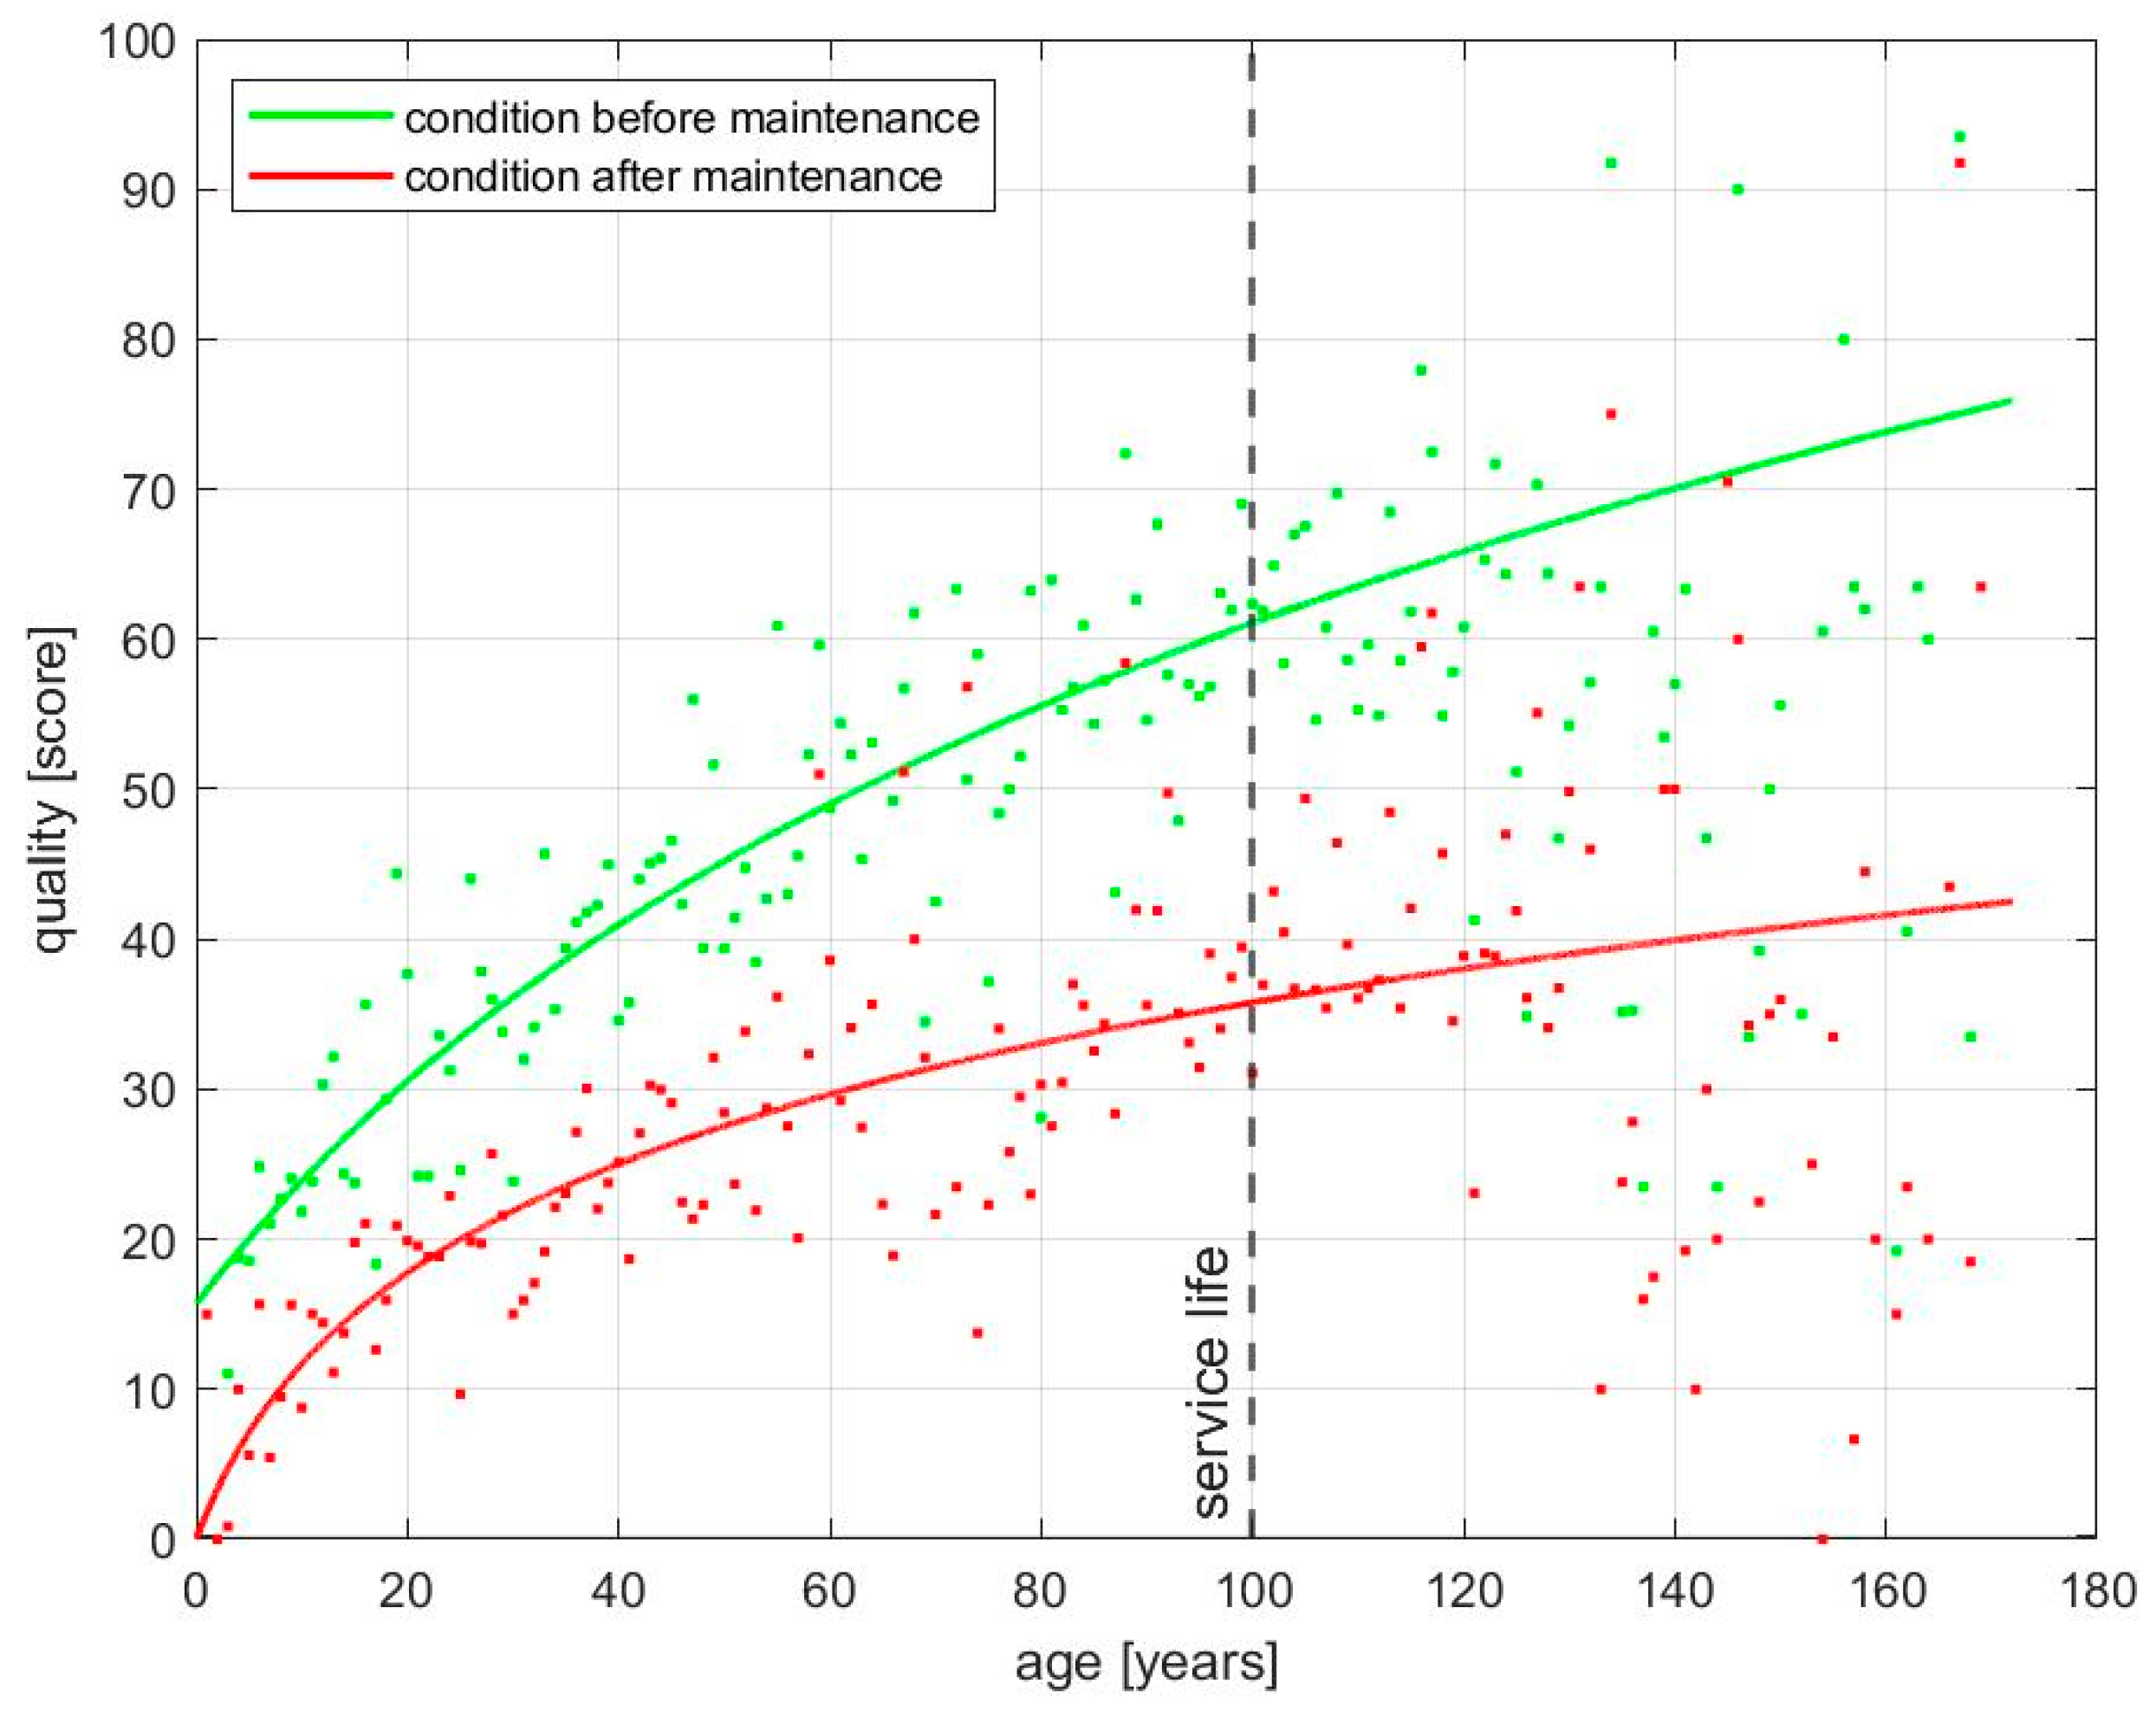
with a, c ∈ R, and b ≥ 0 is performed on the corresponding data. Thus, these factors differ for the conditions before and after a maintenance measure. For the fitting, particular consideration must be given to the assets’ service life. Service life denotes the age at which an asset is normally supposed to be replaced. However, due to limited financial resources, a replacement cannot always be conducted in time. This means that, in all classes, there are assets that exceed this predefined maximum age. Yet, in line with the intended replacement, the number of data points significantly decreases after the service life, and those assets are in relatively good condition when proportionally considered. Therefore, the assets that survive the service life are often in a disproportionately good condition, because the limited resources are first spent on the replacement of assets that are most in need of renewal. For this reason, only the data of all the assets of a class up to the age of the service life that is valid for this class are used for the logarithmic fit. The results of these fits are depicted in
Figure 3 with the example of pedestrian underpasses. The average asset condition before maintenance is shown in green, whereas the average condition after maintenance is shown in red. In each case, the dots refer to the data, and the lines display the corresponding fit.
With the fitted curves describing the average condition before and after an asset receives a maintenance measure, the effect of a maintenance measure can be approximated as the difference between these two conditions for a specific age in each case.
In addition to the condition at which a maintenance measure is performed on average and the corresponding effect on the asset score, it is necessary to know with which frequency maintenance measures are normally performed. To determine these frequencies, the share of assets that have received a maintenance measure at a certain age is first calculated.
As a reference for this share, the number of all assets that reached the age considered at some point within the investigation period are included, since not every asset is assessed every year. Finally, these shares are cumulated, and the cumulative values are used to determine the ages at which an asset receives a maintenance measure on average [
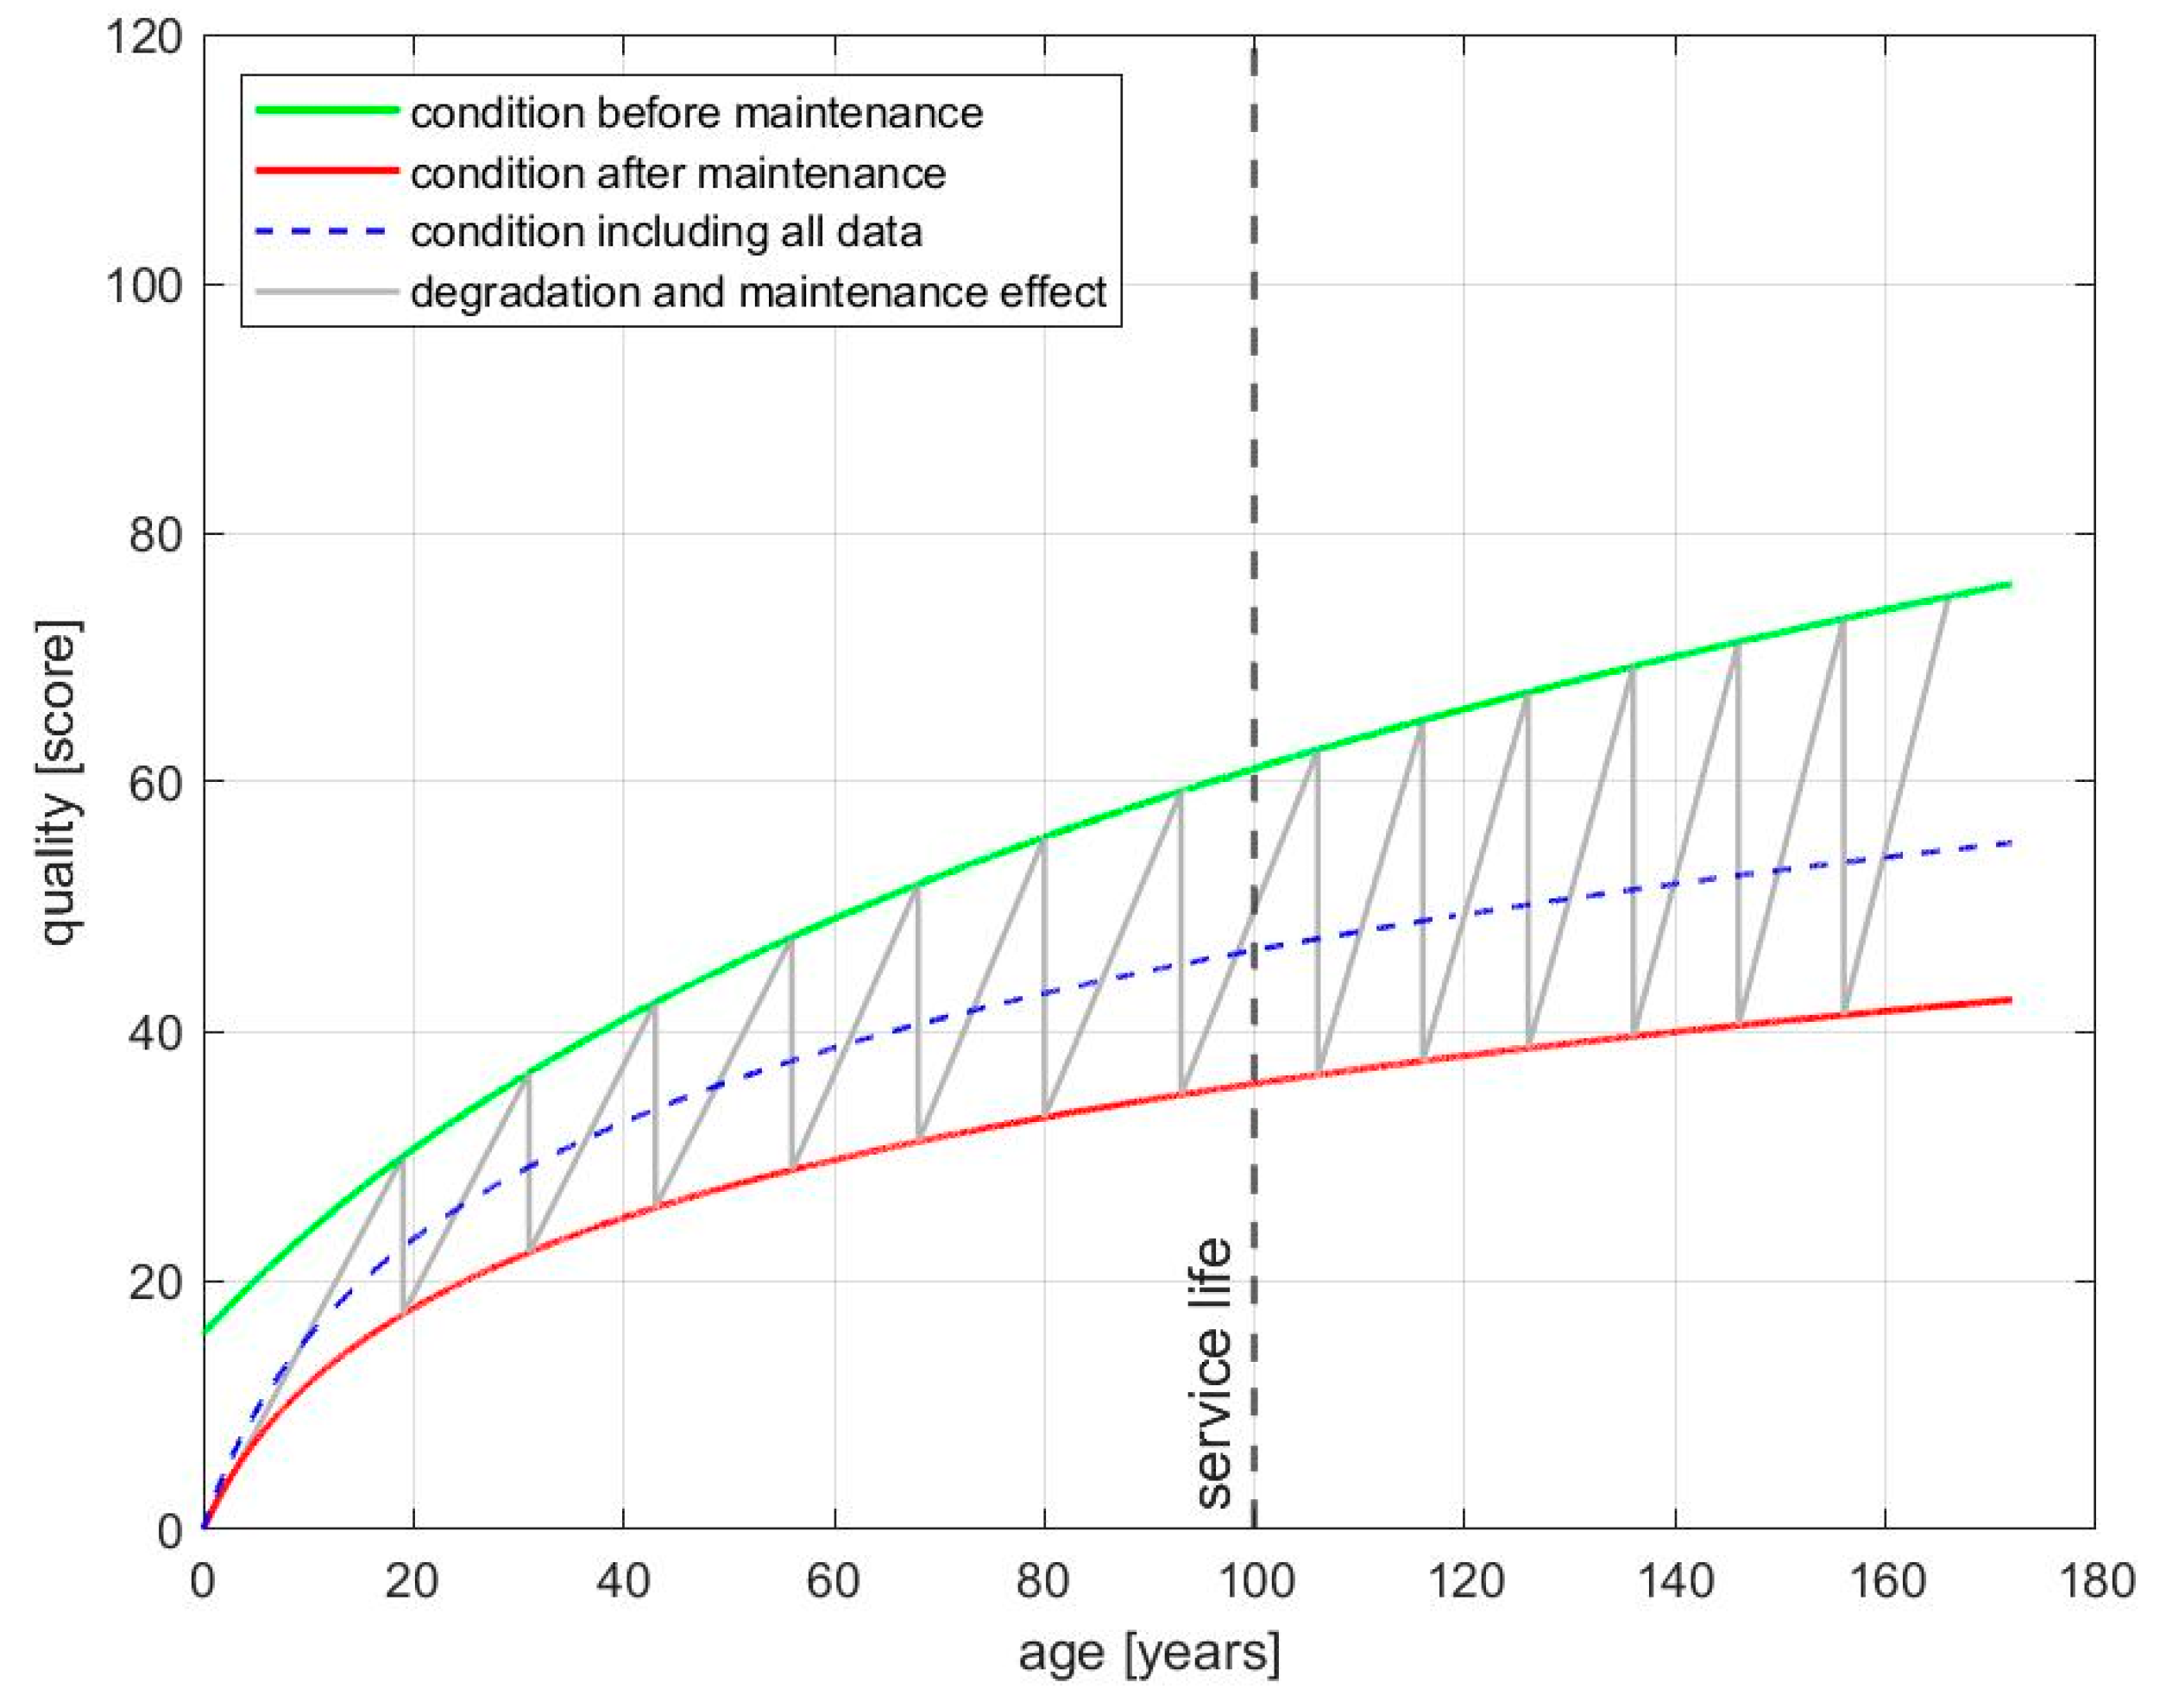
15]. These intervals are determined using the fits along the cumulative maintenance frequencies. This analysis shows that, in some asset classes, the maintenance frequency increases with growing age. In this way, the time intervals between maintenance measures are directly deducible (see vertical light grey lines in
Figure 4).
With the points in time at which a maintenance measure is usually performed, as well as the effect of such a measure given, the model still lacks a representation of the score development between two maintenance measures. To find an appropriate model for the deterioration process between two maintenance measures, the data of assets up to 12 years are analyzed. Since data are complete for these assets (year of construction ≥ 2009), the maintenance influence can be completely eliminated from this data set by deleting maintenance measures and data following a measure. Upon investigating the development of the asset condition averaged over age in the data, a linear trend emerges. Therefore, intervals between the two maintenance measures are linearly interpolated.
The current model is now able to describe the average asset condition development over time for each class. To check the model’s plausibility, it is compared to the average development of the complete data set in each class. It becomes apparent that the average degradation follows the trend of the modeled function resulting from the maintenance measures and the degradation in between them (see the blue dashed curve and grey saw tooth curve in
Figure 4). Hence, it can be assumed that the model provides an adequate description of average asset development. A separate consideration of replacement measures is not necessary, since each replacement leads to a new asset with age zero and the best possible score by definition.
3.3. Integration of the Developed Model into a Cause–Effect Relationship
To integrate the developed model into a cause–effect relationship between asset condition and financial resources, it must still be linked to the costs that are incurred for single measures. For replacement measures, DB Station&Service AG directly provides these costs. The costs depend on asset size, resulting in larger assets requiring more financial resources than smaller ones of the same asset class. The development of the costs for maintenance measures in collaboration with DB Station&Service AG is described as follows:
The costs for maintenance measures in the last years were analyzed based on data to obtain an average cost per size of the asset. In this analysis, a distinction is made between preventative and reactive maintenance measures, since costs vary significantly for the two types of maintenance. On average, the cost for reactive maintenance measures in the data analyzed is 46% less compared to the costs for preventative measures.
To connect developed costs to the model, it is still necessary to relate them to the effect of a maintenance measure. However, the maintenance costs calculated to this point do not yet include a quality assessment. To establish a correlation, the average quality improvements of an asset up to service life are formed as indicated by the sum of all the improvements in the model and are used to calculate the cost per size of an asset for a maintenance measure.
Since improvement is the same for reactive and preventative maintenance measures in the model, but their costs differ, the result is that reactive maintenance measures are the most effective measures. Since they are normally applied to old assets in bad condition, replacement measures tend to be highly effective in terms of score improvement as well, but their cost is of a completely different order of magnitude than those in the maintenance measures. Therefore, the cost-improvement effect is not as high as in reactive maintenance measures.
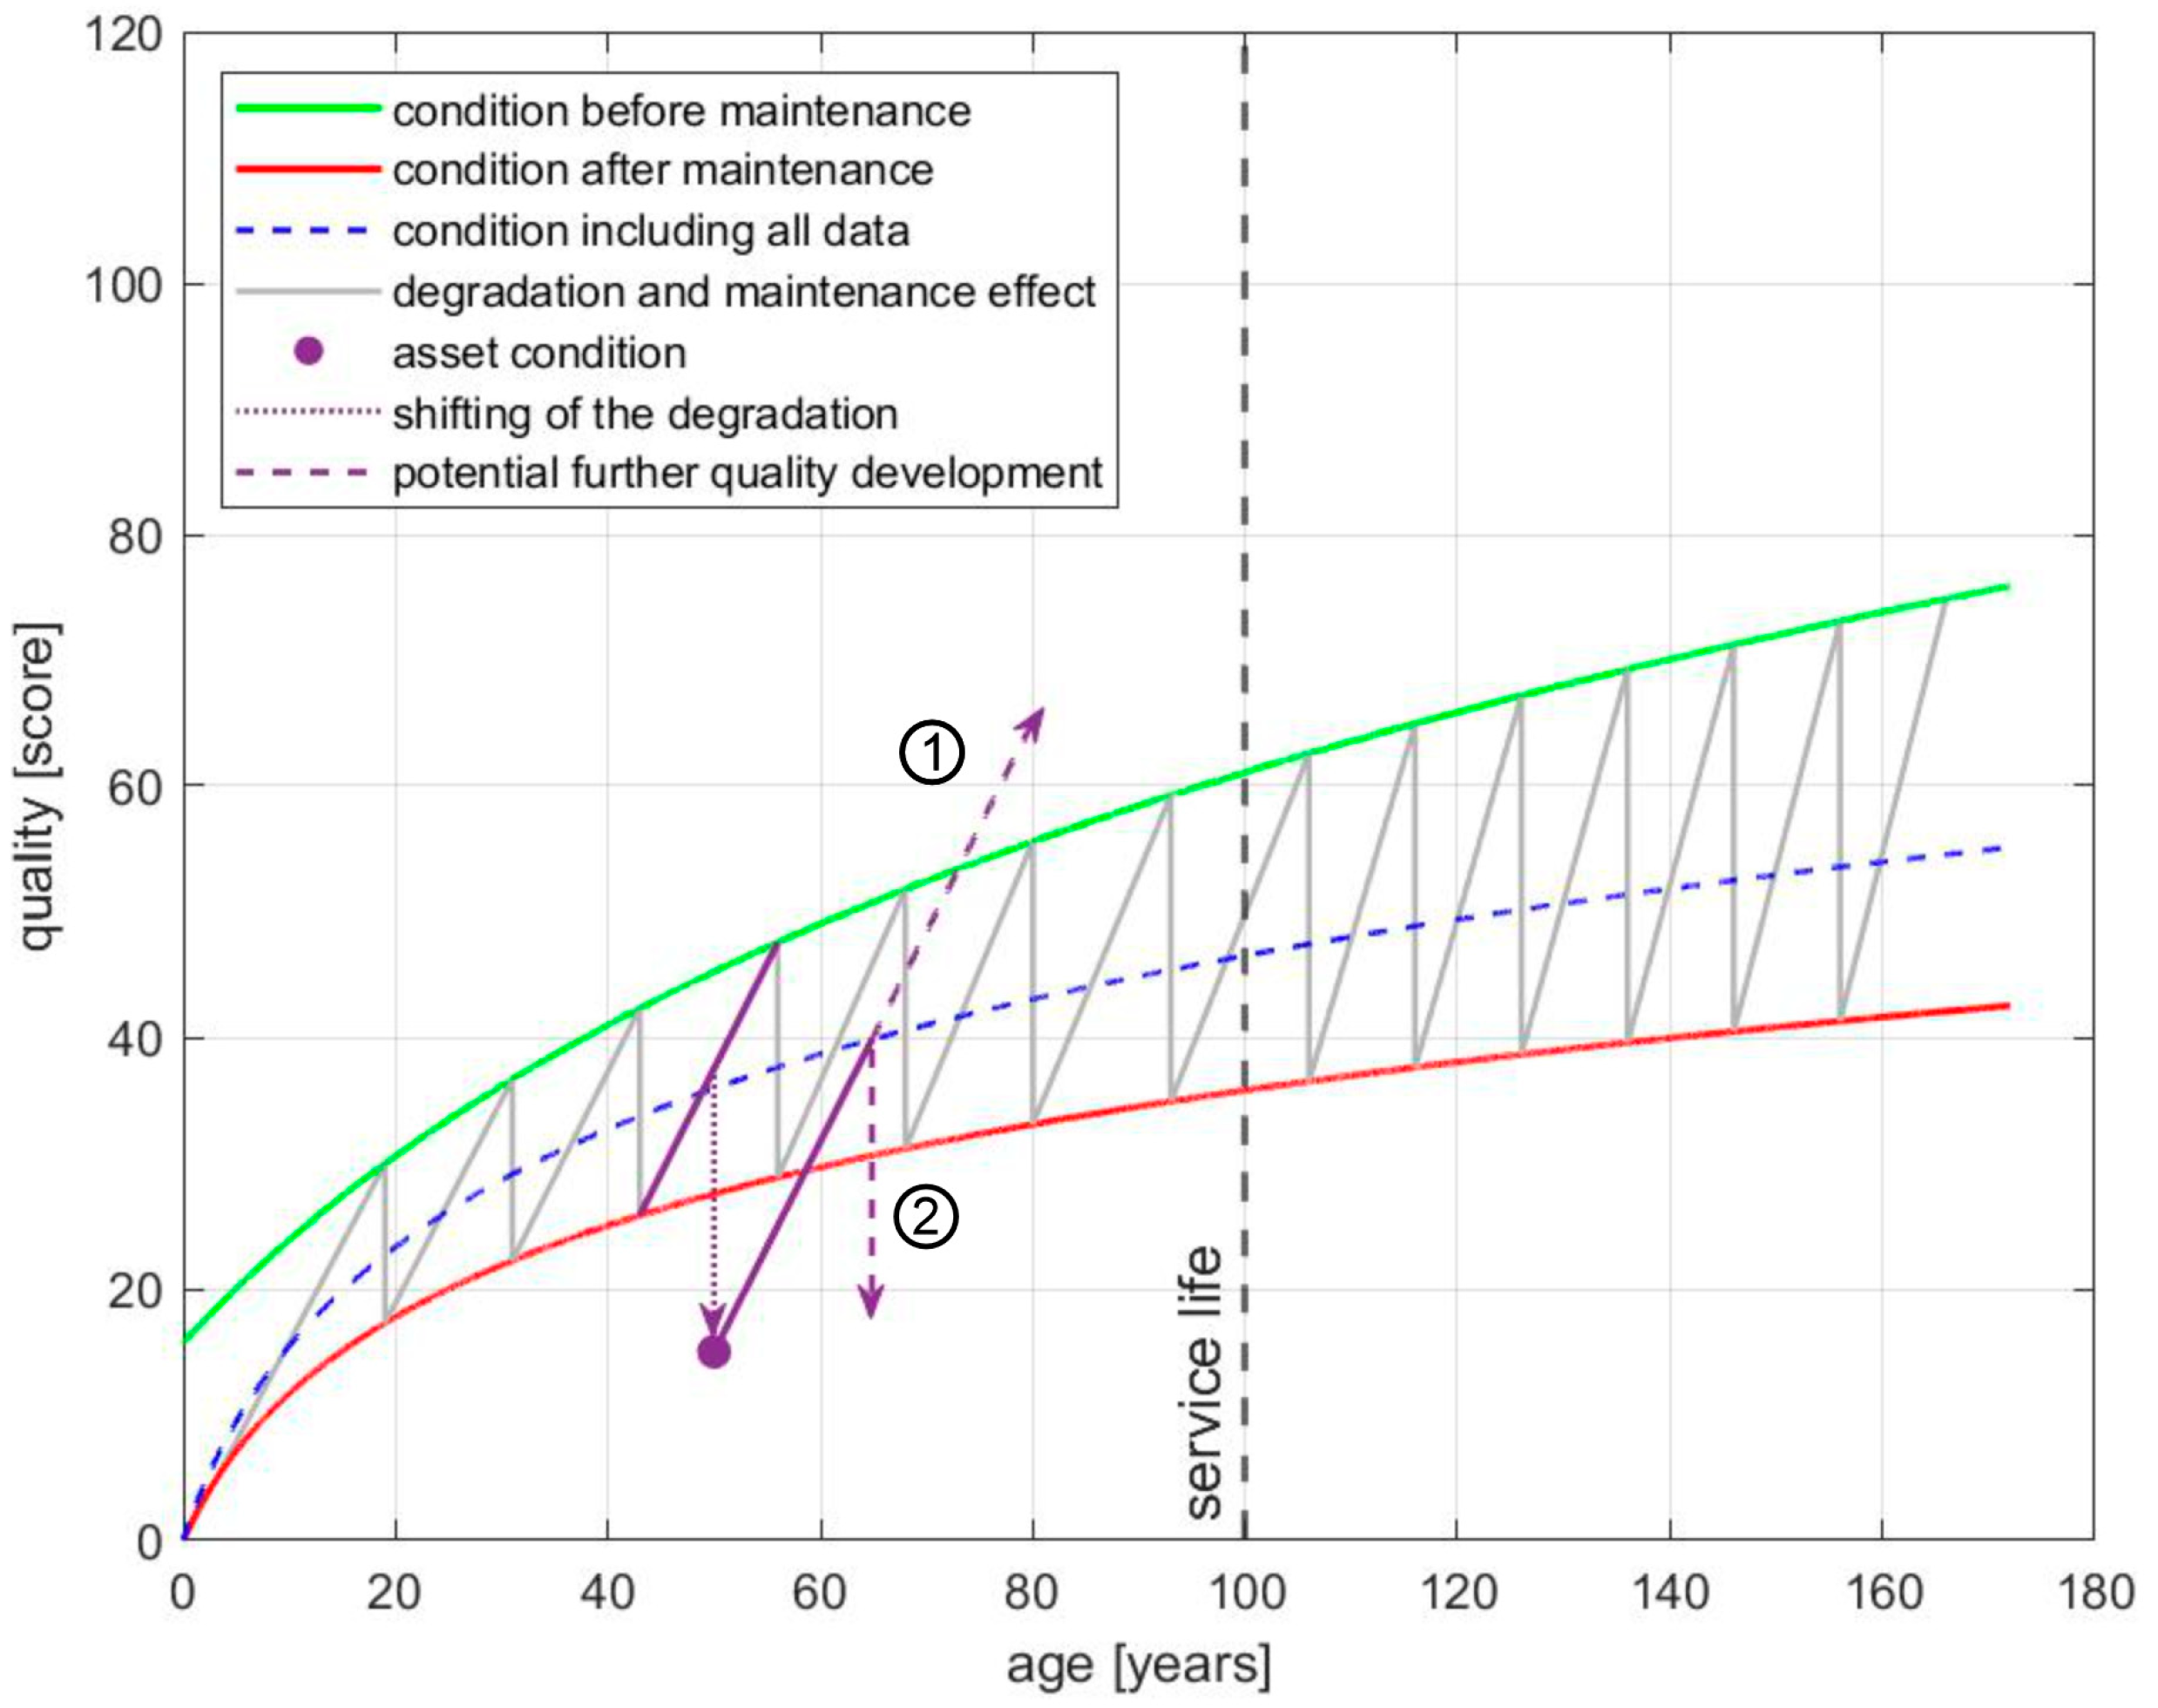
The intended use of the model is not only to describe the score development of average assets but to also estimate the score development of any asset currently in use. The procedure of how the score development of assets can be mapped with the developed model is depicted in
Figure 5: first, an adequate degradation slope for the age interval the asset considered is situated in is mapped to the asset. This degradation slope is then used to predict the assets’ score development for the next years. As soon as the slope reaches the “intervention threshold”, which is defined by the dashed blue line indicating the overall average condition of assets, a maintenance measure should be scheduled. This intervention threshold ensures that, in any year, assets are above this threshold so that an improvement is possible. If the financial resources do not allow for the implementation of a maintenance measure in this model at this time, it is assumed that the asset will further degrade with the same degradation slope as before. This is indicated by arrow 1 in
Figure 5. In case the maintenance measure can be conducted, the asset condition is improved by the effect of an average maintenance measure at this age; in other words, the difference indicated by the curves, which models the average condition before and after a maintenance measure, is performed (see arrow 2 in
Figure 5). Improvement can reach a maximum of the best possible condition, i.e., score 0. If the asset has already exceeded the service life, and its condition is poorer than the one indicated by the intervention threshold, it is listed as a replacement measure.
Furthermore, for stand-alone prediction by the model, a concept must be designed with consideration to the question of how an available budget should be distributed among different asset classes, as well as a policy of how to proceed in case the financial resources do not suffice for the performance of all theoretically scheduled maintenance measures. The handling of the issues of budget allocation and measure prioritization are described in the following section.
4. Prioritization and Budget Distribution
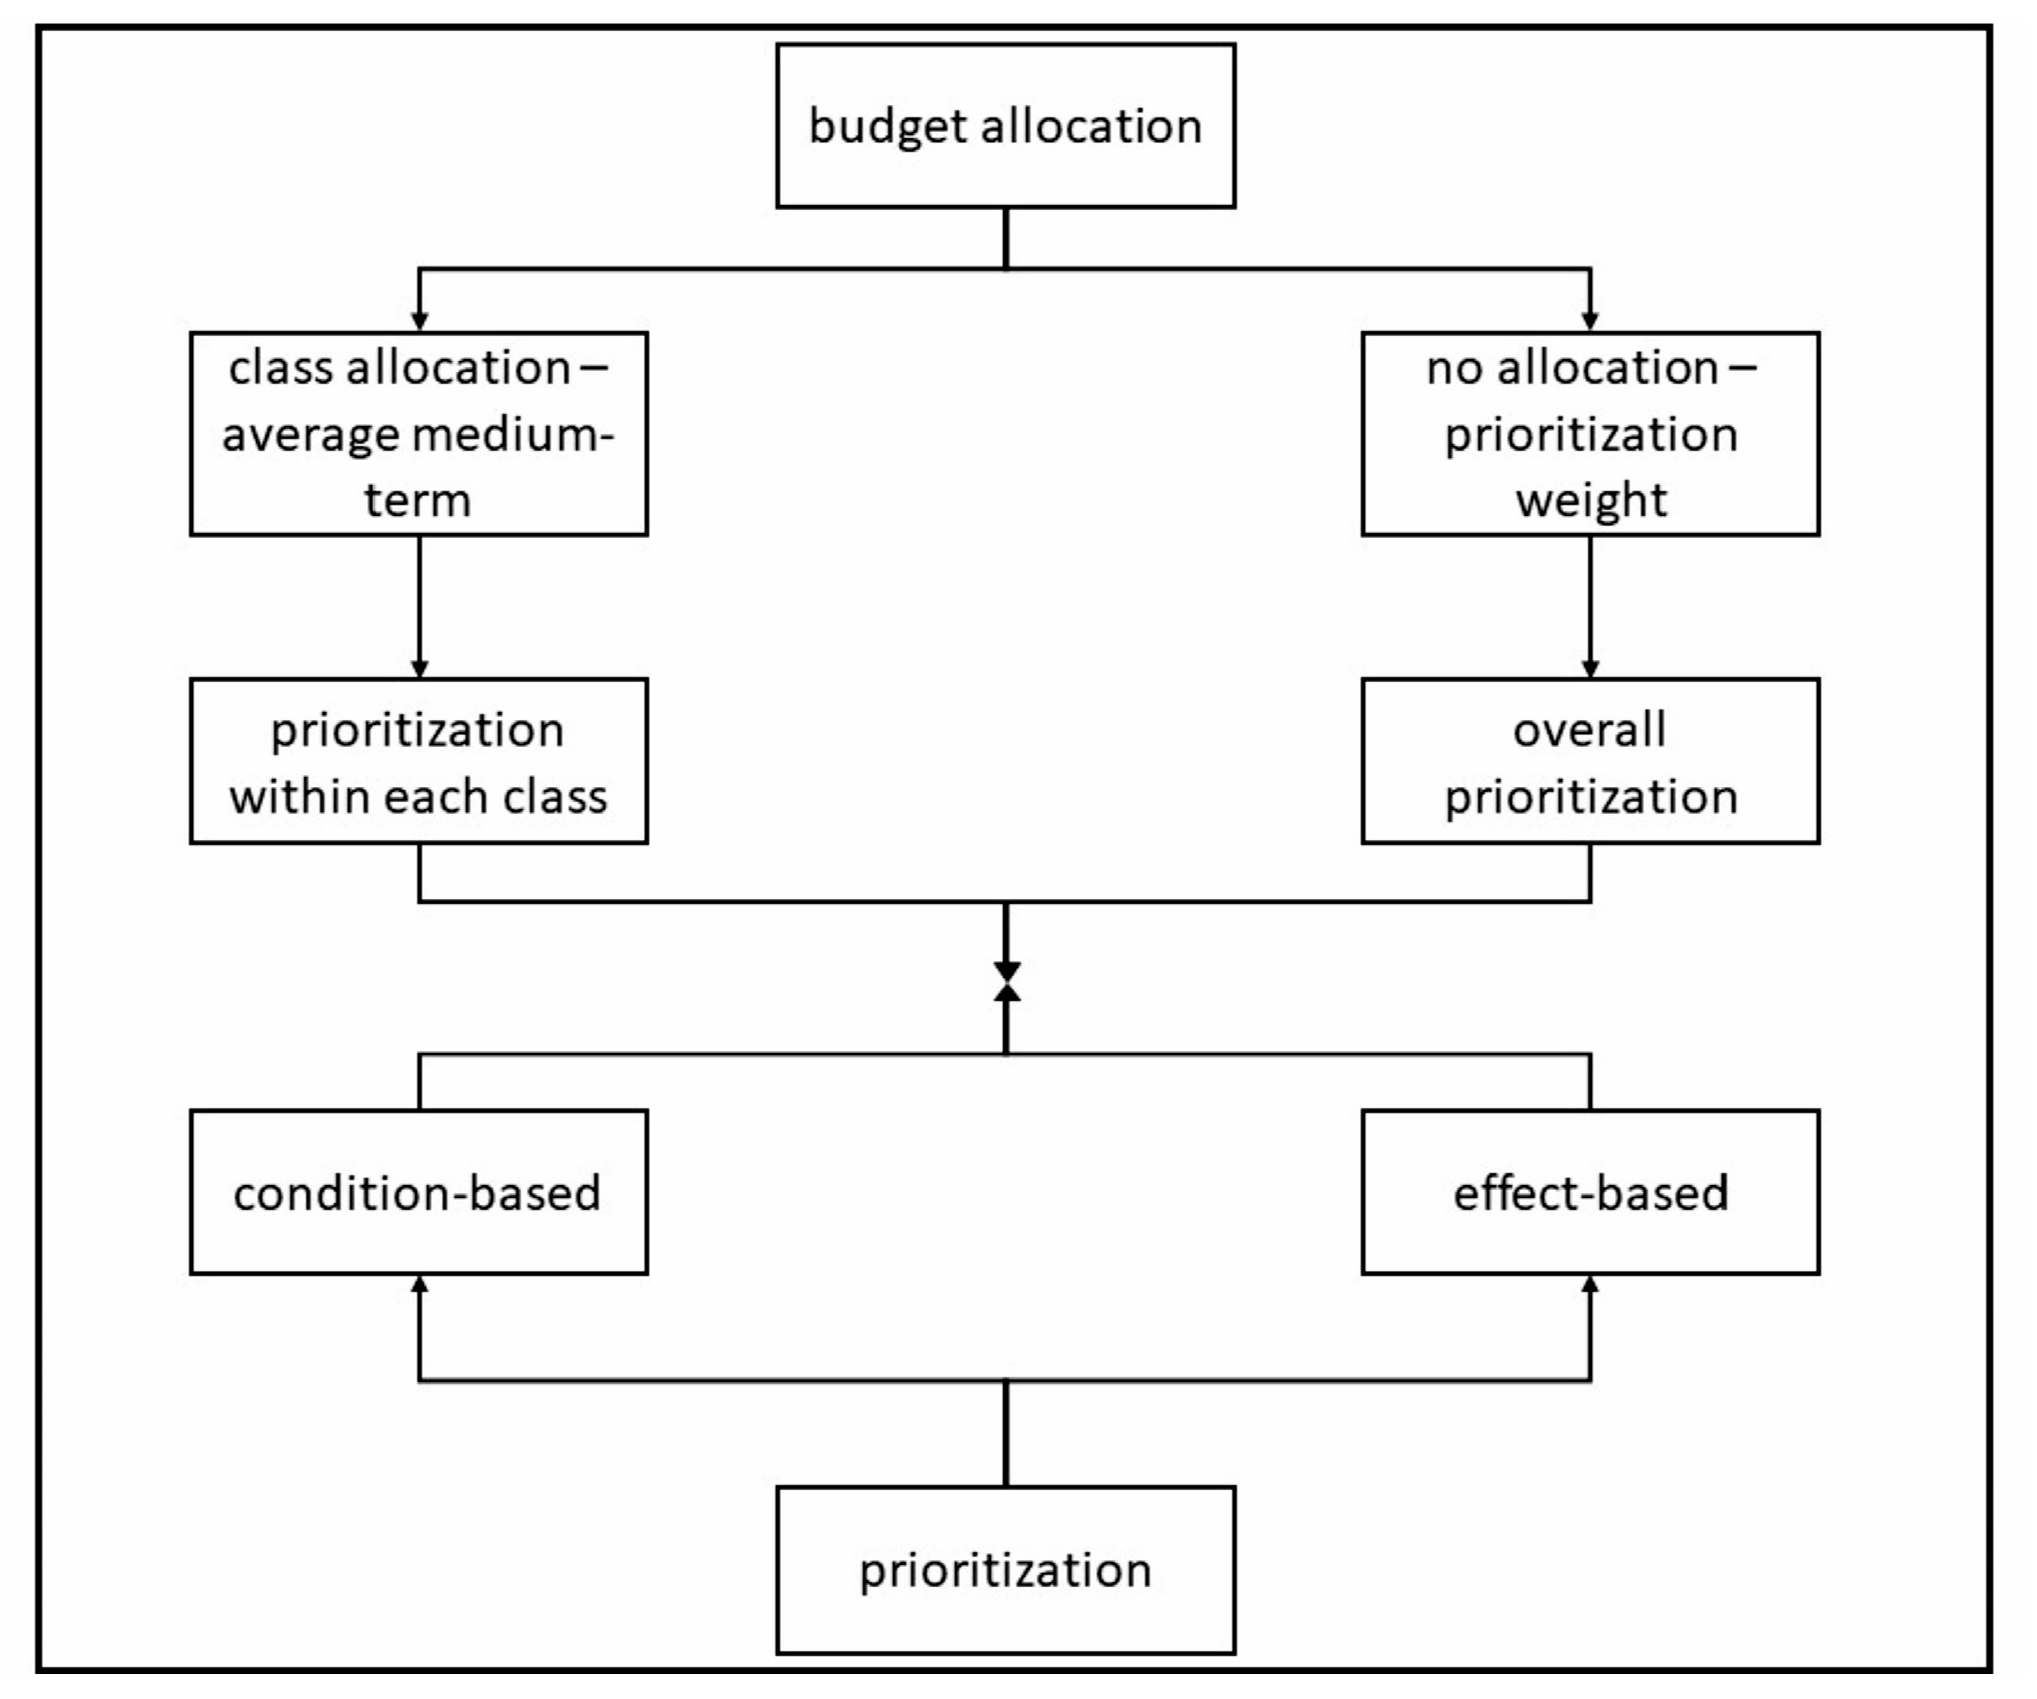
As is usual at DB Station&Service AG, the budget available for the maintenance and replacement of the infrastructure is divided according to different types of measures. Thus, there are three different budgets: the replacement budget, the budget for preventative maintenance, and the budget for reactive maintenance. As a first step, these available budgets are distributed among infrastructure assets. For this purpose, one option is to allocate the budget via asset classes and assign a corresponding amount to each asset class. Another option is not to take the subdivision into asset classes into account but to spend the budget directly on individual assets without a prior distribution of the budget to asset classes. Once the budget has been allocated, the next step is to prioritize required measures. As described, the life cycle model can be used to detect the need for maintenance measures and replacement investments for each asset class. Since needs usually include many assets, the need for measures cannot be completely processed; therefore, the need for measures must be prioritized.
In real planning—and therefore also in the model—the planning of financial resources for replacement and maintenance measures is carried out at different time levels. On the one hand, there is medium-term planning, and, on the other hand, there is long-term planning. Medium-term planning covers a period encompassing the next five years. The planning of this period at DB Station&Service AG is already at an advanced stage. The long-term period begins after medium-term planning, i.e., after the first five years, and is not limited. Budget allocations and prioritization strategies can be tested and analyzed for both time frames with the model described in this study.
In the following sub-sections, different options for budget allocation are described, followed by different approaches that prioritization can take.
4.1. Budget Allocation
In medium-term planning, fixed budgets are estimated for the next five years for each type of measure in each asset class. In the case of replacement measures, the budget is also allocated to specific assets. These data contain the assets to be replaced for the next five years, as well as the year of the planned replacement. For maintenance measures, however, the specific measures to be implemented are not specified, but budgets for asset classes are given. Therefore, budget allocation can be specified in medium-term planning for each asset class. The budgets provided by DB Station&Service AG are used here.
In long-term planning, budgets must be planned and allocated for maintenance and replacement measures beyond the next five years. No specific budget allocation plans are available for this period. Therefore, total budgets are to be defined and are subsequently distributed by the model. For this purpose, an inflation rate is added to the overall budgets of the medium-term planning and applied in the model. Within the framework of the model, it is possible to test and simulate different budget allocations. The following strategies are available within the model for the allocation of a budget to asset classes for a long-term period.
4.1.1. Long-Term Budget Allocation According to Averaged Medium-Term Percentages
One way of allocating the available budget to the different asset classes in the long term is to use respective specifications from the medium-term period. For the next five years, the share of replacement investments and maintenance measures in the total budget is calculated for each asset class. The value of this share, averaged over the five years, is then estimated for the long term and allocated to the available budget or planned for the respective year. This variant, therefore, provides an allocation of the budget to various asset classes. For each asset class, prioritization is set after budget allocation.
4.1.2. Long-Term Budget Allocation According to Prioritization Weights
This budget distribution option allows the budget to be distributed to asset classes, depending on the prioritization selected. Here, the needs detected for measures are sorted across asset classes based on the prioritization defined. The budget is then distributed to various assets so that the sorted list of measures is processed from the top to the bottom of the list, until there is no more budget available. In this variant, there is no budget allocation in the true sense of the term. Different asset classes are no longer considered, but the overall budget remains and is distributed to individual assets.
4.2. Prioritization
To apply the model developed in
Section 3, the need for measures must be prioritized so that, in the case of an insufficient budget, sensible measures can be implemented first. This prioritization, i.e., sorting the measures, can be defined according to different criteria, which are listed below. As with the allocation of the budget, different prioritization types are applicable for replacement investments, as well as for preventative and reactive maintenance measures. Depending on the selected budget allocation, the measures are sorted as a whole or within the asset class.
4.2.1. Condition-Based Prioritization
With this type of prioritization, the pending assets for a measure are sorted according to their score. Depending on the selected budget allocation, this sorting is carried out either individually for each asset class or across all assets. Starting with the worst grade, as many assets as possible are selected among those that can be maintained with the available budget. This prioritization strategy ensures that assets in poor condition are maintained or replaced first.
4.2.2. Prioritization According to the Effect of a Measure on the BAQ Grade
In this prioritization variant, the assets are sorted in such a way that the improvement in the overall BAQ grade is maximized per monetary unit (Euro €) invested. For this purpose, the influence of an individual measure on the overall BAQ score is calculated using the product of the BAQ grade-improvement of the measure, and the weighting of the asset, and this is then divided by the costs of the measure. With this prioritization strategy, the BAQ grade is optimized with the available budget.
In summary, the correlation between budget allocation and prioritization, as well as an overview of the options considered, can be seen in
Figure 6.
5. Results
In this section, the budget allocations and prioritization strategies presented in
Section 4 are analyzed regarding their impact on infrastructure quality.
Four comparative calculations are performed in order to calculate this. In each of the four scenarios considered, budget allocations that are already available are assumed for medium-term planning, and the exact planning of the assets to be replaced is considered. Therefore, budget allocation only has an impact on the prognosis of the BAQ grade from the sixth year onward (long-term period). However, prioritization differs from the reference scenario from the beginning so that an influence is directly recognizable.
In the first scenario, which is used as a reference scenario, the budgets for both the replacement and the preventative/reactive maintenance resources in the long-term period are determined based on the medium-term planning already available. Thus, the budget allocation “According to averaged medium-term percentages” is used. In this scenario, the prioritization of replacement and maintenance measures is condition based.
In the second scenario, the prioritization is also condition based, but in this case, long-term planning budgets are distributed according to prioritization weights. This means that money is allocated to measures regarding the assets that are in the worst condition. These budget allocations and prioritizations are used for both maintenance and replacement investments.
In the third scenario considered, budgets in the long-term period for replacement and maintenance measures are allocated to asset classes based on their shares from medium-term planning (“According to averaged medium-term percentages”). Prioritization, on the other hand, is based on the effect a measure has on the BAQ grade. In this way, an optimized result is achieved within each asset class regarding the grade.
The fourth scenario considered also prioritizes the effect a replacement or maintenance measure has on the BAQ grade. In comparison to the third scenario, however, the budget is not distributed among asset classes but according to prioritization, which here means that the budget is distributed as optimized for the BAQ grade. Consequently, the best possible nationwide grade is achieved for the available budget.
Table 4 lists the analyzed scenarios considered in terms of budget allocation and prioritization strategy.
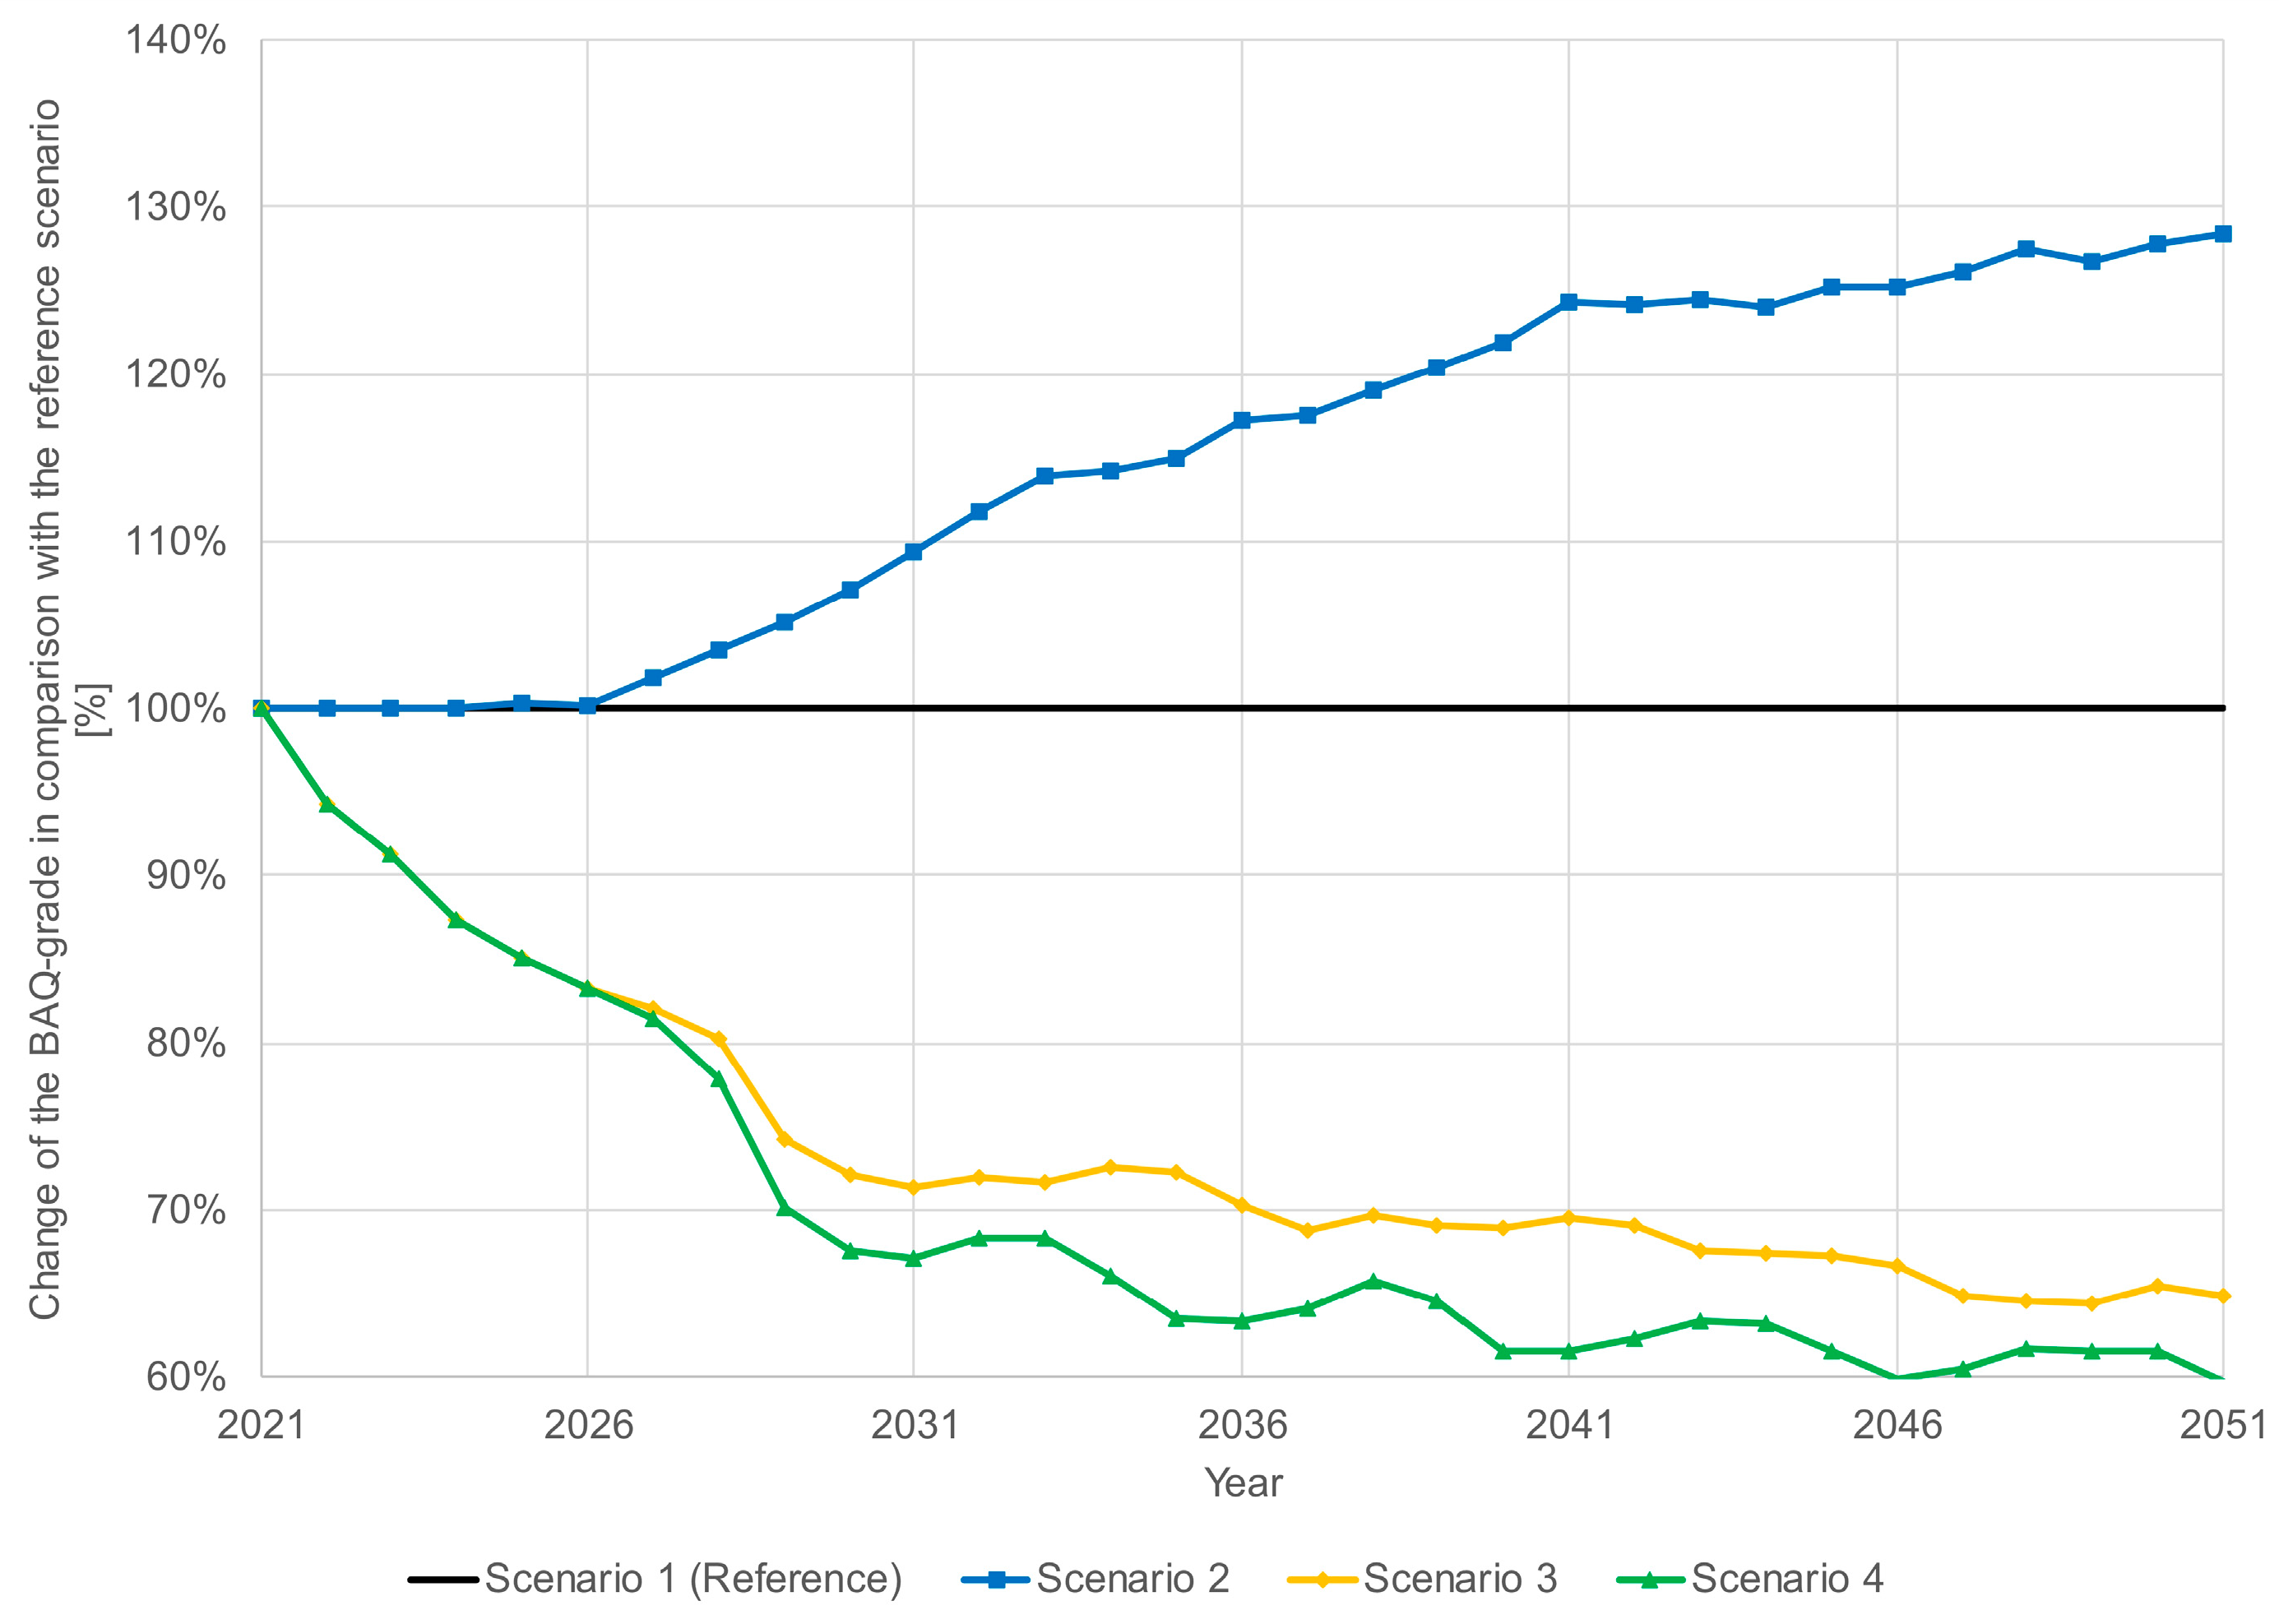
BAQ grades are predicted for the four scenarios described. The first scenario is used as a reference scenario so that the results of this evaluation can be compared to the reference scenario. The comparison of the results is shown in
Figure 7. Budget allocations and prioritization strategies are shown to have a significant impact on the BAQ grade. While the strategies prioritizing the effect of a measure on the BAQ grade have an improved BAQ grade compared to the reference scenario (scenario 1), the BAQ trajectory worsens for the strategy that prioritizes and allocates the budget according to the worst condition (scenario 2). A total of around 5400 stations and 700 station buildings are included in the prediction. This corresponds to the number of stations and station buildings in Germany [
21,
22].
6. Discussion
Since the budget allocation only has an effect from the sixth year onward due to existing medium-term planning, the trends only diverge from the sixth year onward if the prioritization strategy is the same, but the budget allocation differs (scenario 2). When considering the two scenarios with prioritization according to the effect on the BAQ grade, budget allocation according to prioritization has a positive effect on the BAQ grade. Long-term behavior shows an improvement of about 40%-points compared to the reference scenario. If the budgets are allocated based on existing medium-term planning, the BAQ grade still improves by about 35%-points compared with the reference scenario.
However, it is too simplified to only demand a BAQ-optimizing business strategy, and therefore an adjustment of the investment and maintenance regime from the station infrastructure company, to significantly improve the BAQ grade. Prioritizing only based on the BAQ score may neglect factors and constraints that must be considered in business reality. These include, for example, measures in assets with a small effect on the BAQ score or measures that serve to maintain safety. Therefore, it is important to note how the BAQ grade is determined. Here, whether financial resources should be exclusively spent on the basis of this quality indicator must be critically questioned. In the BAQ methodology, which is described in
Section 2, different assets are weighted differently. Platforms, which account for 30% (see
Table 1) of the BAQ grade, have the highest weighting. In reality, this weight is even higher in many cases, since not all asset classes listed in the BAQ methodology are present at every station, and the weightings are redistributed. In addition to the platforms, platform halls and passenger underpasses have a significant impact on the overall grade. Passenger overpasses, windbreaks, floors and staircases, entrance doors, and walls, on the other hand, only have a weighting of 1% or less to the overall grade. This means that assets of this type have hardly any influence on the overall grade.
To significantly improve the BAQ grade, the BAQ-optimized control model prioritizes the maintenance or replacement of assets with those having a high impact on the BAQ grade. Accordingly, a significant part of the available budget is allocated to the asset classes with a high weighting for the BAQ grade. Thus, in scenario 4, up to 80% of the budget of a year is only spent on platforms. Other asset classes, such as passenger overpasses, receive a very small part, or even no budget at all, in this scenario due to their low weighting. Consequently, quality strongly diverges between different asset classes. While asset classes with a high weighting are in very good condition, asset classes with a low weighting are in poor condition. Hence, if the exclusive attempt is to optimize the BAQ grade, not all of the assets will be in a good or serviceable condition. Thus, the exclusive consideration of the BAQ grade methodology sets disincentives for control and planning.
The divergence of quality conditions in different asset classes can be countered by budget allocation to asset classes and subsequent prioritization within those asset classes, such as in scenario 3. Here, a fixed budget is assigned to each asset class before prioritization so that a specified budget is available for each asset class. BAQ-optimized measures are then selected in the model within the asset class. In this scenario, the BAQ grade also improves compared to the reference scenario.
However, all BAQ-optimizing measures can be detected and executed in the model. In reality, this is not necessarily possible due to restrictions such as possible closures, construction capacities, and the bundling of measures. These restrictions are not given in the model; therefore, an exact implementation of the measures from the model cannot be necessarily conducted in reality. Nevertheless, it should be possible to further improve the BAQ grade with the available budget.
From an entrepreneurial point of view, it is worth examining the first two scenarios. In these scenarios, assets of poor quality are prioritized for maintenance or replacement. The focus here is not on optimizing the BAQ grade but on maintaining each infrastructure asset. However, this approach leads to a deterioration of the BAQ grades compared to the BAQ-optimizing scenarios, both in budget allocation to asset classes (scenario 1) and in the overall consideration of the assets (scenario 2). These two strategies are nevertheless a desired strategy, as all assets here are in a serviceable condition.
However, since the BAQ grade is a penalized quality metric, and target agreements have been made with the federal government, the aim must be to meet those target agreements. Whether this is possible with the condition-based scenarios must be critically questioned. To this purpose, it is necessary to partly operate in a more BAQ-optimized approach or to increase the financial budgets.
Furthermore, it would be advisable to adjust the method for determining the BAQ grade by, for example, adjusting the weightings of the asset classes to avoid misalignments in the BAQ grade. To this end, it is important to find a weighting that does not encourage false incentives but still takes into account the importance of the infrastructure assets for the overall quality of the stations. The need to revise the quality indicators has already been questioned by the Bundesrechnungshof, which monitors the federal government’s financial flows [
23].
7. Conclusions
DB Station&Service AG is the infrastructure operator responsible for station assets in Germany. These infrastructure assets are to be kept in an acceptable and serviceable condition through maintenance and replacement measures. DB Station&Service AG receives funding from the German federal government for replacement measures. In return, the infrastructure must meet an agreed target quality. The quality of the station infrastructure is measured by the BAQ grade. All the assets in DB Station&Service AG’s inventory are weighted so that, in the end, a nationwide grade describes the condition of the infrastructure in the nation.
However, since there was no known direct relationship between the financial resources used and the quality of the infrastructure assets, a cause–effect relationship was established and modeled for station infrastructure based on the BAQ grade. For this purpose, degradation models for different asset classes of station infrastructure were determined based on available data. Furthermore, the effects of replacement and maintenance measures were determined from the data. In principle, the technical service life of an individual asset class is used to decide the type of measure (replacement or maintenance). Prices for the measures are stored in the model so that a connection between measures and costs can be established. In addition, intervention thresholds must be defined in the model, above which interventions by means of a measure have to be taken.
The developed model can be used to predict the quality of infrastructure in the form of the BAQ grade by applying the available budget. The model considers the current quality conditions and characteristics, such as the age of the assets, as well as the budget available for renewal and maintenance in addition to the costs for those measures. Further parameters, such as budget allocation and prioritization strategy, can be selected. The expected quality is output each year. The measures that are implemented in the model depend largely on the budget allocation of the total budget to asset classes and the prioritization strategy used. Various scenarios can be simulated with the model, and the effects on infrastructure quality can be analyzed. The cause–effect relationship for the infrastructure assets of DB Netz AG can also be used to test various scenarios [
6,
9]. The validation of the models was based on historical condition data. These were used to reproduce the actual BAQ grades in recent years by means of prediction. The prediction of this historical data provided suitable and plausible results. In this paper, four different scenarios were examined. The prioritization of the measures in particular was shown to have a major influence on the expected quality. Here, the BAQ grade improves in scenarios where the available budget is used for measures that have the greatest impact on the BAQ grade. If measures are selected based on the condition of the assets, the BAQ grade deteriorates compared to the other scenarios.
By comparing and analyzing these scenarios, further conclusions can be drawn in addition to expected quality. It can be seen, for example, that the weighting, and thus the methodology used to determine the BAQ grade, create false incentives for management. From a business point of view, it does not necessarily make sense to use the BAQ grade as the sole optimization criterion for the condition of assets. Although relatively good BAQ grades can be achieved in this way, asset classes with a low impact on the BAQ grade are neglected and do not receive any financial resources; therefore, the serviceability of these assets is at risk in the long-term. Hence, by adapting and further developing the BAQ methodology, the avoidance of the formation of disincentives should be ensured. Adjustments to the method include the different weightings of the asset classes on the one hand and the weighting of the stations on the other. However, it should be ensured that the importance of the asset and the station is taken into account in the overall grade but that the assets are not weighted too low and resulting disincentives do not arise. This analysis thus supports the statements of the Bundesrechnungshof on the informative value of the quality indicators [
23]. The cause-and-effect relationship at DB Netz AG has also shown that the quality indicators currently used for track infrastructure need to be revised, and new indicators need to be defined [
6].


