Article

Change of Direction Performance in Soccer Players: Comparison Based on Horizontal Force–Velocity Profile

by
Sergio Sánchez-López
1,2,
Andrés López-Sagarra
2,
Manuel Ortega-Becerra
3,4,*,
Pedro Jiménez-Reyes
5 and
Manuel A. Rodríguez-Pérez
2,6
1
Physical Activity and Sports Science Department, San Isidoro University Center, 41013 Seville, Spain
2
SPORT Research Group (CTS-1024), CIBIS (Centro de Investigación para el Bienestar y la Inclusión Social) Research Center, University of Almería, 04120 Almería, Spain
3
Physical Performance & Sports Research Center, Pablo de Olavide University, Ctra. de Utrera, km 1, 41013 Seville, Spain
4
Faculty of Sport, Pablo de Olavide University, Ctra. de Utrera, km 1, 41013 Seville, Spain
5
Centre for Sport Studies, Rey Juan Carlos University, C. Tulipán, s/n, 28933 Madrid, Spain
6
Department of Education, Faculty of Education Sciences, University of Almería, 04120 Almería, Spain
*
Author to whom correspondence should be addressed.
Appl. Sci. 2023, 13(23), 12809; https://doi.org/10.3390/app132312809
Submission received: 23 October 2023 / Revised: 24 November 2023 / Accepted: 27 November 2023 / Published: 29 November 2023
(This article belongs to the Special Issue Sports Biomechanics Applied to Performance Optimization)

Abstract

:

Featured Application

Acceleration Capacity as a Multilinear Performance Modulator.

Abstract

Background: The study aimed to analyze the relationship between the mechanical parameters of the horizontal force–velocity profile (Hzt FV profile) and performance over two different change of direction (COD) protocols (505test and modified 505test [M505test]) to assess the influence of mechanical parameters of Hzt FV profile on COD deficit (CODD) in soccer players among different categories. Methods: Seventy-seven soccer players, divided into playing levels, participated in the following assessments: Hzt FV profile, 505test and M505test. Spearman correlation coefficient (rs [p < 0.05]) and a linear regression model were used to determine the relationship between COD performance and mechanical parameters of sprint (maximum power output [Pmax], maximum horizontal force production [F0] and maximum velocity application [V0]). Results: Results suggest that: (1) V0 is highly correlated with 505test [Professional (rs = −0.682, p < 0.01); Amateurs (rs = −0.721, p < 0.01); U18DH (rs = −0.736, p < 0.01); U18LN (rs = −0.569, p < 0.01)]; (2) F0 is strongly correlated to M505test F0—M505test [Professional (rs = −0.468, p < 0.05); Amateurs (rs = −0.690, p < 0.01); U18DH (rs = −0.642, p < 0.01); U18LN (rs = −0.658, p < 0.01)]; and (3) significant differences were observed in Professionals vs. U18LN comparison [505test (U = −37.7, p = 0.000); M505test (U = −26.9, p = 0.000)]. Conclusions: A significant relationship exists between strength levels and COD performance depending on task demands. Horizontal force (F0) is crucial in statics COD, while high-speed force production (V0) is decisive in dynamics COD. Finally, higher-level players demonstrate greater efficiency in COD.

1. Introduction

Change of direction (COD), defined as the ability to decelerate, change the direction and reaccelerate [1], is a determining factor in sports performance in soccer [2,3]. There are, on average, 80–100 CODs per player during a match, and the most frequent angle range in the COD is 45–180° [4]. Specifically, being able to perform a 180° COD quickly and efficiently is an essential skill in multidirectional team sports [5,6,7,8]. Among the most used evaluations to assess the 180° COD in soccer is the 505test [9,10,11], which highlights, among other tests [12], COD ability.
Change of direction speed [3,13] is considered a selective factor because the time available to perform a COD decreases as the competition level increases [14,15]. Players who display a faster COD performance show greater horizontal propulsive forces in less ground contact times and greater approach velocities [16]. Frequently, total time spent on the test (e.g., in a 505test, the timed section [5 m run—180° turn—5 m run] excluding the previous 10 m running section) is considered when evaluating COD performance, so the linear velocity may mask the real COD performance. As a solution to this problem, the COD deficit (CODD) was developed [17,18]. This term helps to interpret the COD evaluation, indicating the additional time required for a COD compared to a linear sprint of equivalent distance (e.g., 5 m run—180° turn—5 m run compared to 10 m linear sprint). Using CODD, coaches obtain an “isolated value” of COD ability, which means that this variable is neither influenced by the player’s acceleration nor by his linear speed [17,18].
Other determinant factors of COD performance are maximum force, power production and braking force [1]. These three factors have great importance in COD performance because, to generate a change in movement direction, a force application in a different direction is necessary [6,7,13,19,20]. Technical execution is also a determinant factor, which can reduce COD time and thus increase COD performance. Thus, less contact time on the floor [21], correct pelvic alignment [22] and the penultimate foot contact on the floor [23,24], among others, are technical keys that could influence COD performance, becoming more demanding as the competition level increases.
Many studies have tried to relate the levels of maximum strength and power production to COD performance [5,17,25,26]. Marcovic [26] attempted to establish this relationship in male physical education students using one-repetition maximum in squat (1RM-SQ), maximal isometric force in squat and power in squat jump (SJ), showing a poor relationship with COD performance. Later, Nimphius et al. [15] tried to establish a relationship between 1RM-SQ relative to body weight and COD performance, finding a strong relationship between both, but with a limited sample size (n = 10). More recently, studies such as those by Freitas et al. [5] and Loturco et al. [27], carried out with soccer players, showed a strong relationship between strength parameters (one-repetition maximum in the half-squat exercise (HS 1RM)), peak power (PP) in SJ and COD performance.
Usually, 180° COD performance has been related to vertical component strength variables [5,15,20,27]. Nevertheless, a recent study by Dos’Santos et al. [16] highlights how important it is to apply large and rapid horizontal force levels over short contact times to increase 180° COD performance. The FV relationship during sprint allows objective quantification of maximum horizontal power output (Pmax), as well as maximum horizontal force output (F0) and maximum running velocity (V0), normalized to bodyweight. These factors create the horizontal force–velocity profile (Hzt FV profile) developed by Samozino et al. [28]. In this way, the mechanical parameters of the Hzt FV profile may add detailed information on 180° COD performance because of the important and relevant role of horizontal force production and efficiency during the acceleration phase [29,30,31].
The Hzt FV profile has received high research attention; previous studies [29,32,33] have shown an association between the mechanical parameters of sprint and COD performance, showing how sprint mechanical abilities can affect COD performance due to the importance of the acceleration phase [25]. Specifically, the aim of the present study was to investigate the relationship between the mechanical parameters of the Hzt FV profile, obtained from sprint running, and COD performance in soccer players, comparing different categories to know how playing level could affect the above-mentioned parameters. First, it was hypothesized that the mechanical variable of the sprint F0 would be more related to performance in the “modified 505test”, while V0 would be more related to performance in the “505test” due to the prevalence of the horizontal component during force application. Second, it was hypothesized that CODD could be conditioned by the mechanical parameters of the Hzt FV profile, especially by F0, due to the deceleration and reacceleration demands of a 180° COD. Finally, it was hypothesized that differences between groups in COD performance due to higher competition level would result in less time needed to perform COD. So, higher category players should have a better COD performance than their counterparts.

2. Materials and Methods

2.1. Participants

Seventy-seven (n = 77) male soccer players (height = 178.2 ± 6.2 cm; body mass = 71.1 ± 6.5 kg) separated into groups (Professional, n = 20 [age = 22.2 ± 2.3 years; height = 178.2 ± 4.88 cm; body mass = 71.97 ± 6.58 kg]; Amateurs, n = 12 [age = 23.9 ± 3.7 years; height = 179.42 ± 7.79 cm; body mass = 74.64 ± 5.33 kg]; U18 DH (1st Spanish youth league), n = 21 [age = 17.43 ± 0.6 years; height = 177.29 ± 6.47 cm; body mass = 69.50 ± 6.59 kg]; U18 LN (2nd Spanish youth league), n = 24 [age = 17.42 ± 0.58 years; height = 176.83 ± 4.37 cm; body mass = 70.02 ± 6.69 kg]) participated voluntarily in this study. No player showed any injury or condition that could impact their performance in the test. All participants were briefed about the study’s potential risks and advantages, providing written consent before commencement. For U18 players, the informed consent was signed by a legal representative. Players were directed to refrain from vigorous exercise within the 24 h preceding each testing day.

2.2. Experimental Design

A cross-sectional study was designed to compare the horizontal force–velocity (Hzt FV) profile with the change-of-direction (COD) performance to explore whether the mechanical parameters of the sprint could discriminate between players with dissimilar COD abilities, along with the technical ability required to perform a COD. The study consisted of an experimental session. All players underwent a 10-min standardized warm-up, which included 5 min of jogging, 5 min of lower limb dynamic stretching and three progressive sprints of 30 m at 50%, 70% and 90% of their maximal self-selected effort [34].
Following a 4-min rest after the warm-up, the Hzt FV profile during sprinting was determined. Subsequently, the 505test and M505test were conducted. Subjects rested for 5 min between each assessment. All players performed two attempts for each COD test, with a 3-min rest between attempts. All assessment sessions took place consistently on identical terrain during late afternoons and early evenings, specifically between 14:00 and 19:00 h. This timeframe seems optimal for achieving maximum performance in coordination, reaction time, cardiovascular efficiency and muscle strength [35].

2.3. Testing Procedures

2.3.1. Horizontal Force–Velocity Profile

Players performed 3 maximal sprints of 30 m, from crouching position with no hands on the ground to avoid initial recoil movement, resting 4 min between each sprint. The fastest sprint was selected for analysis. Sprint performance was measured using a radar device (Stalker ATS II, Applied Concepts, Dallas, TX, USA) at 46.9 Hz to collect velocity–time data. The radar device was attached to a tripod at a height of 1 m, corresponding approximately to the height of the player’s center of mass. An inverse dynamic analysis was applied to the center of mass of the body to determine the mechanical parameters of the Hzt FV profile (F0, V0 and Pmax) through velocity–time data, as validated by Samozino et al. [28]. Raw velocity data were adjusted by a least square’s regression mono-exponential function. Ground reaction forces (GRF) from horizontal acceleration were computed from velocity changes over time in combination with body mass and aerodynamic drag force [28]. Modelling individual FV relationships, F0 and V0 (corresponding to the x- and y-axis intercepts, respectively) and Pmax (F0·V0/4) values were determined and normalized to body mass.

2.3.2. Change of Direction

COD ability was evaluated by a 505test [12] and an M505test [36] on the dominant leg using Witty System timing gates (Microgate, Bolzano, Italia) in accordance with the setup instructions described in Taylor et al. [35] and Dos’Santos, McBurnie, et al. [16]. Two attempts were performed on each test, resting 3 min between each attempt. The fastest score achieved during each test was selected for analysis. The timing was accurate to the nearest 0.01 s.
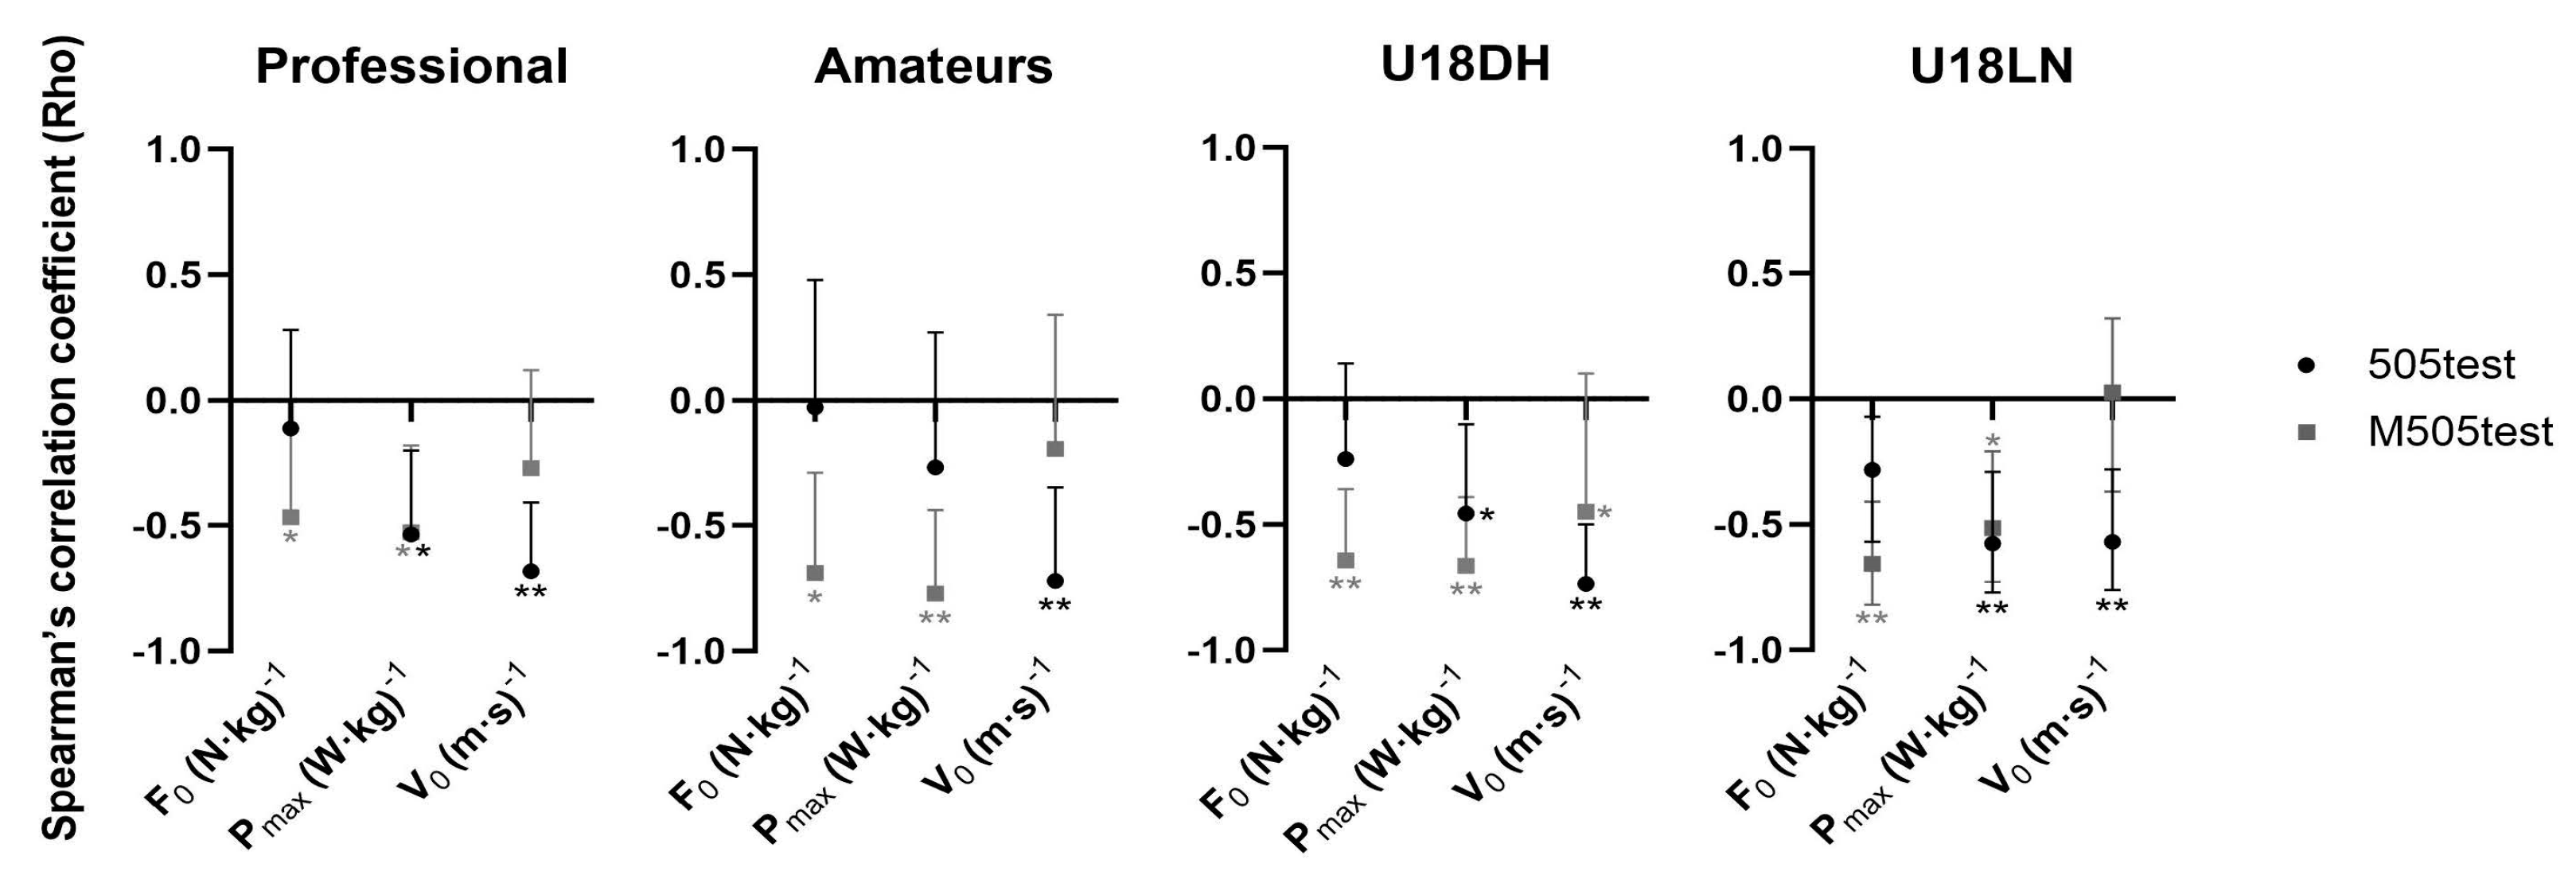
  • 505test: Two timing gates were positioned 5 m away from a specified turning point. Athletes began from a stationary position, using their preferred foot positioned on the start-line, 10 m from the timing gates and 15 m from the turning point [12]. Participants were directed to rapidly accelerate through the timing gates, pivot at the designated turning point on their dominant leg over the line and reaccelerate, returning through the timing gates.
  • M505test: Two timing gates were positioned 5 m away from a specific turning point. In contrast to the 505test, players began in a stationary position, using their preferred foot positioned on the start-line, 1 m behind the timing gates (5 m from the turning point) [16,36]. Participants were instructed to accelerate rapidly through the timing gates, pivot at the designated turning point on their dominant leg over the line and reaccelerate, returning through the timing gates.

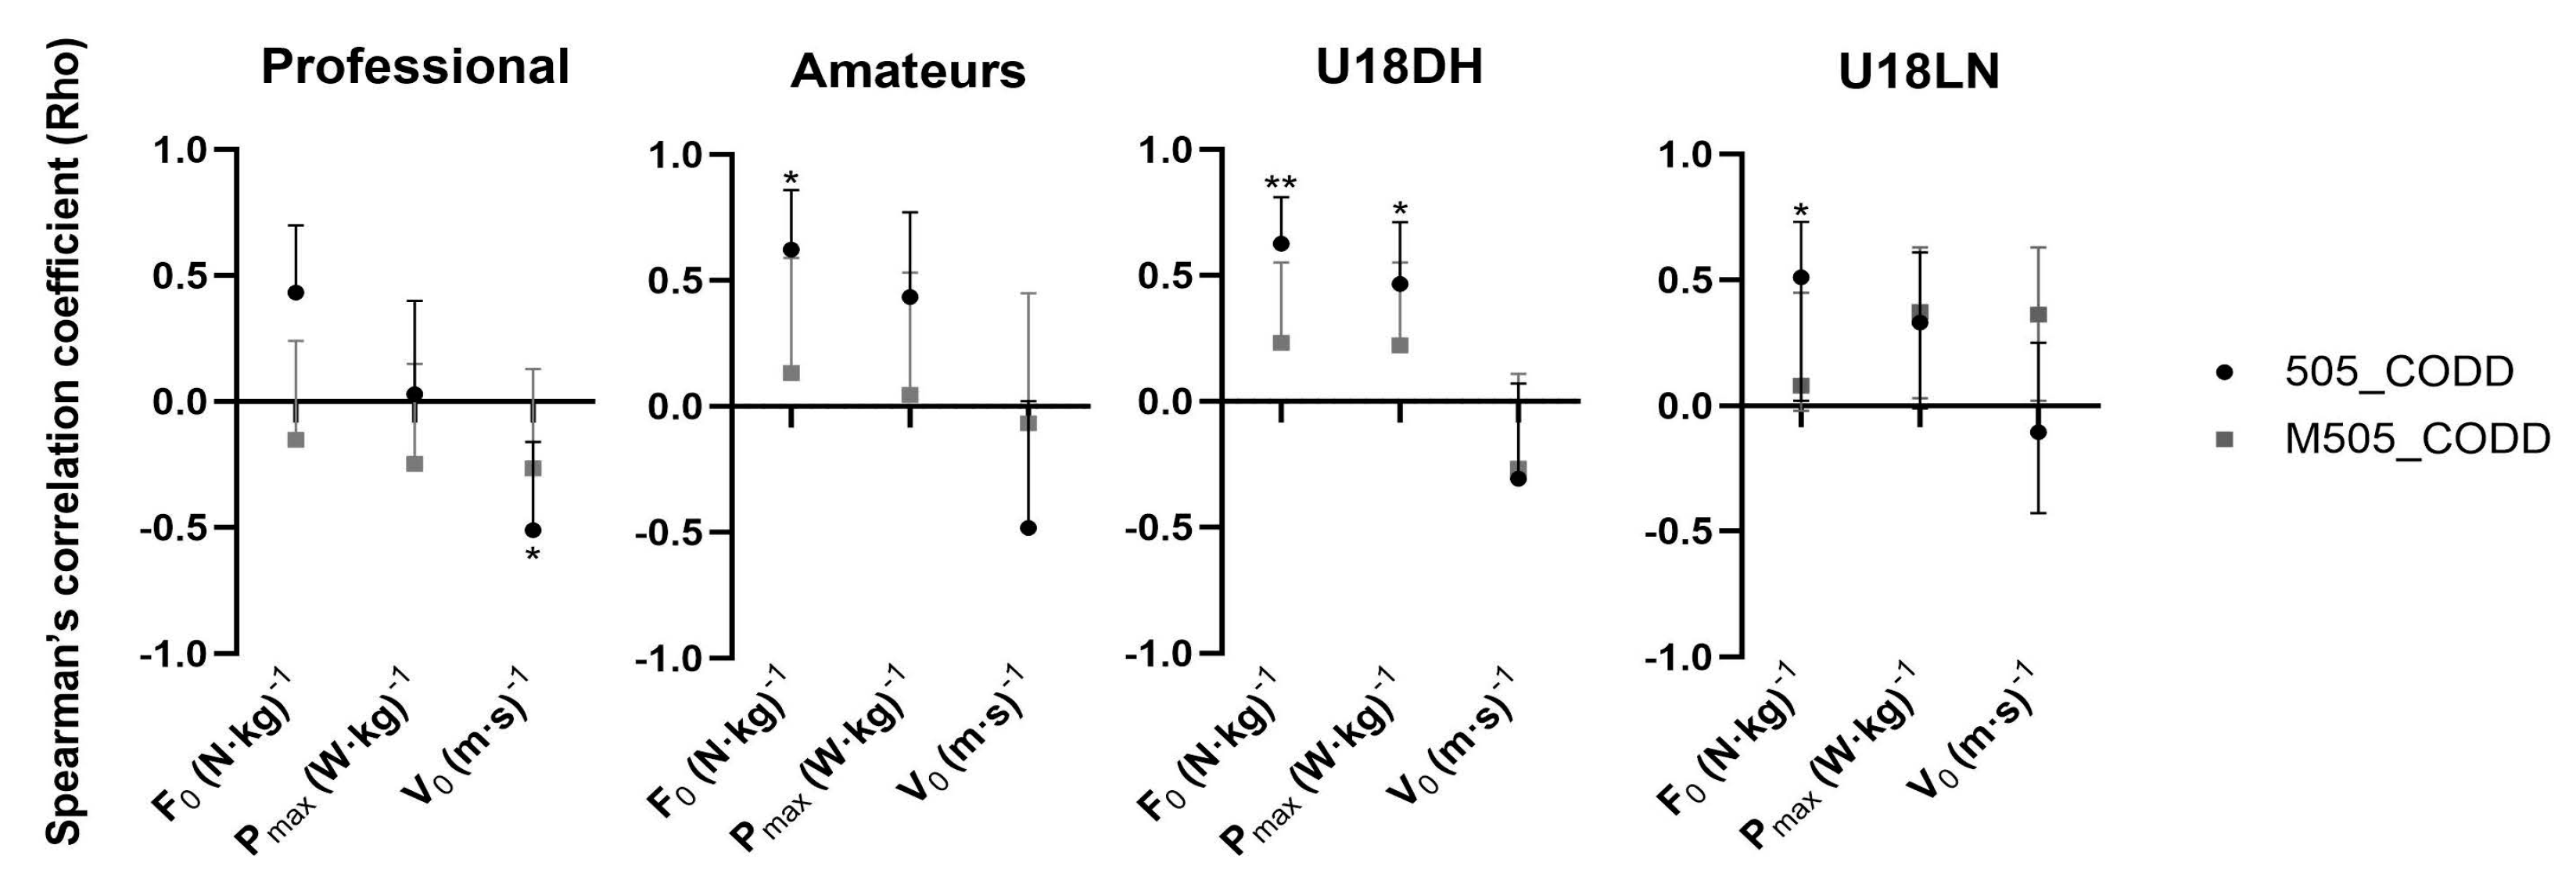
2.3.3. Change of Direction Deficit

The CODD was calculated on the dominant leg in the M505test and 505test, following the instructions developed by Nimphius et al. [17,18], providing a measure of COD ability independent of linear speed. The CODD was calculated by the formula: COD test time—10-m time (extracted from the Hzt FV profile).

2.3.4. Statistical Analysis

Descriptive data are presented as mean and standard derivation. Sample normality was tested using the Shapiro–Wilk test. Spearman’s correlation coefficient (Rho) was used to determine the relationship between COD performance and the mechanical parameters of the sprint (F0, V0, Pmax) due to sample abnormality. The correlations obtained were interpreted as follows: trivial (r < 0.1), small (r = 0.1–0.3), moderate (r = 0.3–0.5), large (r = 0.5–0.7), very large (r = 0.7–0.9) and perfect (r > 0.9). Kruskal–Wallis and U Mann–Whitney test were used to compare differences between groups. A multiple linear regression model was used to explore the possibility to predict COD performance based on Hzt FV profile (F0, V0, Pmax). The level of significance was set at p ≤ 0.05. Data were analyzed using the software package SPSS Statistics v.25 (SPSS Inc., Chicago, IL, USA).

3. Results

Table 1 presents the descriptive data of the mechanical parameters of the Hzt FV profile and COD performance tests expressed as mean ± SD.
Using the Kruskal–Wallis test, significant differences were found between the study groups for all variables tested [F0 (X2 = 14.94, p = 0.002); Pmax (X2 = 10.83, p = 0.013); T10m (X2 = 11,36 p = 0.010); 505test (X2 = 32.85, p = 0.000); M505test (X2 = 17.53, p = 0.001); 505_CODD (X2 = 18.73, p = 0.000); M505_CODD (X2 = 8.82, p = 0.032)] except for the variable V0 (X2 = 0.86, p = 0.835).
In addition, using the U Mann–Whitney test, significant differences were found in the following group comparisons: F0 [U18LN (n = 24)—Professional (n = 20), U = 25.4, p = 0.001]; Pmax [U18LN (n = 24)—Professional (n = 20), U = 21.9, p = 0.007]; T10m [U18LN (n = 24)—Professional (n = 20), U = −22.4, p = 0.006]; 505test [U18LN (n = 24)—Professional (n = 20), U = −37.7, p = 0.000], [U18LN (n = 24)—Amateurs (n = 12), U = 25.75, p = 0.007], [U18LN (n = 24)—U18DH (n = 21), U = −22,714, p = 0.004]; M505test [U18LN (n = 24)—Professional (n = 20), U = −26.9, p = 0.000], [U18LN (n = 24)—Amateurs (n = 12), U = −21.25, p = 0.043]; and 505_CODD [U18LN (n = 24)—Professional (n = 20), U = −6.06, p = 0.000], [U18LN (n = 24)—Amateurs (n = 12), U = −21.43, p = 0.040].
Figure 1 shows the correlations between the mechanical variables of the Hzt FV profile and both tests (505test and M505test) separated by groups. Significant and high correlation between V0—505test [Professional (rs = −0.682, p < 0.01); Amateurs (rs = −0.721, p < 0.01); U18DH (rs = −0.736, p < 0.01); U18LN (rs = −0.569, p < 0.01)] and between F0—M505test [Professional (rs = −0.468, p < 0.05); Amateurs (rs = −0.690, p < 0.01); U18DH (rs = −0.642, p < 0.01); U18LN (rs = −0.658, p < 0.01)] could be highlighted.
Figure 2 displays the correlations between CODD and the mechanical variables of the Hzt FV profile separated by groups. Significant and high correlations between V0—505_CODD in the Professional group (rs = −0.511, p < 0.05) and between F0—505_CODD [Amateurs (rs = 0.622, p < 0.05); U18DH (rs = 0.626, p < 0.01); U18LN (rs = 0.510, p < 0.01)] could be highlighted.
Table 2 displays the explanatory parameters from the multiple linear regression analysis employed to determine the relevance of the variables of Hzt FV profile on the performance prediction in the different tests analyzed.
It should be noted that no predictive models were developed concerning the M505_CODD variable due to the non-existence of any significant relationships with the parameters of the Hzt FV profile.

4. Discussion

The aim of the present study was to investigate the relationship between the mechanical parameters of the Hzt FV profile, obtained from sprint running, and the COD performance in professional soccer players from different categories. As expected in the initial hypothesis, the main findings from this work showed that higher levels of F0 and Pmax were directly related to better performance in the M505test, while higher levels of V0 were associated with superior performance in the 505test. Therefore, the results obtained in this study using horizontal component variables to evaluate force levels are consistent with those obtained in previous studies that used vertical component variables, supporting the suggestion that stronger and more powerful soccer players (i.e., higher F0 and Pmax, respectively) showed higher CODD [5,27,32].
Given the characteristics of the 505test, which includes a 10-m linear sprint before the start of the timed section (5 m), the player spends most of the time running linearly (69%) and a smaller part of the time changing direction (31%) [17,18]. However, the M505test is focused exclusively on the ability to accelerate and change direction consecutively over a very short distance (5 m) [16,36]. As the results show (Figure 1), depending on force application demands in each test, it can be noted that in a context where there is a prior entry velocity (as in the 505test), V0 becomes more important, due to the need to apply force at high velocity.
As hypothesized, the mechanical parameters of the Hzt FV profile were related to the performance in COD during the 505test and M505test. More specifically, F0 showed a large inverse relationship with the M505test [Professional (rs = −0.468, p < 0.05); Amateurs (rs = −0.690, p < 0.01); U18DH (rs = −0.642, p < 0.01); U18LN (rs = −0.658, p < 0.01)] due to the higher need to apply horizontal force in this test [16,35] when starting from a stationary position, while V0 showed a large inverse relationship [Professional (rs = −0.682, p < 0.01); Amateurs (rs = −0.721, p < 0.01); U18DH (rs = −0.736, p < 0.01); U18LN (rs = −0.569, p < 0.01)] with the 505test, where the subject starts the test with a previous speed (different from 0) acquired over an approach distance of 10 m, as the predominant force application demands change from horizontal to vertical force production [30].
The obtained results are in accordance with previous studies, such as that of Nimphius et al. [17], in which a strong relationship was shown between the performance in the 505test and 10-m sprint time (as a measure of acceleration) and 30-m sprint time (as a measure of maximum speed). In this case, acceleration (F0) and maximum speed (V0) variables were obtained directly from sprints through the Hzt FV profile parameters instead of using performance times in linear sprint as representations of acceleration and maximum speed capacities [17,18,25]. For this reason, in accordance with Baena-Raya et al. [29,32], the mechanical parameters of the Hzt FV profile could contribute to better understanding of these relationships by directly analyzing the influence of acceleration (F0) and maximum velocity (V0) on COD performance.
It is widely known that Pmax is a highly influential variable in sprint performance [37]. In this case, Pmax had a good relationship with performance in both tests (as shown in Figure 1) because this variable takes into consideration the better relationship from both F0 and V0 [38]. However, while for the M505test the variable with the highest relationship was Pmax (due to the need to generate high amounts of force and velocity over a very short distance), for the 505test, the variable with the greatest relationship was V0. This may be explained by the fact that the generation of high amounts of force and velocity has already taken place in the 10-m run-up to the start of the timed distance. Soccer players are largely adapted to this kind of situation due to the high acceleration demands over short distances during a match, which has led them to be able to attain a high percentage of their maximum speed (V0) over relatively short distances.
The second hypothesis was also confirmed. Previous research has shown a relationship between strength level and CODD, where players with higher strength levels have higher CODD [5,25]. As a novelty, in this study, the relationship with CODD was established using force variables produced in the horizontal direction (obtained through the Hzt FV profile). This outcome contrasts with previous studies, such as that of Loturco, Pereira, et al. [25], using vertical component variables (e.g., 1RM-SQ relative to body weight, HS-1RM, PP in SJ), or Freitas et al. [5], using acceleration rate (ACC) calculated as the rate of change in velocity with respect to the time over the section 0 to 5 m.
The results displayed a significant direct relationship between horizontal component variables (F0) and 505_CODD [Amateurs (rs = 0.622, p < 0.05); U18DH (rs = 0.626, p < 0.01); U18LN (rs = 0.510, p < 0.01)]. Previous studies such as those of Freitas et al. [5] and Loturco, Pereira, et al. [25] showed similar results. However, the higher performance group (Professional) showed a stronger inverse association between V0 and 505_CODD (rs = −0.511, p < 0.05), which indicates that higher ability to apply force at high velocities (shorter time available) may lead to a lower CODD. In contrast, the remaining lower-level groups (Amateurs, U18DH and U18LN) will need a longer time to apply the same force as the Professional group, which translates into an increase in CODD due to a lower efficiency in force application.
For this reason, the results obtained in the current study show significant differences when comparing 505_CODD between Professional and U18LN player groups. In contrast to findings from the above-mentioned studies, players with higher acceleration capacity (F0) presented better CODD efficiency. This could be due to the major role played by the management of horizontal force production during acceleration. In sports where COD is predominant, as in soccer, higher F0 levels may be essential for increased performance. As the results show, players with higher F0 are those who present lower CODD (specifically 505_CODD), given that the technical ability to apply horizontal force during acceleration plays a crucial role [30,31].
As can be appreciated, significant differences in COD performance were found. The most notable differences could be appreciated between the group of higher competition level and the lower competition level group [505test [U18LN (n = 24)—Professional (n = 20), U = −37.7, p = 0.000], M505test [U18LN (n = 24)—Professional (n = 20), U = −26.9, p = 0.000], 505_CODD [U18LN (n = 24)—Professional (n = 20), U = −6.06, p = 0.000]], among others, corroborating the third hypothesis, which expected to find COD performance differences due to competition level and demands.
In this way, F0, Pmax and V0 could become good indicators for the evaluation and improvement of COD performance, as it is known that these can be improved through training [33]. Together with the use of the CODD as a COD performance assessment variable because of the greater isolation of the COD action [17,18], these could be two very useful tools for coaches due to the large amount of information provided in combination. These findings may help coaches and researchers to understand and create more effective strategies to improve COD performance by understanding the characteristics and needs of each player.
In summary, a direct and significant relationship can be observed between strength levels and performance in change of direction. This relationship varies based on the demands. When the change of direction occurs from a static position, the capacity for horizontal force application (F0) is crucial, whereas when the change of direction happens in motion with prior velocity, the application of force at high speed (V0) becomes more decisive. Additionally, there are differences in change of direction performance based on competition level. Higher-level players typically exhibit greater efficiency in change of direction compared to lower-level players.

Author Contributions

Conceptualization, S.S.-L., A.L.-S., M.O.-B., P.J.-R. and M.A.R.-P.; methodology, S.S.-L., A.L.-S., M.O.-B., P.J.-R. and M.A.R.-P.; validation, S.S.-L., A.L.-S., M.O.-B., P.J.-R. and M.A.R.-P.; formal analysis, S.S.-L.; investigation, S.S.-L., A.L-.S. and M.A.R.-P.; resources, M.O.-B., P.J.-R. and M.A.R.-P.; data curation, S.S.-L., M.O.-B. and M.A.R.-P.; writing—original draft preparation, S.S.-L. and A.L.-S.; writing—review and editing, S.S.-L., A.L.-S., M.O.-B., P.J.-R. and M.A.R.-P.; visualization, S.S.-L.; supervision, M.O.-B., P.J.-R. and M.A.R.-P. All authors have read and agreed to the published version of the manuscript.

Funding

This research received no external funding.

Institutional Review Board Statement

The study was conducted in accordance with the Declaration of Helsinki and approved by the Ethics Committee of the University of Almeria (UALBIO2019/041).

Informed Consent Statement

Informed consent was obtained from all subjects involved in the study.

Data Availability Statement

The data that support the findings of this study are available from the corresponding author, Ortega-Becerra, M., upon reasonable request. The data are not publicly available due to privacy.

Acknowledgments

We are grateful for the help and trust of all the sports practitioners, coaches and researchers who have helped us to develop this study throughout the data collection process, giving us their best efforts, voluntarily and enthusiastically, during testing.

Conflicts of Interest

The authors declare no conflict of interest.

References

  1. Sheppard, J.M.; Young, W.; Doyle, T.; Sheppard, T.; Newton, R.U. An evaluation of a new test of reactive agility and its relationship to sprint speed and change of direction speed. J. Sci. Med. Sport 2006, 9, 342–349. [Google Scholar] [CrossRef]
  2. Brughelli, M.; Cronin, J.; Levin, G.; Chaouachi, A. Understanding change of direction ability in sport: A review of resistance training studies. Sport. Med. 2008, 38, 1045–1063. [Google Scholar] [CrossRef] [PubMed]
  3. Suarez-Arrones, L.; Gonzalo-Skok, O.; Carrasquilla, I.; Asián-Clemente, J.; Santalla, A.; Lara-Lopez, P.; Núñez, F.J. Relationships between Change of Direction, Sprint, Jump, and Squat Power Performance. Sports 2020, 8, 38. [Google Scholar] [CrossRef] [PubMed]
  4. Dos’Santos, T.; Thomas, C.; Comfort, P.; Jones, P.A. The Effect of Angle and Velocity on Change of Direction Biomechanics: An Angle-Velocity Trade-Off. Sport. Med. 2018, 48, 2235–2253. [Google Scholar] [CrossRef] [PubMed]
  5. Freitas, T.T.; Pereira, L.A.; Alcaraz, P.E.; Arruda, A.F.S.; Guerriero, A.; Azevedo, P.H.S.M.; Loturco, I. Influence of strength and power capacity on change of direction speed and deficit in elite team-sport athletes. J. Hum. Kinet. 2019, 68, 167–176. [Google Scholar] [CrossRef] [PubMed]
  6. Pereira, L.A.; Nimphius, S.; Kobal, R.; Kitamura, K.; Turisco, L.A.; Orsi, R.C.; Abad, C.C.C.; Loturco, I. Relationship between change of direction, speed, and power in male and female national olympic team handball athletes. J. Strength Cond. Res. 2018, 32, 2987–2994. [Google Scholar] [CrossRef]
  7. Spiteri, T.; Nimphius, S.; Hart, N.H.; Specos, C.; Sheppard, J.M.; Newton, R.U. Contribution of strength characteristics to change of direction and agility performance in female basketball athletes. J. Strength Cond. Res. 2014, 28, 2415–2423. [Google Scholar] [CrossRef]
  8. Thomas, C.; Dos’Santos, T.; Comfort, P.; Jones, P.A. Comparison of Change of Direction Speed Performance and Asymmetries between Team-Sport Athletes: Application of Change of Direction Deficit. Sports 2018, 6, 174. [Google Scholar] [CrossRef]
  9. Bishop, C.; Brashill, C.; Abbott, W.; Read, P.; Lake, J.; Turner, A. Jumping Asymmetries Are Associated With Speed, Change of Direction Speed, and Jump Performance in Elite Academy Soccer Players. J. Strength Cond. Res. 2021, 35, 1841–1847. [Google Scholar] [CrossRef]
  10. Cuthbert, M.; Thomas, C.; Dos’Santos, T.; Jones, P.A. Application of Change of Direction Deficit to Evaluate Cutting Ability. J. Strength Cond. Res. 2019, 33, 2138–2144. [Google Scholar] [CrossRef]
  11. Kadlubowski, B.; Keiner, M.; Hartmann, H.; Wirth, K.; Frick, U. The Relationship between Change of Direction Tests in Elite Youth Soccer Players. Sports 2019, 7, 111. [Google Scholar] [CrossRef] [PubMed]
  12. Draper, J.; Lancaster, M. The 505 test: A test for agility in the horizontal plane. Aust. J. Sci. Med. Sport 1985, 17, 15–18. [Google Scholar]
  13. Spiteri, T.; Cochrane, J.L.; Hart, N.H.; Haff, G.G.; Nimphius, S. Effect of strength on plant foot kinetics and kinematics during a change of direction task. Eur. J. Sport Sci. 2013, 13, 646–652. [Google Scholar] [CrossRef] [PubMed]
  14. Buchheit, M.; Haydar, B.; Ahmaidi, S. Repeated sprints with directional changes: Do angles matter? J. Sport. Sci. 2012, 30, 555–562. [Google Scholar] [CrossRef] [PubMed]
  15. Nimphius, S.; McGuigan, M.; Newton, R.U. Relationship between strength, power, speed, and change of direction performance of female softball players. J. Strength Cond. Res. 2010, 24, 885–895. [Google Scholar] [CrossRef] [PubMed]
  16. Dos’Santos, T.; McBurnie, A.; Thomas, C.; Comfort, P.; Jones, P.A. Biomechanical Determinants of the Modified and Traditional 505 Change of Direction Speed Test. J. Strength Cond. Res. 2019, 34, 1285–1296. [Google Scholar] [CrossRef]
  17. Nimphius, S.; Callaghan, S.J.; Spiteri, T.; Lockie, R.G. Change of Direction Deficit: A More Isolated Measure of Change of Direction Performance Than Total 505 Time. J. Strength Cond. Res. 2016, 30, 3024–3032. [Google Scholar] [CrossRef]
  18. Nimphius, S.; Geib, G.; Spiteri, T.; Carlisle, D. “Change of Direction Deficit” Measurement in Devision I American Football PLayers. J. Aust. Strength Cond. 2013, 21, 115–117. [Google Scholar]
  19. Sheppard, J.; Young, W. Agility literature review: Classifications, training and testing. J. Sport. Sci. 2006, 24, 919–932. [Google Scholar] [CrossRef]
  20. Jones, P.; Bampouras, T.; Marrin, K. An investigation into the physical determinants of change of direction speed. J. Sport. Med. Phys. Fit. 2009, 49, 97–104. [Google Scholar]
  21. Peterson, M.D.; Alvar, B.A.; Rhea, M.R. The contribution of maximal force production to explosive movement among young collegiate athletes. J. Strength Cond. Res. 2006, 20, 867–873. [Google Scholar] [PubMed]
  22. Green, B.; Blake, C.; Caulfield, B. A comparison of cutting technique performance in rugby union players. J. Strength Cond. Res. 2011, 25, 2668–2680. [Google Scholar] [CrossRef] [PubMed]
  23. Marshall, B.M.; Franklyn-Miller, A.D.; King, E.A.; Moran, K.A.; Strike, S.C.; Falvey, É.C. Biomechanical factors associated with time to complete a change of direction cutting maneuver. J. Strength Cond. Res. 2014, 28, 2845–2851. [Google Scholar] [CrossRef] [PubMed]
  24. Dos’Santos, T.; Thomas, C.; Comfort, P.; Jones, P.A. Role of the Penultimate Foot Contact During Change of Direction. Strength Cond. J. 2019, 41, 87–104. [Google Scholar] [CrossRef]
  25. Loturco, I.; Pereira, L.A.; Freitas, T.T.; Alcaraz, P.E.; Zanetti, V.; Bishop, C.; Jeffreys, I. Maximum acceleration performance of professional soccer players in linear sprints: Is there a direct connection with change-of-direction ability? PLoS ONE 2019, 14, e0216806. [Google Scholar] [CrossRef]
  26. Marcovic, G. Poor relationship between strength and power qualities and agility performance. J. Sport. Med. Phys. Fit. 2007, 47, 276–283. [Google Scholar]
  27. Loturco, I.; Jeffreys, I.; Abad, C.C.C.; Kobal, R.; Zanetti, V.; Pereira, L.A.; Nimphius, S. Change-of-direction, speed and jump performance in soccer players: A comparison across different age-categories. J. Sport. Sci. 2019, 38, 1279–1285. [Google Scholar] [CrossRef]
  28. Samozino, P.; Rabita, G.; Dorel, S.; Slawinski, J.; Peyrot, N.; de Villarreal, E.S.; Morin, J.-B. A simple method for measuring power, force, velocity properties, and mechanical effectiveness in sprint running. Scand. J. Med. Sci. Sport. 2016, 26, 648–658. [Google Scholar] [CrossRef]
  29. Baena-Raya, A.; Rodríguez-Pérez, M.A.; Jiménez-Reyes, P.; Soriano-Maldonado, A. Maximizing acceleration and change of direction in sport: A case series to illustrate how the force-velocity profile provides additional information to that derived from linear sprint time. Int. J. Environ. Res. Public Health 2021, 18, 6140. [Google Scholar] [CrossRef]
  30. Morin, J.B.; Gimenez, P.; Edouard, P.; Arnal, P.; Jiménez-Reyes, P.; Samozino, P.; Brughelli, M.; Mendiguchia, J. Sprint acceleration mechanics: The major role of hamstrings in horizontal force production. Front. Physiol. 2015, 6, 404. [Google Scholar] [CrossRef]
  31. Morin, J.B.; Edouard, P.; Samozino, P. Technical ability of force application as a determinant factor of sprint performance. Med. Sci. Sport. Exerc. Sci. Sport. Exerc. 2011, 43, 1680–1688. [Google Scholar] [CrossRef] [PubMed]
  32. Baena-Raya, A.; Soriano-Maldonado, A.; Conceição, F.; Jiménez-Reyes, P.; Rodríguez-Pérez, M.A. Association of the vertical and horizontal force-velocity profile and acceleration with change of direction ability in various sports. Eur. J. Sport Sci. 2020, 21, 1659–1667. [Google Scholar] [CrossRef]
  33. Baena-Raya, A.; Jiménez-Reyes, P.; Romea, E.S.; Soriano-Maldonado, A.; Rodríguez-Pérez, M.A. Gender-Specific Association of the Sprint Mechanical Properties With Change of Direction Performance in Basketball. J. Strength Cond. Res. 2021, 36, 2868–2874. [Google Scholar] [CrossRef]
  34. Morin, J.B.; Petrakos, G.; Jiménez-Reyes, P.; Brown, S.; Samozino, P.; Cross, M. Very-heavy sled training for improving horizontal-force output in soccer players. Int. J. Sport. Physiol. Perform. 2017, 12, 840–844. [Google Scholar] [CrossRef] [PubMed]
  35. Manfredini, R.; Manfredini, F.; Fersini, C.; Francesco, C. Circadian rhythms, athletic performance, and jet lag. Br. J. Sport. Med. 1998, 32, 101–106. [Google Scholar] [CrossRef] [PubMed]
  36. Taylor, J.M.; Cunningham, L.; Hood, P.; Thorne, B.; Irvin, G.; Weston, M. The reliability of a modified 505 test and change-of-direction deficit time in elite youth football players. Sci. Med. Footb. 2019, 3, 157–162. [Google Scholar] [CrossRef]
  37. Morin, J.B.; Bourdin, M.; Edouard, P.; Peyrot, N.; Samozino, P.; Lacour, J.R. Mechanical determinants of 100-m sprint running performance. Eur. J. Appl. Physiol. 2012, 112, 3921–3930. [Google Scholar] [CrossRef]
  38. Morin, J.B.; Samozino, P. Interpreting power-force-velocity profiles for individualized and specific training. Int. J. Sport. Physiol. Perform. 2016, 11, 267–272. [Google Scholar] [CrossRef]
Figure 1. Correlations between 505test, M505test and the mechanical variables of Hzt FV profile (F0, V0 and Pmax). * Correlation is significant (p < 0.05). ** Correlation is significant (p < 0.01). Confidence interval at 90%; F0 = maximum horizontal force production; Pmax = maximum power output; V0 = maximum velocity application; N = newtons; W = watts; m = meters; s = seconds; kg = kilograms.
Applsci 13 12809 g001
Figure 2. Correlations between CODD (M505_CODD and 505_CODD) and the mechanical variables of Hzt FV profile (F0, V0 and Pmax). * Correlation is significant (p < 0.05). ** Correlation is significant (p < 0.01). Confidence interval at 90%. F0 = maximum horizontal force production; Pmax = maximum power output; V0 = maximum velocity application; N = newtons; W = watts; m = meters; s = seconds; kg = kilograms; M505_CODD = change of direction deficit in M505test; 505_CODD = change of direction deficit in 505test.
Applsci 13 12809 g002
Table 1. Mean and standard deviation (SD) of the mechanical capabilities of Hzt FV profile (F0, V0 and Pmax) and performance tests.
Hzt FV Profile
F0 (N·kg−1)Pmax (W·kg−1)V0 (m·s−1)T10m (s)
Professional7.31 ± 0.4316.42 ± 1.029.04 ± 0.331.73 ± 0.04
Amateurs6.92 ± 0.615.64 ± 1.49.11 ± 0.31.77 ± 0.07
U18DH7.1 ± 0.7315.86 ± 1.729.01 ± 0.441.76 ± 0.09
U18LN6.74 ± 0.4915.09 ± 1.379.02 ± 0.421.79 ± 0.07
Performance Tests
M505test (s)505test (s)M505_CODD (s)505_CODD (s)
Professional2.45 ± 0.092.21 ± 0.070.72 ± 0.070.49 ± 0.07
Amateurs2.48 ± 0.072.27 ± 0.090.70 ± 0.050.5 ± 0.11
U18DH2.50 ± 0.112.29 ± 0.080.74 ± 0.090.53 ± 0.09
U18LN2.57 ± 0.082.39 ± 0.070.77 ± 0.070.60 ± 0.08
Data are mean ± SD; F0 = maximum horizontal force production; Pmax = maximum power output; V0 = maximum velocity application; N = newtons; W = watts; m = meters; s = seconds; kg = kilograms; T10m = time in 10 m; M505test = modified 505test; M505_CODD = change of direction deficit in M505test; 505_CODD = change of direction deficit in 505test.
Table 2. Parameters of the explanatory multiple linear regression models generated with the mechanical variables of Hzt FV profile (F0, V0, Pmax) and performance test (M505test, 505test) as predicted variables.
505test
ProfessionalAmateurU18DHU18LN
Constant3.5502.2453.3793.149
F0 (N·kg−1) 0.29 (1.845)−0.027 (−0.253)
Pmax (W·kg−1) −0.127 (−1.877)
V0 (m·s−1)−0.148 (−0.660) −0.140 (−0.807)−0.084 (−0.448)
Adj. R2 (SEE)0.405 (0.05 s)0.385 (0.07 s)0.631 (0.04 s)0.204 (0.06 s)
ANOVA p value0.020.0460.0000.016
M505test
ProfessionalAmateurU18DHU18LN
Constant3.5113.0143.1313.230
F0 (N·kg−1) −0.078 (−0.693) −0.098 (−0.631)
Pmax (W·kg−1)−0.065 (−0.709) −0.40 (−0.656)
V0 (m·s−1)
Adj. R2 (SEE)0.476 (0.06 s)0.429 (0.05 s)0.401 (0.08 s)0.370 (0.06 s)
ANOVA p value0.0000.0120.0010.001
505_CODD
ProfessionalAmateurU18DHU18LN
Constant1.325−0.3191.2190.739
F0 (N·kg−1) 0.347 (1.8)
Pmax (W·kg−1)0.028 (0.4)−0.101 (−1.219)0.042 (0.761)0.042 (0.737)
V0 (m·s−1)−0.143 (−0.622) −0.15 (−0.703)−0.085 (−0.46)
Adj. R2 (SEE)0.312 (0.06 s)0.574 (0.07 s)0.698 (0.05 s)0.292 (0.06 s)
ANOVA p value0.0160.0090.0000.010
Data are multiple linear regression model raw-score constants (raw-score β standardized coefficients). Predicted variables are: 505test, M505test and 505_CODD. Adj. R2 = adjusted Pearson’s coefficient of determination; SEE = standard error of estimation; coefficient significance (p < 0.05); F0 = maximum horizontal force production; Pmax = maximum power output; V0 = maximum velocity application.
Disclaimer/Publisher’s Note: The statements, opinions and data contained in all publications are solely those of the individual author(s) and contributor(s) and not of MDPI and/or the editor(s). MDPI and/or the editor(s) disclaim responsibility for any injury to people or property resulting from any ideas, methods, instructions or products referred to in the content.

