Featured Application
Through a comprehensive comparison between the widely-used MSC spheroids and the newly-developed C-MSCs, this study sheds light on the distinct biological properties of each 3D cell culture method, advancing our understanding and potentially paving the way for more effective and versatile applications in MSC-based cell therapy.
Abstract
Background: Cells typically function and behave within a three-dimensional (3D) environment. Mesenchymal stem cells (MSCs), known for their self-renewal, multi-lineage differentiation capabilities, and paracrine effects, have garnered significant medical interest. MSC spheroid culture is widely adopted to study the biological properties of MSCs in a 3D context. In contrast, we previously developed 3D clumps of MSC/ECM complexes termed C-MSCs. C-MSCs consisted of cells and self-produced ECM proteins, allowing grafting into tissue defects without any artificial scaffolds. This present study aimed to elucidate the fundamental biological distinctions between 3D MSC spheroids and C-MSCs. Methods: MSC spheroids and C-MSCs are generated from human bone-marrow-derived MSCs. The physical properties, histological structures, and gene expression patterns were compared in vitro. Results: Macroscopic and histological examinations revealed that, whereas MSC spheroids are dense cell clusters primarily formed through Cadherin-mediated cell–cell interactions, C-MSCs are cell aggregates anchored by the ECM component COL1, enabling them to form larger structures. Furthermore, transcriptome analysis showed that C-MSCs possess enhanced capacities to produce immunomodulatory and cytoprotective factors, a prominent biological characteristic of MSCs. Conclusion: Recognizing the distinct attributes of each cell aggregate offers insights into the potential evolution of 3D cell culture techniques and possible therapeutic implications.
1. Introduction
In vitro cell culture systems have become indispensable tools in life science research. Historically, two-dimensional (2D) culturing on plastic plates has been favored due to its simplicity and cost-effectiveness. However, no substrate in living organisms closely resembles the rigidity of plastic. Furthermore, cells naturally function or behave in a three-dimensional (3D) environment, influenced by cell–cell contacts and interactions with the extracellular matrix (ECM). Thus, throughout the history of cell culture experiments, there has been a significant demand for developing 3D cell culture techniques that more accurately mimic in vivo cell behavior. A prominent example of this is the spheroid culture method [1]. The culturing of mouse pluripotent cells in suspension, leading to the formation of embryoid bodies (EB), can be considered the genesis of cell spheroid culture [2]. Notably, the 3D EB culture method through spheroid formation maintained the tri-lineage differentiation potential of pluripotent cells, facilitating embryonic development mimicry in vitro, which was challenging in 2D cultures [3,4,5]. Building on this success, spheroid cultures have been adapted for various somatic cells, leading to advancements in cellular biology and tissue engineering applications.
Mesenchymal stem cells (MSCs), identified from bone marrow, are renowned for their self-renewal and multi-lineage differentiation properties [6,7]. Anyway, recent studies demonstrated that MSCs exhibit paracrine effects through the production of cell-protective and immune-regulatory factors [8,9]. Consequently, there is great interest in tissue engineering and regenerative medicine grafting MSCs for bone or cartilage-destructive diseases and in MSC-based cell therapies targeting immune diseases. To reveal the biological properties of MSCs under 3D conditions and exert their optimal cellular function at the graft site, the spheroid culture method has been frequently employed [10,11]. MSC spheroids, formed by using the hanging drop method or non-adhesive plates, primarily consist of cell–cell contact molecules, such as cadherins [12,13]. Intriguingly, MSC spheroids, when compared to 2D cultured MSCs, exhibit a significantly increased production of cell-protective and immune-regulatory factors [14,15]. Moreover, it is also well reported that MSC spheroid culture positively affects cell viability and cell differentiation capacities more than a conventional 2D cell culture system [16,17].
On the other hand, we have originally developed a novel 3D culture technique, termed “clumps of MSCs/ECM complexes”. Unlike MSC spheroids, which are derived from cell suspension cultures, C-MSCs are formed from ECM-rich cell sheets. When the cellular sheets are detached from the plastic culture plate and maintained in the floating condition, they naturally contract and aggregate to form C-MSCs [18]. C-MSCs, approximately 1 mm in diameter, can be directly transplanted into bone defect sites without artificial materials, inducing effective bone regeneration [18,19]. Moreover, the bone regenerative capacities of C-MSCs can be regulated by osteogenic or chondrogenic inductions [20,21]. Similarly to MSC spheroids, C-MSCs also show increased production of cell-protective factors compared to the cells on 2D plastic culture plates [22].
As described above, both 3D cell culture systems, MSC spheroids, and C-MSCs offer advantages over 2D cultures. However, given their contrasting manufacturing methods, it is anticipated that there are inherent biological differences between MSC spheroids, primarily formed through cell–cell contacts, and C-MSCs, shaped mainly by cell-ECM interactions. To deepen the understanding regarding cultured MSCs, it is imperative to clarify the distinctive characteristics of these artificial scaffold-free 3D cell aggregates. Thus, this present study aimed to reveal biological capacities by comparing the physical properties such as size and cell density, histological structures, and gene expressions of MSC spheroids and C-MSCs.
2. Materials and Methods
2.1. Cell Cultures
Human bone marrow-derived MSCs were purchased from LONZA (LONZA, Basel, Switzerland). The cells were cultured in the growth medium composed of DMEM (Sigma-Aldrich, Osaka, Japan), 10% fetal bovine serum (FBS; Hyclone, Logan, UT, USA), 100 μg/mL streptomycin (Sigma-Aldrich), and 100 U/mL penicillin (Sigma-Aldrich).
To generate MSC spheroids, the hanging drop technique with minor modifications was employed [23]. Briefly, cells were suspended at concentrations of 2.5 × 10⁴, 5.0 × 10⁴, 10.0 × 10⁴, and 20.0 × 10⁴ cells in 20 μL of growth medium supplemented with 50 μg/mL L-ascorbic acid. These cell suspensions were then plated as hanging drops on the inner lid of a petri dish and incubated for 48 h. Once the cells aggregated, they were transferred to a 96-well ultra-low-binding plate (Corning Inc., Corning, NY, USA) and cultured for an additional 48 h. Finally, the cell aggregates were maintained in growth medium for 5 days to form MSC spheroids (Figure 1A; upper schematic image).
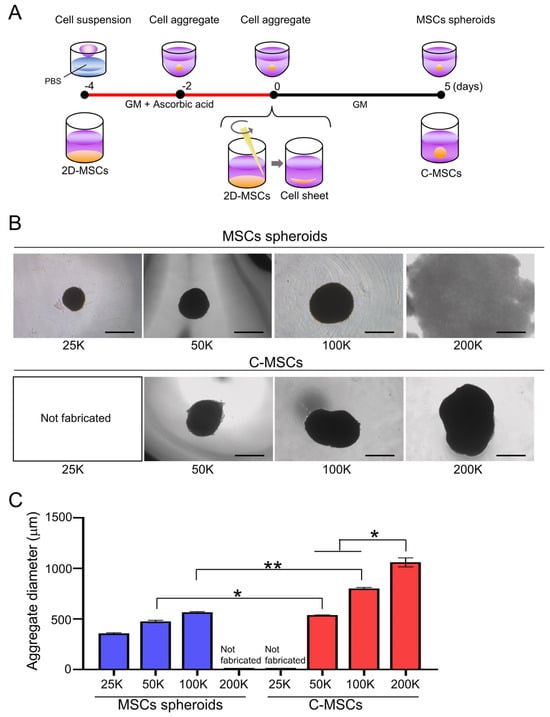
Figure 1.
(A) Schematic image of MSC spheroids and C-MSC culture schedule. (B,C) MSC spheroids and C-MSCs were generated from the indicated number of cells (within a range from 25,000 (25 K) to 200,000 (200 K) cells) as described in the Section 2. (B) Macroscopic images of each cell aggregate at day 5 are shown. (C) Graph indicates the average diameter of each aggregate calculated as (major diameter + minor diameter)/2. Values represent mean ± S.D. of four samples per group. * p < 0.05, ** p < 0.01 (ANOVA). All images and graphs are representative of three independent experiments.
C-MSCs were developed as previously reported [24]. Specifically, to produce C-MSCs of varying sizes, trypsinized MSCs were seeded onto 96-well, 48-well, and 24-well plates (Corning) at cell densities of 5.0 × 10⁴, 10.0 × 10⁴, and 20.0 × 10⁴ cells/well, respectively. The cells were cultured in a growth medium supplemented with 50 µg/mL L-ascorbic acid for 4 days. The confluent cells, which formed a cellular sheet consisting of ECM proteins, were detached from the culture plate by scratching the edge with a micropipette tip. The detached cellular sheets were then transferred to a 48-well ultra-low-binding plate (Corning) and maintained in a growth medium. To evaluate the efficiency of this transfer process from a 2D plastic plate to a 3D floating culture condition, the cell number before and after the transfer was assessed by trypsin dispersion. It was confirmed that 96.29 ± 4.79% of cells successfully transitioned to the floating condition, indicating a highly efficient transfer process. During the culture period, the floating cellular sheet contracted to form a round clump of cells. After 5 days of incubation, mature round cell aggregates, known as C-MSCs, were obtained (Figure 1A; lower schematic image).
2.2. Histological and Immunofluorescence Analyses of Cell Aggregates
MSC spheroids and C-MSCs were fixed with 4% paraformaldehyde and embedded in paraffin. Eight-micrometer-thick serial sections were prepared. The specimens were stained with hematoxylin and eosin (HE) and observed using a NIKON ECLIPSE E600 microscope (NIKON, Tokyo, Japan). TUNEL-positive apoptotic cells in the cell constructs were detected with the DeadEndTM Fluorometric TUNEL System (Promega, Madison, WI, USA) according to the manufacturer’s instructions. Fluorescence signals were detected by using a Leica STELLARIS laser scanning microscope (Leica Microsystems, Wetzlar, Germany).
For immunofluorescence staining, the fixed samples were embedded in Tissue-Tek OCT compound (Sakura, Torrance, CA, USA), and semi-serial cryostat sections (20 μm thickness) were prepared. The sections were blocked with Blocking One Histo (Nacalai Tesque, Inc., Kyoto, Japan), and were incubated with rabbit monoclonal anti-human COL1 IgG (EPR7785; Abcam, Cambridge, MA, USA) or rabbit monoclonal anti-human N-Cadherin IgG (D4R1H; Cell Signaling Technology, Beverly, MA, USA). The samples were then stained with Alexa Fluor 488 goat anti-rabbit IgG antibody (Thermo Fisher Scientific, Inc., Waltham, MA, USA) and Alexa Fluor 594® phalloidin (Thermo Fisher Scientific, Inc.) for 4 h at room temperature. DAPI (5 μg/mL; Thermo Fisher Scientific, Inc.) was employed to counterstain nuclei. The stained samples were observed using a Leica STELLARIS 5 confocal microscope (Leica Microsystems). The image analyses for fluorescence intensity and cell number were conducted using LAS X software (https://www.cellularimaging.nl/leica-las-x/ (accessed on 10 October 2023) (Leica Microsystems).
2.3. RNA-Seq Analysis
Total RNA was extracted from three distinct cell culture groups: (1) 2D cultures in 24-well plates seeded at 2.0 × 10⁵ cells/well (n = 3), (2) a set of eight MSC spheroids, each consisting of 2.5 × 10⁴ cells (n = 3), and (3) a single C-MSC formed from 2.0 × 10⁵ cells (n = 3). RNA extraction was carried out using RNA-iso (Takara, Otsu, Japan) and the concentration of the extracted RNA was quantified spectrophotometrically at wavelengths of 260 and 280 nm. The construction and sequencing of the cDNA library were carried out by the Beijing Genomics Institute using the DNBSEQ platform. The sequence data were filtered using SOAPnuke 1.5.2, and the clean reads were mapped to the reference genome using HISAT2 2.0.4. After performing alignment using Bowtie2 2.2.5, the expression levels of individual genes were quantified using RSEM 1.2.8. Differential expression analysis was conducted using DESeq2 1.16.1 with parameters of fold change ≥2 and adjusted p-value < 0.05. The sequence data analysis, including heatmap, Venn diagram, and Kyoto Encyclopedia of Genes and Genomes (KEGG) analysis, was conducted using BGI Dr. Tom 2.0.
2.4. RT-Quantitative Polymerase Chain Reaction (qPCR)
Total RNA was extracted as described in Section 2.3. RNA samples (500 ng) were reverse transcribed to cDNA using ReverTra Ace (Toyobo, Osaka, Japan). Quantitative PCR for PTGS2, TSG-6, and IL-1RN mRNA expression was then conducted using THUNDERBIRD Next SYBR qPCR Mix (Toyobo) and analyzed with the StepOne system (Applied Biosystems, Waltham, MA, USA). The PCR thermal profile consisted of an initial 10 min at 95 °C, followed by 40 cycles of 95 °C for 15 s and 60 °C for 1 min. Fold changes of the gene of interest were calculated with the ΔΔCt method using ribosomal protein 18S as reference control. Primer sequences are listed in Supplementary Table S1.
2.5. Statistical Analysis
Statistical analysis was carried out by using GraphPad Prism software 9.0 (GRAPHPAD Software Inc., San Diego, CA, USA). The two-tailed Student’s t-test was used to compare means between the two groups. For comparisons of more than three different groups, one-way ANOVA with Tukey–Kramer post hoc was conducted. A value of p < 0.05 or p < 0.01 was considered statistically significant.
3. Results
3.1. MSC Spheroids Are Dense, Compact Cell Aggregates, Whereas C-MSC, That Are Composed of Cells and Extracellular Matrices, Can Be Fabricated to a Larger Size
The size and morphology of the cell aggregates such as MSC spheroids and C-MSCs can be tightly controlled by the number of cells composing them. Thus, we initially fabricated MSC spheroids and C-MSCs using varying cell numbers. MSC spheroids could be generated from 25,000, 50,000, and 100,000 cells forming spherical structures (Figure 1B, upper panels). However, when using 200,000 cells with the hanging drop method, spherical morphogenesis was compromised, resulting in a destabilized, membrane-like structure. In contrast, C-MSCs consistently formed spherical structures, even at elevated cell numbers of 200,000, in addition to 50,000 and 100,000 cells (Figure 1B, lower panels). To generate smaller C-MSCs with fewer than 50,000 cells, it would be necessary to generate cell sheets from a 384-well culture plate. However, this method was technically challenging, leading us to forgo this approach in our study. The size of the cell aggregates increased in a cell-number-dependent manner for both MSC spheroids and C-MSCs (Figure 1C). Interestingly, when fabricated from equivalent cell counts, C-MSCs exhibited a markedly larger diameter compared to MSC spheroids. The C-MSCs derived from 200,000 cells were conspicuously larger compared to other cell aggregates (Figure 1C).
Given the variations in size and morphology between MSC spheroids and C-MSCs, it was speculated that C-MSCs might incorporate non-cellular elements, possibly matrix proteins, that contribute to their enlarged structure. Moreover, it is well reported that enlarged cell spheroids can experience central nutrient and oxygen deprivation, potentially leading to cellular apoptosis [25]. Accordingly, we next conducted a histological examination of MSC spheroids and C-MSCs. HE staining demonstrated that MSC spheroids generated from 25,000 or 50,000 cells exhibited a dense cellular organization (Figure 2A,C). However, the spheroids from 100,000 cells, although maintaining an external spherical appearance, exhibited disrupted internal architectures. This structural anomaly was accompanied by increased cell apoptosis in the 100,000-cell MSC spheroids, as demonstrated by TUNEL staining (Figure 2A,D). In contrast, all tested C-MSCs retained their 3D spherical integrity evidenced by HE staining. In addition to cellular components, non-cellular ECM elements were apparently observed within C-MSCs, substantiating their unique composition (Figure 2B). These observations are congruent with the semi-quantitative analysis of the cell numbers that the cellular density of C-MSCs was significantly lower than that of MSC spheroids (Figure 2C). Additionally, C-MSCs did not exhibit an augmented apoptotic cell number even at larger sizes, underscoring their structural and compositional stability (Figure 2B,D). These findings suggested that MSC spheroids, formed by densely aggregated cells, are stable when their size is small, whereas C-MSCs can be larger constructs consisting of both cells and the non-cellular ECM component. Accordingly, MSC spheroids derived from 25,000 cells and C-MSCs generated from 200,000 cells were selected for further analysis. This selection allows for a direct comparison under conditions where each type of 3D cellular construct exhibits its most stable and representative structural characteristics.
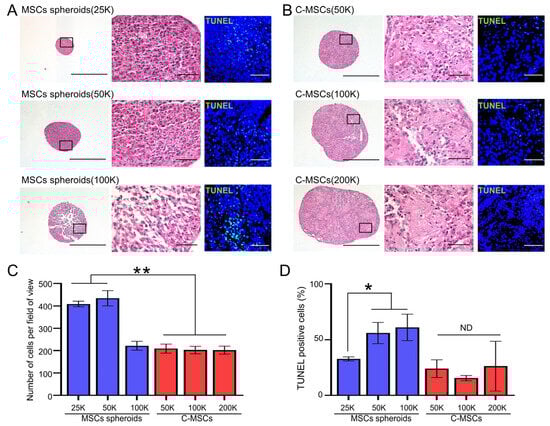
Figure 2.
(A,B) MSC spheroids (A) and C-MSCs (B) were generated from the indicated number of cells (within a range from 25,000 (25K) to 200,000 (200K) cells) as described in the Section 2. Subsequently, semi-serial sections were prepared, and H&E and TUNEL staining were performed. The left panels of H&E staining show lower magnification (bar = 500 µm), whereas magnified photos from the boxed regions are displayed in the right panels (bar = 50 µm). A similar magnification (bar = 50 µm) applies to the TUNEL staining images. (C) Graphs express the mean ± S.D. of the cell number derived from four views of magnified images for each cell aggregate. (D) Results display the percentage of TUNEL-positive apoptotic cells. Values represent mean ± S.D. of four tested samples. * p < 0.05, ** p < 0.01 (ANOVA). All images and graphs are representative of three independent experiments.
3.2. MSC Spheroids Primarily Rely on Cell–Cell Contacts Mediated by N-Cadherin, Whereas C-MSCs Are Predominantly Structured by the Extracellular Matrix, COL1
To investigate the key molecules that compose each cell aggregate, immunofluorescence staining for COL1, F-actin, and N-cadherin was conducted. The expression level of COL1, a primary ECM protein for stromal cells, was notably low in MSC spheroids (Figure 3A,C). Additionally, F-actin integrity appeared compromised in the inner cells of the spheroids, unlike the outer cells, suggesting limited matrices for cell attachment. In contrast, C-MSCs demonstrated abundant COL1 expression. Moreover, cells embedded within the COL1 exhibited pronounced F-actin fibers, indicating the cytoskeletal force generated by the vital matrices for the cells (Figure 3B,C). Meanwhile, N-cadherin, a representative molecule for cell–cell contacts in MSCs, was robustly and broadly expressed in MSC spheroids, though its expression was comparatively faint and scattered in C-MSCs (Figure 3A–C). These findings clearly indicated the discrepancy in the biological structure between these cell aggregates; MSC spheroids rely on cell–cell contact, whereas C-MSCs are formed by the ECM supporting the cells.
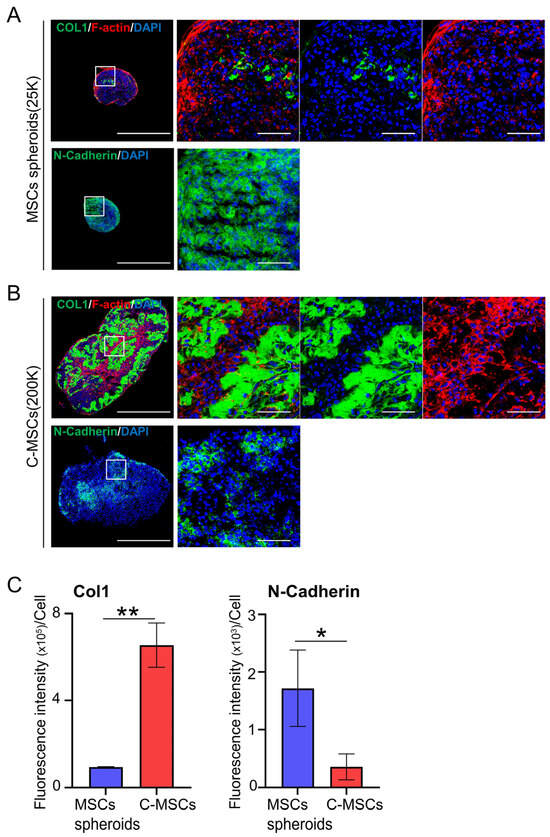
Figure 3.
(A,B) MSC spheroids (A) and C-MSCs (B) were generated from 25,000 (25K) and 200,000 (200K) cells, respectively. Sections were then immunostained with either COL1 (upper panels; green) or N-Cadherin (lower panels; green). F-actin (red) and nuclei (blue) were counterstained with phalloidin and DAPI, respectively. The left panels of immunostaining depict a lower magnification (bar = 500 µm), whereas magnified photos from the boxed regions are presented in the right panels (bar = 50 µm). (C) Graphs illustrate the mean ± S.D. of the green fluorescence intensity of either COL1 or N-Cadherin per cell. Values represent the mean ± S.D. from four images. * p < 0.05, ** p < 0.01 (t-test). All images and graphs are representative of three independent experiments.
3.3. Differential Gene Expression Patterns in MSC Spheroids and C-MSCs Cultured in 3D Aggregates
To uncover the distinctions in biological properties between MSC spheroids and C-MSCs, we performed whole transcriptome sequencing. Specifically, the experimental setup involved collecting RNA from 2D-cultured MSCs (200,000 cells) on a 24-well plate, eight MSC spheroids (25,000 cells each) in an ultra-low-binding 24-well plate, and a single C-MSC aggregate (200,000 cells) in a similar plate, which was then subjected to RNA-seq (Figure 4A). We first assessed the typical biological capacities of MSC, including immunomodulatory and cell protective factor expressions, as well as osteogenic, adipogenic, and chondrogenic differentiation potential. Both MSC spheroids and C-MSCs demonstrated elevated expressions of immunomodulatory and cell protective factors compared to their 2D counterparts. Interestingly, C-MSCs had a more pronounced increase in these genes than MSC spheroids (Figure 4B and Supplementary Figure S1). However, the expression of trilineage differentiation genes remained unchanged, suggesting that 3D aggregation alone does not promote differentiation. In addition, qPCR analysis of PTGS2, TSG-6, and IL-1RN gene expression revealed consistent mRNA expression patterns with those observed in the RNA-seq heatmap data (Supplementary Figure S2), validating the results of our RNA-seq analysis. The volcano plot analysis revealed that 2043 mRNAs were differentially expressed between MSC spheroids and C-MSCs (Figure 4C). Then, gene ontology (GO) analysis on 1035 genes highly expressed in MSC spheroids and 1008 genes elevated in C-MSCs was conducted to assess the biological characteristics in each cell aggregate. The results indicated that genes predominantly expressed in MSC spheroids were mainly associated with “cell adhesion”, whereas “cytokine-mediated signaling pathway” was the most enriched category for C-MSCs in the GO analysis pertaining to cellular processes (Figure 4D). To further elucidate the characteristics of MSC spheroids and C-MSCs in a 3D environment, we included 2D-cultured MSCs for a comparative gene expression study. Venn diagram analysis highlighted a set of 623 genes that showed significant differences among 2D MSCs, MSC spheroids, and C-MSCs, representing the intersection in the diagram (Figure 4E). The clustergram analysis clearly showed differences in gene expression among 2D MSCs, MSC spheroids, and C-MSCs (Figure 4F). For the identified 623 genes, we performed a gene set enrichment analysis (GSEA) for the KEGG pathway, comparing C-MSCs with MSC spheroids. In line with the GO analysis in Figure 4D, the “cytokine–cytokine receptor interaction” was notably upregulated in C-MSCs (Figure 4G). Categories such as “TNF signaling pathway (NES = 2.42, Q-value < 0.001)”, “NF-kappa B signaling pathway (NES = 2.14, Q-value < 0.001)”, and “JAK-STAT signaling pathway (NES = 2.19, Q-value < 0.001)”, which are associated with the immunomodulatory and cytoprotective properties of MSCs, were also enriched in C-MSCs. In contrast, categories such as “cell adhesion molecules (Figure 4G)” and “focal adhesion (NES = −1.89, Q-value < 0.001)” were prevalent among the downregulated genes. These data highlight a significant transcriptomic difference between MSC spheroids and C-MSCs, reflecting their unique biological roles.
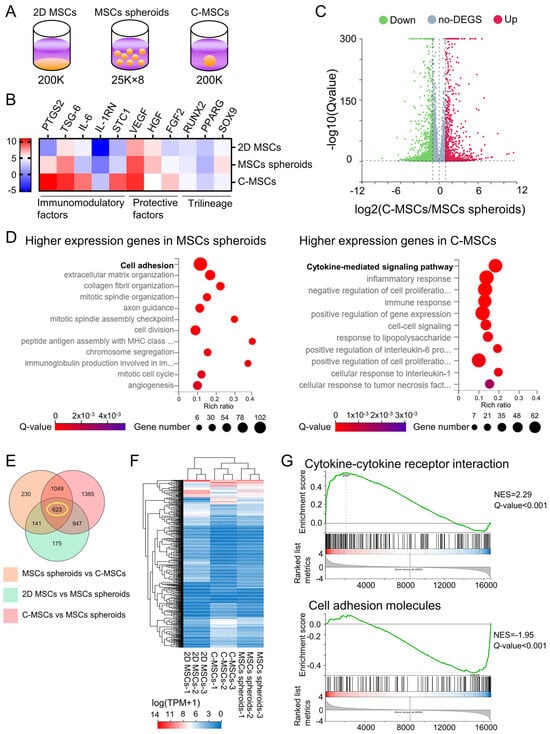
Figure 4.
(A–G) Cells were cultured on a plastic plate, as MSC spheroids, or as C-MSCs, respectively. Subsequently, total RNAs were extracted (n = 3/group) from the same number (200,000) of cells in 2D MSCs, MSC spheroids, or C-MSC culture as depicted in the schematic image (A). (B) The heatmap indicates the expression intensity of immunomodulatory factors, cytoprotective factors, and trilineage-related genes. (C) The volcano plot displays the differentially expressed genes (DEGs) in C-MSCs vs. MSC spheroids. (D) Biological process category enrichment bubble charts of GO analysis terms from higher expression genes in MSC spheroids (left chart) and C-MSCs (right chart). (E) The Venn diagram represents the number of significant DEGs in the indicated groups. (F) A cluster heatmap regarding the 623 genes identified from the Venn diagram is displayed. (G) GSEA of the KEGG pathway, including Cytokine–cytokine receptor interaction and cell-adhesion molecules, in C-MSCs vs. MSC spheroids is presented. The green trace illustrates the enrichment score. NES: normal enrichment score.
4. Discussion
The biological properties of MSC spheroids, emblematic of 3D cell aggregates, have been well delineated in comparison to conventional 2D MSC culture. Herein, this present study investigated the attributes of C-MSCs, an alternative 3D cell aggregate that we have previously developed [18], contrasting them with the 3D MSC spheroids. We revealed that whereas MSC spheroids are dense cell clusters constructed primarily from Cadherin-mediated cell–cell contacts, C-MSCs are cell aggregates based on the ECM component COL1, allowing them to form larger aggregates than MSC spheroids. This study represents the first attempt to simultaneously create and compare MSC spheroids and C-MSCs across a range of cell numbers, providing novel insights into their structural and functional differences. More specifically, this approach allowed us to hypothesize that the abundance of ECM in C-MSCs contributes to their reduced cell death compared to MSC spheroids as discussed below. Anyway, this simultaneous comparison led to the discovery of N-Cadherin-expressing cells within C-MSCs, though its expression level was obviously lower than that of MSC spheroids. Importantly, our transcriptome analysis comparing these 3D cell aggregates with distinct structures demonstrated that C-MSCs have enhanced capacities for producing immunomodulatory and cytoprotective factors, a hallmark biological feature of MSCs. These findings contribute significantly to the understanding of MSCs in 3D cultures and address the gap identified in previous research.
Previous research has established that, compared to 2D-MSCs, MSC spheroids cultured in a 3D suspension have a heightened production of immunomodulatory and cytoprotective factors [14,26,27]. Intriguingly, our study found that C-MSCs, also cultured in three dimensions, further augmented this paracrine property than MSC spheroids (Figure 4), suggesting that the other factors, beyond simply being cultured in 3D, may contribute to this elevation. One potential candidate for this enhancement is the abundant ECM in C-MSCs. Given that stromal cells inherently function within an ECM environment in vivo [28,29], it is plausible that C-MSCs, being rich in ECM components, could more readily manifest MSCs’ paracrine effects. Supporting this hypothesis, Wong et al. reported that ECM conditions affected the inflammatory response in MSCs through NF-κB signaling in response to TNF stimulation [30]. Further studies utilizing C-MSCs, which explore protein production levels and include functional experiments such as T cell/macrophage co-culture systems or in vivo transplantation studies using an immune-disorder animal model, may provide new insights into the mechanisms underlying paracrine effects driven by ECM–cell interactions.
As illustrated in Figure 1 and Figure 2, C-MSCs were enlarged more than MSC spheroids, maintaining their 3D structure without cell death even at diameters around 1 mm. In spheroid culture, it is well reported that enlargement beyond approximately 500 μm is challenging, often attributed to dense cell aggregation leading to internal nutrient and oxygen deprivation [25]. Given the abundant ECM within C-MSCs and their tissue-like structure with a lower cell density than spheroids, it is conceivable that they facilitate gas and fluid exchange. This ECM-rich configuration might be the key to the fabrication of larger 3D cell aggregates.
Conversely, the MSC spheroids produced in this study using the hanging drop method were, consistent with previous reports, predominantly formed through Cadherin-mediated cell–cell contacts. Notably, cell–cell interactions facilitated by N-Cadherin are reported to play a role in the osteogenic, chondrogenic, or myogenic differentiation of MSCs [31,32,33], suggesting possible differences in bone induction capabilities between MSC spheroids and C-MSCs. Although no differences were observed in the expression of trilineage differentiation master genes under standard culture conditions (Figure 4B), distinctions might emerge under induction mediums. Furthermore, it is of note that the diverse MSC spheroid fabricating techniques improving the biological properties of the MSCs, such as forced aggregation technique, low-attachment surfaces, magnetic levitation, and a spinner flask bioreactor system, have been developed [27,34]. Additional comparative analysis between C-MSCs and those varied MSC spheroid types that possess better biological properties than the conventional spheroids will provide deeper insights into 3D MSCs aggregate. Anyway, given the objectives and context of the research, discerning whether to employ MSC spheroids, which mainly rely on cell–cell contact, or C-MSCs, enriched in ECM components, is essential for the rigorous execution of foundational studies.
It is intriguing to consider whether the distinct properties observed in 3D cell constructs made from other cell types also manifest in MSC spheroids and C-MSCs, potentially enhancing our understanding of 3D cell culture. Notably, 3D culture systems are known to better preserve the biological properties of original tumors, such as epithelial–mesenchymal transition (EMT), compared to 2D cultures. For example, a recent study demonstrated that 3D spheroids generated with cancer stem cells exhibited heightened expression of ECM-related transcription factors, mesenchymal markers, and TGF-β signaling-related genes in comparison to 2D cultured cells [35]. In light of this, we revisited our RNA-seq data to see if similar cellular properties are observed in MSC 3D cell aggregates (Supplementary Figure S3). As a result, the expression levels of the ECM-related transcription factor Twist (but not Snail) and the stromal cell marker (also an MSC marker) CD44 were increased in MSC spheroids and C-MSCs. Additionally, TGF-β signaling-related genes, such as SMADs and MMPs, were also elevated in MSC 3D cell aggregates compared to 2D cultured cells. These findings, observed both in cancer stem cells and MSC 3D cell aggregates, indicate that 3D cell culture systems could potentially steer cell fate toward mesenchymal lineages.
Regarding medical application, distinctions in usage and indications can be envisioned for these 3D cell aggregates. For instance, C-MSCs, primarily composed of ECM and fabricable up to approximately 1 mm in diameter, could serve as an effective scaffold-free cell transplantation therapy for substantial tissue defects. In fact, C-MSCs demonstrated good handleability, allowing for direct transplantation in bone or periodontal tissue defects. Notably, C-MSC transplantation without an artificial scaffold into the defects induced successful tissue regeneration via grafted cell differentiation at the defect sites [36,37], suggesting the stability of the grafted cells. Attempting such procedures using MSC spheroids of a diameter less than 500 μm might present challenges. On the other hand, MSC spheroids, characterized mainly by cell–cell interactions, have unique medical applications. Although cleanly dispersing cells from ECM-based C-MSCs is challenging, MSC spheroids can be relatively easily dissociated using trypsin. This relative ease of dissociation has a huge advantage for the cell-priming approach. Briefly, by forming MSCs into spheroids, their paracrine function is elevated. Subsequently, the “primed” cells are dispersed and injected intravenously to treat the disease in animal models. This priming strategy has been well tested and indicated reliable therapeutic effects on immunological disorders or ischemic diseases [38,39]. In addition, recent preclinical studies in cynomolgus monkeys have demonstrated the possibility of intravenously delivering MSC spheroids with diameters under 450μm. Remarkably, the intravenously injected MSC spheroids did not induce adverse reactions, such as embolism in the small vessels, and the grafted cells were distributed and stable at the various organs for 21 days [40]. This represents a clear advantage of spheroids, which can be fabricated in a smaller size than C-MSCs. Taken together, larger ECM-based C-MSCs may hold promise as effective scaffold-free tissue engineering regenerative therapies for tissue-defective diseases, whereas compact and dispersible MSC spheroids could be promising cell-based therapies for immune and ischemic disorders.
5. Conclusions
For the first time, this present study investigated the physical, histological, and transcriptional characteristics of C-MSCs in comparison to conventional MSC spheroids. Although MSC spheroids generated using the hanging drop method were predominantly structured by Cadherin-mediated cell–cell contacts, C-MSCs were primarily formed by the ECM protein COL1, enabling the creation of larger cell aggregates. Additionally, C-MSCs appeared to exhibit an enhanced paracrine effect, a hallmark feature of MSCs, compared to MSC spheroids. Given the distinctive characteristics of each cell aggregate highlighted in this study, we anticipate the development of novel 3D cell culturing techniques and their subsequent medical applications.
Supplementary Materials
The following supporting information can be downloaded at: https://www.mdpi.com/article/10.3390/app132312790/s1, Figure S1: RNA expression patterns quantified using TPM in RNA-seq. Figure S2: Validation of RNA-seq analysis by qPCR. Figure S3: RNA-seq analysis to assess the expression levels of ECM-related transcription factors, cancer stem cell biomarkers, and TGF-β signaling-related genes. Table S1: Sense and antisense primers for real-time PCR.
Author Contributions
Conceptualization, M.Y. and M.K.; methodology, M.Y. and M.K.; validation, M.K.; formal analysis, M.Y., M.K., H.Y., T.I., K.O., T.A., T.Y. and T.S.; investigation, M.Y., M.K., S.M., S.H. and T.A.; data curation, M.K.; writing—original draft preparation, M.Y. and M.K.; writing—review and editing, M.Y., M.K., T.Y. and T.S.; supervision, T.S. and N.M.; project administration, M.K.; funding acquisition, M.K., S.H. and M.T. All authors have read and agreed to the published version of the manuscript.
Funding
This work was supported in part by the Japan Society for the Promotion of Science KAKENHI Grant-in-Aid for Scientific Research (no. JP22K170390A, JP22K170600A, and JP22H0327500), and AMED under grant number JP23bm1223015h0001. The funders played no role in study design, data collection and analysis, or preparation of the manuscript.
Institutional Review Board Statement
Not applicable.
Informed Consent Statement
Not applicable.
Data Availability Statement
The data that support the findings of this study are available from the corresponding author upon reasonable request. The RNA-seq data generated in this study has been deposited in NCBI’s Gene Expression Omnibus (GEO) and can be accessed under the GEO Series Accession Number GSE247989.
Acknowledgments
We would like to thank the Analysis Center of Life Science, Natural Science Center for Basic Research and Development, Hiroshima University, where a part of this work was carried out. We also thank Toshihiko Maekawa for the quantitative analysis of histological analyses.
Conflicts of Interest
The authors declare no conflict of interest.
References
- Laschke, M.W.; Menger, M.D. Life is 3D: Boosting Spheroid Function for Tissue Engineering. Trends Biotechnol. 2017, 35, 133–144. [Google Scholar] [CrossRef]
- Martin, G.R.; Evans, M.J. Differentiation of clonal lines of teratocarcinoma cells: Formation of embryoid bodies in vitro. Proc. Natl. Acad. Sci. USA 1975, 72, 1441–1445. [Google Scholar] [CrossRef] [PubMed]
- Martin, G.R. Isolation of a pluripotent cell line from early mouse embryos cultured in medium conditioned by teratocarcinoma stem cells. Proc. Natl. Acad. Sci. USA 1981, 78, 7634–7638. [Google Scholar] [CrossRef] [PubMed]
- Itskovitz-Eldor, J.; Schuldiner, M.; Karsenti, D.; Eden, A.; Yanuka, O.; Amit, M.; Soreq, H.; Benvenisty, N. Differentiation of human embryonic stem cells into embryoid bodies compromising the three embryonic germ layers. Mol. Med. 2000, 6, 88–95. [Google Scholar] [CrossRef] [PubMed]
- Takahashi, K.; Tanabe, K.; Ohnuki, M.; Narita, M.; Ichisaka, T.; Tomoda, K.; Yamanaka, S. Induction of pluripotent stem cells from adult human fibroblasts by defined factors. Cell 2007, 131, 861–872. [Google Scholar] [CrossRef] [PubMed]
- Prockop, D.J. Marrow stromal cells as stem cells for nonhematopoietic tissues. Science 1997, 276, 71–74. [Google Scholar] [CrossRef] [PubMed]
- Pittenger, M.F.; Mackay, A.M.; Beck, S.C.; Jaiswal, R.K.; Douglas, R.; Mosca, J.D.; Moorman, M.A.; Simonetti, D.W.; Craig, S.; Marshak, D.R. Multilineage potential of adult human mesenchymal stem cells. Science 1999, 284, 143–147. [Google Scholar] [CrossRef]
- Wang, G.; Cao, K.; Liu, K.; Xue, Y.; Roberts, A.I.; Li, F.; Han, Y.; Rabson, A.B.; Wang, Y.; Shi, Y. Kynurenic acid, an IDO metabolite, controls TSG-6-mediated immunosuppression of human mesenchymal stem cells. Cell Death Differ. 2018, 25, 1209–1223. [Google Scholar] [CrossRef]
- Li, H.; Shen, S.; Fu, H.; Wang, Z.; Li, X.; Sui, X.; Yuan, M.; Liu, S.; Wang, G.; Guo, Q. Immunomodulatory Functions of Mesenchymal Stem Cells in Tissue Engineering. Stem Cells Int. 2019, 2019, 9671206. [Google Scholar] [CrossRef]
- Cesarz, Z.; Tamama, K. Spheroid Culture of Mesenchymal Stem Cells. Stem Cells Int. 2016, 2016, 9176357. [Google Scholar] [CrossRef]
- Yen, B.L.; Hsieh, C.C.; Hsu, P.J.; Chang, C.C.; Wang, L.T.; Yen, M.L. Three-Dimensional Spheroid Culture of Human Mesenchymal Stem Cells: Offering Therapeutic Advantages and In Vitro Glimpses of the In Vivo State. Stem Cells Transl. Med. 2023, 12, 235–244. [Google Scholar] [CrossRef] [PubMed]
- Lee, E.J.; Park, S.J.; Kang, S.K.; Kim, G.H.; Kang, H.J.; Lee, S.W.; Jeon, H.B.; Kim, H.S. Spherical bullet formation via E-cadherin promotes therapeutic potency of mesenchymal stem cells derived from human umbilical cord blood for myocardial infarction. Mol. Ther. 2012, 20, 1424–1433. [Google Scholar] [CrossRef] [PubMed]
- Zhou, Y.; Chen, H.; Li, H.; Wu, Y. 3D culture increases pluripotent gene expression in mesenchymal stem cells through relaxation of cytoskeleton tension. J. Cell Mol. Med. 2017, 21, 1073–1084. [Google Scholar] [CrossRef] [PubMed]
- Bartosh, T.J.; Ylostalo, J.H.; Mohammadipoor, A.; Bazhanov, N.; Coble, K.; Claypool, K.; Lee, R.H.; Choi, H.; Prockop, D.J. Aggregation of human mesenchymal stromal cells (MSCs) into 3D spheroids enhances their antiinflammatory properties. Proc. Natl. Acad. Sci. USA 2010, 107, 13724–13729. [Google Scholar] [CrossRef]
- Bartosh, T.J.; Ylostalo, J.H.; Bazhanov, N.; Kuhlman, J.; Prockop, D.J. Dynamic compaction of human mesenchymal stem/precursor cells into spheres self-activates caspase-dependent IL1 signaling to enhance secretion of modulators of inflammation and immunity (PGE2, TSG6, and STC1). Stem Cells 2013, 31, 2443–2456. [Google Scholar] [CrossRef] [PubMed]
- Frith, J.E.; Thomson, B.; Genever, P.G. Dynamic three-dimensional culture methods enhance mesenchymal stem cell properties and increase therapeutic potential. Tissue Eng. Part. C Methods 2010, 16, 735–749. [Google Scholar] [CrossRef]
- Bhang, S.H.; Lee, S.; Shin, J.Y.; Lee, T.J.; Kim, B.S. Transplantation of cord blood mesenchymal stem cells as spheroids enhances vascularization. Tissue Eng. Part. A 2012, 18, 2138–2147. [Google Scholar] [CrossRef]
- Kittaka, M.; Kajiya, M.; Shiba, H.; Takewaki, M.; Takeshita, K.; Khung, R.; Fujita, T.; Iwata, T.; Nguyen, T.Q.; Ouhara, K.; et al. Clumps of a mesenchymal stromal cell/extracellular matrix complex can be a novel tissue engineering therapy for bone regeneration. Cytotherapy 2015, 17, 860–873. [Google Scholar] [CrossRef]
- Takewaki, M.; Kajiya, M.; Takeda, K.; Sasaki, S.; Motoike, S.; Komatsu, N.; Matsuda, S.; Ouhara, K.; Mizuno, N.; Fujita, T.; et al. MSC/ECM Cellular Complexes Induce Periodontal Tissue Regeneration. J. Dent. Res. 2017, 96, 984–991. [Google Scholar] [CrossRef]
- Horikoshi, S.; Kajiya, M.; Motoike, S.; Yoshino, M.; Morimoto, S.; Yoshii, H.; Ogawa, T.; Sone, H.; Iwata, T.; Ouhara, K.; et al. Clumps of Mesenchymal Stem Cells/Extracellular Matrix Complexes Generated with Xeno-Free Chondro-Inductive Medium Induce Bone Regeneration via Endochondral Ossification. Biomedicines 2021, 9, 1408. [Google Scholar] [CrossRef]
- Morimoto, S.; Kajiya, M.; Yoshii, H.; Yoshino, M.; Horikoshi, S.; Motoike, S.; Iwata, T.; Ouhara, K.; Ando, T.; Yoshimoto, T.; et al. A Cartilaginous Construct with Bone Collar Exerts Bone-Regenerative Property Via Rapid Endochondral Ossification. Stem Cell Rev. Rep. 2023, 19, 1812–1827. [Google Scholar] [CrossRef] [PubMed]
- Komatsu, N.; Kajiya, M.; Morimoto, S.; Motoike, S.; Yoshii, H.; Iwata, T.; Ouhara, K.; Matsuda, S.; Mizuno, N.; Kurihara, H. Cox2-mediated PGE2 production via p38/JNK-c-fos signaling inhibits cell apoptosis in 3D floating culture clumps of mesenchymal stem cell/extracellular matrix complexes. Biochem. Biophys. Res. Commun. 2020, 530, 448–454. [Google Scholar] [CrossRef] [PubMed]
- Klingelhutz, A.J.; Gourronc, F.A.; Chaly, A.; Wadkins, D.A.; Burand, A.J.; Markan, K.R.; Idiga, S.O.; Wu, M.; Potthoff, M.J.; Ankrum, J.A. Scaffold-free generation of uniform adipose spheroids for metabolism research and drug discovery. Sci. Rep. 2018, 8, 523. [Google Scholar] [CrossRef]
- Komatsu, N.; Kajiya, M.; Motoike, S.; Takewaki, M.; Horikoshi, S.; Iwata, T.; Ouhara, K.; Takeda, K.; Matsuda, S.; Fujita, T.; et al. Type I collagen deposition via osteoinduction ameliorates YAP/TAZ activity in 3D floating culture clumps of mesenchymal stem cell/extracellular matrix complexes. Stem Cell Res. Ther. 2018, 9, 342. [Google Scholar] [CrossRef] [PubMed]
- Tsai, A.C.; Liu, Y.; Yuan, X.; Ma, T. Compaction, fusion, and functional activation of three-dimensional human mesenchymal stem cell aggregate. Tissue Eng. Part. A 2015, 21, 1705–1719. [Google Scholar] [CrossRef] [PubMed]
- Cesarz, Z.; Funnell, J.L.; Guan, J.; Tamama, K. Soft Elasticity-Associated Signaling and Bone Morphogenic Protein 2 Are Key Regulators of Mesenchymal Stem Cell Spheroidal Aggregates. Stem Cells Dev. 2016, 25, 622–635. [Google Scholar] [CrossRef] [PubMed]
- Petrenko, Y.; Sykova, E.; Kubinova, S. The therapeutic potential of three-dimensional multipotent mesenchymal stromal cell spheroids. Stem Cell Res. Ther. 2017, 8, 94. [Google Scholar] [CrossRef] [PubMed]
- Mouw, J.K.; Ou, G.; Weaver, V.M. Extracellular matrix assembly: A multiscale deconstruction. Nat. Rev. Mol. Cell Biol. 2014, 15, 771–785. [Google Scholar] [CrossRef]
- Vogel, V. Unraveling the Mechanobiology of Extracellular Matrix. Annu. Rev. Physiol. 2018, 80, 353–387. [Google Scholar] [CrossRef]
- Wong, S.W.; Lenzini, S.; Cooper, M.H.; Mooney, D.J.; Shin, J.W. Soft extracellular matrix enhances inflammatory activation of mesenchymal stromal cells to induce monocyte production and trafficking. Sci. Adv. 2020, 6, eaaw0158. [Google Scholar] [CrossRef]
- Alimperti, S.; You, H.; George, T.; Agarwal, S.K.; Andreadis, S.T. Cadherin-11 regulates both mesenchymal stem cell differentiation into smooth muscle cells and the development of contractile function in vivo. J. Cell Sci. 2014, 127, 2627–2638. [Google Scholar] [CrossRef] [PubMed]
- Alimperti, S.; Andreadis, S.T. CDH2 and CDH11 act as regulators of stem cell fate decisions. Stem Cell Res. 2015, 14, 270–282. [Google Scholar] [CrossRef] [PubMed]
- Cosgrove, B.D.; Mui, K.L.; Driscoll, T.P.; Caliari, S.R.; Mehta, K.D.; Assoian, R.K.; Burdick, J.A.; Mauck, R.L. N-cadherin adhesive interactions modulate matrix mechanosensing and fate commitment of mesenchymal stem cells. Nat. Mater. 2016, 15, 1297–1306. [Google Scholar] [CrossRef] [PubMed]
- Kouroupis, D.; Correa, D. Increased Mesenchymal Stem Cell Functionalization in Three-Dimensional Manufacturing Settings for Enhanced Therapeutic Applications. Front. Bioeng. Biotechnol. 2021, 9, 621748. [Google Scholar] [CrossRef] [PubMed]
- Cave, D.D.; Buonaiuto, S.; Sainz, B., Jr.; Fantuz, M.; Mangini, M.; Carrer, A.; Di Domenico, A.; Iavazzo, T.T.; Andolfi, G.; Cortina, C.; et al. LAMC2 marks a tumor-initiating cell population with an aggressive signature in pancreatic cancer. J. Exp. Clin. Cancer Res. 2022, 41, 315. [Google Scholar] [CrossRef] [PubMed]
- Motoike, S.; Kajiya, M.; Komatsu, N.; Horikoshi, S.; Ogawa, T.; Sone, H.; Matsuda, S.; Ouhara, K.; Iwata, T.; Mizuno, N.; et al. Clumps of Mesenchymal Stem Cell/Extracellular Matrix Complexes Generated with Xeno-Free Conditions Facilitate Bone Regeneration via Direct and Indirect Osteogenesis. Int. J. Mol. Sci. 2019, 20, 3970. [Google Scholar] [CrossRef] [PubMed]
- Sone, H.; Kajiya, M.; Takeda, K.; Sasaki, S.; Horikoshi, S.; Motoike, S.; Morimoto, S.; Yoshii, H.; Yoshino, M.; Iwata, T.; et al. Clumps of mesenchymal stem cells/extracellular matrix complexes directly reconstruct the functional periodontal tissue in a rat periodontal defect model. J. Tissue Eng. Regen. Med. 2022, 16, 945–955. [Google Scholar] [CrossRef]
- Xu, Y.; Shi, T.; Xu, A.; Zhang, L. 3D spheroid culture enhances survival and therapeutic capacities of MSCs injected into ischemic kidney. J. Cell Mol. Med. 2016, 20, 1203–1213. [Google Scholar] [CrossRef]
- Jiang, B.; Yan, L.; Miao, Z.; Li, E.; Wong, K.H.; Xu, R.H. Spheroidal formation preserves human stem cells for prolonged time under ambient conditions for facile storage and transportation. Biomaterials 2017, 133, 275–286. [Google Scholar] [CrossRef]
- Yeung, C.K.; Yan, Y.; Yan, L.; Duan, Y.; Li, E.; Huang, B.; Lu, K.; Li, K.; Zhou, M.; Zhang, L.; et al. Preclinical safety evaluation and tracing of human mesenchymal stromal cell spheroids following intravenous injection into cynomolgus monkeys. Biomaterials 2022, 289, 121759. [Google Scholar] [CrossRef]
Disclaimer/Publisher’s Note: The statements, opinions and data contained in all publications are solely those of the individual author(s) and contributor(s) and not of MDPI and/or the editor(s). MDPI and/or the editor(s) disclaim responsibility for any injury to people or property resulting from any ideas, methods, instructions or products referred to in the content. |
© 2023 by the authors. Licensee MDPI, Basel, Switzerland. This article is an open access article distributed under the terms and conditions of the Creative Commons Attribution (CC BY) license (https://creativecommons.org/licenses/by/4.0/).