Abstract
Narcotics should be strictly controlled as they can cause great disruption to society. Narcotics mostly flow into ports from major narcotic makers via transit points and through cargo containers. To prevent narcotic entry through smuggling, airports use animals or detect narcotics through X-rays. However, the use of animals in ports is not practical, and the method using X-rays sometimes does not detect substance narcotics with low atomic numbers. In this paper, we aimed to detect and classify narcotics using ion mobility spectrometry (IMS) data generated by inhaling air inside the container. To classify narcotic IMS data consisting of time-series data, the performance was improved using a time-series classification machine learning algorithm instead of the threshold method previously used. To this end, K-nearest neighbor, time-series forest, and random convolutional kernel algorithms were applied to the proposed algorithm considering the features of narcotic IMS data. The results demonstrate that the proposed algorithm outperforms the existing algorithm, and it reduces the classification performance processing time up to 5 s with more than 0.9 accuracy level.
1. Introduction
According to the 2022 Narcotic Crime White Paper published by the Supreme Prosecutors’ Office of the Republic of Korea, as shown in Table 1, the total number of narcotic offenders in 2022 was 18,395, an increase of 13.9% from the previous year (16,153) [1]. Of these 18,395 people, only 4 were caught for illegal manufacturing, and the rest were caught for smuggling, trafficking, and narcotic use. In this regard, it can be judged that narcotics are brought into the country from overseas through social networking services and the Internet (Dark Web) distribution channels rather than domestic manufacturing. Therefore, narcotic detection at ports, airports, and import/export facilities is of increasing importance.

Table 1.
Narcotic crime status in Republic of Korea.
To detect narcotics, narcotic detection devices are prepared and intensively managed at ports and airports. However, despite these controls, smuggling methods continue to become more sophisticated. Therefore, studies are conducted to detect hidden narcotics. One representative method for detecting narcotics involves dogs, as shown in [2] and as can be easily seen at airports. However, this method faces difficulties when applied in ports. In addition to the method using animals, a method based on X-ray images according to the atomic number of a material is used. Herein, support vector machine is applied to X-ray images based on the extraction of direction fractal-dimension texture features [3]. Meanwhile, one study proposed a method for detecting narcotics and explosives through nuclear quadrupole responses [4]. In addition, another method applies ion mobility spectrometry (IMS) [5].
Recently, machine learning and deep neural network algorithms, which have been studied in the past, can be easily implemented because of the development of hardware and are being applied to a wide range of areas, showing sufficient performance [6,7]. Therefore, this paper intends to classify and detect narcotics by applying a time-series classification algorithm to IMS data represented by time-series data. In the case of ports, there should be no bottlenecks as they are important gateways for imports and exports. For smooth port operation, smart port research has been conducted, such as incorporating simulations for efficient port operation [8,9,10]. In line with this trend, this paper seeks to swiftly classify data acquired using a portable narcotics IMS data classifier from a separate intake port of a port container by applying an algorithm with low computational complexity. For this purpose, machine learning algorithms with low computational complexity were applied in various ways. Afterward, classification performances and operation times were compared and analyzed to find algorithms that satisfy the required classification accuracy and processing speed.
Therefore, this paper proposes an algorithm to classify a total of nine types of data, including eight types of narcotic data acquired from the above portable IMS detector and under general conditions. Through this study, we were able to secure high detection performance even for low atomic numbers as an alternative to the X-ray method in drug detection. By classifying the IMS data using machine learning techniques instead of Threshold method, we were able to achieve a groundbreaking improvement in detection and classification performance. In the following, we look at the time-series data classification algorithm in Section 2. In Section 3, we look at the features of the narcotic IMS steam data as these data are not a benchmark dataset. In Section 4, Section 5, Section 6 and Section 7, we examine the preprocessing and classification algorithms and experimental results for applying the algorithm. Section 8 presents the conclusion.
2. Related Research
Time-series data are a series of data constructed along the time axis [11]. Examples of time-series data include stock prices, temperature, and sensor data from industrial sites. Classification, prediction, and outlier detection are performed in various industries based on time-series data [6,7]. Time-series data generate noise from the collection sensor and errors in the storage process [12]. Additionally, statistical features of time-series data and kernel-based feature extraction algorithms are studied rather than applying the original data to the model as it is [13,14].
Time-Series Data Classification Algorithm
There are various methodologies for classifying time-series data. K-nearest neighbor (KNN) is an algorithm that performs classification by referring to k-nearest data based on the distribution of time-series data [15]. It is used in various fields because it has a simple and powerful performance [16,17]. Meanwhile, random forest is an algorithm that constructs multiple decision trees to perform final inference using an ensemble technique for values inferred from each tree [18]. Another algorithm also performs classification by extracting data features rather than using the given data as is: the time-series forest (TSF) algorithm constructs a decision tree by extracting data features for each window section [19]. Random convolutional kernel (ROCKET) creates a feature map by performing a convolution operation with a random kernel on time-series data and performs classification using the Ridge regression classifier CV [20]. As an algorithm using a deep neural network (DNN), the recurrent neural network shows good performance, and time-series classification algorithms using long short-term memory and transformers have been studied since then [21,22]. Another method for classifying time-series data is the convolutional neural network (CNN), an image processing algorithm that performs well by converting time-series data into images and classifying them through the Gramian angular field algorithm and Markov transition field. Meanwhile, the recurrence plot algorithm, which converts time-series data into images, is also being studied [23,24,25,26]. With the advent of the electric era, technologies to predict the precise remaining useful life (RUL) of lithium-ion batteries are emerging, including the application of the PF-BiGRU-TSAM algorithm [27]. In addition to this method, there are cases where the CNN-GRU model has been applied [28].
3. IMS Data Characteristics
This chapter describes the fact that narcotic IMS data are not a benchmark dataset and that applying an algorithm considering data characteristics is an important process when classifying and predicting time-series data.
3.1. Narcotic IMS Data Types
The narcotic IMS data used in this paper obtained from the IMS detector of the target sample and the data consists of nine different types: eight types of narcotics and one normal type in which no narcotic exists. Various types of narcotics include amphetamine (Amp), morphine hydrochloride (Mor), fentanyl (Fen), alfentanil hydrochloride (Alf), MDMA hydrochloride (MDMA), ketamine hydrochloride (Ket), diazepam (Dia), and codeine phosphate hydrate (Cod). For all narcotics except alfentanil hydrochloride and standby state, data were acquired at 100 ng; for alfentanil hydrochloride, data were acquired at 300 ng. To acquire IMS data, one measurement was performed for 10 s. Data from one measurement consisted of one csv file. The number of data that made up all CSV files regardless of the narcotic type was 162,580. Looking at the reference of the IMS data graph in Table 2, there was a peak where the value of IMS data increased rapidly. The peak was a reactant ion peak (RIP), which was a separate ion signal, such as nitrogen that existed in large numbers in the air but did not correspond to the dangerous substance to be detected and occurred repeatedly during the data acquisition process. RIP was the criterion for dividing narcotic IMS data into multiple data [29].
Table 2.
Narcotic IMS data count, reference, and actual response data.
3.2. Features of Narcotic IMS Data
3.2.1. Narcotics IMS Data Composed of RIP2RIP
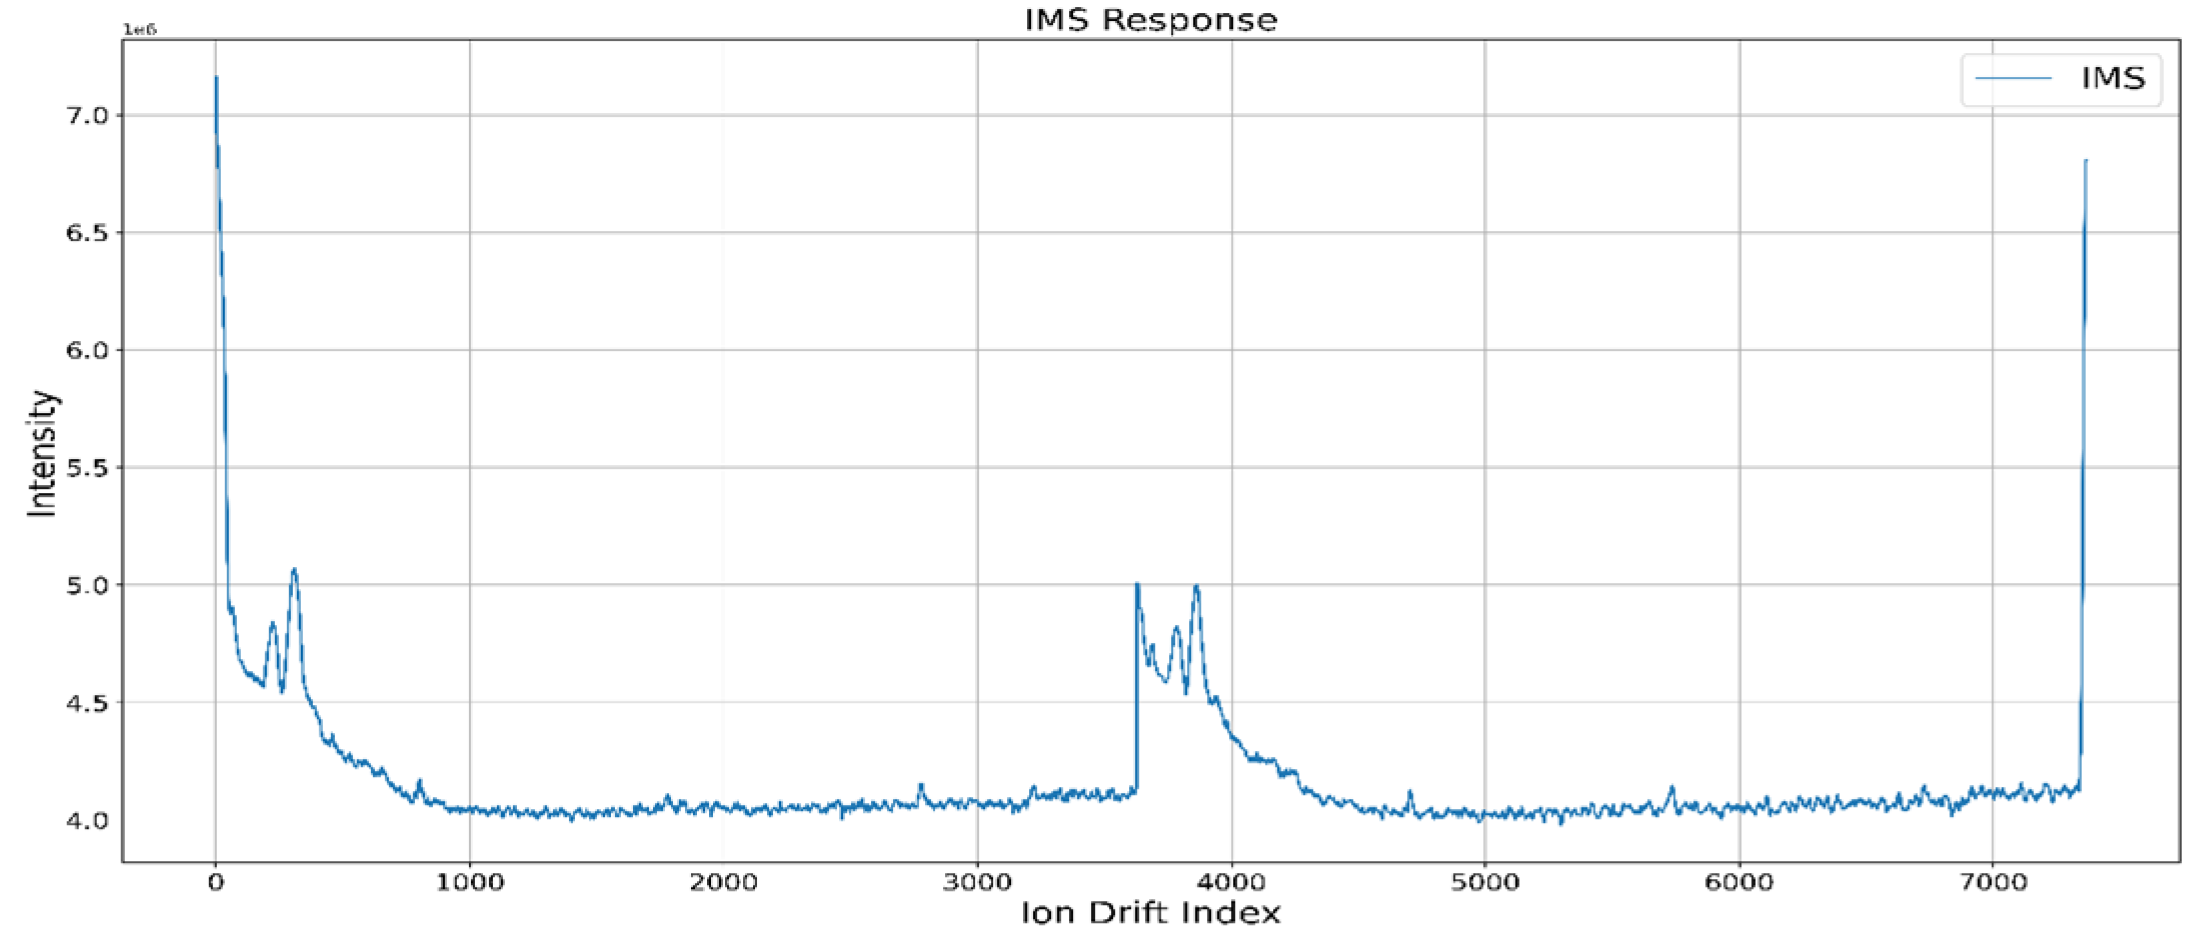
The narcotic IMS data consisted of about 40 RIP2RIPs (the section from a random RIP to the next RIP) in one csv file. There was a difference in the number of RIP2RIP depending on the data. Additionally, there were cases where RIP reacted less than other RIPs, as shown in Figure 1. This is the reason for applying the classification algorithm to the embedded board and then adding a process to check the number of data constituting RIP2RIP in the application of the classification model.
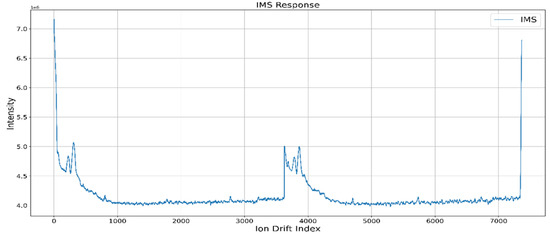
Figure 1.
Data with low RIP.
3.2.2. Narcotics IMS Data with Reduced Level of Response
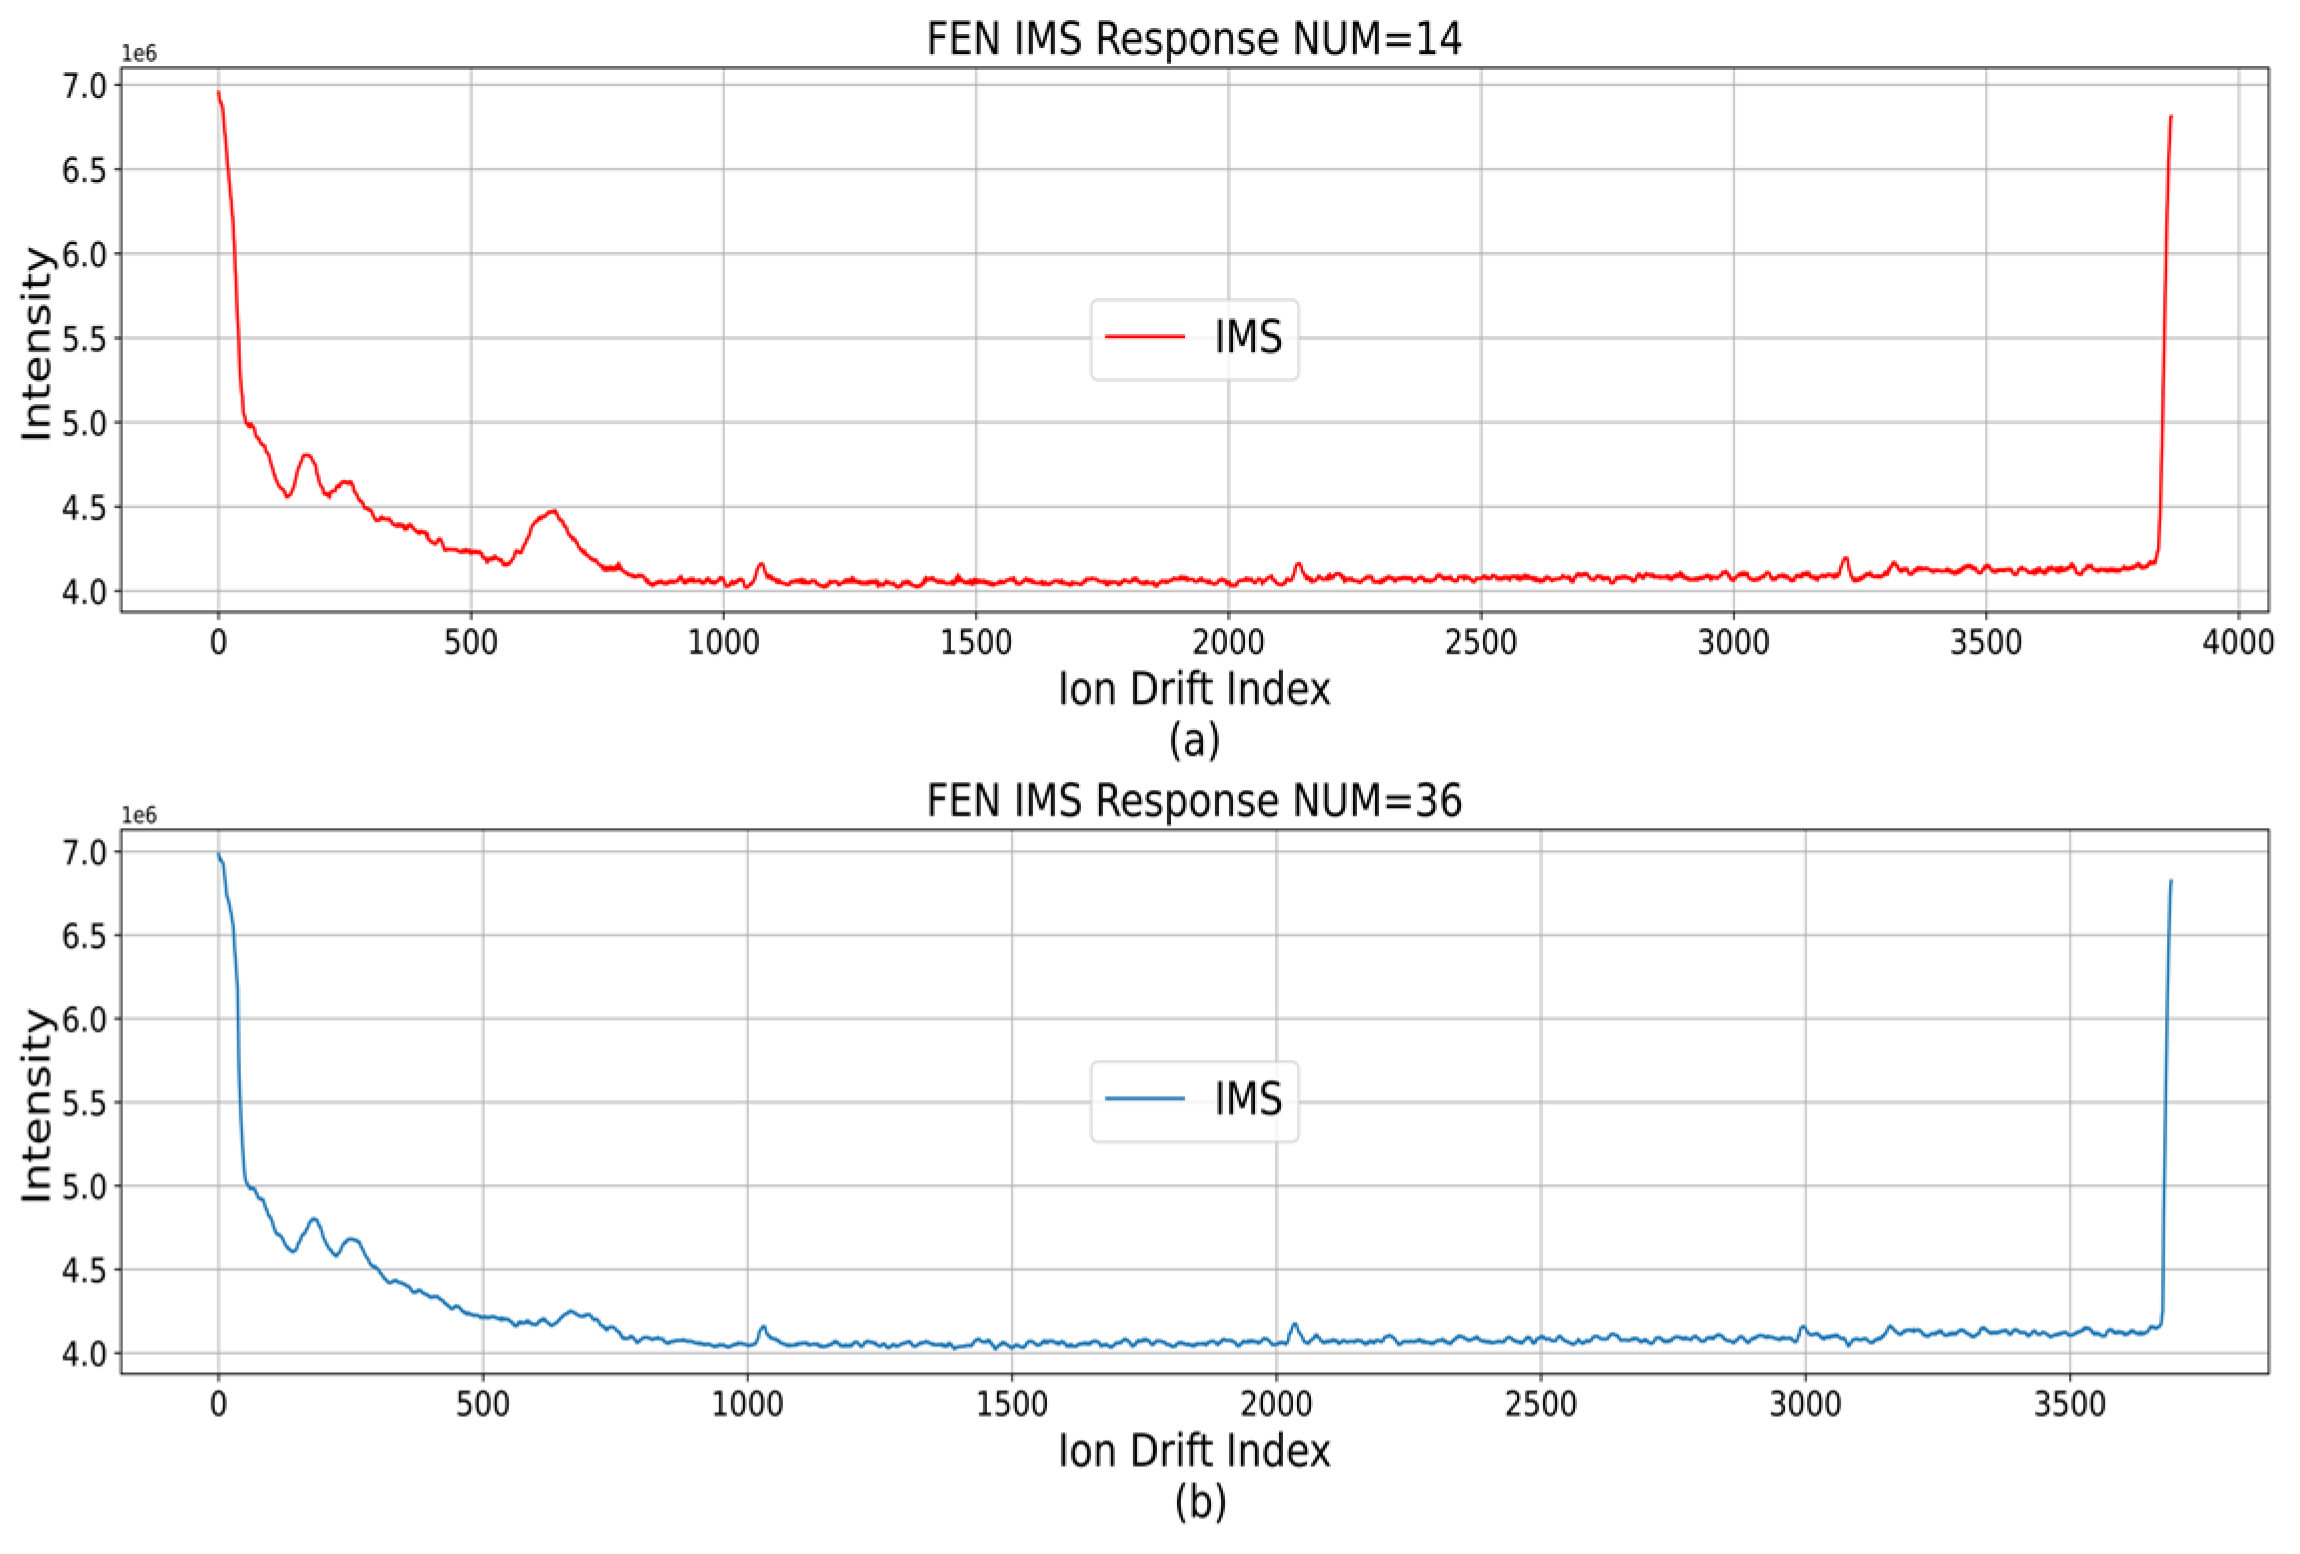
The narcotic IMS data generated about 40 RIP2RIPs during the suction time of 0 to 10 s. In RIP2RIP, each narcotic had a different response interval, as shown in Table 2. In the inhaled data, the degree of response in the response section showed differences depending on the state of the hardware. Figure 2 shows that in RIP2RIP_NUM_14, which was the initial stage of suction from the one-time measurement data, the response degree reacted at 600 to 700 ion drift index on the x-axis. However, in RIP2RIP_NUM_36, repetition 12 RIP2RIP, the degree of response decreased. The problem of showing a difference in the degree of response, even in the same data acquisition file, required consideration in synthesizing classification prediction values for multiple RIP2RIPs when constructing a narcotic IMS data classification algorithm.
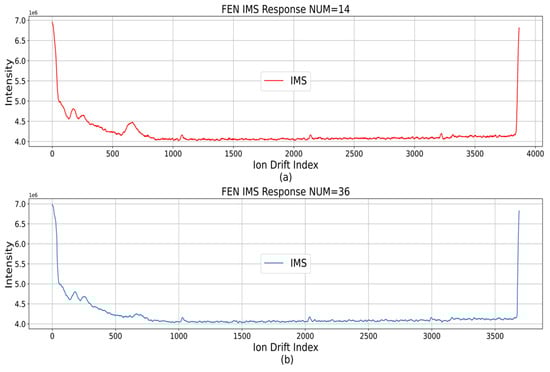
Figure 2.
Data with low response degree. (a) response degree reacted at 600 to 700 ion drift index; (b) After repetition 12 RIP2RIP, the degree of response decreased.
3.2.3. Narcotic IMS Data Other Than the Difference between Response Sections
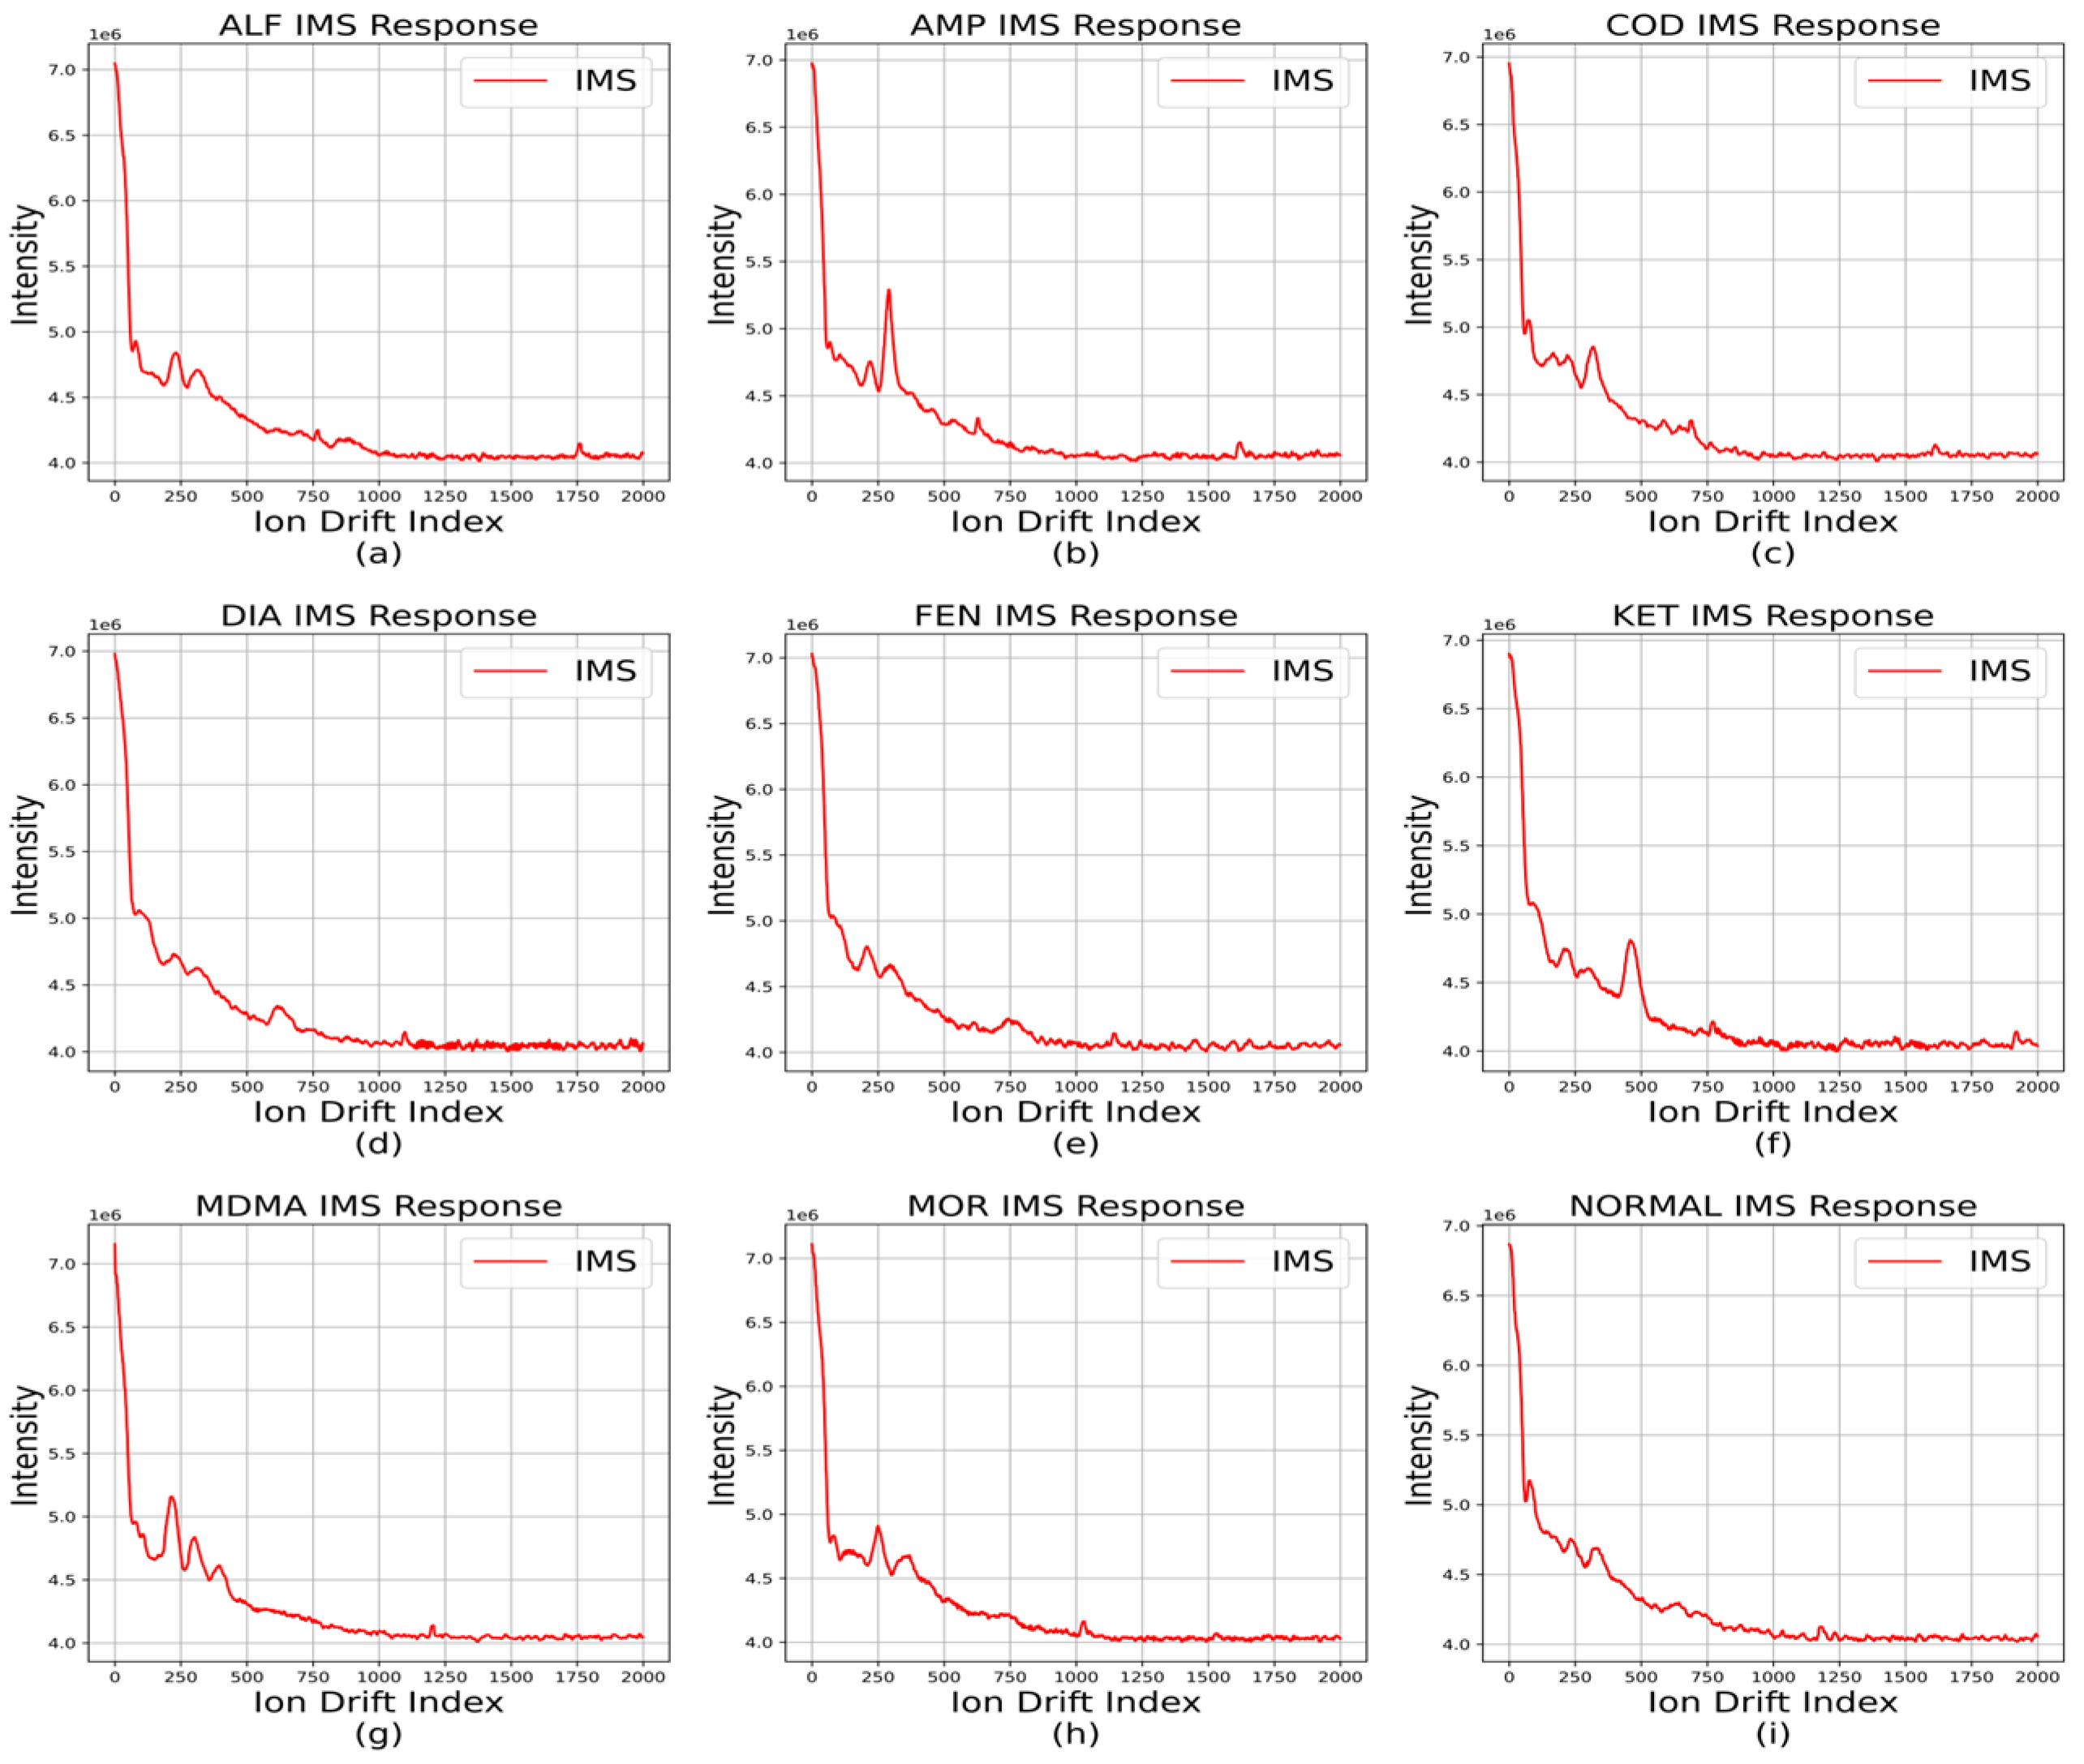
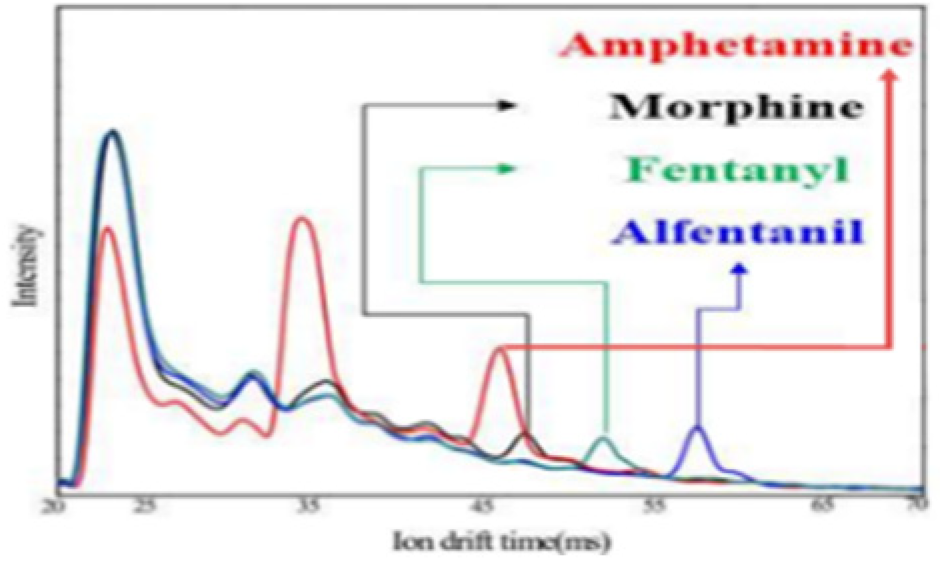
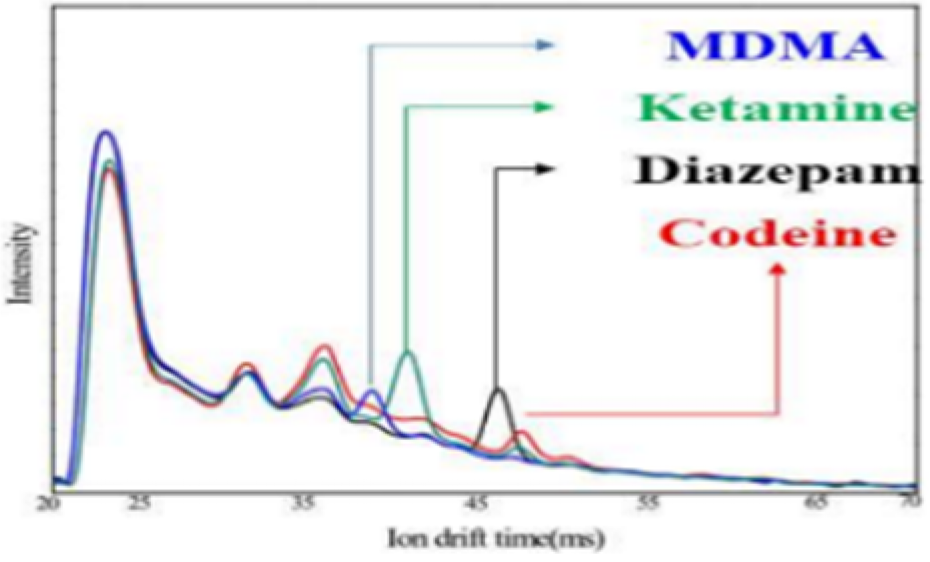
From Table 2 and according to the IMS data for narcotics, the response sections overlapped for diazepam, codeine phosphate hydrate, and morphine, but other narcotics had different response sections. Taking advantage of this, a window was previously applied to the response section to classify it as a specific narcotic when it exceeded the threshold. However, in this paper, the features of the data before the response section of the narcotic IMS data were noted. Figure 3 shows different responses for each set of narcotic IMS data. These features are believed to be usable in time-series classification algorithms.
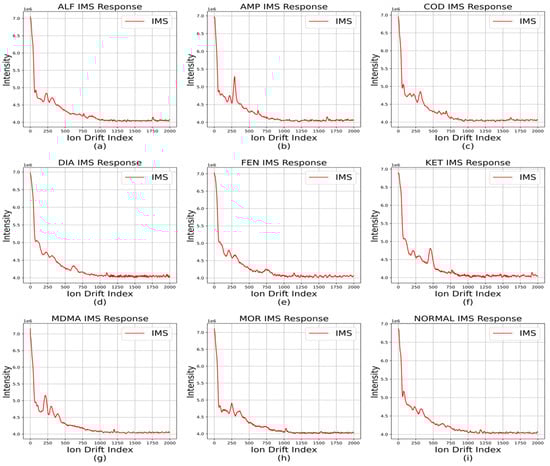
Figure 3.
Other features in data.; representative of each IMS data from (a–i); even if the response ranges of each data overlap, they exhibit distinct preceding response.
3.2.4. Diverse Data Quantity Configurations in RIP2RIP
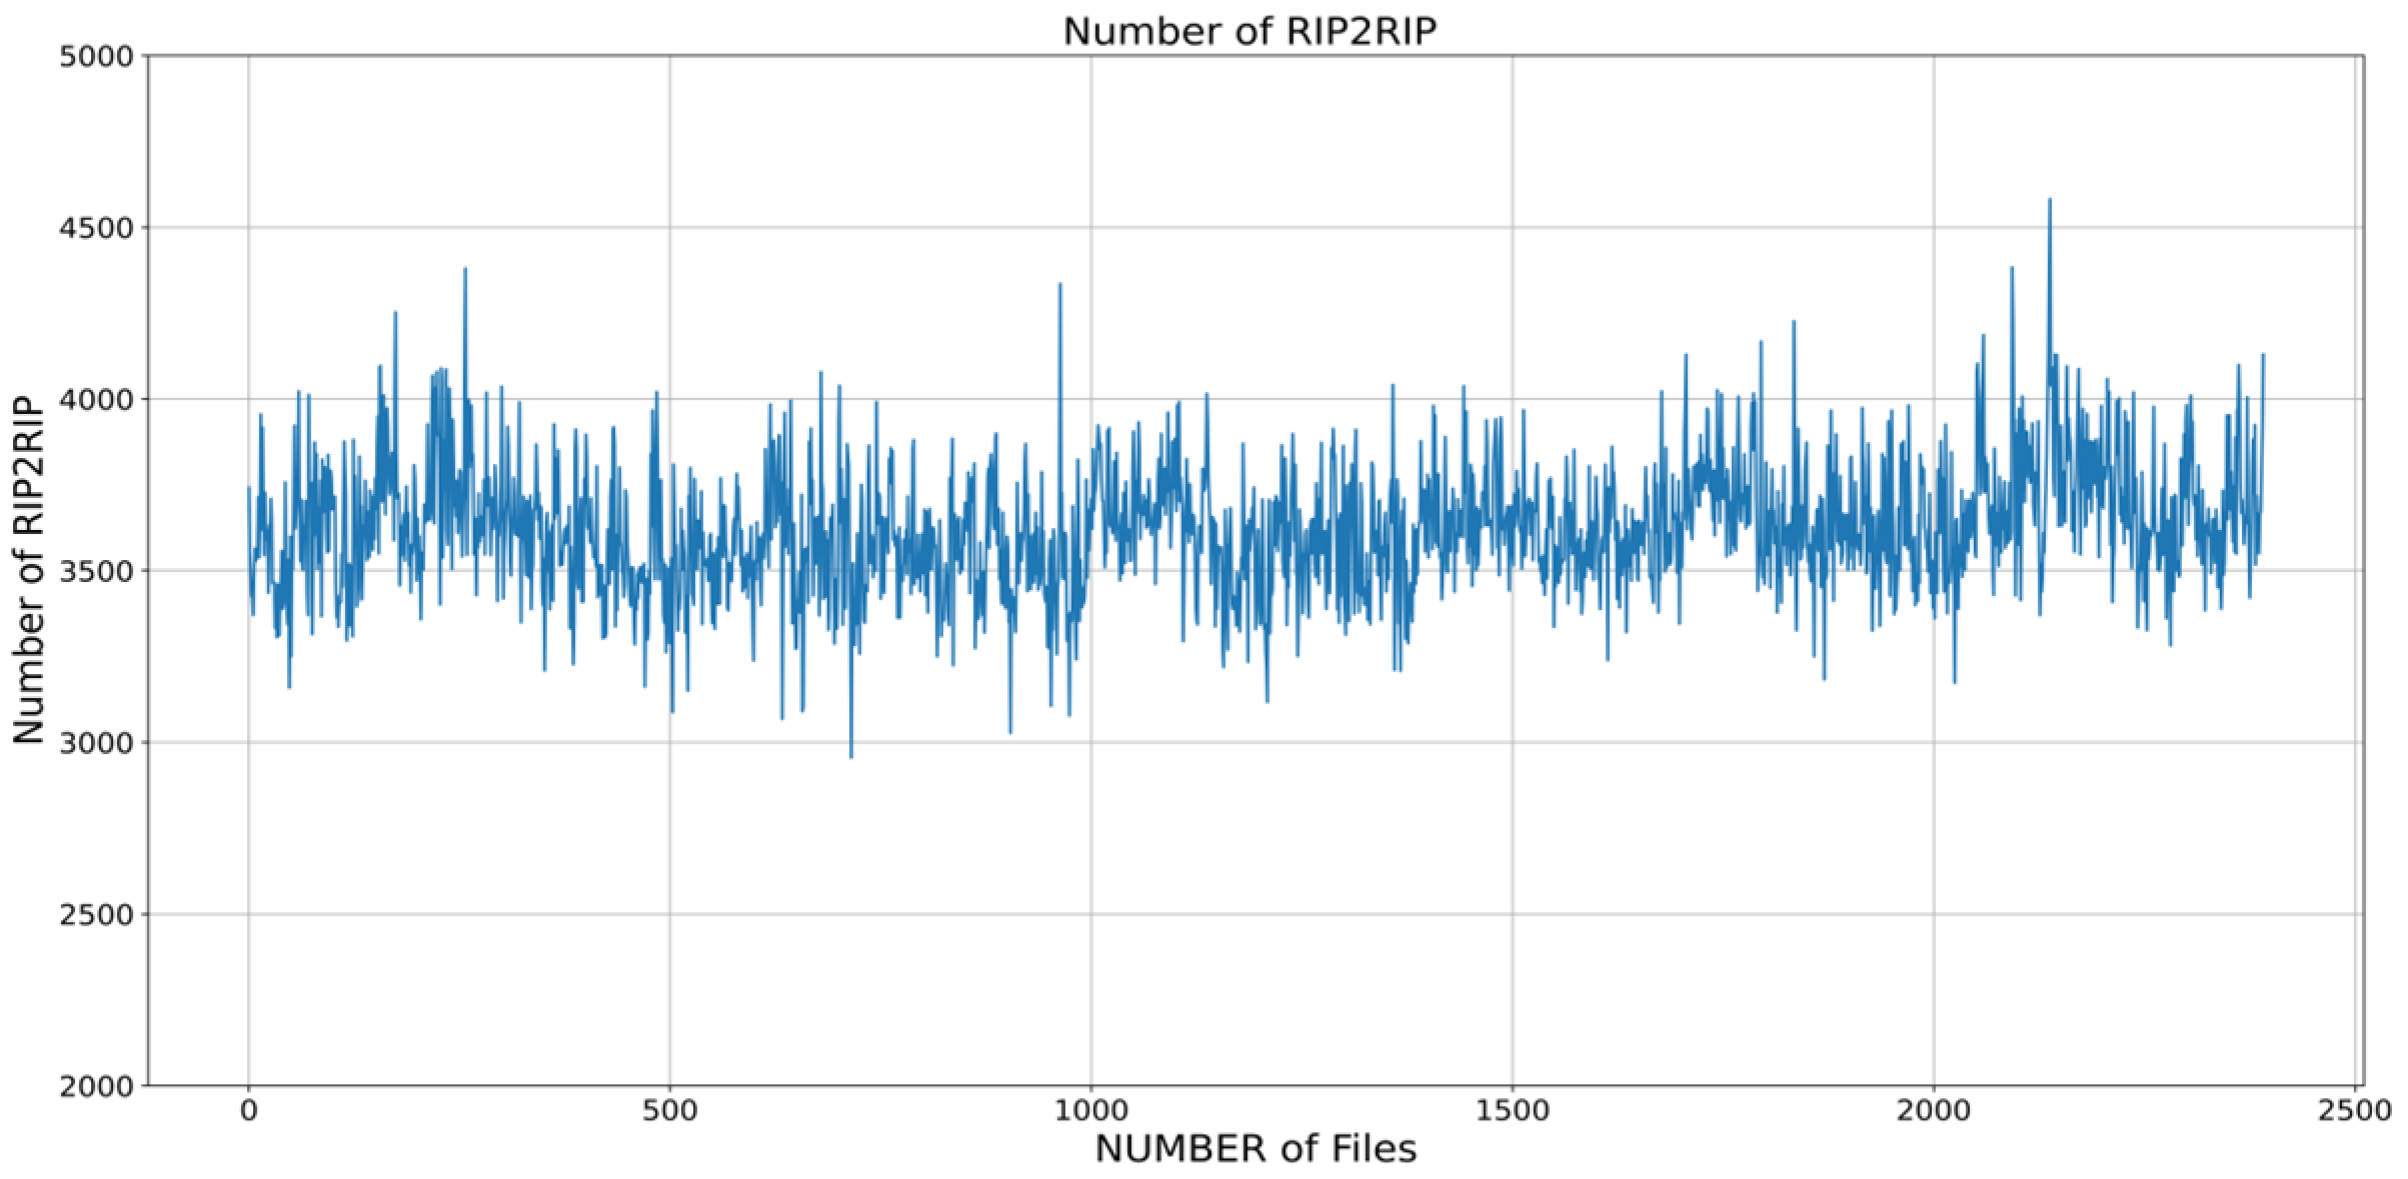
Figure 4 shows that the total number of data obtained when IMS data are acquired for 0 to 10 s is the same as 162,580 but the number of data constituting one RIP2RIP is different. This means that the data that constitute the response section are different. In this regard, the classification method involving the setting of the response section, which is an existing classification algorithm, has application difficulties.
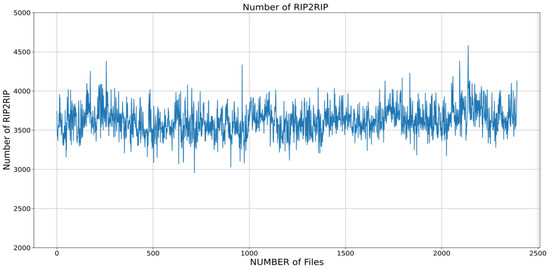
Figure 4.
The number of configuration data differs in RIP2RIP.
4. Narcotic IMS Data Noise Removal Algorithm
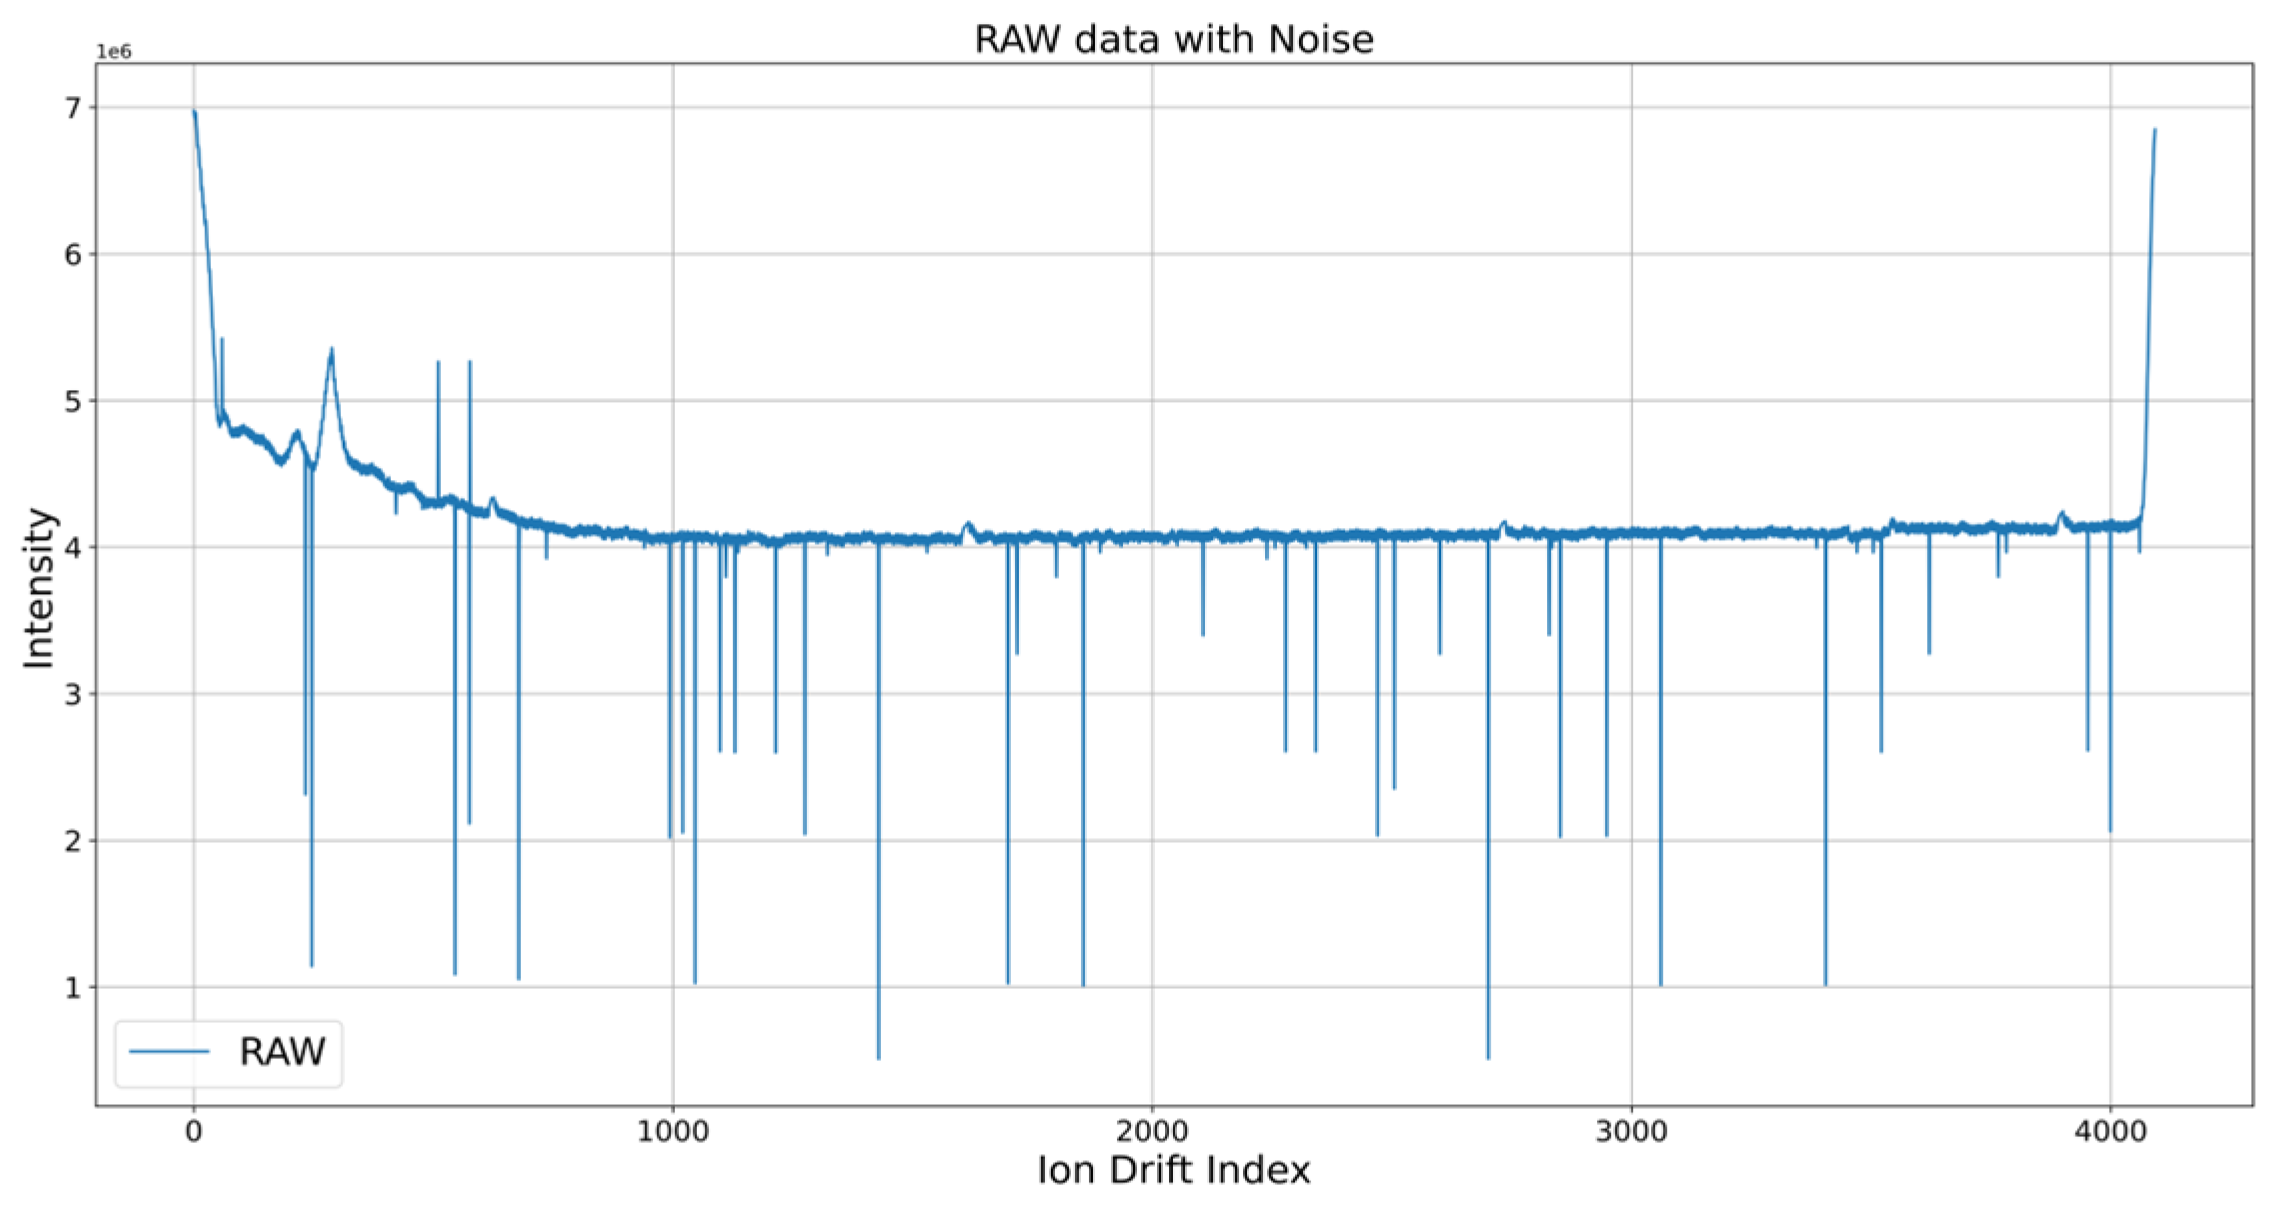
Figure 5 shows that the narcotic IMS data used in this paper added noise to the raw data because of hardware factors. Various noise cancellation algorithms, such as smoothing techniques which reduce data variability, constraints that limit the range of signal adjustments, and statistical algorithms that utilize probabilistic models to filter noise, effectively enhance signal clarity [30]. However, in this paper, the moving average (MA) (which is relatively simple but has strong performance in that it is applied to narcotic detection systems in ports) and the speed constraint algorithm were applied to narcotic IMS data and compared [31]. First, MA set a window and took average values. The median value was taken in the window section considering that there were less than 10 noises in the narcotic IMS data and that there was a trend rather than a sudden change in the section excluding RIP in the reference. The window sizes were set to 5, 10, and 15 and compared. The second method used the speed constraint algorithm, which replaced the size difference of adjacent data in the window with the average value of both data when it exceeded the set value. If there was a value exceeding 70 in the time-series data measuring the Celsius temperature, it may be considered an outlier. Then, the value of 70 was corrected on the basis of the values before and after the time index of 70. In this paper, the experiment was conducted by setting the speed constraint threshold to 100,000 based on the reference and data trends.
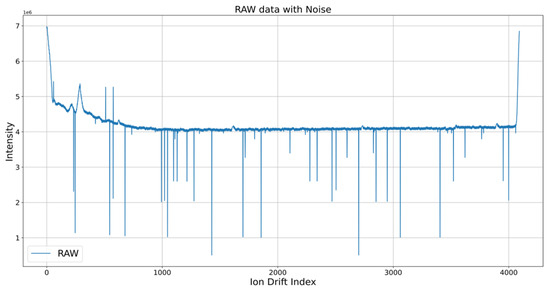
Figure 5.
Noise of narcotic IMS data.
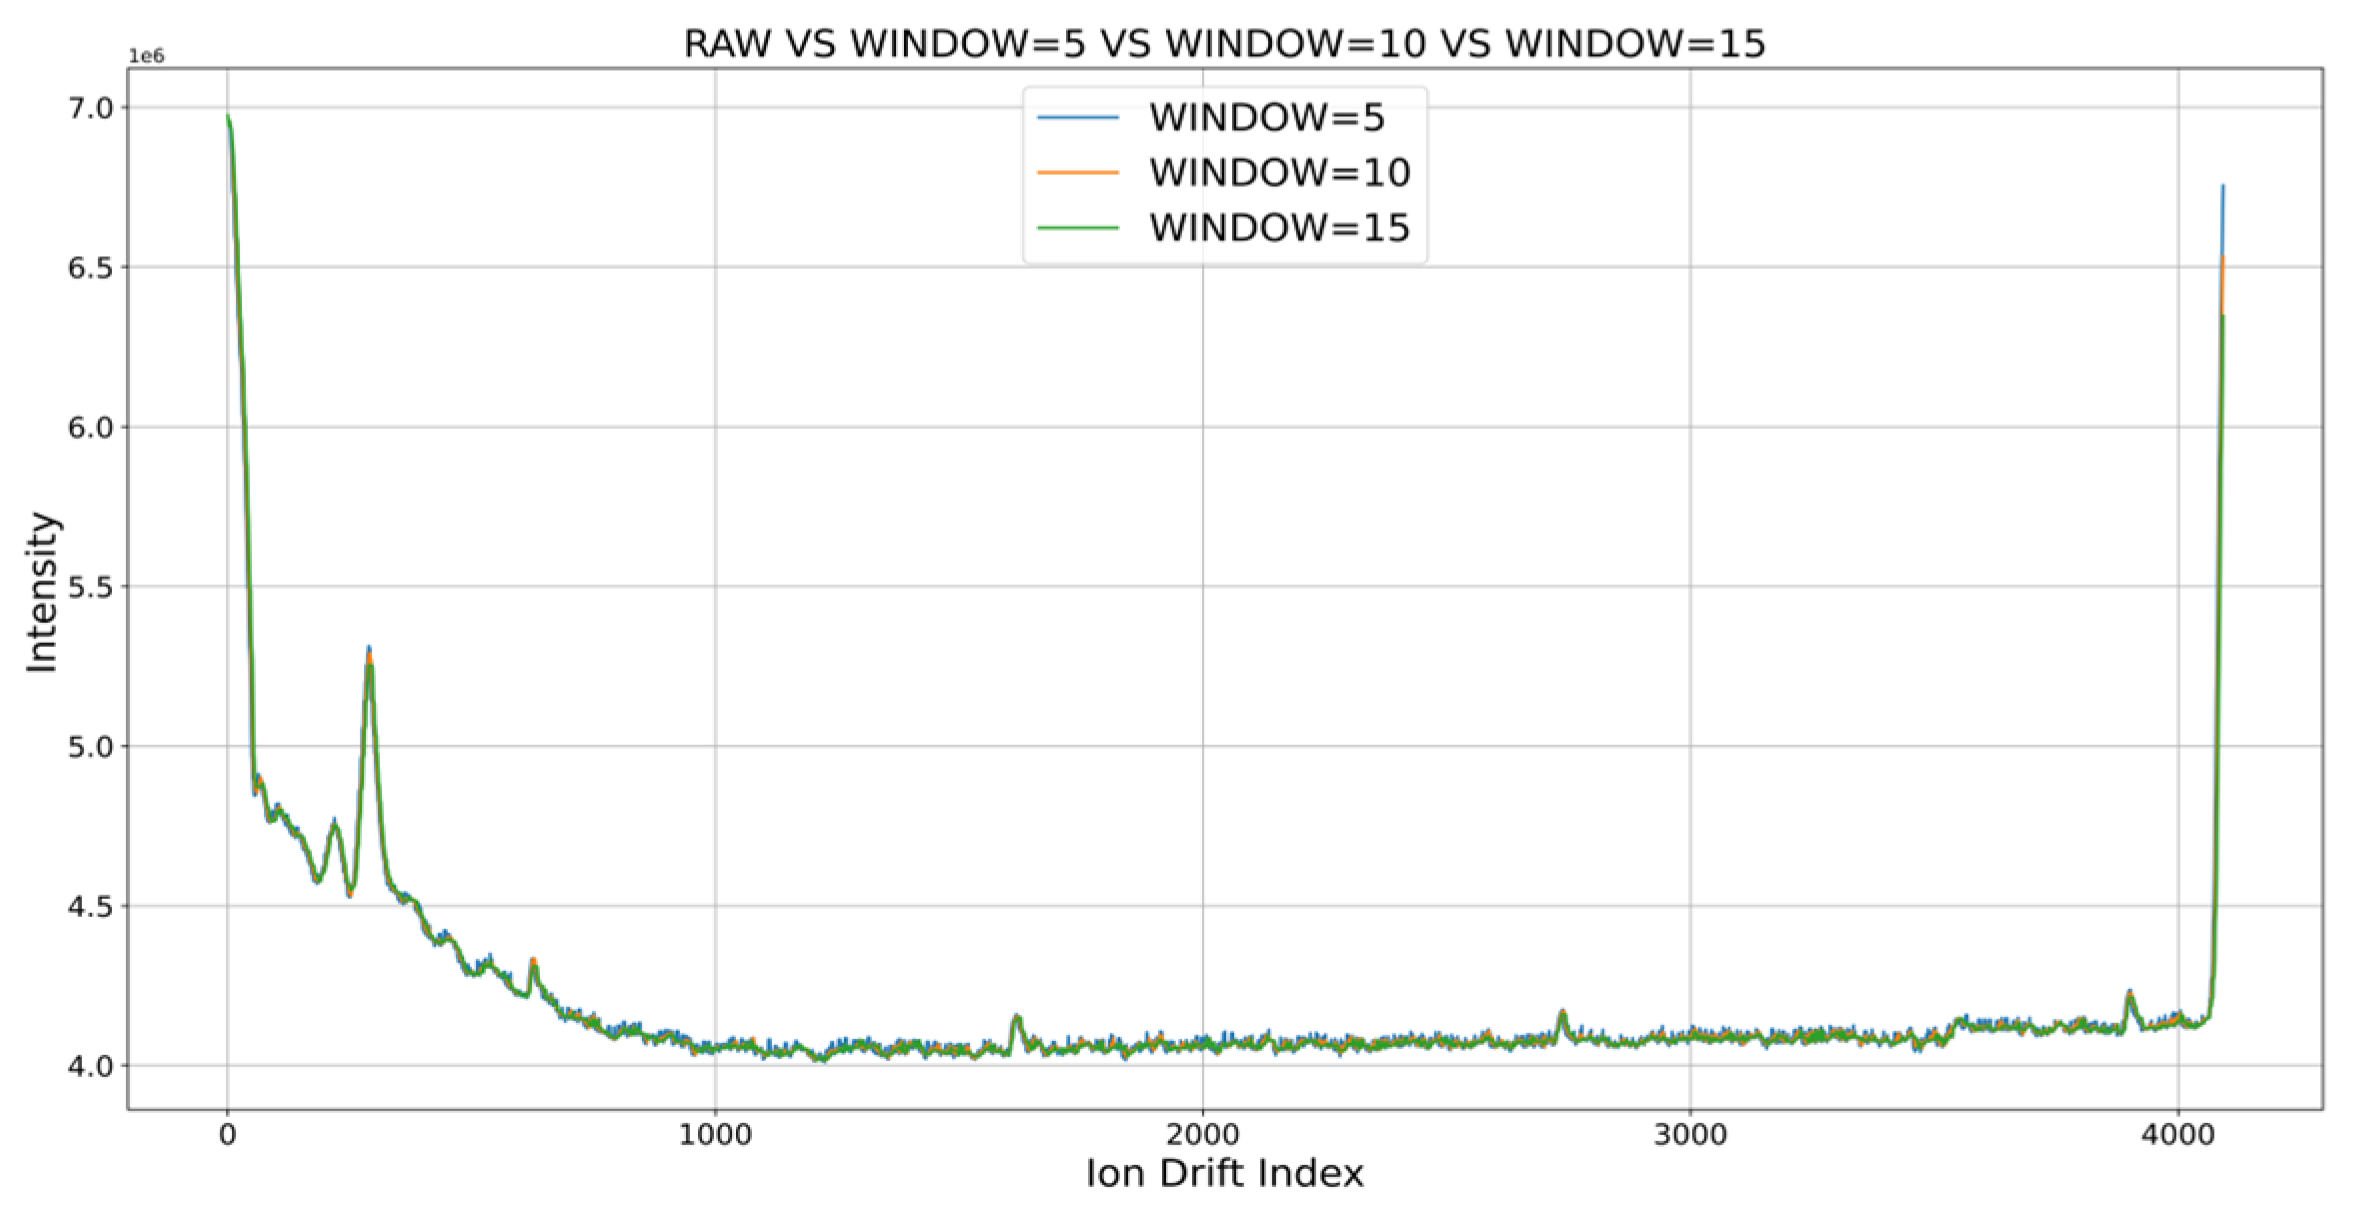
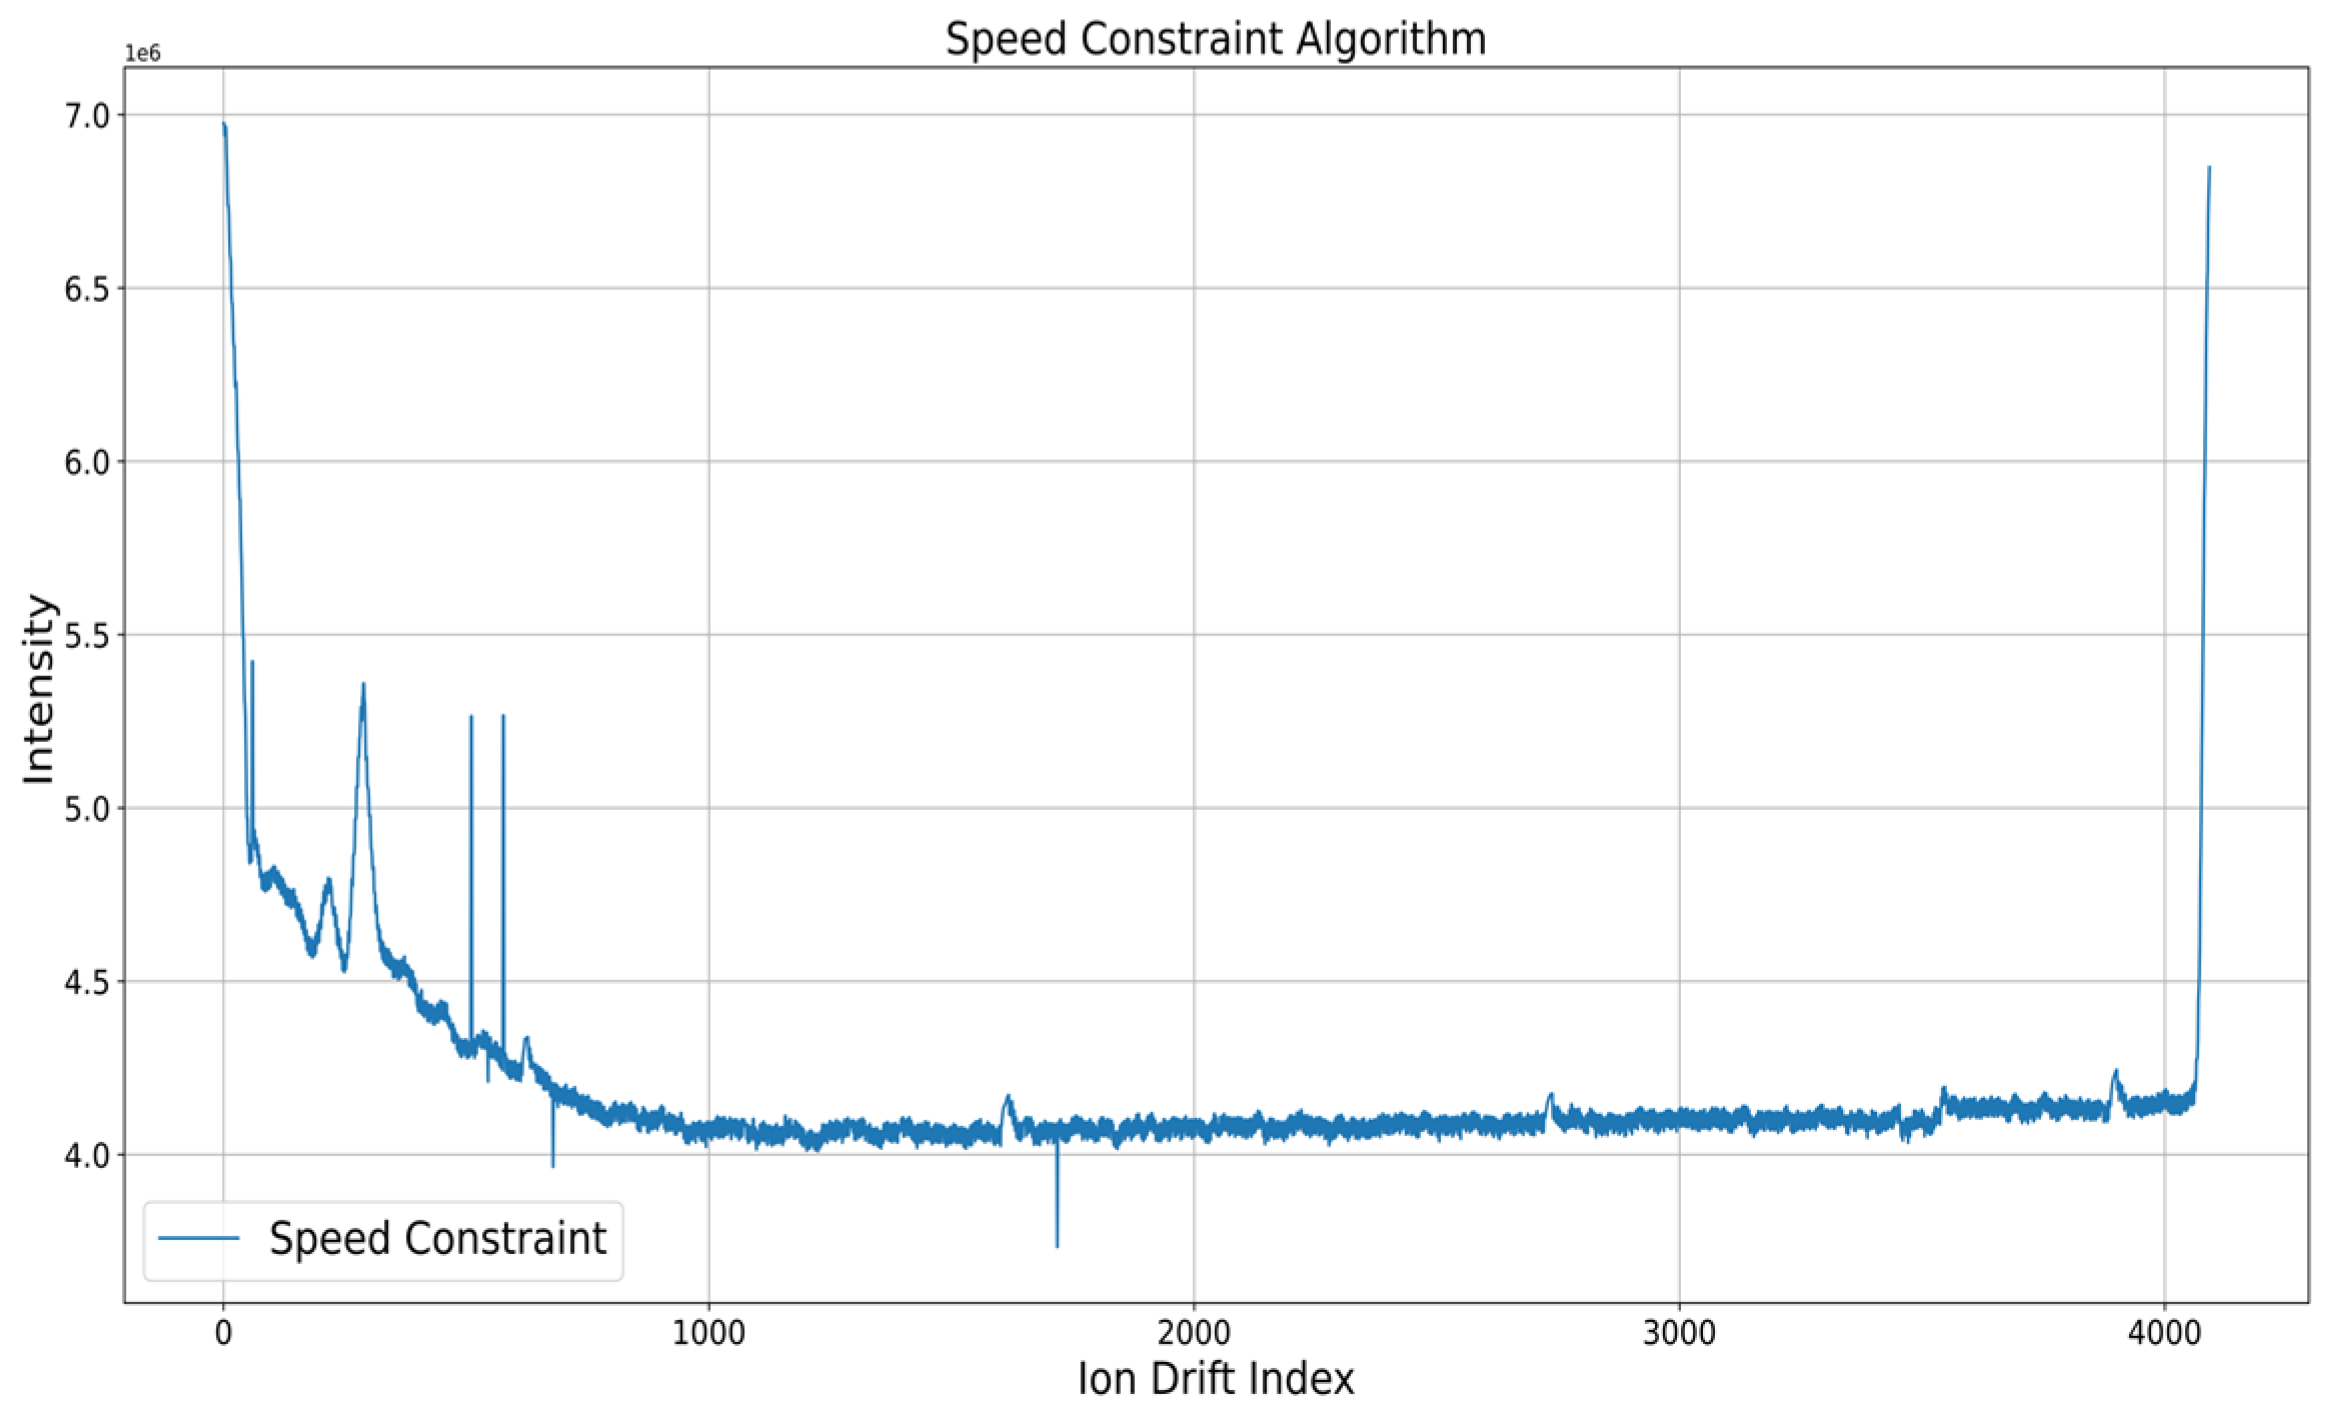
The experimental results using MA and speed constraint are shown in Figure 6 and Figure 7, respectively. Accordingly, MA removed noise regardless of the window size when the window sizes of 5, 10, and 15 were set. This was probably because, by taking the median, results showing the trend of the original data could be obtained without including noise, which was an abnormal measurement. Meanwhile, the speed constraint algorithm included some noise compared with the MA algorithm but was able to remove a large number of noises.
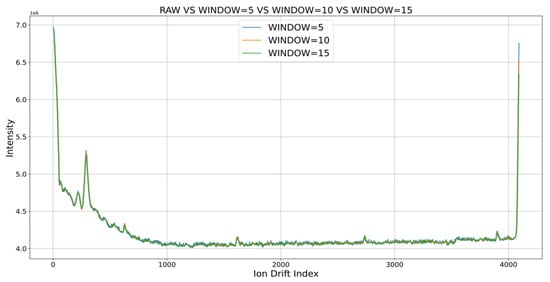
Figure 6.
Result of setting the window size of MA to 5, 10, 15.
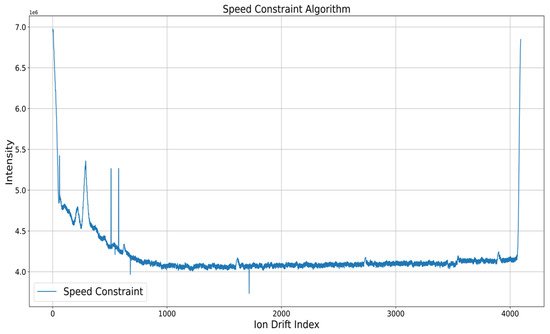
Figure 7.
Result of deploying speed constraint.
However, the speed constraint could not respond to noise that occurred without exceeding the threshold. Through experiments on the above preprocessing process, this paper took the MA-based median value in the classification algorithm before applying the narcotic IMS data to the machine learning time-series classification model. The MA algorithm was set with window_size = 10, min_period = 1, and set value = median value.
5. Narcotic IMS Data Classification Algorithm
In this paper, KNN, TSF, and ROCKET algorithms were used to classify narcotic IMS data. The algorithm in this paper required high accuracy to classify narcotic IMS data inside the container but used a machine learning algorithm with low computational complexity for smooth port operation.
5.1. KNN
KNN is used for time-series classification and is widely used for time-series data classification because of its simplicity and high performance. The KNN algorithm puts training data into the KNN model and measures similarity when test data are received and classified [15]. Methods for measuring similarity include the Euclidean algorithm and dynamic time warping (DTW) [32]. The Euclidean algorithm compares the time index in one-to-one correspondence. This method has the disadvantage of not being able to respond to the distortion of the time axis. DTW, which improves the time axis shortcomings of the Euclidean algorithm, has strengths in time axis distortion but has the disadvantage of high computational complexity. The important k of KNN is a factor that determines how much data to refer to for classification as a hyperparameter, where the performance changes depending on the k setting value [33].
5.2. TSF Algorithm
The TSF algorithm is a time-series classification algorithm that uses section features of time-series data [19]. The extracted section features are the (1) mean, (2) standard deviation, and (3) slope of the least squares regression.
Based on these three features, the TSF algorithm, which extracted features for each section, was restored and extracted with bootstrap to a random forest. Entrance gain was used as a criterion for data segmentation in the construction of random forest. Entrance gain is an element that reflects the division criteria when constructing a decision tree, along with the entropy gain and the distance to existing data.
5.3. ROCKET Algorithm
The ROCKET algorithm extracts features existing in time-series data by multiplying multiple kernels consisting of random values to the original data, similar to a previous study (where the convolution operation through kernel showed excellent performance in extracting features in the image processing field from CNN) and constructs a linear classifier on this basis [20]. The kernel has the same size and padding as those of CNN, but the ROCKET has a random size and padding.
5.4. System Application Algorithm
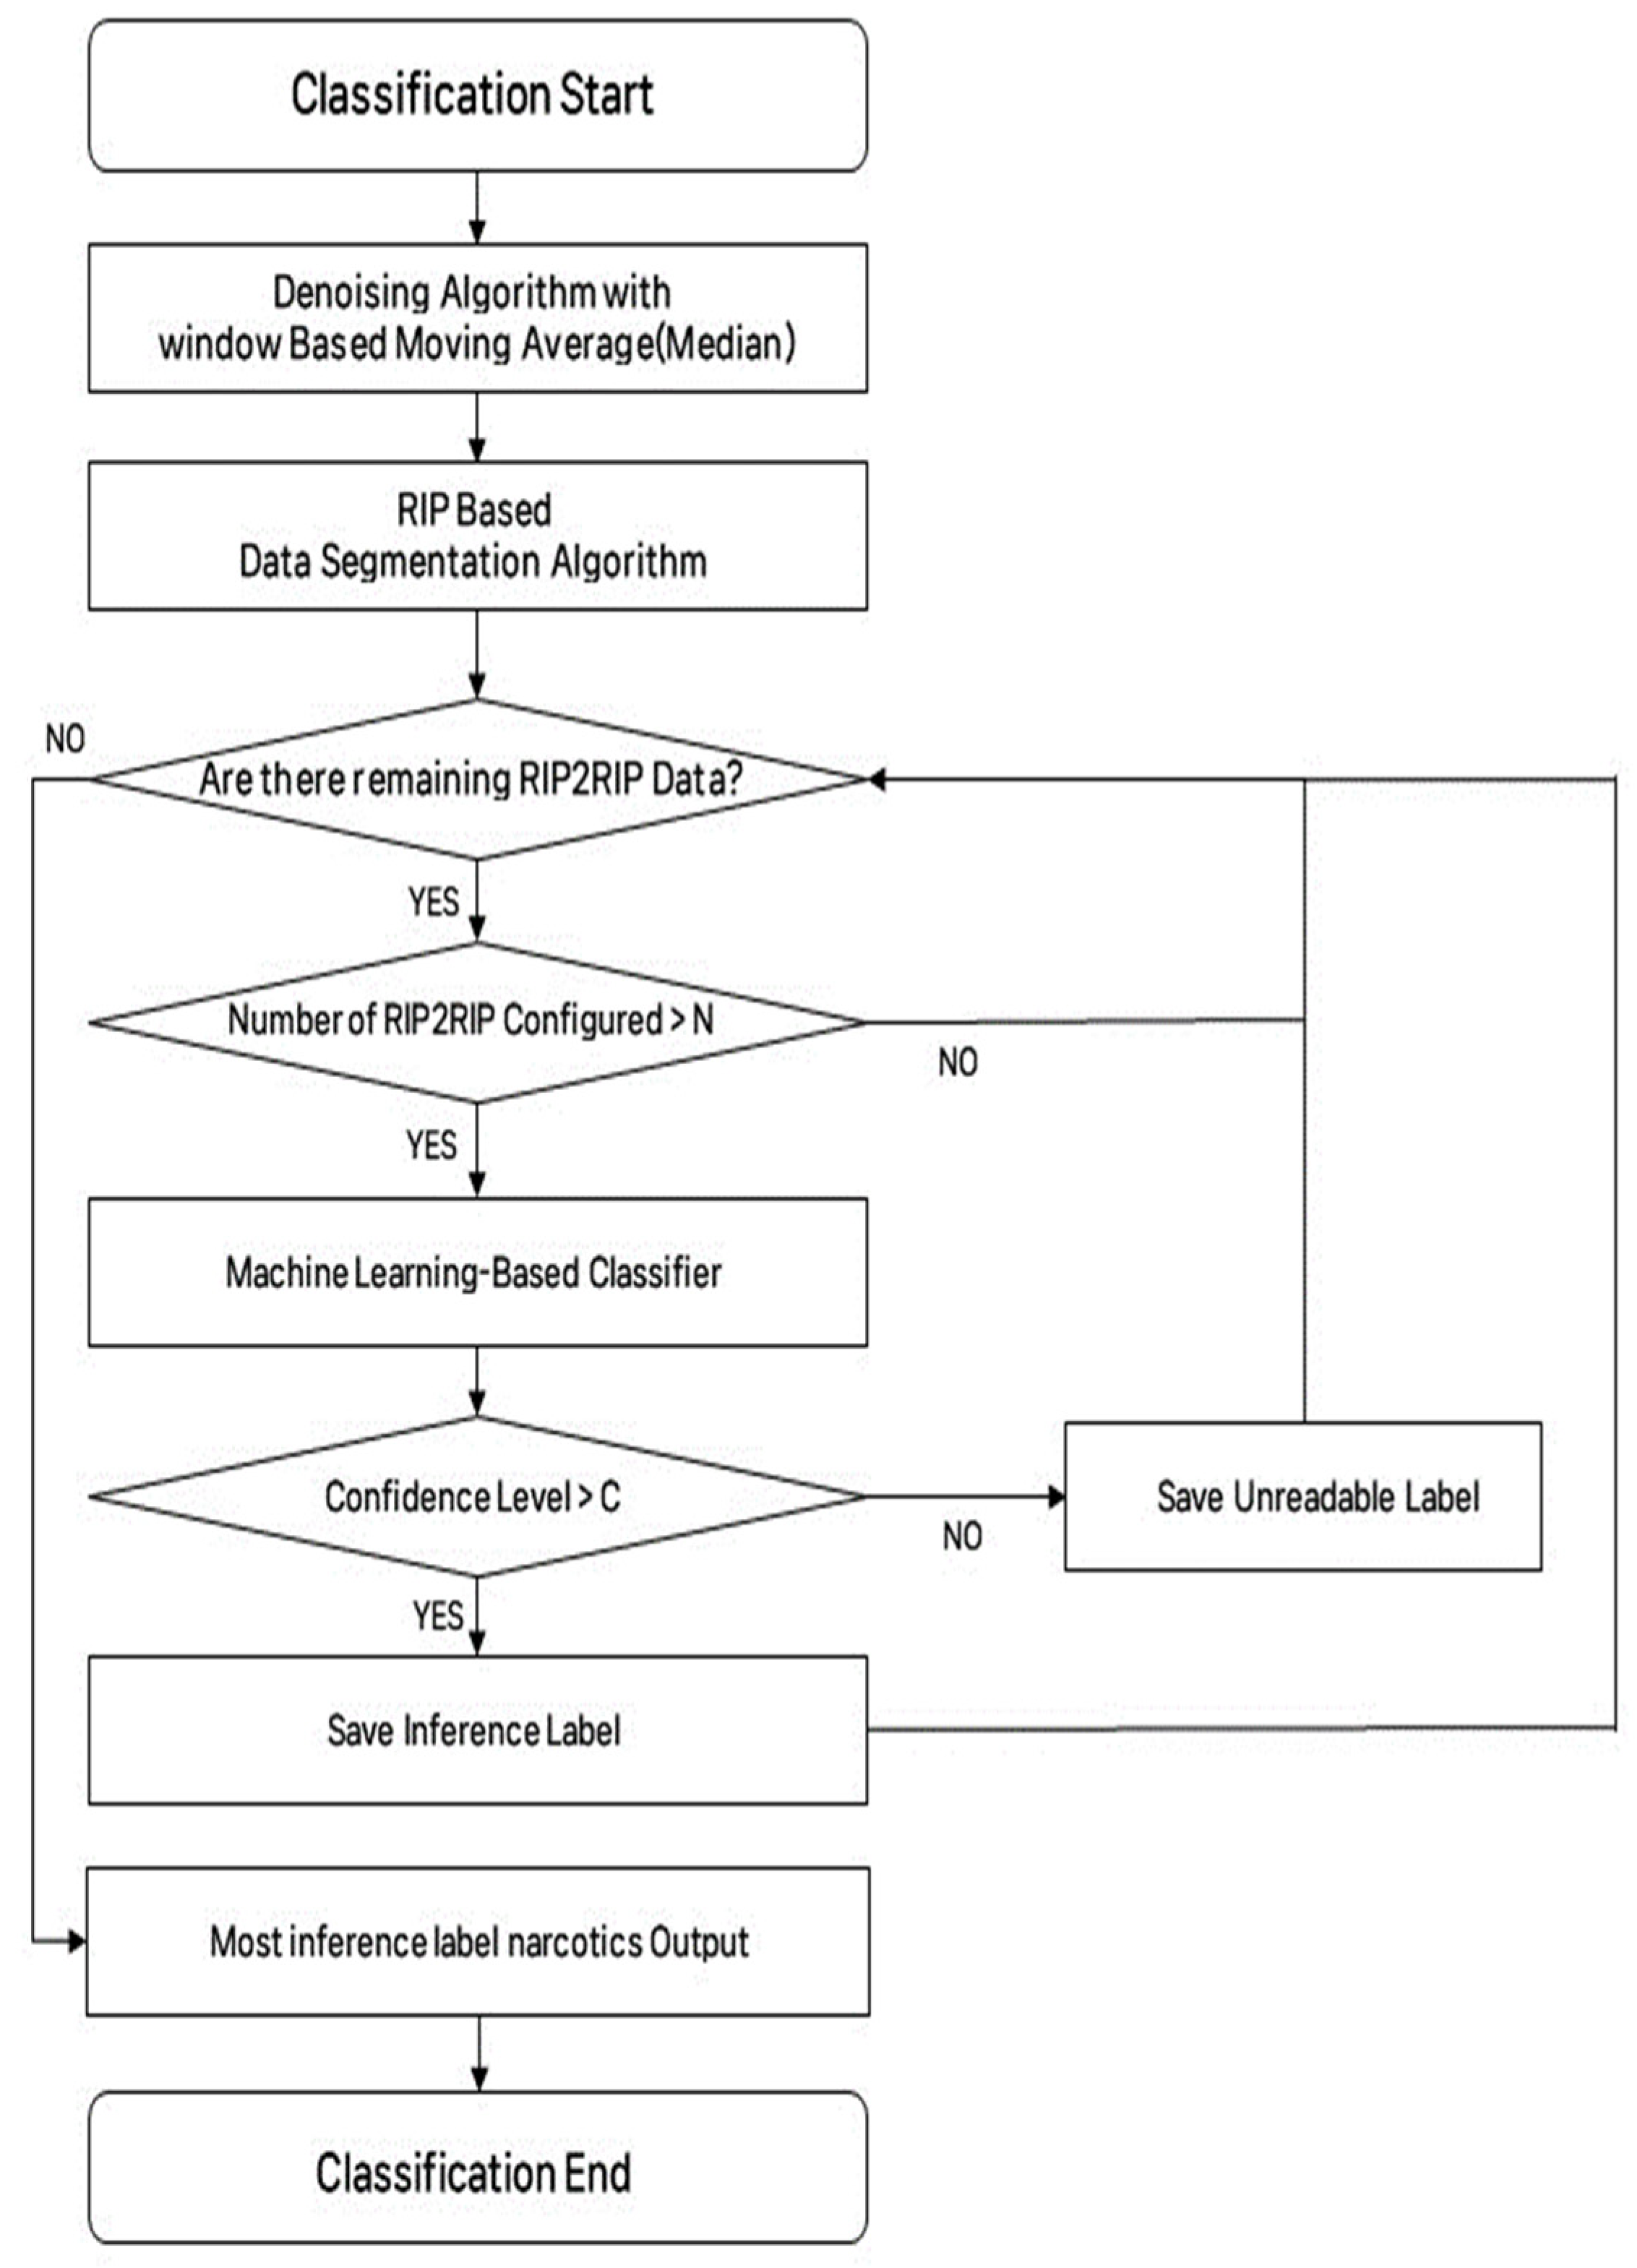
In this paper, the characteristic where the degree of response decreases over time, as mentioned in Section 3.2.2, was used to classify narcotic IMS data. Therefore, this paper proposes an algorithm shown in Figure 8. Herein, IMS data measured by the IMS device are saved in the form of a csv file on the embedded board and go through window median-based noise removal and RIP-based data segmentation. Thereafter, the data divided by RIP2RIP are imported from the csv file one by one and checked whether the number of data making up RIP2RIP was more than N. The reason for adding this process was that there were cases where the find_peaks algorithm of Scipy, which was used as an RIP-based data segmentation algorithm, could not accurately find RIP2RIP in the process of finding peaks based on the threshold set by the user. After checking the number of data constituting RIP2RIP in this way, the data were input into the classification model. Afterward, the performance of the model could be determined using the hyperparameter C of the inference probability of the label inferred from the model. When inference was completed on all RIP2RIP data, the algorithm output the most detected narcotics as the input narcotics.
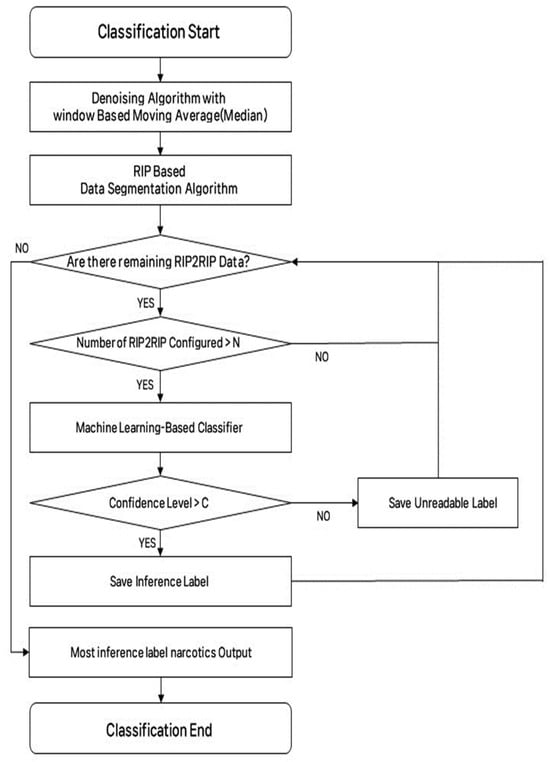
Figure 8.
System algorithm.
6. Experiment Preparation and Results
6.1. Dataset Composition
To evaluate the classification accuracy performance of each model for narcotic IMS data, all types of narcotic IMS data were trained in the KNN, TSF, and ROCKET algorithms except the threshold, and experiments were conducted in the threshold algorithm except for amphetamines, diazepam, and morphine, which had overlapped response sections. For fitting data, 20 pieces of fitting data were used from all narcotic IMS data, and the rest were used as test data given that the MDMA HCI of the narcotic IMS data was 35, which was the smallest number as shown in Table 2. In the case of the threshold algorithm, because the learning process was not required, only test data were used (i.e., without training data) for equal comparison. As mentioned in Section 4, in the preprocessing process, the window section was set to 10, the median value was taken, and Scipy’s find_peaks was used to divide the data consisting of one csv file into RIP2RIP. Therefore, in one csv file, about 800 RIP2RIPs were obtained for each sample, and a total of 7200 data in nine types of states were trained in the model. For the training and testing data lengths for classification, data with a data index of up to 1500 points were used, referring to the data time index of Alfentanil HCI, which had the largest response section data index in Figure 1 (from 850 to 1000 points). The number of csv files and RIP2RIP used for test data are shown in Table 3 and Table 4, respectively.
Table 3.
Number of testing csv files.
Table 4.
Number of testing RIP2RIP data.
In this paper, a total of four algorithms were used: threshold, Python package Pyts’ KNN, TSF, and Python package sktime’s ROCKET [34,35]. First, in the case of the threshold algorithm, an experiment was conducted by setting the response section by reflecting the heat map of the data and setting the median value in the response section as the threshold. The standards for the threshold are shown in Table 5.
Table 5.
Standards for the threshold.
KNN was used in an experiment by increasing the value of K (an important factor in data classification) from 1 to 4. In the case of the TSF algorithm, the number of decision trees that made up a random forest was set to 500, the window size for extracting features was set to 150 (10% of the input data), and Entropy was used as the division criterion. In the ROCKET algorithm, the number of kernels was set to 1000. The remaining hyperparameters were set to default. In this experiment, the classification performance indicators were compared using two system algorithms that applied the model considering the features of the narcotic IMS data, as shown in Figure 8, and the experiment that applied the data to each algorithm.
6.2. Experiment Results
The experimental results show the classification results for each RIP2RIP through the threshold, KNN, TSF, and ROCKET algorithms in Table 6. Meanwhile, Table 7 shows the results of applying the system-adapted algorithm (SAA), which was proposed considering the characteristics of narcotic IMS data. The average values of accuracy, precision, recall, and F1_score were used as comparative performance indicators.
Table 6.
Accuracy, precision, recall and F1_score evaluation results of each algorithm when SAA is not applied.
Table 7.
Accuracy, precision, recall and F1_score evaluation results of each algorithm when SSA is applied.
In Table 6, in the case of the threshold algorithm, the accuracy of classification performance for each RIP2RIP was 0.362, and the F1_score, which was the harmonic mean of precision and recall, was 0.415, indicating the lowest performance among the applied algorithms. Meanwhile, the KNN had an accuracy of 0.7 or more regardless of the value of k, and the accuracy performance decreased as the number of k increased. The TSF algorithm’s performance was improved as the confidence level decreased. Lastly, the ROCKET algorithm showed an accuracy of 0.953 and had the best performance among the compared algorithms. Through this, it was confirmed that the KNN, which classifies through similarity, and the ROCKET algorithm, which classifies through kernels, showed good classification performance despite the time-series data deformation, which is a characteristic of the narcotic IMS data mentioned in Section 3.
Table 7 shows the result of applying each algorithm to machine-learning-based classification in the proposed system algorithm considering the characteristics of narcotic IMS data. When the SAA was applied, the average accuracies of 0.9 for KNN, 0.94 for TSF, and 0.99 for ROCKET were obtained. The algorithm with the highest performance was the ROCKET algorithm. Thus, the proposed algorithm for detecting the most inferred drugs from the data measured once was confirmed to have good performance.
7. Embedded Board Application and Time Required
In this section, we checked the data processing time by applying the algorithm to an embedded board to confirm the purpose of quickly inferring using machine learning instead of the DNN method, which has high time complexity, to classify narcotic IMS data.
Embedded Board Specifications and Operating Time
The embedded board for classifying narcotic IMS data was operated on a board equipped with NVIDIA’s TX2. The algorithms operated were KNN, TSF, and ROCKET applied to the system application algorithm. Looking at Table 8, the KNN method showed an average operation time of 2.7 s, which was the fastest performance. Meanwhile, the TSF algorithm had an average operating time of about 5 s, whereas the ROCKET algorithm had an average operating time of about 30 s due to convolution operations. In this regard, KNN can construct a system with an accuracy of 0.98 within 2 s on average when k is set to 4.
Table 8.
Algorithm running time.
8. Conclusions
This paper proposed a method for classifying narcotic data using IMS in port containers. Related research on classification algorithms, KNN, machine learning, and deep learning methods through air intake in port containers were examined. After that, the features of the narcotic IMS data were examined, considering that narcotic IMS data are not a widely used benchmark dataset. Based on these features, a preprocessing method that takes the median value using the window was taken, and the threshold, KNN, TSF, and ROCKET algorithms were applied. The classification performance index using only the model was somewhat low; thus, to apply it to the system to change the degree of reaction in the response section shown in the narcotic IMS data, one csv file was divided into RIP2RIP data, and most output from the inference label for each RIP2RIP was set as a prediction label. Through the above methodology, results of improved performance indicators in all algorithms can be obtained. Moreover, the recall indicators were all 1 in the performance indicators. In this respect, there was no case of misclassification. This can gain confidence in the system from port operators who operate narcotic IMS detectors, and this can eliminate unnecessary fatigue of the operators. In terms of time, absolute time reduction was confirmed by applying the created system to the embedded board, and it was confirmed that it operated in less than a minute even on the embedded board. The most suitable algorithm for processing port narcotics IMS data was the KNN (k = 4) algorithm. In this way, by comparing the performances of narcotic IMS steam data using the machine learning algorithm and using the features of the data, a system that detects a total of eight types of narcotics using the air inside the actual container may be expected. Moreover, this study utilized IMS data acquired from samples of 100ng and 300ng. This is promising as it indicates that even if only ten-millionths of the substance is present when air inside a container—where drugs are transported in kilogram units—is inhaled, trace amounts of drugs can be detected. In this study, we have confirmed significant performance by conducting classification based on data acquired in a limited experimental environment. However, since the data used in the experiment were obtained in a restricted environment, further experiments are required with data collected from actual containers. Furthermore, to address the limitations of IMS data, such as the necessity of a reference library and the inability to measure mixtures, we intend to conduct additional research on augmented learning and data feature extraction algorithms [36].
Author Contributions
Conceptualization, T.I.; methodology, T.I.; software, S.P.; validation, G.K.; formal analysis, S.P.; investigation, S.P.; resources, S.C.; data curation, S.P.; writing—original draft preparation, S.P.; writing—review and editing, T.I.; visualization, S.P.; supervision, T.I.; project administration, T.I.; funding acquisition, K.K. All authors have read and agreed to the published version of the manuscript.
Funding
This research was supported by Korea Institute of Marine Science & Technology Pro-motion (KIMST) funded by the Ministry of Oceans and Fisheries, Korea (20200611). This research was supported by Korea Institute of Marine Science & Technology Promotion (KIMST) funded by the Ministry of Oceans and Fisheries, Korea (202201653). This research was supported by the MSIT (Ministry of Science and ICT), Korea, under the ITRC (Information Technology Research Center) support program grant number IITP-2023-2018-0-01417 supervised by the IITP (Institute for In-formation & Communications Technology Planning & Evaluation).
Institutional Review Board Statement
Not applicable.
Informed Consent Statement
Not applicable.
Data Availability Statement
Data are contained within the article.
Conflicts of Interest
The authors declare no conflict of interest.
References
- Korea Prosecution Service. White Paper on Narcotic Crimes Chapter 3; Korea Prosecution Service: Seoul, Republic of Korea, 2022; p. 98. [Google Scholar]
- Moser, A.Y.; Bizo, L.; Brown, W.Y. Olfactory generalization in detector dogs. Animals 2019, 9, 702. [Google Scholar] [CrossRef]
- Li, W.; Chen, J.; Wu, X.; Wang, W. The automatic detection of hiding narcotics in human bodies based on fractal dimension and SVM classification. In Proceedings of the 2017 2nd IEEE International Conference on Computational Intelligence and Applications (ICCIA), Beijing, China, 8–11 September 2017; pp. 84–87. [Google Scholar]
- Jakobsson, A.; Mossberg, M. Using spatial diversity to detect narcotics and explosives using NQR signals. IEEE Trans. Signal Process. 2007, 55, 4721–4726. [Google Scholar] [CrossRef]
- Goubran, R.A.; Lawrence, A.H. DSP techniques for narcotic detection using ion mobility spectrometry. In Proceedings of the IEEE Instrumentation and Measurement Technology Conference Sensing, Processing, Networking, IMTC Proceedings, Ottawa, ON, Canada, 19–21 May 1997; Volume 1, pp. 404–407. [Google Scholar]
- Xiao, C.; Chen, N.; Hu, C.; Wang, K.; Xu, Z.; Cai, Y.; Xu, L.; Chen, Z.; Gong, J. A spatiotemporal deep learning model for sea surface temperature field prediction using time-series satellite data. Environ. Model. Softw. 2019, 120, 104502. [Google Scholar] [CrossRef]
- Braei, M.; Wagner, S. Anomaly detection in univariate time-series: A survey on the state-of-the-art. arXiv 2020, arXiv:2004.00433. [Google Scholar]
- Yao, H.; Xue, T.; Wang, D.; Qi, Y.; Su, M. Development direction of automated terminal and systematic planning of smart port. In Proceedings of the 2021 IEEE 2nd International Conference on Big Data, Artificial Intelligence and Internet of Things Engineering (ICBAIE), Nanchang, China, 26–28 March 2021; pp. 708–712. [Google Scholar]
- Yau, K.-L.A.; Peng, S.; Qadir, J.; Low, Y.C.; Ling, M.H. Towards smart port infrastructures: Enhancing port activities using information and communications technology. IEEE Access 2020, 8, 83387–83404. [Google Scholar] [CrossRef]
- Heikkilä, M.; Saarni, J.; Saurama, A. Innovation in smart ports: Future directions of digitalization in container ports. J. Mar. Sci. Eng. 2022, 10, 1925. [Google Scholar] [CrossRef]
- Darban, Z.Z.; Webb, G.I.; Pan, S.; Aggarwal, C.C.; Salehi, M. Deep learning for time series anomaly detection: A survey. arXiv 2022, arXiv:2211.05244. [Google Scholar]
- Kostelich, E.J.; Schreiber, T. Noise reduction in chaotic time-series data: A survey of common methods. Phys. Rev. E 1993, 48, 1752. [Google Scholar] [CrossRef]
- Nanopoulos, A.; Alcock, R.; Manolopoulos, Y. Feature-based classification of time-series data. In Information Processing and Technology; Nikos, M., Stavros, D.N., Eds.; Nova Science Publishers, Inc.: Hauppauge, NY, USA, 2001; pp. 49–61. [Google Scholar]
- Liu, U.; Zhang, Y.; Cao, Y.; Zhu, Y.; Zaidi, N.; Ranaweera, C.; Li, G.; Zhu, Q. Kernel-based feature extraction for time series clustering. Knowledge science, engineering and management. In Proceedings of the 16th International Conference, KSEM 2023, Guangzhou, China, 16–18 August 2023; pp. 276–283. [Google Scholar]
- Cover, T.M.; Hart, P.E. Nearest neighbor pattern classification. IEEE Trans. Inf. Theor. 1967, 13, 21–27. [Google Scholar] [CrossRef]
- Grochowalski, J.M.; Chady, T. Rapid identification of material defects based on pulsed multifrequency eddy current testing and the k-nearest neighbor method. Materials 2023, 16, 6650. [Google Scholar] [CrossRef]
- Chiappa, V.; Bogani, G.; Interlenghi, M.; Vittori Antisari, G.; Salvatore, C.; Zanchi, L.; Ludovisi, M.; Leone Roberti Maggiore, U.; Calareso, G.; Haeusler, E.; et al. Using radiomics and machine learning applied to MRI to predict response to neoadjuvant chemotherapy in locally advanced cervical cancer. Diagnostics 2023, 13, 3139. [Google Scholar] [CrossRef]
- Breiman, L. Random forests. Mach. Learn. 2001, 45, 5–32. [Google Scholar] [CrossRef]
- Deng, H.; Runger, G.; Tuv, E.; Vladimir, M. A time series forest for classification and feature extraction. Inf. Sci. 2013, 239, 142–153. [Google Scholar] [CrossRef]
- Dempster, A.; Petitjean, F.; Webb, G.I. ROCKET: Exceptionally fast and accurate time series classification using random convolutional kernels. Data Min. Knowl. Discov. 2019, 34, 1454–1495. [Google Scholar] [CrossRef]
- Hochreiter, S.; Schmidhuber, J. Long short-term memory. Neural Comput. 1997, 9, 1735–1780. [Google Scholar] [CrossRef] [PubMed]
- Vaswani, A.; Shazeer, N.; Parmar, N.; Uszkoreit, J.; Jones, L.; Gomez, A.N.; Kaiser, L.; Polosukhin, I. Attention is All You Need. In Proceedings of the 31st International Conference on Neural Information Processing Systems, NIPS’17, Red Hook, NY, USA, 4–9 December 2017; Curran Associates Inc.: Red Hook, NY, USA, 2017; pp. 6000–6010. [Google Scholar]
- Liang, Z.; Powell, A.; Ersoy, I.; Poostchi, M.; Silamut, K.; Palaniappan, K.; Guo, P.; Hossain, M.A.; Sameer, A.; Maude, R.J.; et al. Cnn-based image analysis for malaria diagnosis. In Proceedings of the 2016 IEEE International Conference on Bioinformatics and Biomedicine (BIBM), Shenzhen, China, 15–18 December 2016; pp. 493–496. [Google Scholar]
- Wang, Z.; Oates, T. Encoding time series as images for visual inspection and classification using tiled convolutional neural networks. In Proceedings of the Workshops at the Twenty-Ninth AAAI Conference on Artificial Intelligence, Austin, TX, USA, 25–30 January 2015; AAAI Publications: Austin, TX, USA, 2015; Volume 1. [Google Scholar]
- Eckmann, J.P.; Kamphorst, S.O.; Ruelle, D. Recurrence plots of dynamical systems. Europhys. Lett. 1987, 4, 973–977. [Google Scholar] [CrossRef]
- Chen, T.; Sampath, V.; May, M.C.; Shan, S.; Jorg, O.J.; Aguilar Martín, J.J.; Stamer, F.; Fantoni, G.; Tosello, G.; Calaon, M. Machine learning in manufacturing towards industry 4.0: From ‘for now’ to ‘four-know’. Appl. Sci. 2023, 13, 1903. [Google Scholar] [CrossRef]
- Zhang, J.; Huang, C.; Chow, M.Y.; Li, X.; Tian, J.; Luo, H.; Yin, S. A Data-model Interactive Remaining Useful Life Prediction Approach of Lithium-ion Batteries Based on PF-BiGRU-TSAM. IEEE Trans. Ind. Inform. 2023, 2023, 3266403. [Google Scholar] [CrossRef]
- Jafari, S.; Byun, Y.-C. A CNN-GRU Approach to the Accurate Prediction of Batteries’ Remaining Useful Life from Charging Profiles. Computers 2023, 12, 219. [Google Scholar] [CrossRef]
- Ju, H.S.; Kim, D.H.; Cho, S.Y.; Park, K.H.; Kim, Y.S.; Jeon, W.K.; Kwon, K.W. Adaptive window-based detection of narcotics and explosives using IMS signals in cargo containers. J. Internet Comput. Serv. 2022, 23, 57–65. [Google Scholar]
- Wang, X.; Wang, C. Time series data cleaning: A survey. IEEE Access 2020, 8, 1866–1881. [Google Scholar] [CrossRef]
- Song, S.; Zhang, A.; Wang, J.; Yu, P.S. SCREEN: Stream data cleaning under speed constraints. In Proceedings of the 2015 ACM SIGMOD International Conference on Management of Data, Melbourne, Australia, 31 May–4 June 2015; pp. 827–841. [Google Scholar]
- Berndt, D.J.; Clifford, J. Using dynamic time warping to find patterns in time series. In Proceedings of the KDD Workshop, Anchorage, AK, USA, 4–8 August 2019; pp. 359–370. [Google Scholar]
- Batista, G.; Silva, D.F. How k-nearest neighbor parameters affect its performance. In Proceedings of the Argentine Symposium on Artificial Intelligence (ASAI), Mar del Plata, Argentina, 24–28 August 2009; Citeseer: Princeton, NJ, USA, 2009; pp. 95–106. [Google Scholar]
- Faouzi, J.; Janati, H. pyts: A python package for time series classification. J. Mach. Learn. Res. 2020, 21, 1–6. [Google Scholar]
- Löning, M.; Bagnall, A.; Ganesh, S.; Kazakov, V.; Lines, J.; Király, F.J. sktime: A unified interface for machine learning with timeseries. arXiv 2019, arXiv:1909.07872. [Google Scholar]
- Tai, C.-Y.; Wang, W.-J.; Huang, Y.-M. Using Time-Series Generative Adversarial Networks to Synthesize Sensing Data for Pest Incidence Forecasting on Sustainable Agriculture. Sustainability 2023, 15, 7834. [Google Scholar] [CrossRef]
Disclaimer/Publisher’s Note: The statements, opinions, and data contained in all publications are solely those of the individual author(s) and contributor(s) and not of MDPI and/or the editor(s). MDPI and/or the editor(s) disclaim responsibility for any injury to people or property resulting from any ideas, methods, instructions, or products referred to in the content. |
Disclaimer/Publisher’s Note: The statements, opinions and data contained in all publications are solely those of the individual author(s) and contributor(s) and not of MDPI and/or the editor(s). MDPI and/or the editor(s) disclaim responsibility for any injury to people or property resulting from any ideas, methods, instructions or products referred to in the content. |
© 2023 by the authors. Licensee MDPI, Basel, Switzerland. This article is an open access article distributed under the terms and conditions of the Creative Commons Attribution (CC BY) license (https://creativecommons.org/licenses/by/4.0/).