Abstract
The bonding properties between rubber granule–basalt fiber composite modified concrete (RBFC) and rebar greatly impact the load-carrying capacity, stiffness, and crack development of RBFC structures. In this paper, the effects of rebar diameter, bonding length, and concrete type on the bonding properties between RBFC and rebar were investigated using center pull-out tests. The bond stress–slip curve as well as the bond strength and its influencing factors were discussed in detail, and a semi-theoretical and semi-empirical model of RBFC with rebar was established. According to the findings, when rubber granules were added to concrete, its bond strength with rebar decreased. At a dosage of 5%, the bond strength was reduced by approximately 4% compared to ordinary concrete (OC) under the same conditions. It was shown that the addition of small amounts of rubber granules did not significantly reduce the bond strength. On the other hand, the incorporation of an appropriate amount of basalt fibers had a positive effect on the bond strength. An admixture of 4.56 Kg/m3 of fibers increased the bond strength by 3% compared to OC under the same conditions. The bond strength of RBFC with these two additions was improved by approximately 2% compared to OC under the same conditions. When the bonding length was 60 to 100 mm, the ultimate bond strength decreased with increasing bonding lengths. The bond strength decreased by 13.91–16.72% for every 20 mm increase in bonding length. When the rebar diameter was 12 to 16 mm, the ultimate bond stress decreased as the rebar diameter increased. The bond strength decreased by 3.96–5.94% for every 2 mm increase in rebar diameter. The segmental bond–slip constitutive model between RBFC and rebar, established using the results of the center pull-out test, can provide a reference basis for engineering applications of RBFC.
1. Introduction
The strong bonding properties between rebar and concrete are important indicators for judging whether the concrete can be used in engineering structures, and they are crucial for the design of concrete structures [1]. In practical engineering, the most common way to improve bond strength is to use ribbed rebar [2]. Therefore, the study of bonding properties between ribbed rebar and concrete is of significant research interest. The bonding properties between ribbed rebar and concrete are mainly composed of three parts: chemical adhesion, the friction force, and the mechanical occlusion force [3]. All three components of bond stress are closely related to the properties of the concrete.
Ordinary concrete (OC) has the disadvantages of poor frost resistance, insufficient toughness, and poor impact resistance in practical engineering applications [4,5,6]. Therefore, scholars have attempted to incorporate rubber granules or rubber powder in concrete to replace coarse and fine aggregates. These practices not only reduce the apparent density of concrete but also reduce its elastic modulus. Also, they increase the toughness and impact resistance of concrete [7,8,9,10] and improve its frost resistance [11]. In addition, the incorporation of rubber particles into concrete also has the practical significance of environmental protection and resource utilization by reducing the ”black pollution“ [12,13,14] caused by the improper disposal of waste rubber. However, when investigating their bonding properties, it was found that when rubber granules of different dosages and particle sizes were incorporated into concrete, they would cause its bond strength to decrease to different degrees. A small dosage of rubber granules had a smaller effect on the bond strength of the concrete. Wu, Y.T. et al. [15] found that the bond strength of concrete decreased when increasing amounts of rubber granules were added. After a compound treatment with rubber granules, the bond strength improvement was more significant. Wen, P. [16] found a non-linear relationship between the rubber granule dosage and the bond strength, which decreased with increasing rubber granule dosages. Additionally, as the rebar diameter increased, the bond strength of threaded-steel rebar–rubber concrete increased and then decreased, and the bond strength of light round rebar–rubber concrete showed an increasing trend. Mehme Gesogl et al. [17] found that when rubber particles were incorporated at 5%, the bond strength was only 3% lower than that of ordinary concrete and then decreased rapidly.
Scholars have also found that when basalt fibers were incorporated into concrete, they equally enhanced the durability and fatigue resistance of the concrete [9,10,18,19,20,21,22]. Scholars have researched the bonding properties and found that the inclusion of basalt fibers does not significantly reduce the bonding properties and that an appropriate amount of admixture could enhance the bond strength. Ma, Y. et al. [23] found that when basalt fibers were mixed into concrete, the bond anchorage properties of the rebar and concrete failed to show a positive impact. When the length of the fibers increased, the bond strength between the concrete and rebar showed an upward trend. Qiaowei Bi [24] found that the bonding properties of basalt-fiber-reinforced plastics (BFRP) and basalt fiber concrete were related to the bonding length. The average bond strength decreased with increasing bonding lengths. When the fibers had a content of 0.1%, the bond performance was enhanced the most compared to OC.
As a new type of cement-based concrete, rubber granule–basalt fiber composite modified concrete (RBFC) combines the advantages of both concrete types, including high durability, high toughness, and high strength [25,26]. Research on the bonding properties of RBFC and rebar is an important part of promoting the application of RBFC in engineering structures. However, the simultaneous incorporation of rubber granules and basalt fibers into concrete results in microstructural and performance differences compared to cases where they are individually incorporated into concrete. Therefore, the existing theoretical studies on the bonding properties of these two concrete types and rebar can hardly be applied. There is limited research on the bonding properties between RBFC and ribbed rebar. Therefore, it is essential to analyze the bonding properties between RBFC and rebar to establish a theoretical basis for the promotion and application of RBFC in engineering structures.
Various forms of bond–slip constitutive models have been proposed by scholars for the bond-slip between rebar and composite concrete. The dominant expressions are the BEP four-segment model [27], the three-segment model that improves the BEP [28], and the continuous curve model proposed by Gao [29,30]. However, the expressions for the micro-slip segment during the early stage of loading are vague and do not explicitly represent this stage. Moreover, the damage process in the uplift section is actually a gradual transformation from an elastic section to an elastic–plastic section, and the uplift section needs to be delineated more carefully. Consequently, a precise, brief, and effective bond–slip constitutive model based on the actual damage process of RBFC and rebar must be developed.
In this study, 54 specimens from 18 sets of center pull-out tests of RBFC were used to investigate the effects of rebar diameters, bonding lengths, and concrete types on the bonding properties between RBFC and rebar. The process of bond–slip failure between RBFC and rebar was better elucidated. By analyzing and exploring various bond stress–slip curve sets and combining them with experimental data, a semi-theoretical and semi-empirical bond–slip constitutive model of RBFC with rebar was obtained.
2. Materials and Methods
2.1. Experimental Materials
P-II 42.5 Portland cement produced by Jilin Yatai Cement Co., Ltd. (Jilin, China) was used as the cementitious material. The chemical components of Portland cement are presented in Table 1. The coarse aggregate was continuously graded basalt gravel with a grain size range of 5–25 mm. The fine aggregate was natural river sand with a fineness modulus of 2.8 and a grain size range of 0.1–4.75 mm. Rubber granules with a particle size of 20 mesh were produced by Dujiangyan Huayi Rubber Co., Ltd. (Dujiangyan, China). The technical indicators of the rubber granules are shown in Table 2. Basalt fibers 23 μm in diameter and 18 mm in length were used, and they were produced by Shanghai Chenqi Chemical Technology Co., Ltd. (Shanghai, China). Their physical properties are shown in Table 3. The ZYTPC (HPWR)-type polycarboxylic acid water-reducing agent produced by Hunan Zhongyan Building Materials Technology Co. (Changsha, China) was adopted. With a dosage of 1%, the water-reducing efficiency was 25%. Rebar with diameters of 12 mm, 14 mm, and 16 mm were produced by Jiangsu Longyi Metal Products Co., Ltd. (Wuxi, China). The performance parameters of the rebar are shown in Table 4. Tap water was selected as the test water.

Table 1.
Chemical components of Portland cement.
Table 2.
Technical indicators of rubber granules.
Table 3.
Physical properties of basalt fibers.
Table 4.
Performance parameters of rebar.
The proportioning design of the RBFC was settled in accordance with the Chinese Standard JGJ 55-2011 [31] and CECS 38-2004 [32], with a compressive strength of 40 MPa. The mix ratio design is shown in Table 5. The pre-optimal mix ratio has been studied, and the dosages of rubber granules and basalt fibers in this study were designed according to the pre-optimal mix ratio of RBFC by Gong Y [33]. A water–cement ratio of 0.39, a rubber granule dosage of 10%, and a basalt fiber dosage of 4.56 kg/m3 were chosen. The effects of the dosages of rubber granules and basalt fibers on bond strength were not investigated in this study.
Table 5.
Designs of concrete mix ratio.
2.2. Specimen Design and Preparation
In this study, specimens with dimensions of 150 mm × 150 mm × 150 mm were designed according to the Chinese Standard GB 50152-2012 [34]. A dimensional concept of a cubic specimen is shown in Figure 1. The test mold was made, as shown in Figure 2. The rebar was HRB400 ribbed rebar with bonding lengths of 60 mm, 80 mm, and 100 mm. Polyvinyl chloride (PVC) tubes with a diameter of 40 mm filled with Styrofoam were used in unbonding sections with pre-built lengths of 45 mm, 35 mm, and 25 mm.
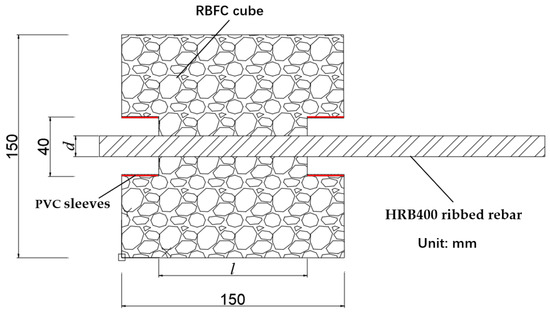
Figure 1.
Dimensional concept of the specimen.
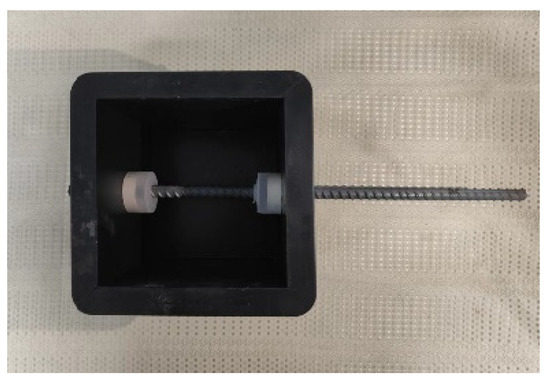
Figure 2.
Test mold.
The specimen was prepared and cured, and the feeding sequences, mixing processes, and mixing times were designed according to the Chinese Standard GB/T 50080-2016 [35]. The steps are shown below. (1) Add the weighed coarse aggregates and mix for 60 s to ensure even dispersion. Add basalt fibers to the mixer and mix for 90 s. (2) Add the weighed fine aggregates and rubber granules to the mixer and mix for 60 s. (3) Add the weighed cement to the mixer and mix for 120 s. (4) Dissolve the weighed water-reducing agent in the already weighed water and mix well. Infuse half of the mixture into the mixer and mix for 60 s. Then, add the remaining mixture to the mixer and mix for 120 s. (5) Pour the mixed concrete into the test molds and place them on a vibration table to vibrate and compact. (6) Demold the test molds after 24 h. Place the molded specimens in a curing chamber at a temperature of 20 °C and a relative humidity of 95% for 28 days and then take the specimens out.
The detailed parameters of the specimens are shown in Table 6.
Table 6.
Detailed parameters of the specimens for center pull-out tests.
2.3. Loading Details
A 200 kN electro-hydraulic servo fatigue testing machine (MTS) was selected as the test apparatus, as shown in Figure 3a. The test apparatus was controlled by a computer numerical control system, and the load was output from it. The displacement data of the free end were measured using a displacement meter, as shown in Figure 3b. During the experiments, the lower collet of the MTS clamped and fixed the 30 mm diameter high-tensile-strength bolts to the lower part of the bracket while the specimen was placed on the upper part of the bracket. The rebar was clamped through pre-drilled holes in the top clamp, and a loading rate of 1.2 mm/min was set.
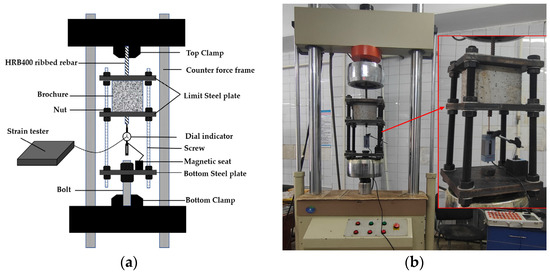
Figure 3.
Apparatus for center pull-out tests. (a) Equipment schematic. (b) Experimental site layout.
3. Results and Discussion
3.1. Test Phenomenon and Process Analysis
Based on the bonding mechanism and the type of damage, the damage forms of the center pull-out tests could be classified into two categories:
- Rebar pull-off damage. When the thickness of the relative protective layer was large and the bond strength of the bonding section was higher than the yield strength of the rebar, the bonding rebar was easy to pull off. During this time, the specimen slipped hard, and its loading curve was similar to that of the pull-out damage curve. After going through a rising section, a developmental section, and a partial strengthening section, it suddenly broke in the mid-to-late stages of the strengthening section with a loud sound of rebar being pulled off. The break-point was generally in the weak zone or the middle of the rebar. As shown in Figure 4a, the necking of the rebar occurred at the arrow marking and was about to be pulled off.
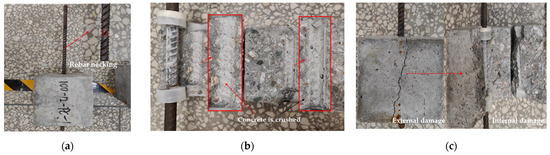 Figure 4. Typical specimens with different damage forms. (a) Rebar pull-off damage. (b) Pull-out damage. (c) Splitting damage.
 - Bond anchorage damage
- (i)
- Pull-out damage. There were no visible cracks on the surfaces of the specimens when the rebar was pulled off. Microcracks were formed only within a certain area around the loading end of the rebar. The concrete crumbled, but the cracks did not extend to the surface of the concrete. The rebar slipped under the stabilizing forces in a later stage, while the bonding surface of the ribbed rebar and the RBFC was severely worn. The concrete in front of the rib was essentially crushed, and the mechanical bite was lost, as shown in Figure 4b.
- (ii)
- Splitting damage. The specimen was split from the area around the rebar. This form of damage extended from the surface of the rebar in a radial direction from the loading end to the free end and progressed from the inside to the outside of the specimen. A splitting cracking sound was heard when the specimen was damaged, and the cracks were visible. The abrasion of the ribbed rebar on the bonding surface was not severe, and the rebar was still partially covered by the concrete. This damage form is a splitting damage of peripherally restrained concrete. According to Reference [36], the maximum circumferential stress induced by the radial tension (q) is greater than the tensile strength (ft) of the concrete, and the bond stress (τ) is less than the bond strength (τu) between the rebar and the concrete. The damage patterns are shown in Figure 4c.
3.2. Test Results and Bond Stress Calculation
During the loading process, the bond stress at the bonding interface of rebar and concrete was not uniformly distributed. Considering the small length of the bonding section, the average bond stress was generally selected as the index in the statistical analysis of the influencing factors, and the bond strength was calculated according to Equation (1):
where is the average bond stress, is the maximum pull-out load value measured by the test force acquisition system, d is the rebar diameter, and l signifies the bonding length of the rebar.
The damage forms, ultimate loads, and average bond strength statistics of the pull-out tests are shown in Table 7. The changes in specimen condition during the center pull-out tests were typically similar. In the pre-test section, the displacement of the rebar was approximately linear with the load, and the relative slip was small. Subsequently, the load rate increased slowly, and the slip increased until the maximum bond strength was reached. The experiment ended when a damage form occurred. Typical specimens with different damage forms are shown in Figure 4.
Table 7.
Statistics of the data from the center pull-out test.
3.3. Single-Factor Analysis of Bond Strength
Based on the results of the center pull-out tests, the bonding lengths, rebar diameters, and concrete types were found to be the most important factors affecting bond strength. Single-factor analyses of the three main variables were carried out to quantify the incidence of each variable. Typical specimens with rebar pull-out damage and their mean bond strength values were analyzed.
3.3.1. Effect of Bonding Length on Bond Strength
In this test, the bonding lengths were controlled by different lengths of PVC tubes. The effect of the bonding length on bond strength in different concrete types was investigated with the center pull-out tests. The damage forms of the specimens were not the same when rebar pull-off damage occurred, so the ultimate load at that point was not the true ultimate bond load. It only represented the ultimate load at the time of pulling off the rebar, whereas the actual ultimate load would be greater than the measured value. Therefore, when selecting specimens for comparison, specimens where rebar pull-off damage occurred were avoided.
As shown in Figure 5, the effects of bonding lengths on the bond strength of rebar with different concrete types were all relatively obvious, which was also reflected in the specimens with different rebar diameters. For the three groups of specimens with different concrete types and rebar diameters, the bond strengths decreased nearly linearly with decreasing bonding lengths, as shown in Figure 6. When the bonding lengths of the specimens were in a wide range of 60–100 mm, the ultimate bond strength () decreased by an average of 13.91–16.72% for every 20 mm increase in bonding length. Therefore, in this range, increasing the bonding length had a negative effect on the bond strength between rebar and concrete.
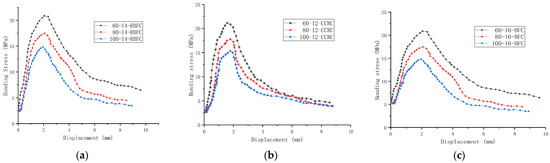
Figure 5.
Bond stress–slip curves of each group. (a) 14-RBFC. (b) 12-CCRC. (c) 16-BFC.
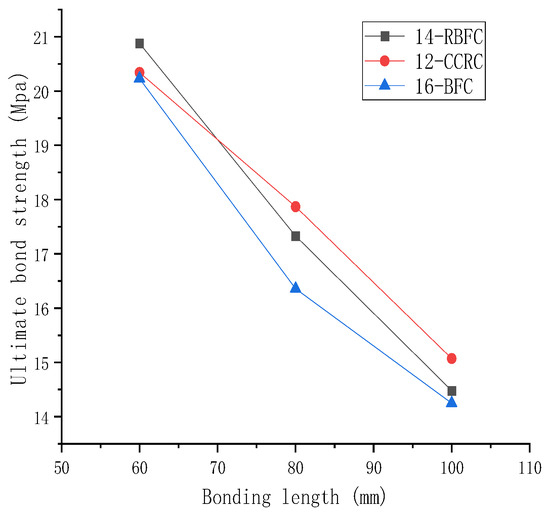
Figure 6.
Relationship between ultimate bond strength and bonding length.
The reason for this may be that the bond stresses were not uniformly distributed in the direction of the rebar. The bond stresses were zero at the loading and free ends. From the loading end to the free end, the bond stress rose rapidly from zero to a peak at 20% of the bonding length, after which the bond stress gradually decreased. The bond strength varied unevenly along the direction of the rebar because of the concrete in front of the ribbed rebar. Therefore, this indicates that as the bonding length increased, the bond force increased and the bond strength decreased.
3.3.2. Effect of Rebar Diameter on Bond Strength
From Figure 7, it is clear that under the same conditions of concrete types and bonding lengths, the ultimate bond strength () decreased with an increase in the rebar diameter. The rates of decrease were the same for the different bonding lengths (60 mm, 80 mm, and 100 mm). When the diameter was 12–16 mm, the ultimate bond strength () decreased by 3.96–5.94% for every 2 mm increase in the rebar diameter. The rebar diameter had little effect on the overall bond strength.
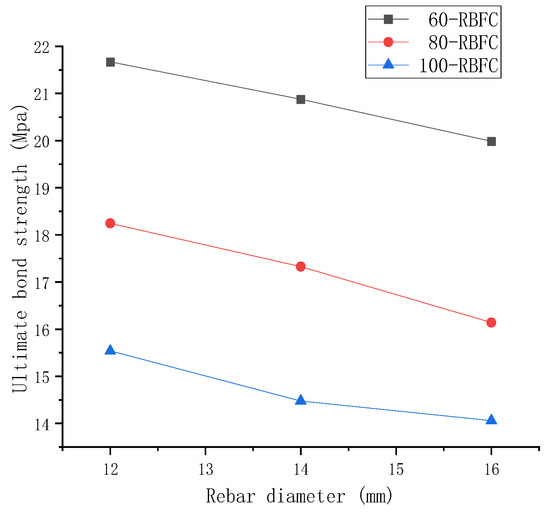
Figure 7.
Relationship between ultimate bond strength and rebar diameter.
The reason for this may be that the bond strength between the ribbed rebar and the concrete is mainly provided by the mechanical occlusion of the concrete in front of the rib of the rebar. According to the Chinese Standard GB 1499.2-2018 [37], the relative rib areas of φ12, φ14, and φ16 mm HRB400 ribbed rebars are 0.055, 0.055, and 0.060, respectively. This shows that the relative rib area does not change significantly as the rebar diameter increases. As the projected area of the transverse rib increases, the area of concrete in front of the rib increases. However, the concrete in front of the rib includes a transverse rib projected area and a partially expanded area of the rib edge. Therefore, the growth of the concrete area in front of the rib is less than that of the shaded area with the transverse rib. As a result, the rate of the increase in the bond force () is lower than that of the diameter (d). In other words, there is an increase in the bonding diameter as the bond stress (τ) subsequently decreases.
3.3.3. Effect of Concrete Type on Bond Strength
As shown in Figure 8, the slurry type had less influence on the concrete bond stress. For CCRC, the ultimate bond strength was reduced by approximately 4% compared to OC under the same conditions. It can be seen that the dosing of rubber granules harmed the bond strength, but a small dosage had little effect on the strength reduction. For BFC, the ultimate bond strength was improved by approximately 3% compared to OC under the same conditions. This shows that the incorporation of basalt fibers had a positive effect on the bond strength. For RBFC, the ultimate bond strength was improved by approximately 2% compared to OC under the same conditions. This shows that the optimal test method for mechanical properties had a positive effect on its bond strength. However, due to the negative effect of the rubber granules, the overall bonding properties were not significantly improved.
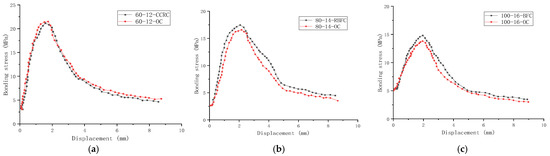
Figure 8.
Bond stress–slip curves of each group: (a) 60-12-CCRC and OC, (b) 80-14-RBFC and OC, and (c) 100-16-BFC and OC.
The microstructure of the interface between rubber granules, basalt fibers, and concrete can be studied to explain the experimental phenomena of variations in their effect on the bond strength of concrete. Figure 9 shows a detailed view of an RBFC specimen with pull-out damage. It can be seen that the concrete in front of the rib is crushed and adheres to the rib in front of the rebar. Typical areas of the concrete where the pull-out damage occurred were sampled, and the specimens were microscopically analyzed using a tungsten filament scanning electron microscope (SEM), as shown in Figure 10.
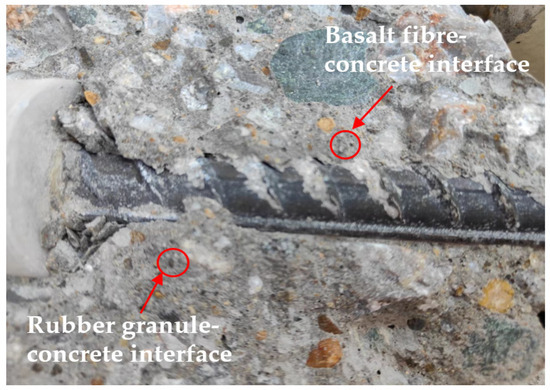
Figure 9.
Detailed view of an RBFC specimen with pull-out damage.
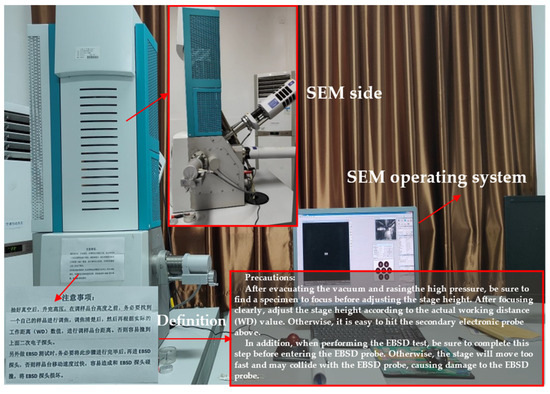
Figure 10.
Tungsten filament scanning electron microscope (SEM).
The microscopic characteristics of the interface between rubber granules, basalt fibers, and concrete are shown in Figure 11. From Figure 11a, it can be seen that the interface cracks between the rubber granules and the cement stones are more pronounced, and there are obvious flaws. This is because a rubber granule is a water-repellent waterproof material that has different properties than a cement stone. When the hydration reaction of cement occurs to produce cement stone, the rubber granules do not form a strong bond with the cement stone, so the bond strength is reduced. It is also due to its hydrophobicity, which significantly reduces the surface tension of water [38]. Its hydrophobicity allows the concrete to introduce uniform, stable, and fine air bubbles around the rubber granules during the mixing process. These closed-cell air bubbles reduce the bond strength, and the number of capillaries allows them to improve the frost resistance, toughness, and impact resistance of the concrete. From Figure 11b, it can be seen that the fibers are uniformly distributed within the cement paste and had a good hydration reaction with the cement stone, resulting in the fibers being firmly embedded within the cement stone. When the concrete is subjected to external forces that cause microcracking, the presence of fibers can effectively inhibit the development of microcracking. In addition, the fibers can alleviate the tendency to develop into larger cracks under pressure and act as anchors during the development of microcracks. To some extent, this increases the compressive strength and enhances the bond strength.
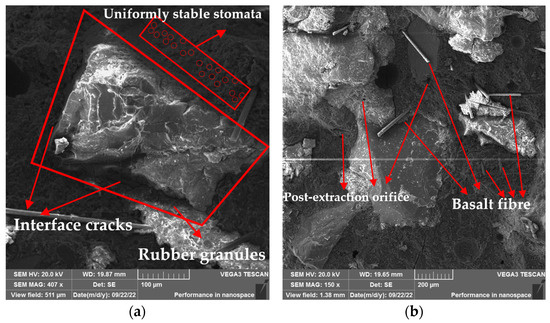
Figure 11.
Microscopic characteristics of the interface between rubber granules, basalt fibers, and concrete. (a) The rubber granule–concrete interface. (b) The basalt fiber–concrete interface.
3.3.4. Sensitivity Analysis of Degree of Influence
Pearson’s correlation coefficients, as shown in Figure 12, were obtained to explore the sensitivity analysis of different factors influencing bond strength. The closer the absolute values of Pearson’s correlation coefficient were to 1, the stronger the linear correlations between the influencing factors and the bond strength. Based on the values of Pearson’s correlation coefficient, the correlations were classified into five classes, as shown in Table 8.
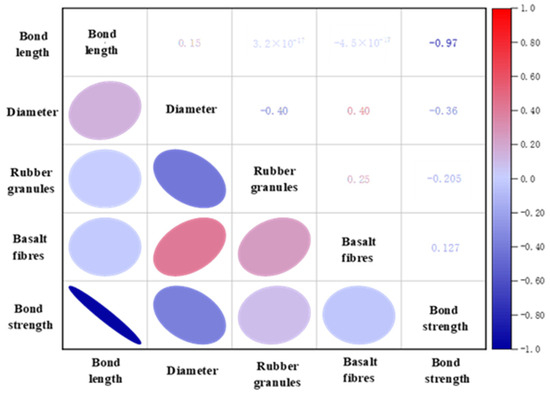
Figure 12.
Pearson’s correlation coefficients between influencing factors.
Table 8.
Classification criteria of relevance.
Pearson’s correlation coefficients of bonding length, rebar diameter, and whether the appropriate amounts of rubber granules and basalt fibers were used are shown in Figure 12 as bonding length (−0.97, extremely strong), rebar diameter (−0.36, weak), mixed with 10% rubber granules (−0.205, weak), and mixed with 4.56 kg/m3 basalt fiber (0.127, extremely weak). Therefore, the order of the sensitivity of these four factors to the bond strength, from the smallest to the largest, is bonding length (−0.97), rebar diameter (−0.36), mixed with 10% rubber granules (−0.205), and mixed with 4.56 kg/m3 basalt fibers (0.127). The results also indicate that the first three factors are negatively correlated with bond strength. This conclusion is consistent with the results in Section 3.3.1, Section 3.3.2 and Section 3.3.3.
3.4. The Constitutive Model of Bond-Slip between RBFC and Rebar
Nowadays, there are many types of bond–slip constitutive models between rebar and concrete, which can be mathematically classified into segmented function and polynomial models. Since the polynomial models rely on large amounts of experimental data that can only be fitted by unique expressions, the training process requires a lot of computational power. In addition, the trends of the center pull-out tests of each stage are obvious where there are linear and non-linear sections. Therefore, the semi-empirical and semi-theoretical segmented function model can be used.
Based on the discussion of the causes of the three damage forms in Section 3.1, the main damage form is pull-out damage. Therefore, this paper mainly focuses on fitting the constitutive model for the pull-out damage form of RBFC with rebar. Due to the lack of a complete bond-slip curve for rebar pull-off damage and the insufficient number of specimens for splitting damage, the parameters have a high degree of dispersion; therefore, these two damage forms are not fit.
Based on the modification of the model proposed by MO [1], as shown in Figure 13, points A–D are the inflection points for each segment.
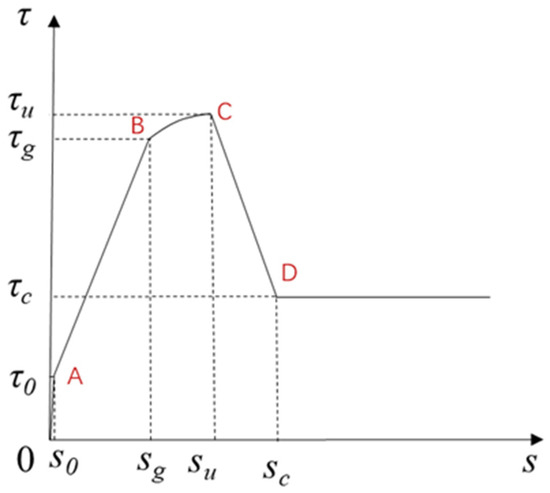
Figure 13.
Bond stress–displacement relationship diagram.
τ is the bond stress (MPa); s represents the slip at the free end (mm); a signifies the test parameter; τu is the bond stress (MPa); τ0 is the initial bond stress (MPa); τg is the bond stress at the inflection point (MPa); τc is the residual stress (MPa); s0 is the slip corresponding to the initial bond stress (mm); sg represents the slip corresponding to the bond stress at the inflection point (mm); su represents the slip corresponding to the bond stress (mm); and sc represents the slip corresponding to the turning point between the descending section and the residual section (mm).
From Figure 13, it can be seen that the proposed bond stress–displacement model has four important characteristic points, which divide the whole model into five stages. The first stage is the micro-slip section (OA section), in which the chemical bond between the rebar and the concrete, as well as some of the friction forces, provide the bond stress. The main feature of this stage is the rapid increase in the bond stress (τ) with the increase in the displacement (s). The displacement (s0) is small at this time, and its value is between 0.05 and 0.2 mm. Its graph is an almost vertical line from the origin. The second stage is the rising section (AB section). In this stage, the concrete in front of the rib starts to be gradually extruded. The friction and mechanical occlusion forces mainly provide the bond stress at this time. Its main characteristic is that as the load increases, the free-end slip value increases significantly and approaches a straight line, which is close to the elastic state. The third stage is the slipping section (BC section), in which the concrete in front of the rib is gradually crushed in an elastic–plastic state as the load increases. The main characteristic is that the stress increases with the displacement of the free end and the growth rate slows down until it does not increase. The fourth stage is the descending section (CD section), in which the concrete in front of the rib is rapidly crushed, and is mainly characterized by a rapid decrease in the bond stresses to a stabilized value. The fifth stage is the residual section (after D), in which only part of the friction and residual mechanical occlusion forces remain, and the main characteristic is that the load values are basically stabilized at a steady value.
Due to the small value of s0 (between 0.05 and 0.2 mm), the artificially defined inflection point A has a large error. The empirical formulas fitted to s0 are lower due to the greater dispersion of the data. Therefore, the model is simplified by defining the 0.05 mm displacement (τ) as the initial bond stress (τ0) in the micro-slip section, and no displacement occurs during the micro-slip stage (s0 = 0). Therefore, the model is established by focusing on the micro-slip section.
The simplified model is shown in Figure 14. Points A–D are the inflection points for each segment.
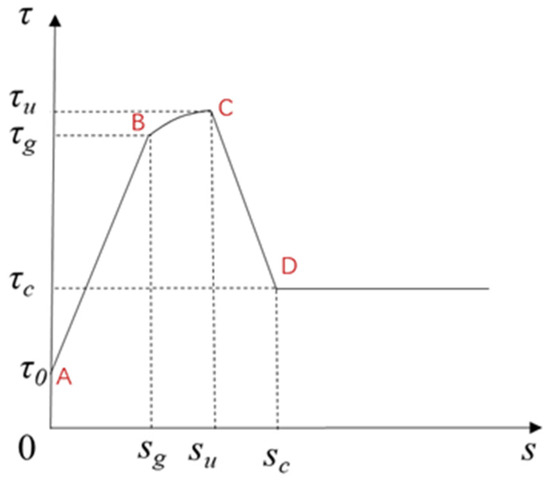
Figure 14.
Simplified bond stress–displacement relationship diagram.
The equations of the modified model are shown in Equations (2)–(6):
- micro-slip section (s = 0):
- rising section (0 < s ≤ sg):
- slipping section (sg < s ≤ su):
- descending section (su < s ≤ sc):
- residual section (s > sc):
To avoid the problem of large scatter in the data set, the mean of their associated eigenvalues was taken. The statistics related to the RBFC were organized to obtain the empirical parameter statistics in Table 9. The value a was negatively correlated with bonding length and rebar diameter. This indicates that for specimens with larger bonding lengths and rebar diameters, the slipping section lasted longer and the concrete in front of the rib experienced a longer crushing section.
Table 9.
Statistics related to RBFC.
Individual factors such as bonding length and rebar diameter had a greater effect on bond strength. Therefore, the bonding length (l) and the rebar diameter (d) were selected for this 2D surface fitting. Substituting the fitting results into the fitting formula, as shown in Equation (7), provided an empirical formula for each parameter:
The test values of all rebar and RBFC specimens were verified using the constitutive model, and the results are shown in Figure 15.
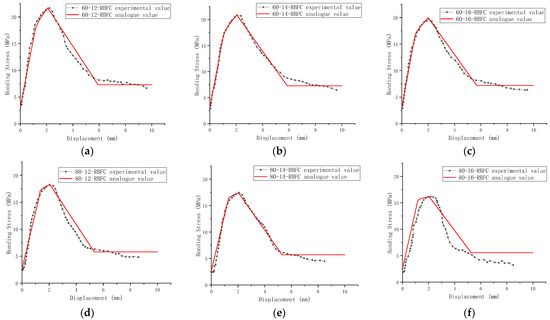
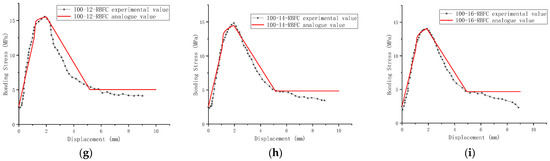
Figure 15.
Comparisons of experimental and analog values of bond stress–slip curves: (a) 60-12-RBFC, (b) 60-14-RBFC, (c) 60-16-RBFC, (d) 80-12-RBFC, (e) 80-14-RBFC, (f) 80-16-RBFC, (g) 100-12-RBFC, (h) 100-14-RBFC, and (i) 100-16-RBFC.
As shown in Figure 15, the bond stress–slip curves of the simulated and test values fit well. In particular, there was a high degree of overlap for the rising and slipping sections of the stress–slip curves. It is shown that the bond stress–slip curve obtained by fitting the test data can characterize the bonding properties between the deformed rebar and the RBFC.
4. Conclusions
In this paper, based on the results of center pull-out tests, the different damage forms and the causes of the damage in the center pull-out tests were summarized. The effects of rebar diameter, bonding length, and concrete type on the average bond strength of reinforced concrete were analyzed, and the extent of their influence was evaluated. The mechanisms of influence of three factors on bond strength were investigated. A constitutive model of bond-slip between RBFC and rebar was developed based on a semi-empirical and semi-theoretical model. The main conclusions are as follows:
- (1)
- The damage forms of the two tests were summarized based on the bonding mechanism between the rebar and the RBFC. For the center pull-out test, the damage forms were rebar pull-off damage and bond anchorage damage. The bond anchorage damage included pull-out damage and splitting damage.
- (2)
- Based on the test results, the bond stress–slip curve was summarized, and a mathematical model was constructed. It was divided into a micro-slip section, a rising section, a slipping section, a descending section, and a residual section.
- (3)
- The incorporation of rubber granules reduced the compressive strength and the bond strength of the concrete, which had a negative effect. However, the addition of small amounts of rubber granules did not significantly reduce the bonding properties. The incorporation of moderate amounts of basalt fibers had a positive effect on the bond strength.
- (4)
- In the center pull-out tests, the bond stresses in specimens with the same rebar diameter for RBFC decreased by 13.91–16.72% for every 20 mm increase in bonding length in the range from 60 to 100 mm. The ultimate bond strength () decreased by 3.96–5.94% for every 2 mm increase in rebar diameter for the same bonding length in the 12 to 16 mm diameter range.
- (5)
- The segmented bond–slip constitutive relationship between RBFC and rebar based on the center pull-out test program was developed using a semi-empirical and semi-theoretical model as the theoretical basis.
Author Contributions
Conceptualization, L.T.; formal analysis, Y.G., L.T. and T.J.; investigation, Y.G. and T.J.; data curation, Q.Z., T.J. and L.S.; writing—original draft preparation, Y.G., L.S. and T.J.; writing—review and editing, Y.G., S.L., L.S. and W.J.; project administration, L.T., W.J., S.L. and Q.Z.; funding acquisition, Y.G., W.J., Q.Z., L.T. and S.L. All authors have read and agreed to the published version of the manuscript.
Funding
This work was supported by the Technological Developing Scheme Program of Jilin Province (Award Number: 20230402048 GH), the Transportation Technology Program of Jilin Province of China (Award Numbers: 2021-1-1 and 2022-1-8), the Key Project of Department of Transportation of Heilongjiang Province of China (Award Numbers: 2022–1 and 2022–2), the Science and Technology Research and Planning Project of Jilin Education Department (Award Number: JJKH20211113KJ), and the Graduate Innovation Fund of Jilin University (Award Number: 2023CX053).
Institutional Review Board Statement
Not applicable.
Informed Consent Statement
Not applicable.
Data Availability Statement
The data presented in this study are available upon request from the corresponding author. The data are not publicly available due to privacy.
Acknowledgments
We would like to acknowledge the following people from Jilin University. Thank you to Xinpeng Hu, Fayang Li, Shuzheng Wu, Hongyu Yang, and Baixin Liu for technical support related to the testing procedure and data processing.
Conflicts of Interest
Authors Liang Sun, Wei Jiang, Qianjin Zhang and Shi Liu were employed by the company China Railway Tunnel Group Road & Bridge Engineering Co., Ltd. The remaining authors declare that the research was conducted in the absence of any commercial or financial relationships that could be construed as a potential conflict of interest.
References
- Mo, K.H.; Visintin, P. Bond stress-slip relationship of oil palm shell lightweight concrete. Eng. Struct. 2016, 127, 319–330. [Google Scholar] [CrossRef]
- Haskett, M.; Oehlers, D.J.; Ali, M.M. Local and global bond characteristics of steel reinforcing bars. Eng. Struct. 2008, 30, 376–383. [Google Scholar] [CrossRef]
- Lv, X. Research on Durability and Mechanical Properties of Basalt Fiber Reactive Powder Concrete in Seasonal Frozen Area. Ph.D. Thesis, Jilin University, Changchun, China, 2021. [Google Scholar]
- Li, Z.X.; Chen, Y.Z.; Guo, T.T. Pavement performance and mechanism of action formodified rubber roller compacted concrete. China J. Highw. Transp. 2023, 36, 38–48. [Google Scholar]
- Goto, Y. Experimental studies on cracks formed in concrete around deformed tension bars. Doboku Gakkai Rombun Hōkokushū 1980, 1980, 85–100. [Google Scholar] [CrossRef]
- Krstulovic, O.N.; Watson, K.A.; Lafave, J.M. Effect of increased tensile strength and toughness on reinforcing-bar bond behavior. Cem. Concr. Compos. 1994, 16, 129–141. [Google Scholar] [CrossRef][Green Version]
- Han, Y.; Bai, Y.Q.; Ba, S.T. Research progress and application of rubber aggregate modified concrete. Concrete 2013, 10, 87–90.1. [Google Scholar]
- Xu, Y.W. State-of-the-arts of Research on Rubberized Concrete and Its Development Prospect for Pavements. Chem. Manag. 2019, 32, 104–105. [Google Scholar]
- Wu, Z.X. Research on Basic Mechanical Properties and Application of Basalt Fibre Reinforced Concrete. Master’s Thesis, Wuhan University of Technology, Wuhan, China, 2009. [Google Scholar]
- He, X.L. Mechanical Research on Basalt Fiber Reinforced Unsaturated Polyester Composite. Master’s Thesis, Jilin University, Changchun, China, 2021. [Google Scholar]
- Liu, Z. Experimental Study on Frost Resistance of Modified Rubber Concrete. Water Conserv. Sci. Technol. Econ. 2022, 28, 140–143. [Google Scholar]
- Dou, Y.M. Modification of Rubber Particle and Its Application in Frost-Resistant Concrete. Master’s Thesis, Jilin University, Changchun, China, 2021. [Google Scholar]
- Mohammed, B.S. Properties of crumb rubber hollow concrete block. J. Clean. Prod. 2012, 23, 57–67. [Google Scholar] [CrossRef]
- Benazzouk, A.; Douzane, O.; Mezreb, K. Physico-mechanical properties of aerated cement composites containing shredded rubber waste. Cem. Concr. Compos. 2006, 28, 650–657. [Google Scholar] [CrossRef]
- Wu, Y.T. Experimental Study on Bonding Properties of Two Grades of Rubber Concrete and Steel Bars. Master’s Thesis, North China University of Water Resources and Electric Power, Zhengzhou, China, 2018. [Google Scholar]
- Wen, P. Experimental Research on Bond Strengh Properties between Rubberized Concrete and Steel Bars. Master’s Thesis, Zhengzhou University, Zhengzhou, China, 2017. [Google Scholar]
- Gesoglu, M.; Güneyisi, E.; Hansu, O.; İpek, S.; Asaad, D.S. Influence of waste rubber utilization on the fracture and steel–concrete bond strength properties of concrete. Constr. Build. Mater. 2015, 101, 1113–1121. [Google Scholar] [CrossRef]
- Li, Y.; Wang, Q.; Xu, S.; Song, Q. Study of eco-friendly fabricated hydrophobic concrete containing basalt fiber with good durability. J. Build. Eng. 2023, 65, 105759. [Google Scholar] [CrossRef]
- Choi, J.; Lee, B.Y. Bonding properties of basalt fiber and strength reduction according to fiber orientation. Materials 2015, 8, 6719–6727. [Google Scholar] [PubMed]
- Li, Y.; Li, Y. Experimental study on performance of rubber particle and steel fiber composite toughening concrete. Constr. Build. Mater. 2017, 146, 267–275. [Google Scholar] [CrossRef]
- Dna, B.; Li, S.B.; Yang, L.B. Experimental study on mechanical properties and durability of basalt fiber reinforced coral aggregate concrete. Constr. Build. Mater. 2020, 237, 117628. [Google Scholar]
- Al-Masoodi, A.; Kawan, A.; Kasmuri, M. Static and dynamic properties of concrete with different types and shapes of fibrous reinforcement. Constr. Build. Mater. 2016, 104, 247–262. [Google Scholar]
- Ma, Y. Experimental Research and Analysis on Bond- anchorage Properties between Basalt Fiber Reinforced Concrete and Reinforcement. Master’s Thesis, Northeast Forestry University, Harbin, China, 2015. [Google Scholar]
- Bi, Q.W.; Wang, Q.X.; Wang, H. Study on Bond Properties of BFRP Bars to Basalt Fiber Reinforced Concrete. Adv. Struct. 2011, 163–167, 1251. [Google Scholar]
- Wu, D.; Li, Z.; Li, J.; Peng, B. Study on Mechanical Properties of the Basalt Fiber-Rubber Granular Concrete under Triaxial Stress Condition and Its Application. Appl. Sci. 2020, 10, 8540. [Google Scholar] [CrossRef]
- Gong, Y.F.; Song, J.X.; Zhang, Y.W.; Jiang, T. Sustainable Utilization of Foundry Waste: Cracking Property Analysis of Basalt Fiber-Reinforced Rubber Concrete. J. Mater. Civ. Eng. 2023, 35, 04023181. [Google Scholar] [CrossRef]
- Eligehausen, R.; Popov, E.P.; Bertero, V.V. Local Bond Stress-Slip Relationships of Deformed Bars under Generalized Excitations; University of California: Davis, CA, USA, 1982. [Google Scholar]
- Cosenza, E.; Manfredi, G.; Realfonzo, R. Analytical modelling of bond between FRP reinforcing bars and concrete. In Non-Metallic Reinforcement for Concrete Structures; CRC Press: Boca Raton, FL, USA, 1995; pp. 164–171. [Google Scholar]
- Tighiouart, B.; Benmokrane, B.; Gao, D. Investigation of bond in concrete member with fibre reinforced polymer (FRP) bars. Constr. Build. Mater. 1998, 12, 453–462. [Google Scholar] [CrossRef]
- Gao, D.Y. The constitutive models for bond slip relation between frp rebars and concrete. Ind. Constr. 2003, 33, 41–43. [Google Scholar]
- JGJ 55-2011; Specification for Mix Proportion Design of Ordinary Concrete. Ministry of Housing and Urban-Rural Development of the People’s Republic of China: Beijing, China, 2011.
- CECS 38-2004; Technical Specification for Fibre Reinforced Concrete Structures. China Association for Engineering Construction Standardization: Beijing, China, 2004; pp. 45–48+44.
- Gong, Y.; Song, J.; Lin, S.; Yang, J.; He, Y.; Tan, G. Design optimization of rubber-basalt fiber-modified concrete mix ratios based on a response surface method. Appl. Sci. 2020, 10, 6753. [Google Scholar] [CrossRef]
- GB/T 50152-2012; Standard for Test Method of Concrete Structures. Ministry of Housing and Urban-Rural Development of the People’s Republic of China: Beijing, China, 2012.
- GB/T 50080-2016; Standard for Test Method of Performance on Ordinary Fresh Concrete. Ministry of Housing and Urban-Rural Development of the People’s Republic of China: Beijing, China, 2016.
- Huang, Y.C. Experimental Study on Bond and Anchorage Behavior of New High Strength Reinforcement Bar and Concrete. Master’s Thesis, Chang’an University, Xi’an, China, 2020. [Google Scholar]
- GB/T 1499.2-2018; Steel for the Reinforcement of Concrete—Part 2: Hot Rolled Ribbed Bars. China Iron & Steel Association: Beijing, China, 2018.
- Gong, S. Frost resistance and impact properties of roller compacted concrete mixed with rubber particles and steel fibers. Acta Mater. Compos. Sin. 2018, 35, 2199–2207. [Google Scholar]
Disclaimer/Publisher’s Note: The statements, opinions and data contained in all publications are solely those of the individual author(s) and contributor(s) and not of MDPI and/or the editor(s). MDPI and/or the editor(s) disclaim responsibility for any injury to people or property resulting from any ideas, methods, instructions or products referred to in the content. |
© 2023 by the authors. Licensee MDPI, Basel, Switzerland. This article is an open access article distributed under the terms and conditions of the Creative Commons Attribution (CC BY) license (https://creativecommons.org/licenses/by/4.0/).