1. Introduction
Traditional Internet of Things (IoT) devices are designed to support a predefined set of capabilities by leveraging highly optimized hardware and software components specifically designed for particular functions, such as video processing or processing data from sensors. These devices remain popular due to their high performance and energy efficiency.
On the other hand, modern IoT devices often come equipped with high-speed processors and ample memory, enabling most computations to be performed without dedicated hardware accelerators. This flexibility allows decisions regarding device usage to be made during production use.
To handle complex tasks, IoT devices are organized into networks, such as a home-automation system consisting of multiple interconnected devices designed to perform consistent operations. The research described in this paper aims to propose the self-optimization of IoT device networks, focusing on maintenance of the predefined capabilities. The ideas presented in this document are based on the research conducted by the first author, a member of “The Microservices Architecture Project” at The Open Group, a group focused on IoT and the microservices architecture (MSA). In the further discussion, we assume that the selected IoT devices are running software components complaint with the principles of the MSA.
The concept of MSA assumes the construction of the system as a set of local operations (microservices) that cooperate with each other to create the fully functional application. One of the key aspects of such a distributed system is determining its intended functionality and verifying its fulfillment, especially when such systems are usually expanding dynamically. In
Section 2.3, we propose an introduction to the concepts of local and global capabilities (i.e., the features that a managed distributed system must meet). Even if we implemented the concept of capabilities as sets of predicates built into the software source code, defined as logical conditions, the solution would prolong the system implementation process. Adding additional conditions and actions related to the reconfiguration of a distributed system in the application’s code will further complicate the system and may make its architecture complex. Manual system configuration and verification of its correctness by a programmer also does not seem to be an effective solution.
Fortunately, the network of IoT devices can be visualized as a graph, adhering to specific grammar and enabling features associated with graphs. In this paper, we demonstrate that microservice capabilities can be formalized through predicates associated with the subgraph structure (refer to
Section 3). Therefore, instead of manually implementing capability verification and self-configuration actions, we can employ a system of graph transformation mechanisms for the entire system. This significantly enhances code readiness and reduces the effort required by programmers, particularly during the system maintenance phase.
Graph transformations facilitates both the specification of current problems (as a graph of IoT devices) and, more importantly, the optimized approach to modifying such a network in response to various events, such as degraded performance of the connected devices. It is noteworthy that certain types of graph transformations, such as complementary graphs [
1], can be practically implemented in distributed environments, providing formal mechanisms to transform between different states of graphs representing sets of complementary capabilities. The other applicable methods are the parallel graph transformations [
2,
3], similarity and conformity graphs [
4] or a framework for computational design synthesis based on the graph grammars [
5] and hyper-graph models [
6]. The main benefit of the introduced approach is that it costs less in terms of the programming effort regarding the maintenance of the system. We also show that it is not only a theoretical proposition but was practically validated, as described in
Section 5.
The work described in this document has been implemented as an IoT network created for the management and monitoring of an indoor greenhouse. The solution involves a substantial number of actuators and sensors, and the main objective of the project was to ensure the reliability and productivity of the solution, as measured by its overall outcome. To gather the outcome data, we prompted the operator of the farm to provide feedback through a mobile application. By collecting a significant amount of data over time, we were able to build analytical models that were applied to the graph representation of the solution. For more information about the implementation, please refer to
Section 5.
We wish to underscore the fact that the system crafted to facilitate auto-configuration of the IoT network is not a predefined monolithic entity. Rather, it comprises a network of easily configurable devices within a dynamic architecture. This rationale is precisely why we opted to implement the logic of IoT devices through microservices, following the standards supported by The Open Group.
Another noticeable aspect relates to defining capabilities as a collection of desired properties essential to the system. The synopsis details instances where these predefined sets of capabilities [
7] were impacted due to both internal (e.g., failures) and external (e.g., configuration changes) factors. Importantly, the system autonomously managed to restore these specified capabilities in both scenarios without needing manual intervention from support personnel. In this context, the measure of effectiveness is not solely gauged by the overall system performance. Rather, it is rooted in assessing the cost implications associated with introducing changes aimed at reinstating the set of capabilities. The increased crop efficiency, as depicted in the example in
Section 5, should be understood as a side effect rather than a fundamental criterion for measuring the effectiveness of the presented solution.
2. Materials and Methods
First, let us introduce the term “Internet of Things” (IoT). The descriptions of “things” constitute one of the fundamental concepts of the Internet of Things. These descriptions should be formal and machine-readable, following the W3C standard. Software objects representing physical entities can be generated based on these descriptions. Device descriptions are created in the form of metadata. A recommended approach to metadata is to tag data with an ontology [
8] that describes the relationships between components in a machine-interpretable manner.
The following are examples:
What type of thing is it (e.g., a temperature sensor)?
What are the domain constraints (e.g., temperature sensors must specify their physical units, which should be from the set of Kelvin, Celsius, Fahrenheit)? Other ontologies could describe the sensor’s location and what it is measuring.
2.1. The IoT Standards
The Open Group has published two IoT standards and a semantic interoperability standard that is suitable for use in conjunction with the Internet of Things, although it has broader applicability. According to The Open Group, semantic interoperability is needed to enable integration of independently developed solutions (or components), providing the framework for interoperability of the loosely coupled IoT devices and forming IoT networks, the main subject of our research [
9].
The published standards are as follows:
The Open Messaging Interface (O-MI), an Open Group Internet of Things (IoT) standard [
10];
The Open Data Format (O-DF), an Open Group Internet of Things (IoT) standard [
11];
The Open Data Element Framework (O-DEF) [
12].
The first author has made contributions to The Open Group’s work concerning the concept of microservices (or micro applications) running on IoT devices. A summary of this work is presented in the subsequent section.
2.2. IoT and Microservices
The microservices architecture (MSA) is an architectural style that revolves around the creation of systems using small, independent and self-contained services that closely align with business activities.
Microservices serve as the primary building blocks of an MSA and possess the following three key characteristics:
Service independence: Each microservice is developed, deployed and modified independently of other microservices.
Single responsibility: Each microservice is dedicated to an atomic (single) business activity for which it assumes responsibility.
Self-containment: A microservice is a self-contained and deployable unit that encompasses all the necessary external IT resources (e.g., data sources and business rules) to support its unique business activity.
In The Open Group’s guide titled “Microservices Architecture for the Internet of Things” [
13], the synergies between microservices as software components and IoT devices are explained. The Open Group explores how these two evolving solutions intersect, highlighting where MSA can be an optimal fit and enabler for IoT solutions. When combined with the IoT, MSA blurs the boundaries between IoT devices and sensors, facilitating a seamless flow between the physical world and IT. This integration aligns with The Open Group’s vision of Boundaryless Information Flow™ [
14].
In The Open Group’s white paper titled “Benefits of DevOps Methodology for Microservices Solutions” [
15], the authors described the business- and technology-related advantages achieved by combining microservices and DevOps. By integrating existing architectures and methodologies, innovation can be realized. In this case, combining the use of MSA and DevOps allows the results of optimization to be transformed into a set of practical actions that can be deployed to IoT devices.
All the aforementioned benefits are applicable to the combination of a microservices architecture and the IoT. The application of the DevOps methodology, particularly the automation of configuration and software changes in IoT deployments, establishes the necessary foundation to facilitate changes resulting from the self-adaptation of the IoT network.
2.3. Local and Global Capabilities of the IoT Devices
Definition of Capability
Definition: Within The Open Group, a capability is defined as “the ability to perform a certain action or task” [
7]. A business capability refers to a specific ability or capacity that a business possesses or utilizes to achieve a particular purpose or desired outcome.
Building upon the aforementioned definition, we can extend its application to a broader range of solutions. For the purpose of this article, the term “capability” is used to describe the ability of an IoT device to perform certain actions or carry out required operations.
The term “capability” can be applied not only to individual IoT devices but also to the network of IoT devices. While software components primarily rely on algorithms to define their capabilities, IoT devices integrate specific algorithms with physical components that are collectively designed to fulfill particular functions.
In both cases, the capabilities are closely intertwined with the functional requirements of the IT system.
Local Capability
Local or elementary capability pertains to a single unit of the given operation. For example, in the case of a thermometer, its ability to measure temperature constitutes a local capability specific to the thermometer. Local capabilities are inherently tied to a specific location, whether it be software components or a physical device.
Global Capability
In contrast to local capabilities, which are inherently tied to a specific location, global capabilities, also known as complex capabilities, are associated with the network of IoT devices. Expanding on the example of temperature measurement, the global capability of an IoT network to measure temperature is not linked to a particular thermometer but rather encompasses all temperature sensors within that network.
In the subsequent sections, the capabilities of IoT devices and IoT networks will be represented in the form of graphs, and any modifications or enhancements to the devices or networks will be depicted as graph transformations.
3. Graph Representation of the IoT Network
An IoT network can be depicted as a graph, where the nodes represent the devices and the edges represent the relationships between the devices. The foundation of graph transformations and their applications are resumed in [
16,
17,
18]. To specify the IoT behavior, we use graph transformations as they have been successfully applied a few times to specification of the behavior of large parallel systems [
19,
20] or IoT networks [
21].
To accurately represent the network, a predefined set of metadata needs to be applied to define its characteristics. Metadata encompasses the static properties of the network, which are used to qualify and quantify specific elements within the network.
An example of metadata could be the physical distance between sensors. This distance can impact other properties, such as the network latency between elements. Unlike static properties like physical distance, network latency is a dynamic property that is calculated based not only on the distance but also on the number of network hops between two elements.
Translating this concept into the graph mechanism is not a straightforward process, and thus it is divided into several steps.
Firstly, we introduce the representation of local capabilities, which consists of a node- or edge-attributing function and a set of capability verification rules. These verification rules are evaluated after any modification of the attribute parameters.
More complex capabilities, known as global capabilities, are associated with subgraphs of the IoT network representation. They take the form of predicates linked to specific capabilities and are evaluated after any modification of the predicate parameters. To avoid exponential complexity in implementation, certain limitations need to be imposed on this concept.
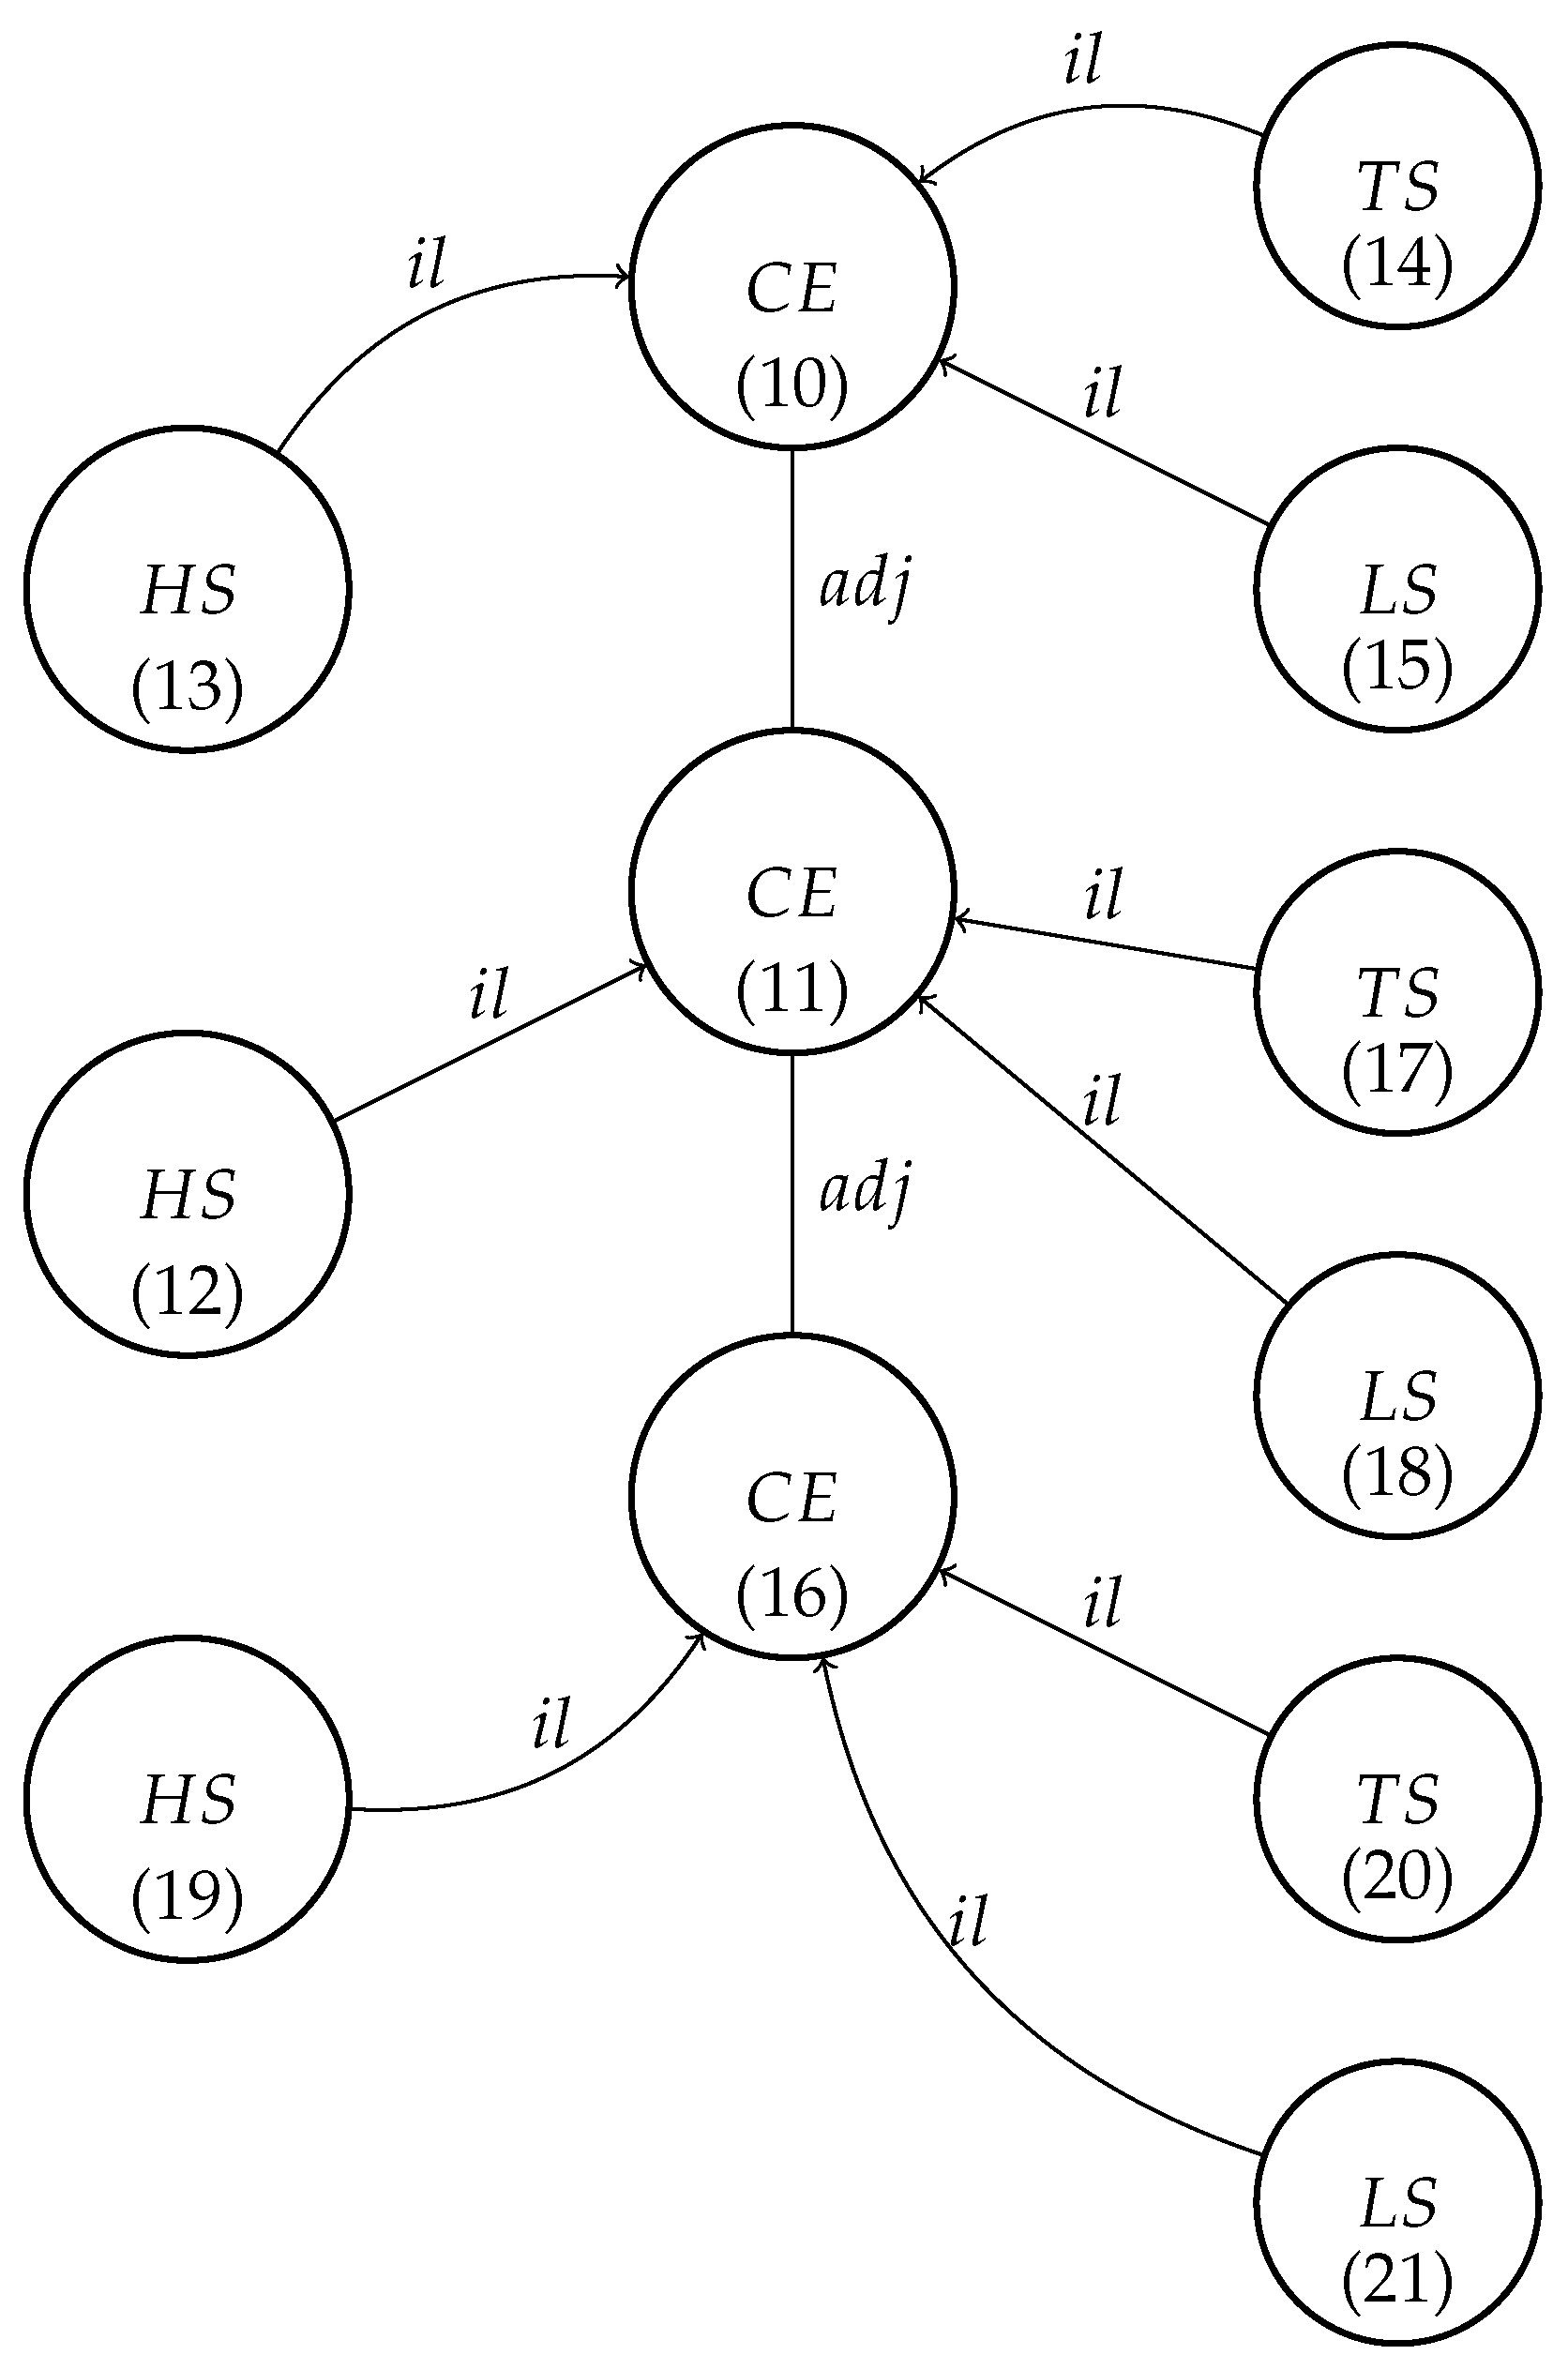
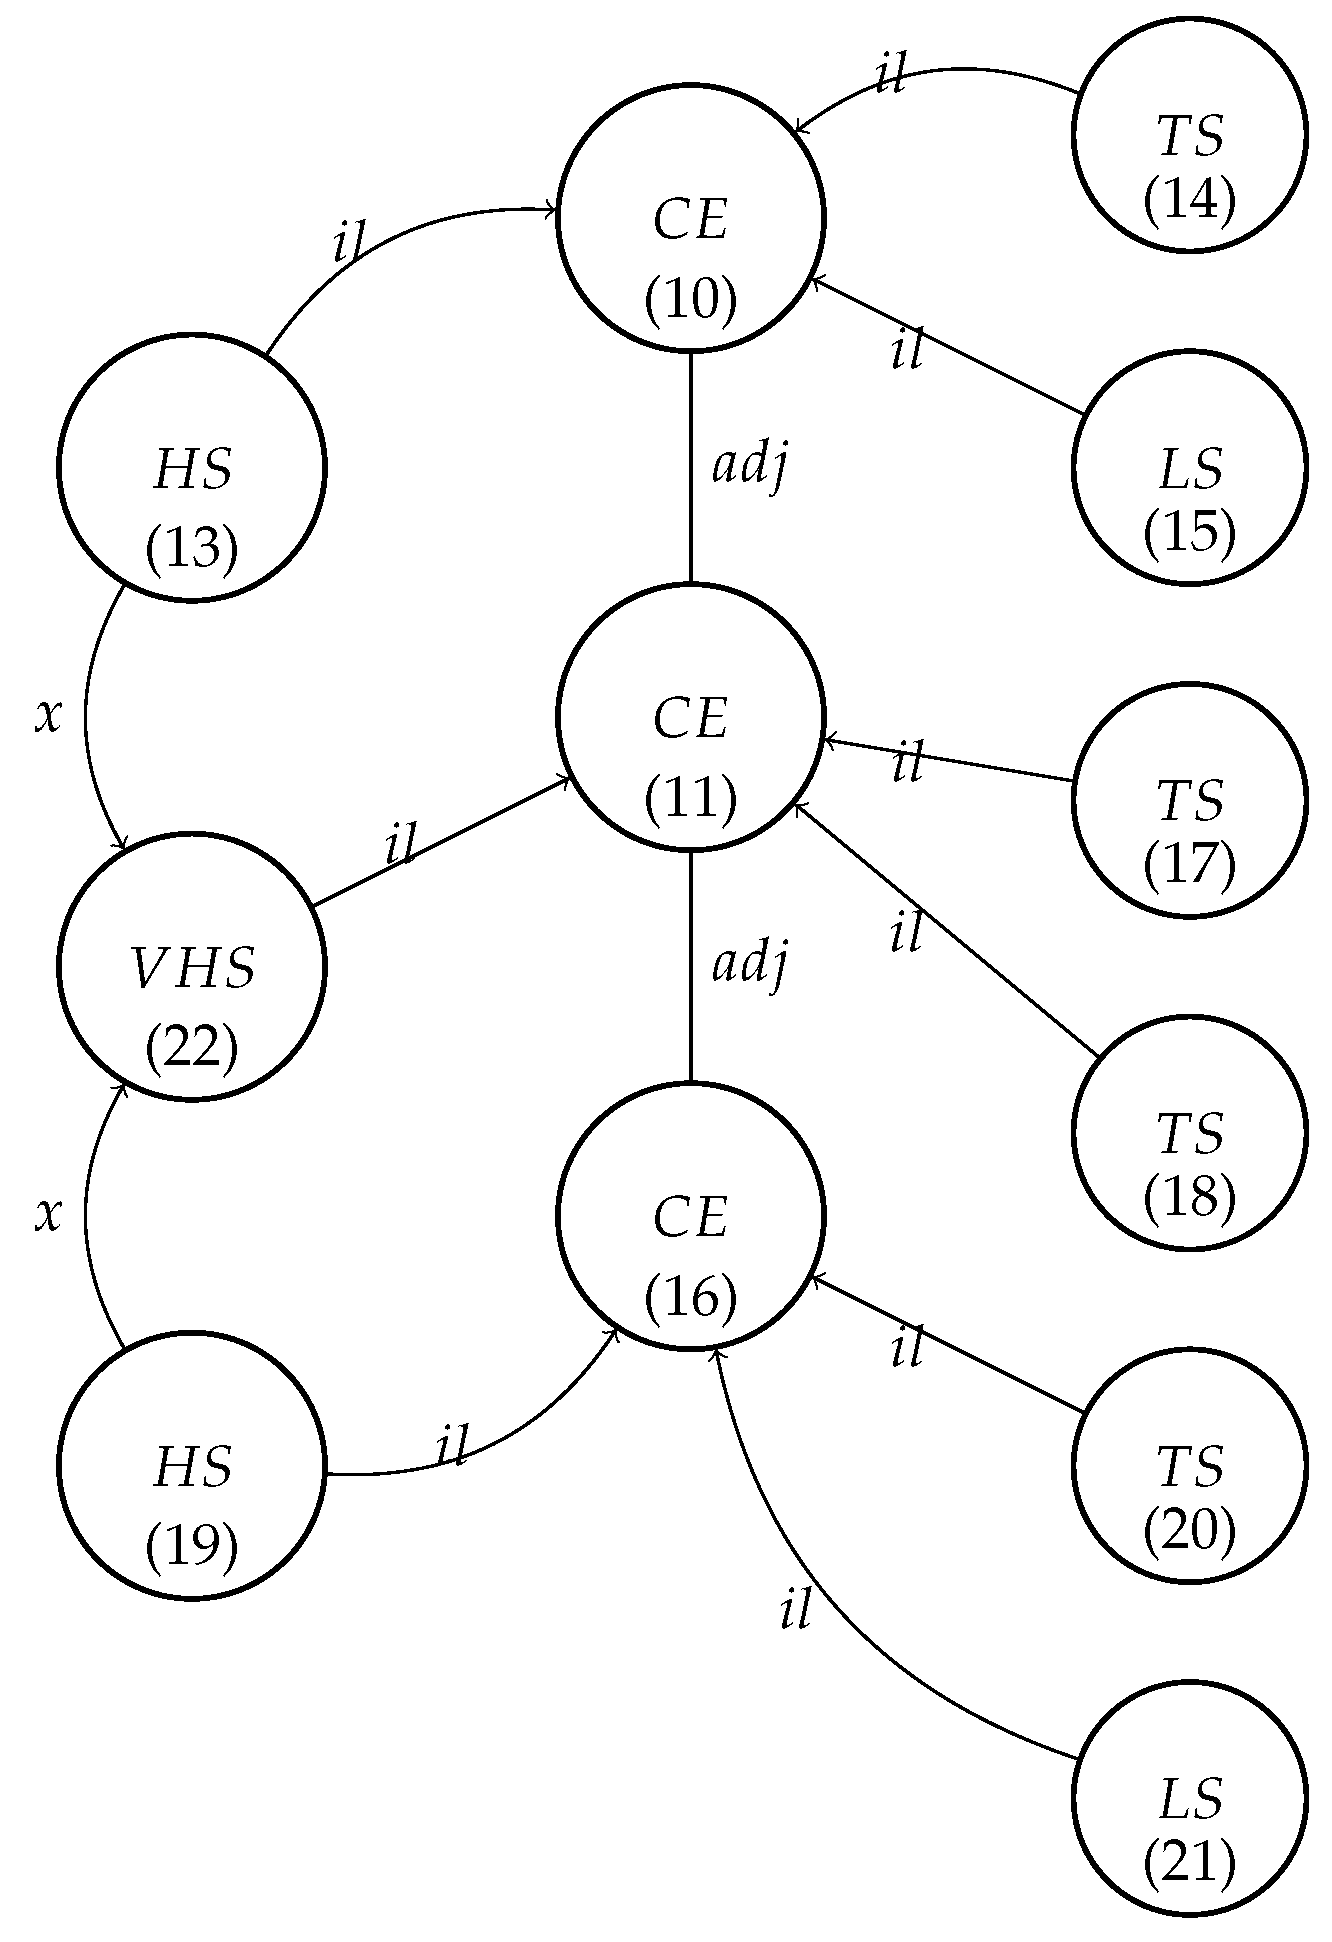
The graph presented in
Figure 1 represents an IoT network where the following definitions apply:
TS represents the temperature sensor;
HS represents the humidity sensor;
LS represents the light sensor;
CE represents the management and communication unit.
The other elements of the IoT are based on the work of the second author, described in [
22]:
MS represents the movement sensors;
LC represents the lighting control elements;
TC represents the temperature control elements;
Other definitions apply.
It is important to note that node attributes encapsulate elementary capabilities, such as verifying that a temperature sensor’s correct output falls within the range from 19 to 23 degrees Celsius. Additionally, certain capabilities may pertain to static attributes, such as numerical values, while others may involve attributes derived from computations.
3.1. Global Capability Notation
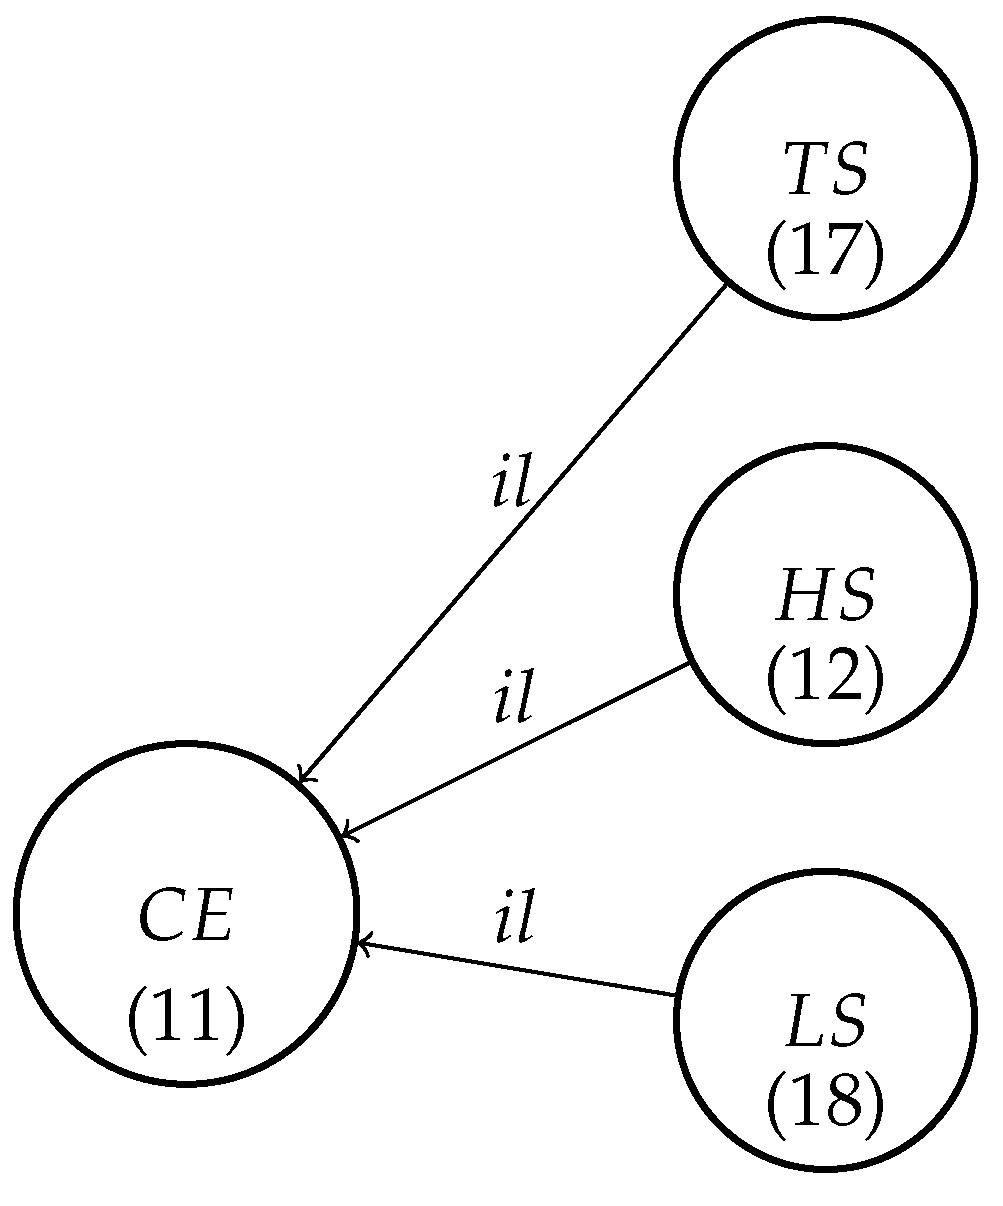
Global capabilities (
Figure 2) are defined as a subset of the main graph, forming a subgraph.
For instance, let us consider the complex capability known as the “Sensor Hub”. The “Sensor Hub” has the ability to not only measure the temperature, humidity, light intensity and spectrum but also store this information locally and transmit it to other components within the IoT network.
In formal terms, the “Sensor Hub” is represented as a subgraph comprising interconnected sensors connected to a management unit.
As we delve deeper into the topic, the network’s self-adaptation will be guided by these capabilities.
3.2. Graph Generation Using a Formal Grammar
Formally, the graph representing the IoT we will be defined as follows:
Definition 1. A graph grammar Ω
is a tuple: where the following definitions apply: is the set of node labels;
is the set of terminal node labels (nonterminal nodes are working elements);
is the set of edge labels;
is the set of transformation rules;
is the starting graph;
is the graph grammar validation condition which verifies the current state of the graph.
We use as the validation condition of the graph grammar because sometimes it is necessary to execute a sequence of transformations, and some of the intermediate states may not form a correct graph.
With L, we denote the language defined by the graph grammar (i.e., ), and for any and any , then .
The first validation condition formalizes the informal assumption that the final graph may not have any nonterminal nodes (i.e., and ).
Formally, using the sensors defined earlier, .
The relation between the nodes is represented by the edges, such as in the following examples:
A node TC should be associated with a node labeled CE by an edge labeled as (where the temperature sensor is associated with the calculation element);
A node MS should be associated with a node labeled LC by an edge labeled lc (where lighting control is associated with the movement sensor).
Formally, .
Definition 2. A capability in a graph G is a triple where the following apply:
In the context of maintaining graph isomorphism and computational problems, we attribute elementary capabilities to a specific node, denoted as a, within the graph. Based on the aforementioned definition, an elementary capability is represented as a triple , where “a” signifies the node associated with the capability, {a} represents the ability to perform an action and denotes the parameters required to execute or validate the action. The parameters of the action are linked to the graph’s node, which is defined by an appropriate grammar.
A global capability, on the other hand, encompasses a combination of elementary capabilities, predicates and additional parameters associated with the entire graph. The complete graph represents the global capability.
A predicate is a logical formula that utilizes the graph’s definition as its input parameter. It is defined externally to the graph but forms an integral part of the definition of the graph’s global capabilities.
The inclusion of a root element within the graph is essential to enhance the effectiveness of graph validation.
The correctness of the proper graph generation is ensured by the graph transformation rules defined in a graph grammar.
A single transformation rule that transforms one graph into another one is denoted as (a set of transformation rules).
Each is denoted as a set of two graphs: and .
For a given graph
G, application of the
transformation rule is defined (like in [
23]) as follows:
The left-hand side () graph is marked on G by the morphishm h;
The nodes belonging to the graph are removed from G, and we denote the new graph as ;
The right-hand side () graph is added to , and the nodes m in that belong to are used to glue and (note: the edges containing m were not removed from G).
In the example presented here, when one of the sensors is broken, we replace it with the virtual sensor that interpolates its value based on the neighboring sensors.
By looking at
Figure 3, let us observe that initially, the graphs on the left-hand side (
) and right-hand side (
) appear to differ at edge nodes 1 and 3. It is important to note that the
graph includes a node indexed as one, which is absent in the
graph. On the other hand, the
graph introduces a new node indexed as three, and consequently, there are new edges connecting it to the other nodes in the
graph.
The transformation is performed through the application of two productions: P1 and P2. First, we apply the production P1, presented in
Figure 3, on the part of the IoT graph presented in
Figure 1 (in [] are the node’s IDs in
Figure 3):
We designate the identity morphism h from to part of G. Node 1 is represented by node 12 and, accordingly, nodes . The identity morphism preserves the structure of the mapped graphs (i.e., no nodes or edges are glued, and the mapped nodes and edges have the same labeling).
Node 1 in does not belong to , and thus h(1) is removed from G. Edge (1,2) is removed too.
Node 11, which represents the nodes belonging to , remains in G and is glued with a new part of (i.e., new node 3 and edge (3,2)), which creates a final graph on .
After the creation of a new virtual humidity sensor (VHS) node by the application of production P1, we have to designate the neighboring sensors for VHS node 22 (in [] are the node’s IDs in
Figure 3).
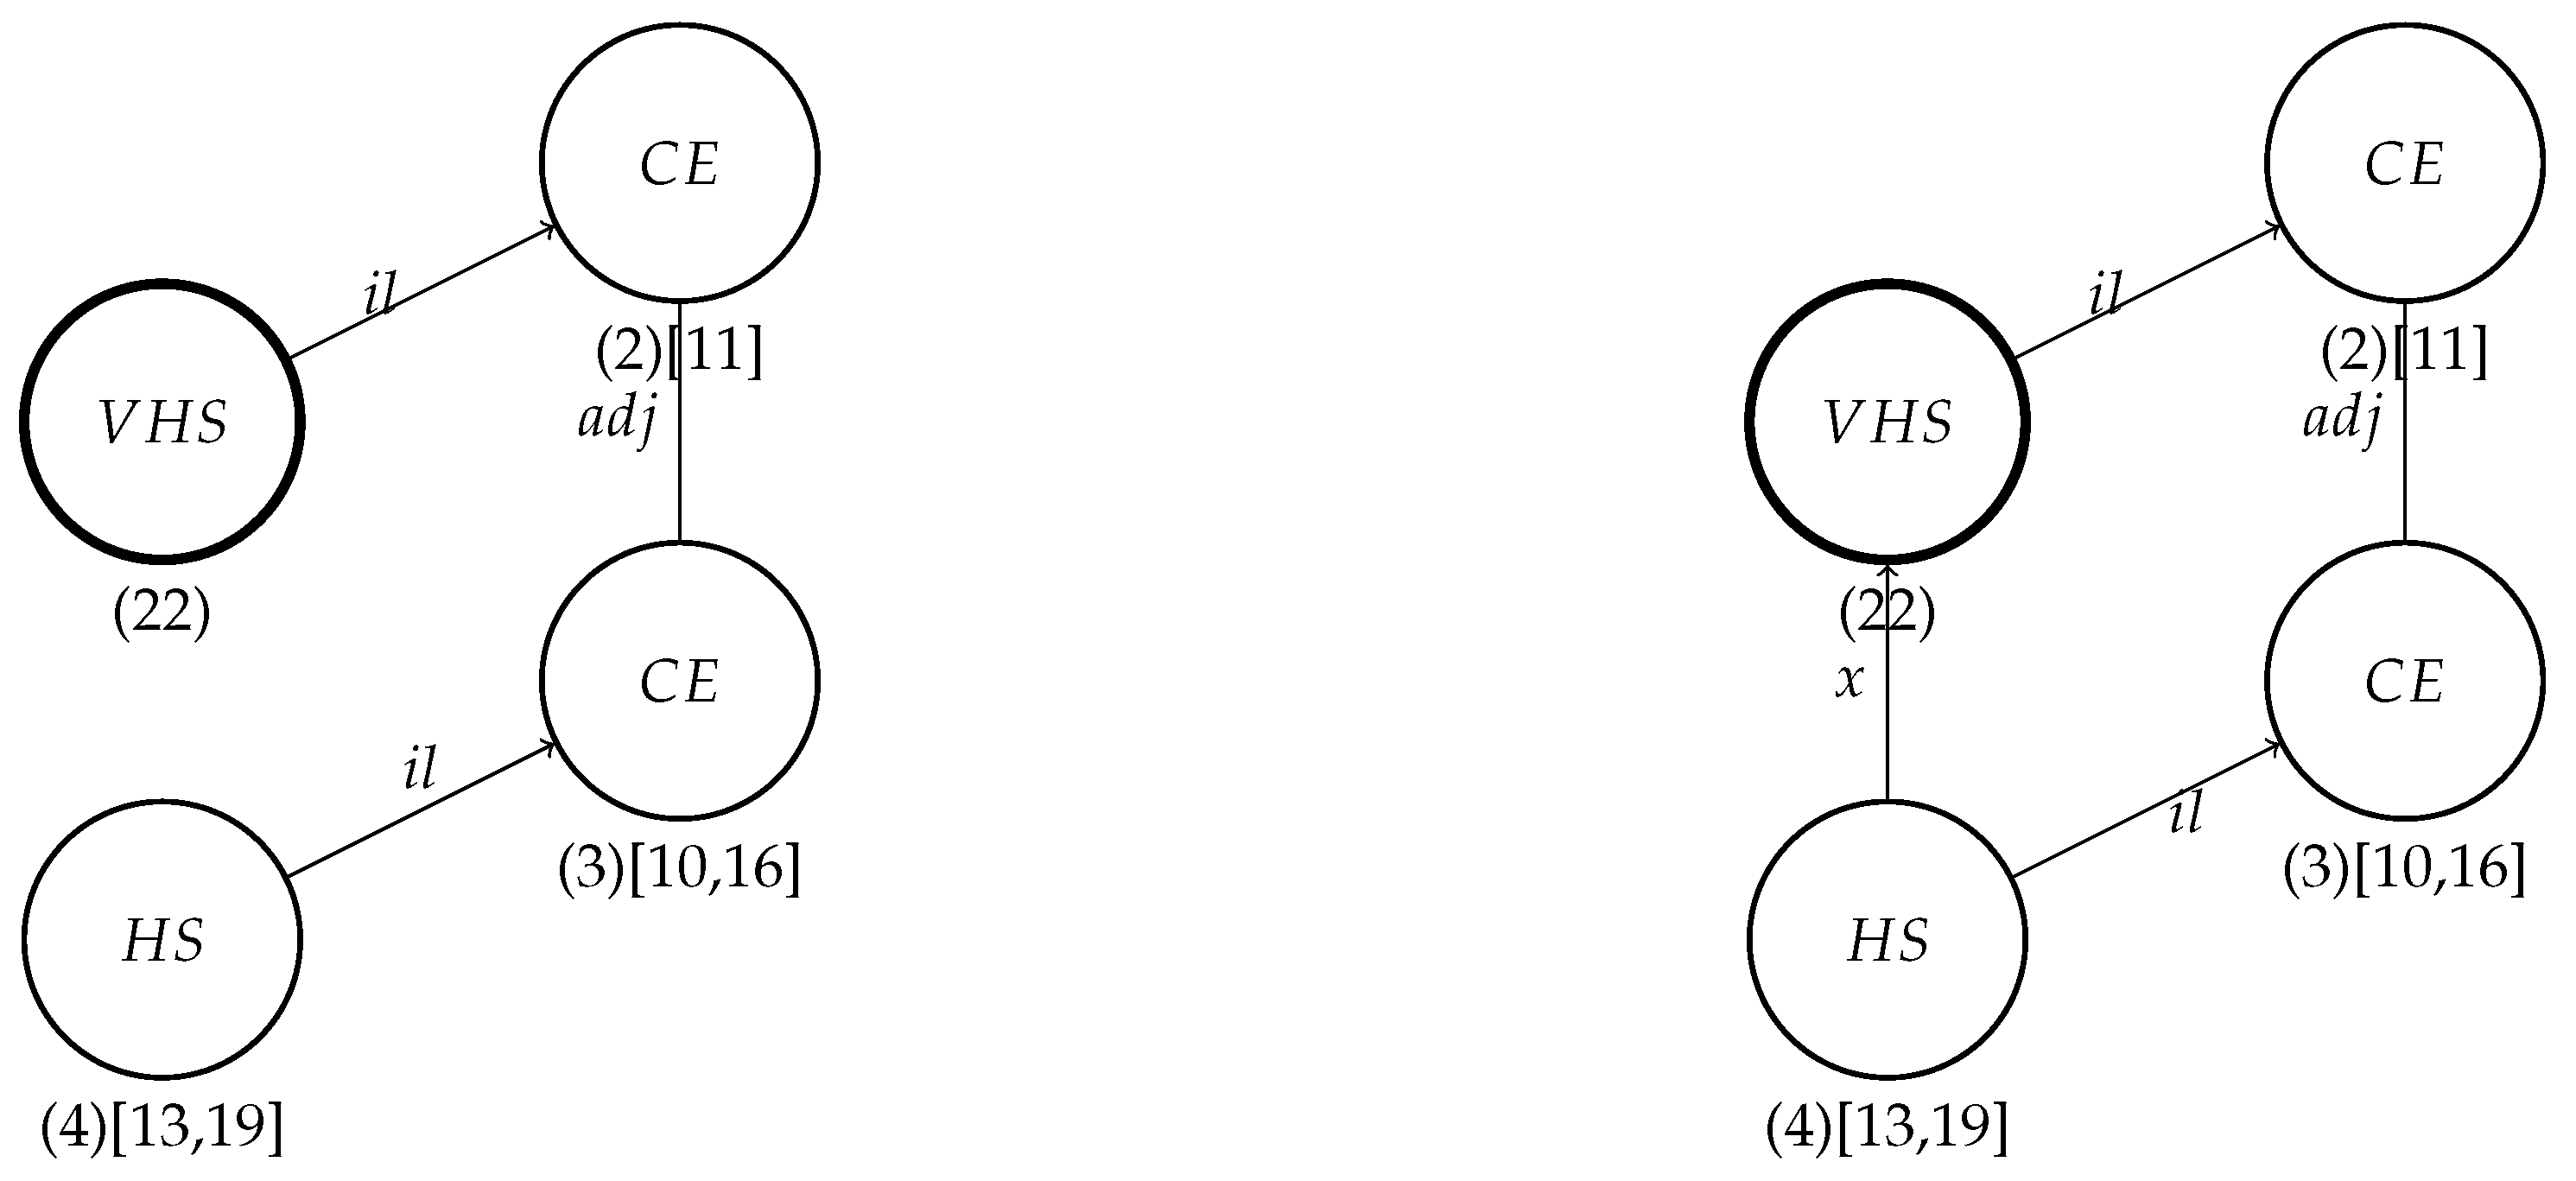
We have here two possible matches for the P2
(
Figure 4) against the graph presented in
Figure 3:
;
.
Production P2 is applied in both cases, creating edges (22,13) and (22,16), which means that the VHS can use the values of the sensors represented by nodes 13 and 16 for interpolation of their values. Finally, the IoT graph after application of this production will appear as shown in
Figure 5.
4. Triggering Mechanism
In practice, only some sequences of a production will be executed, namely those that can be designated by analyzing an independent, separate data set. In our case, we assume that the transformations will be triggered by the changes in the global or local capabilities of the IoT system.
4.1. Events Triggering Actions
A network in a stable state maintains a specific set of capabilities.
There are various factors that can lead to changes in the network. The following paragraphs provide a brief overview of some of these factors.
4.1.1. Planned Changes
Planned changes are associated with evolving requirements, such as the need to incorporate additional features into the network. For instance, consider the example of adding a CO
level detection capability, which would require the inclusion of an additional sensor and specific processing algorithms capable of triggering notifications. In this case, implementing the CO
level detection capability necessitates the integration of multiple features within the network. We would like to mention that triggering notifications based on external changes has been extensively covered in various publications and will not be a focal point of this work [
24].
4.1.2. Configuration Adjustments
Configuration adjustments are an integral part of enhancing the IoT configuration, as seen in the case of the indoor greenhouse discussed in
Section 5. These adjustments involve modifying the system’s configuration. Similar to infrastructural changes, altering the configuration also entails adjusting the defined capabilities of the system. Consequently, this triggers a transformation of the graph that represents the system’s configuration, matching an updated set of capabilities.
4.1.3. Failures
Another source of changes in the IoT network arises from failures, which can include the following:
Node failure: This occurs when a node within the network experiences a malfunction or becomes inoperable;
Service degradation: This refers to a situation where the performance or functionality provided by a node deteriorates below the expected level;
Edge failure: This pertains to failure or disruption of the network’s edge, which can occur due to connectivity issues or problems with communication links.
These failures can have a significant impact on the IoT network, necessitating appropriate actions to address and mitigate the effects of such failures.
4.2. Monitoring of the Events
External triggering occurs when monitoring mechanisms located outside of the network initiate a response. Various types of monitoring mechanisms can be employed, such as monitoring of the specific nodes within the network, monitoring the capabilities or monitoring of the quality of data generated by the network. For instance, the temperature readings from sensors can be monitored against predefined rules, such as minimum and maximum values. If the temperature falls outside of these boundaries, then it will trigger a failure event.
External triggering is also associated with feedback provided by the operator of the IoT network, such as the operator of the greenhouse discussed in
Section 5. Feedback enables continuous refinement of the solution, ensuring closer alignment with business requirements and goals.
Internal triggering, on the other hand, relies on events generated by the network itself. Each node may have the capability to detect and propagate notifications. In this case, notifications are disseminated across the network, potentially leading to the generation of additional events by specific nodes within the network.
In the example described in
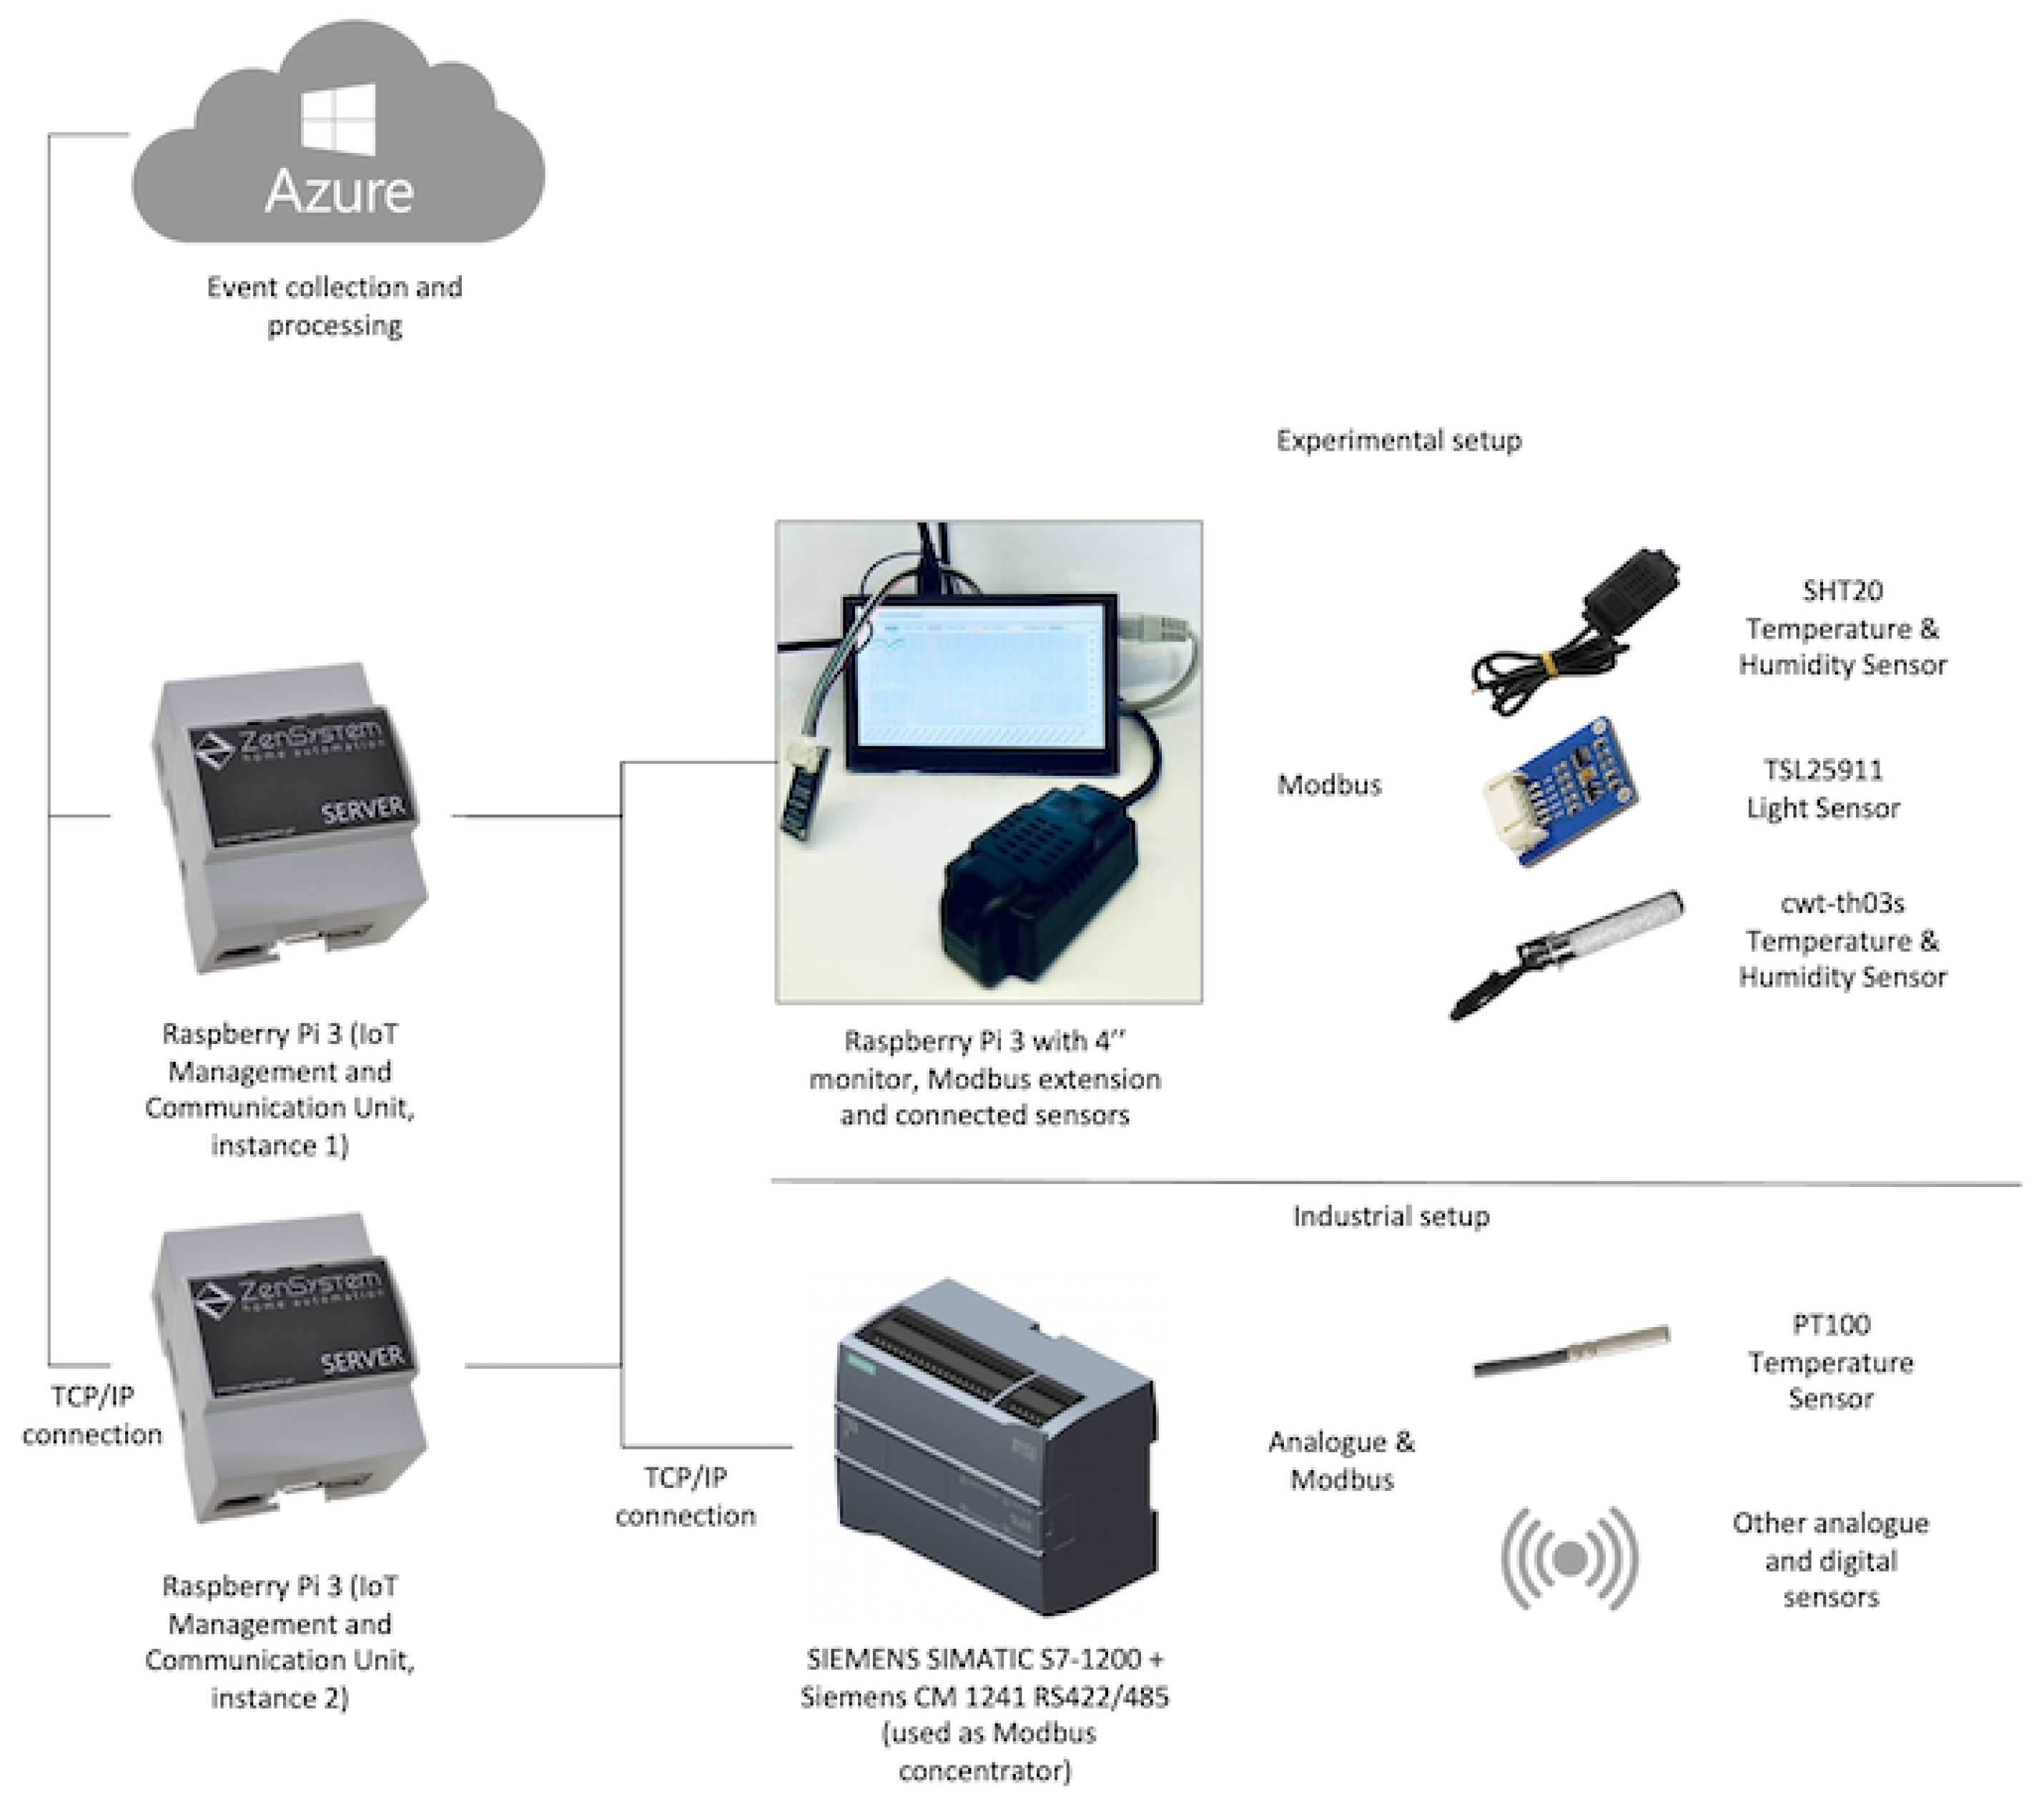
Section 5, event monitoring was implemented using Azure Event Hub and Azure CosmosDB. Multiple agents within the IoT network produce various types of events, which are sent to the Azure cloud, normalized and stored in the document database. A periodic reporting mechanism compares the reported values with the predefined set of capabilities specific to the particular instance of the network, such as the indoor greenhouse. If any discrepancies are detected, then a triggering mechanism executes corrective actions.
4.3. Digital Twin
Each element within the IoT network is represented by its digital twin, which corresponds to a node in the graph that defines the network.
The triggering mechanism not only leads to productions that alter the data structure but also triggers a set of elementary productions, denoted as , which modify the attribute values of the node while maintaining the network structure. In certain cases, a change in attribute value can trigger a production or a sequence of productions associated with the capabilities associated with the node attribute values, depending on whether those capabilities are fulfilled or not.
In summary, the triggering mechanism associates capabilities with two types of productions: those associated with fulfilling predicates and those associated with failing predicates, with one of them often being empty.
For instance, consider the attribute “state” of a sensor, which can be either “active” or “failed”. If the sensor enters a failed state, then it will trigger a series of productions aimed at restoring the missing capability, which in this case is reactivating the sensor. Another example is a change caused by a configuration adjustment, which would initiate a series of productions to adjust the network and meet the required capability, such as maintaining a certain light intensity during a specific period.
It is crucial to note that each execution of a production resulting in a changed network definition may also trigger additional productions aimed at restoring other capabilities.
5. Practical Application of a Self-Adapting IoT Network
The ideas and concepts presented in this article have been implemented in a system designed to manage micro-, small- and medium-sized greenhouses. The system comprises the following elements:
Sensors for air temperature, air humidity, soil pH, soil humidity, light intensity and composition (five bands of wavelengths);
Actuators;
Management units: IoT devices capable of collecting data from the sensors, buffering them in a local database and sending them to the cloud;
Connectors;
Network interfaces;
Cloud-based management system.
The purpose of implementing the system described in this article is to offer support for plant growth in indoor greenhouses. This is achieved through the execution of automated recipes and continuous monitoring of predefined capabilities. If any of these capabilities are compromised, then the system will take necessary actions to restore them.
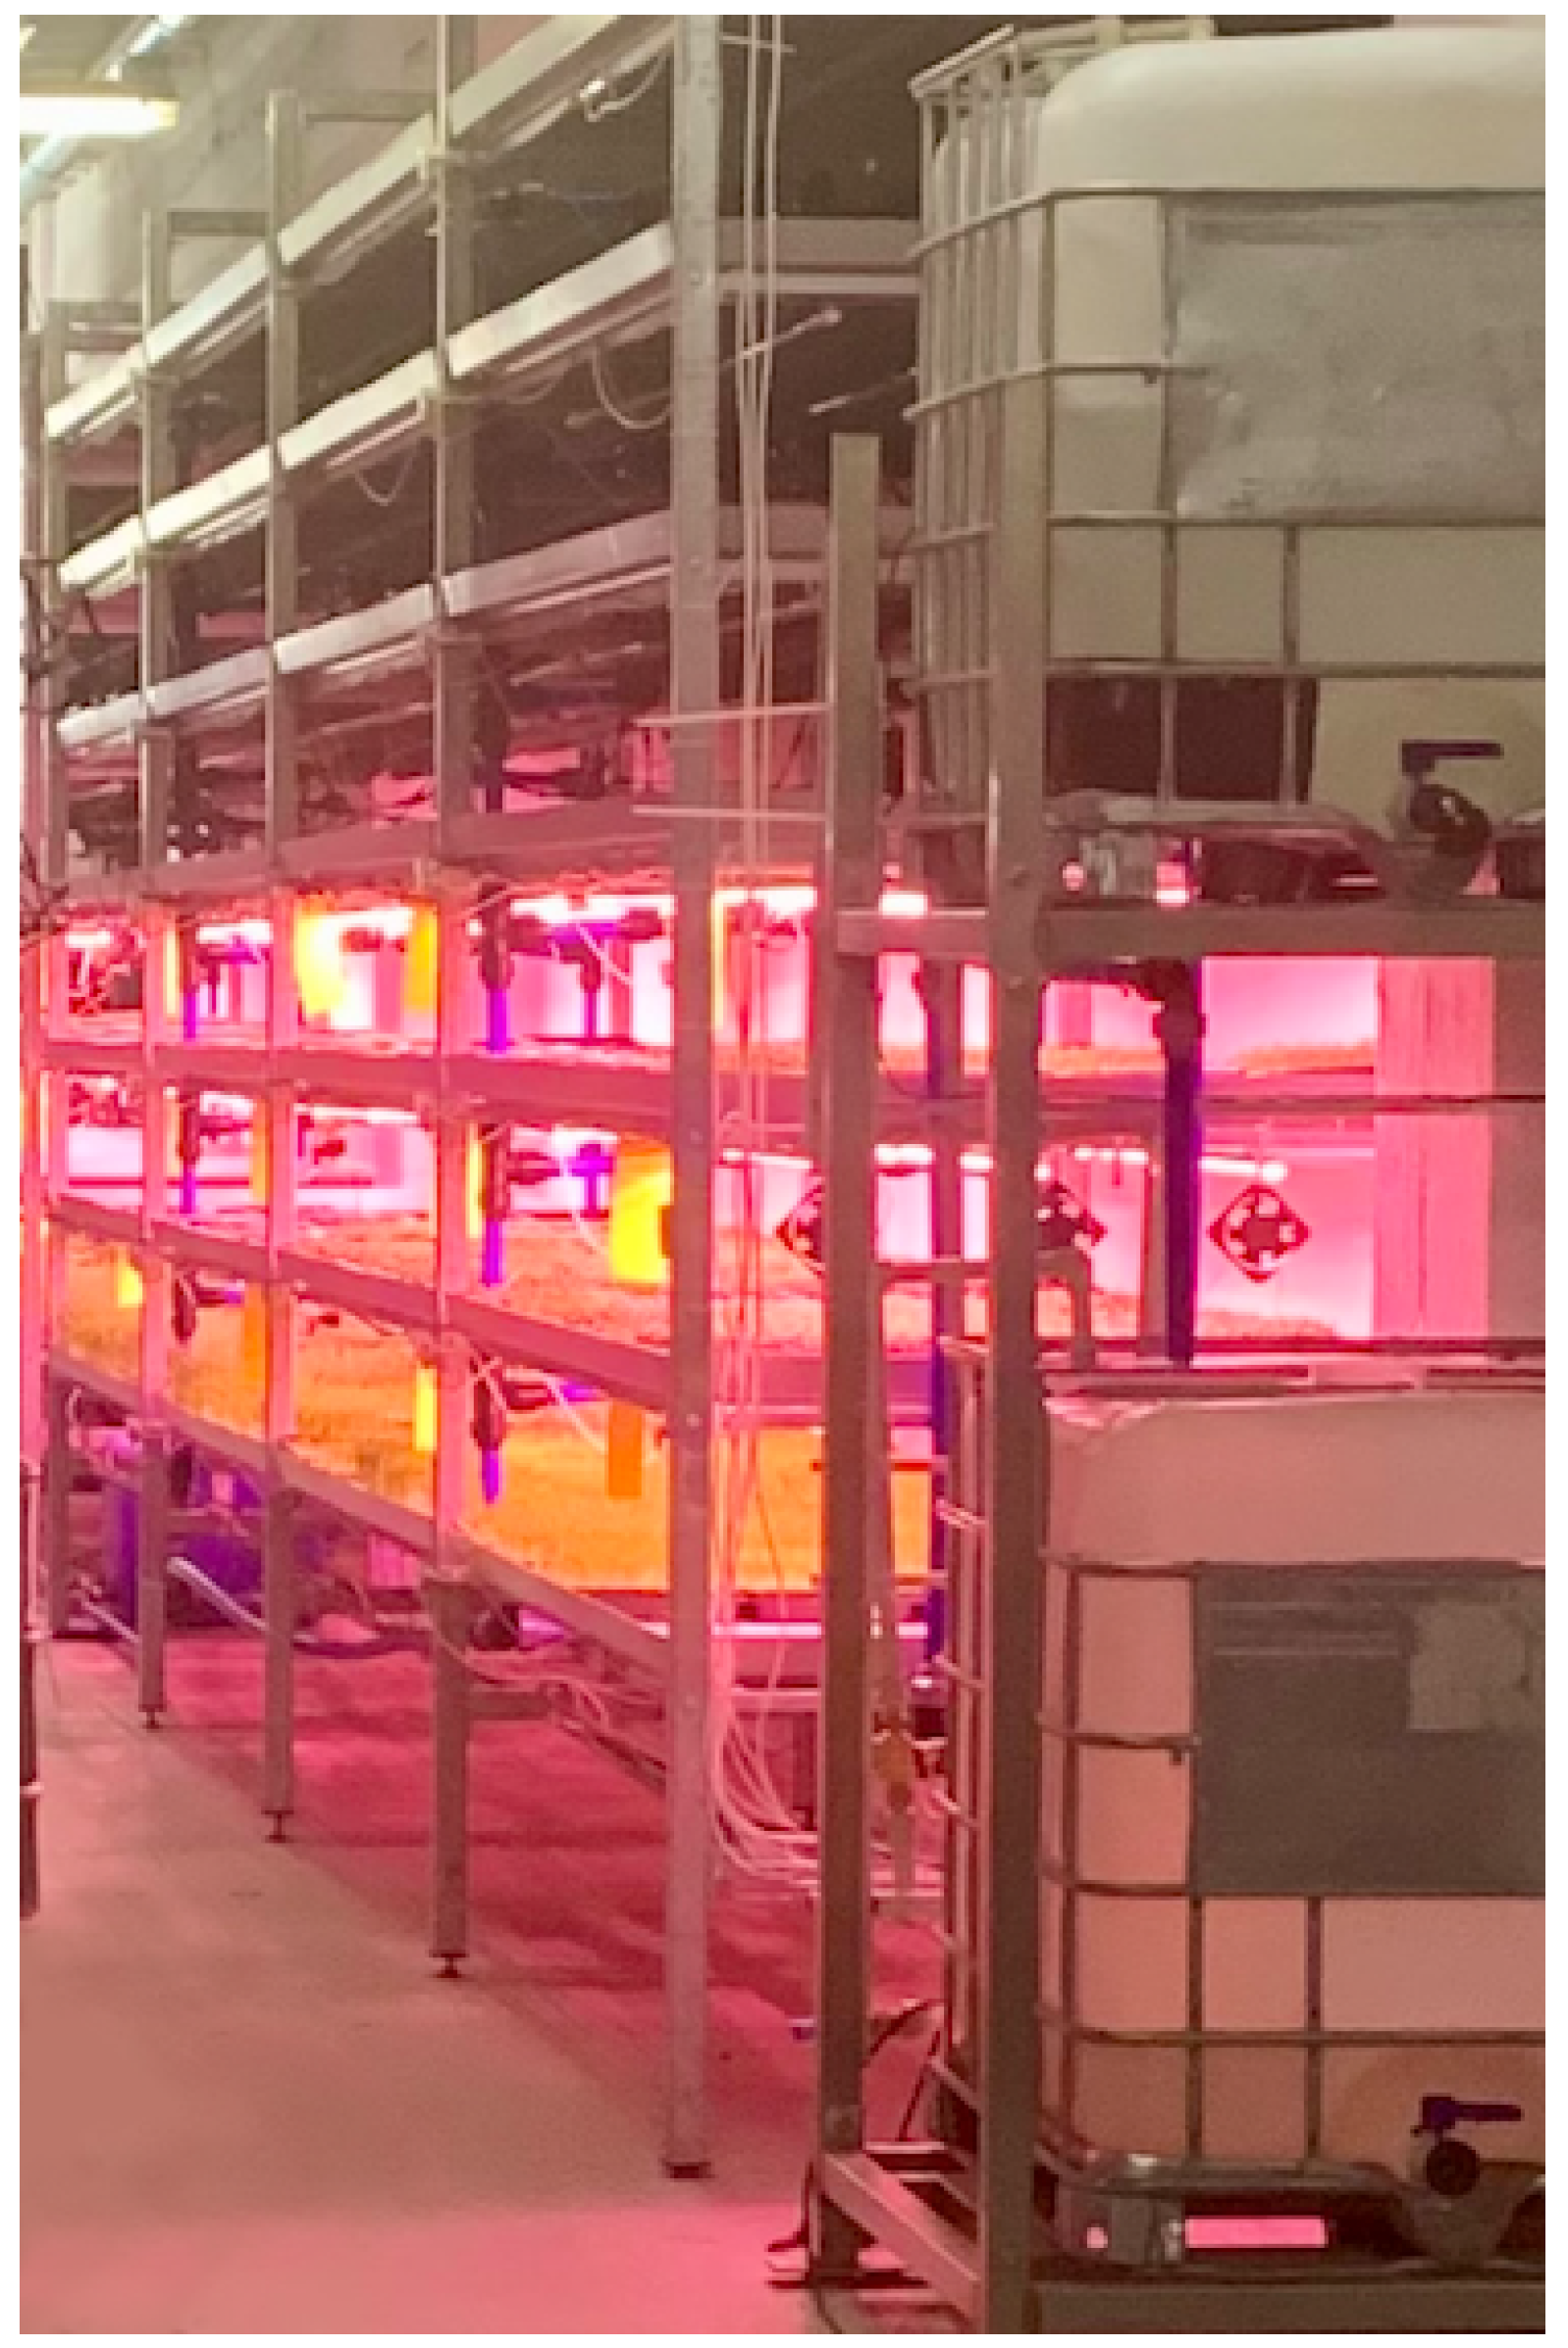
Figure 6 illustrates a sample implementation of the solution described in this article. In the indoor farm, a grid of sensors is placed over the greenhouse. A detailed description of the experimental set-up is described in
Appendix A.
The sensors were connected to management units using “connectors”, specifically 4 wire cables that provide 12 V of power and RS-485 connectivity for a Modbus network. The management units were built on Raspberry Pi 3B devices equipped with custom RS-485 adapters. Each management unit could handle up to 256 sensors (the limit of Modbus network addressing), although for resilience purposes, the maximum number was 25 sensors per management unit.
Each management unit operates independently and can perform various tasks without a connection to the cloud services. For example, in the event of a network outage, it collects data from the sensors, stores it locally and sends the data to the cloud service once the network connection is restored.
The connection with the cloud service is established over the public Internet. To ensure resiliency, several connections might be created for a single greenhouse.
The cloud-based management system has been implemented as a set of components hosted in the Microsoft Azure cloud, including the following:
Graph Representation of the Indoor Farm Management System
The solution described in this document was designed as a “digital twin”, where the physical system is represented by a corresponding graph. The IoT network graph of the presented solution consists of more than 100 nodes, representing sensors, actuators and management units. While the majority of the graph follows a tree structure, there are additional connections that extend beyond the basic tree structure, spanning across multiple nodes. Another category of connections represents redundancy, which is vital for handling failures.
Each node representing a sensor is associated with a set of properties that define the threshold values for individual readings and aggregates. For example, a temperature sensor’s single reading is expected to fall within the range of 20–27 degrees Celsius, while the average value over the past 6 h is expected to be within 23–24 degrees Celsius.
The system updates the sensor data from every 30 s to 5 min. Each update is compared against the properties of the corresponding sensor node and may trigger an action if the data fall below or exceed the defined thresholds.
This comparison process is a relatively simple operation that does not necessarily require the use of graphs. However, thanks to the graph representation, the system can automatically consider additional factors, such as the physical distance between sensors in the same area. With this additional information, a single discrepancy can be interpreted as a sensor failure rather than an event that should generate a “temperature out of range” alarm.
The graph transformation mechanism has already been discussed in
Section 3, and now it is time to link it with the practical application described below.
Example of Self-Adoption
During the active crop monitoring period in 2022, we collected a total of 9,309,520 individual records. Approximately 20 sensors were responsible for generating the data, recording them at intervals ranging from 30 s to 5 min.
The primary purpose of these data was to analyze the behavior of the system, which involved monitoring the sensors for abnormalities and identifying the causes behind such irregularities.
The collected data were mapped onto the properties of the graph’s nodes, with each graph node representing a single sensor.
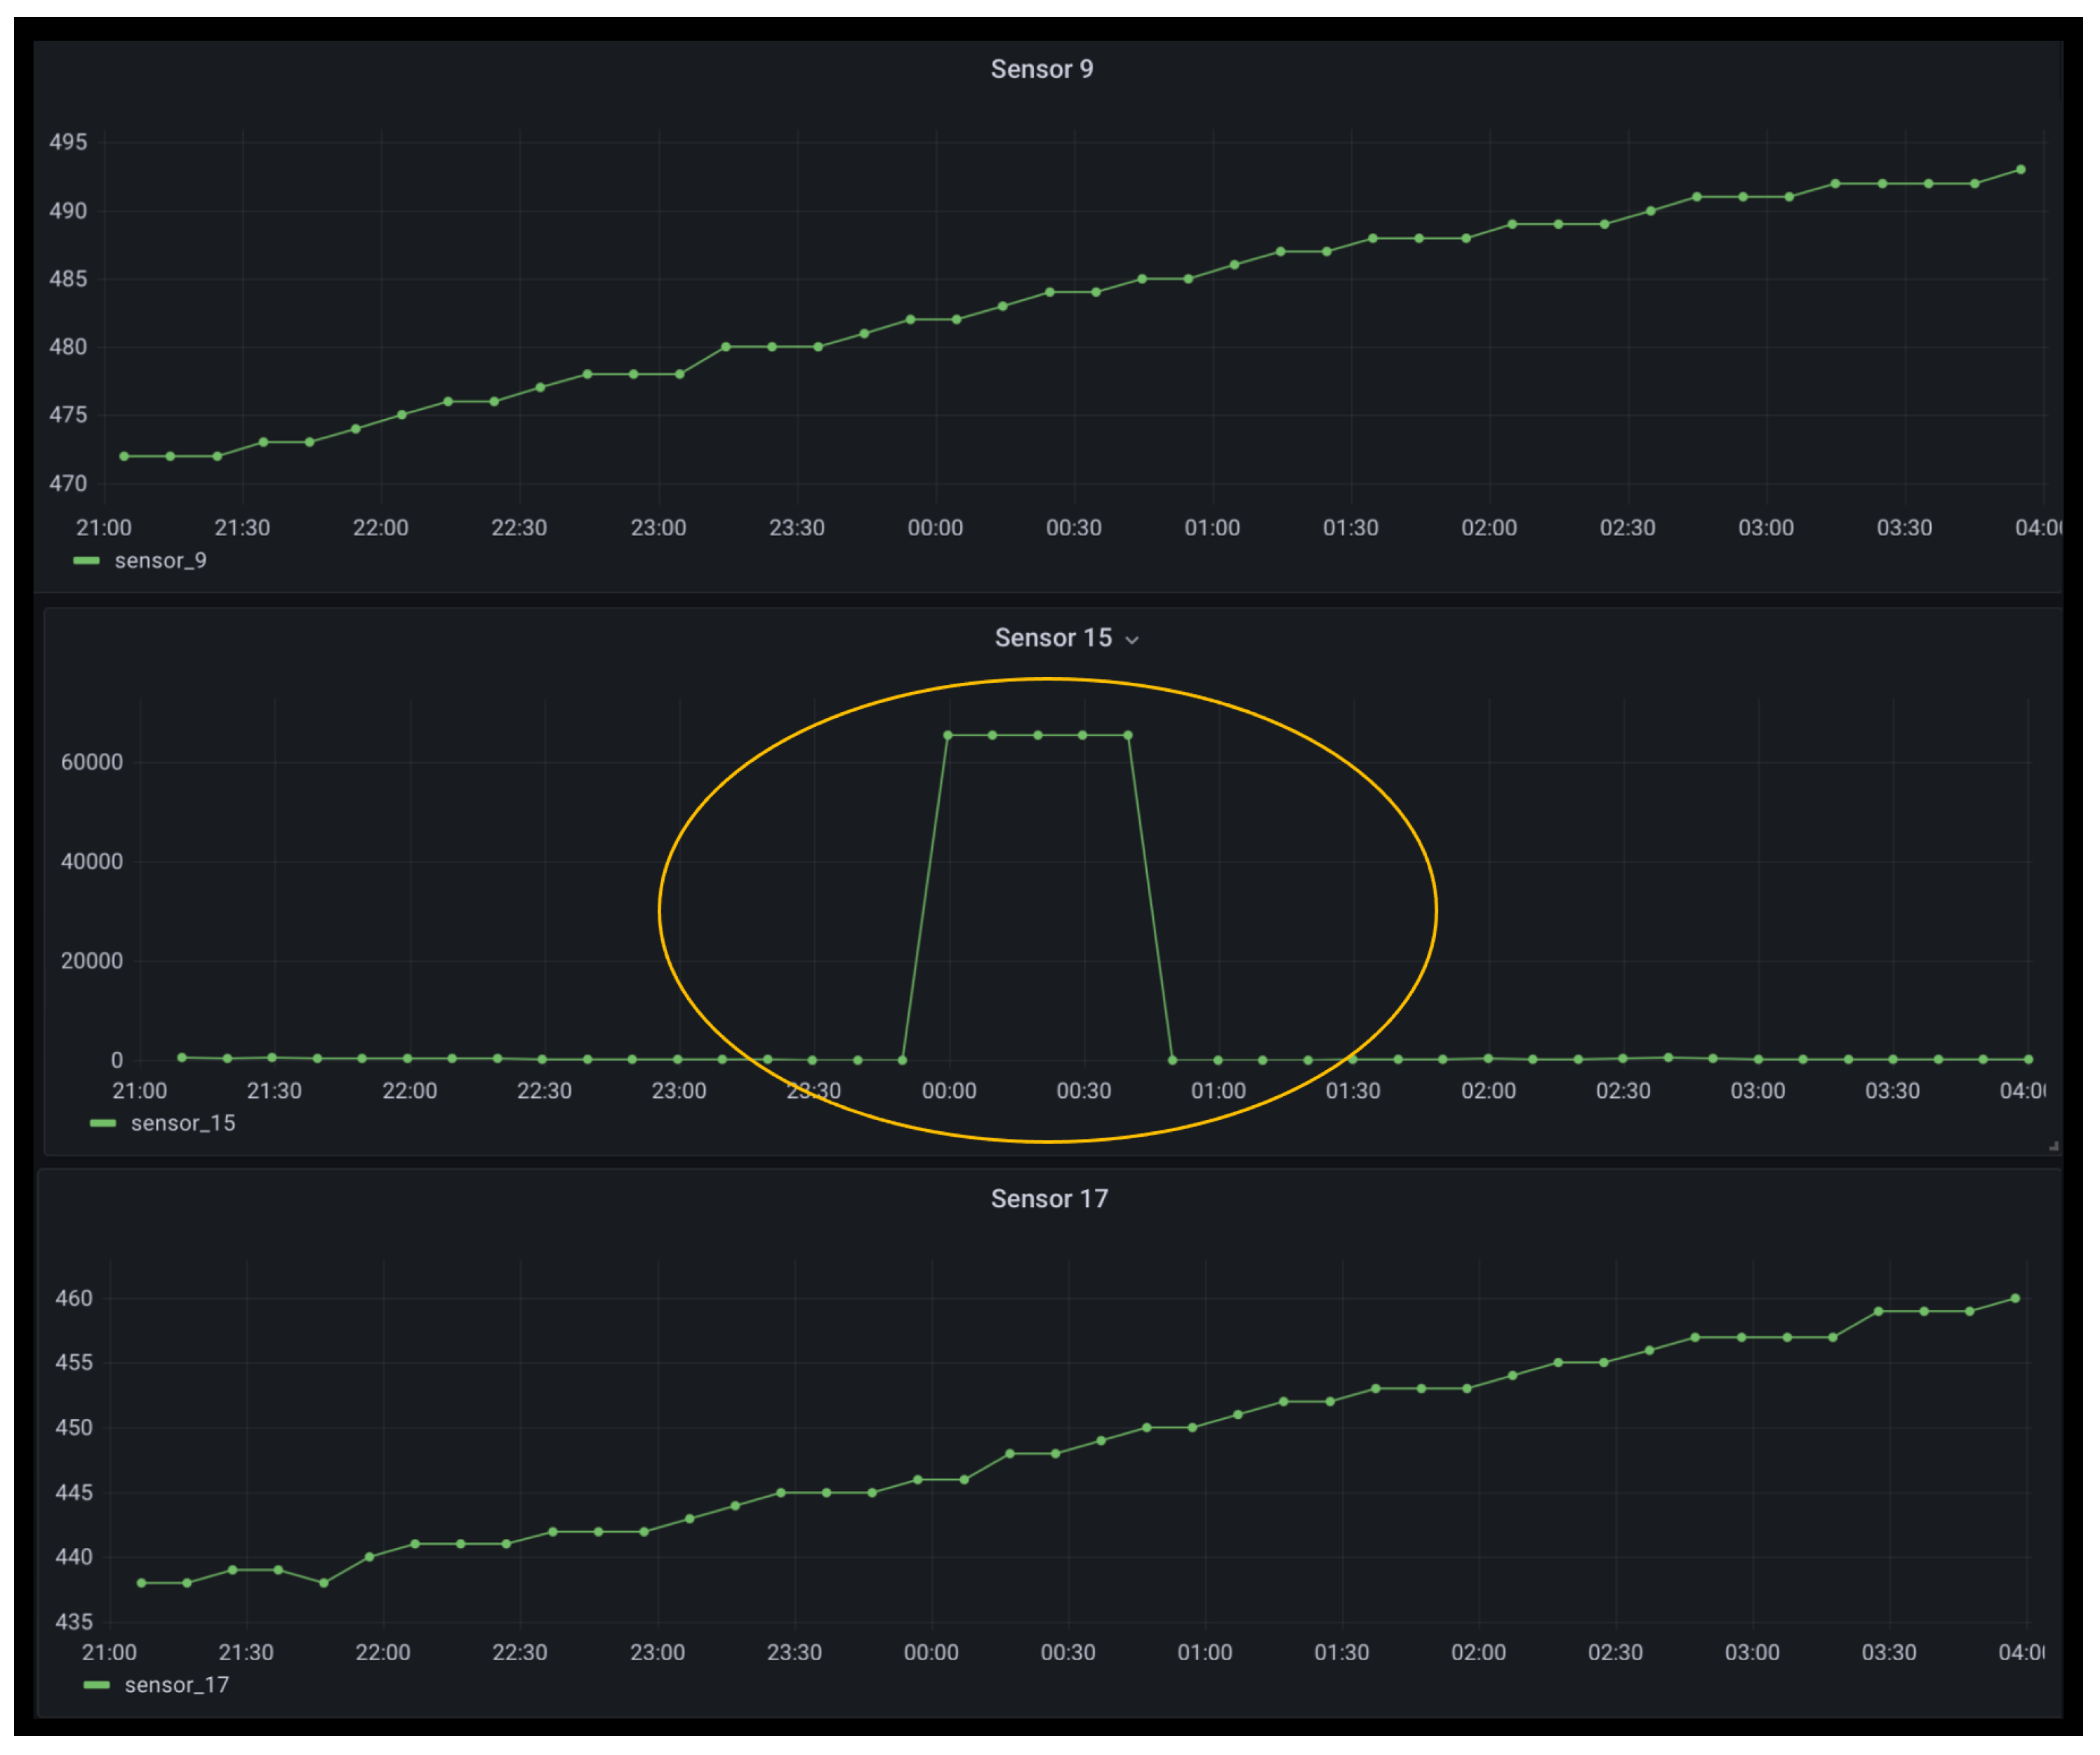
Figure 7 presents detection of the anomaly and self-healing action. The humidity sensors are labeled as sensors 9, 15 and 17. While the normal data range for humidity sensors is between 0 and 1000, the failure of sensor 15 is indicated by a value of 64,000 (note the different scale of the chart created for sensor 15). An anomaly was detected at 11:50 p.m. and corrected (by the creation of a virtual sensor) at 12:50 a.m. The virtual sensor was also labeled as sensor 15 in order to maintain consistency of the system (i.e., allow the actuators connected to sensor 15 to operate as usual).
The anomaly detected at 11:50 p.m. triggered automated actions, following the example discussed in
Section 3. The failing humidity sensor was replaced with a virtual humidity sensor that extrapolated values from other humidity sensors (sensor 9 and sensor 17) on the IoT network.
In order to correct an error, the system performed the following set of actions:
Detection of the sensor failure: Sensor data that are out of range, as defined by the local capability, trigger the next actions.
Removal of the failed sensor from the IoT network: Transformation P1 is applied.
The “virtual humidity sensor” (VHS) has to calculate the proper value based on the values of the neighboring sensors. To find them, we apply production P2 as many times as it can be applied. In the case of the graph presented in
Figure 5, only two CE nodes are connected with node 11 (which is connected with the VHS), and thus P2 will be applied twice. Let us note that in other configuration cases (with more neighboring sensors), the same rules will apply.
The new configuration presented in
Figure 5 is uploaded to the IoT network. For deploying the results of the transformation to the IoT network, we utilize automation based on the DevOps methodology [
15]. Continuous integration-continuous deployment (CI-CD) pipelines automatically update both the system’s configuration and the software components. CI-CD promotes a high level of automation while ensuring strict validations and control over the process.
When the failed sensor will be repaired, the system should restore the previous graph configuration. The new transformation rules are defined as P3 and P4. P3 is the transformation from
Figure 3, but the left side’s production is the graph on the right side of
Figure 3, and the right side’s production is on the left side of the same figure. Analogously, on P4, the left and right sides of production are changed in
Figure 4. For the graph presented on
Figure 5, we note the following:
Production P4 for nodes 22, 11, 16 and 19 is applied;
Production P4 for nodes 22, 11, 10 and 13 is applied;
Production P3 for nodes 11 and 22 is applied.
The measurement of success is based on the capabilities provided by the transformed network. Similar to the initial definition of the IoT network, which is determined by a set of properties that enable business capabilities, an identical or at least a similar set of measurements should be applied to the resulting network to determine its success.
Built-in Resiliency of the System Each layer of the system provides a different type of resiliency:
Sensors connected to the management unit use separate, redundant connectors to mitigate physical failures. For example, connectors can failover between wired and wireless connections to ensure continuous data transmission.
Management units are equipped with local storage, enabling them to temporarily store data in case of communication failures. This ensures that data are not lost and can be transmitted to the cloud service once the connection is restored.
Feedback Loop and Self-Learning The capabilities used to describe various aspects of the system can be adjusted through self-learning methods. Self-learning relies on the collection of historical data, such as readings from the light sensor, as well as user feedback that evaluates the current state of the system on a scale from 1 to 5. A mobile application prompts users to provide feedback regularly, typically once per day. As part of the self-learning process, the system detects the system state, such as the intensity of light, that generates the highest feedback. The collected feedback, along with other historical data, is then used to redefine the capabilities of the system, aiming to represent its optimal state.
6. Results
During the period between February and November 2022, the system underwent rigorous testing and fine-tuning across several crop cycles. The measurable results of this testing phase encompass two main elements:
The number of discrepancies detected and fixed by the system: On average, the system detected and addressed approximately 10 discrepancies per day. Most of those discrepancies were ignored because the overall capabilities of the network were preserved. Some discrepancies resulted in automated actions, leading to adjustments in the configuration of the system. The corrective action described in
Section 3 is an example of such an action, resulting in the creation of a virtual sensor to replace the failed one. It is worth mentioning that after the failed sensor was replaced with the new one, another corrective action was necessary to replace the virtual sensor again with a new one. In total, we counted approximately 500 corrective actions automatically performed by the system. The average execution time of the automated action took 5 min with full deployment, followed by an hourly deployment cycle, which took less than an hour. The same action, when executed by the human operator, requires 2–24 h, provided that operators work in shifts of 12 h per day 6 days per week. The benefit of automation related to validation of the capabilities and performance of automated actions reduces the efforts by a factor of 100 compared with manual actions.
Overall performance of the crop processes: During the testing period, the system’s configuration was frequently adjusted, resulting in the changes described in
Section 4.1.2. The efficiency of the cultivation process was recorded after each change by gathering feedback from the farm’s operator. As a result of this process, the average duration of the crop process was reduced, indicating improved productivity and optimized growth conditions for the plants.
These measurable results highlight the effectiveness and positive impact of the system in detecting and rectifying discrepancies, as well as its contribution to enhancing the overall performance of plant cultivation.
7. Conclusions
IoT systems open up a wide array of possibilities, particularly concerning the optimization of a network comprising interconnected IoT devices. Such systems are quickly growing, but what is more important is the necessity to ensure their maximum reliability. In this paper, we showed that graph transformations are able to support both the formal system structure description and the automatic verification of local and global capabilities. This significantly reduces maintenance costs for programmers in the case of failures, system expansion and hardware reconfiguration. Last but not least, it significantly reduces programmers’ effort, especially during the system maintenance stage, where in most cases it can be automated.
Optimization directly translates into tangible business outcomes. In the example provided in
Section 5, the length of the cultivation process was reduced, and the system successfully detected and corrected the majority of the failures. All these actions were carried out online. It is important to acknowledge that applying graph notation to every single element of an IoT network is not always necessary. For instance, a grid of sensors forming a relatively simple matrix structure can be managed using simpler methods. In such a case, such a grid can be expressed as a node of a hierarchical graph [
25]. Certain areas of the network, such as properties representing a varying sensor density across the greenhouse, may require more complex definitions using formal graph notation.
The solution presented is highly applicable to other implementations, such as building automation, street lighting and various industrial solutions, where the network complexity and interdependencies between nodes are more intricate.
