Abstract
Diffuse optical tomography (DOT) technology enables a differentiation between oxyhemoglobin (HbO) and deoxyhemoglobin (HbR) in the sensory and motor cerebral gyri, resulting in greater sensitivity for cerebral activation compared to functional magnetic resonance imaging (fMRI). Here, we introduce a novel approach where functional regions of interest (ROIs) are created based on the specific signal behavior observed in DOT measurements in contrast to the conventional use of structural-ROI obtained from anatomical information. The generation of cerebral activation maps involves using the general linear model (GLM) to compare the outcomes obtained from both the functional and structural-ROI approaches. DOT-derived maps are then compared with maps derived from fMRI datasets, which are considered the gold standard for assessing functional brain activity. The results obtained demonstrate the effectiveness of employing functional-ROI to improve the spatial location of functional activations in the sensory and motor cerebral gyri by leveraging the neural synchronization data provided by DOT. Furthermore, this methodology simplifies data processing, where anatomical differences can pose challenges. By incorporating functional-ROI prior to GLM application, this study offers enhancements to DOT analysis techniques and broadens its applicability.
1. Introduction
Optical measurements play a crucial role in examining brain physiology, particularly in exploring the connection between neural activity and changes in hemodynamics. In neuroimaging studies, diffuse optical tomography (DOT) has been extensively utilized to detect functional alterations related to visual, motor, somatosensory, or cognitive stimuli [1]. Previous research has introduced a novel approach to processing DOT data, treating them as functional magnetic resonance imaging (fMRI) volumes. This approach was successfully validated in the prefrontal cortex using a cognitive paradigm [2] and in sensory and motor areas [3]. The DOT technique also enables the precise measurement of hemodynamic changes during intricate brain processes, such as motor imagery, which reveals more subtle cerebral activations compared to motor execution [4].
The presence of noises from non-target anatomical regions, such as the scalp or the external layers of the skull, poses a significant challenge in DOT measurements. These signals introduce short-term variability that affects spatial and temporal changes throughout the brain and scalp [5]. To overcome this challenge, various methods have been employed that do not rely on assumptions about the hemodynamic model. Approaches like principal component analysis (PCA) or independent component analysis (ICA) have been utilized to generate cerebral activation maps [6] and reduce noise originating from these external layers. Similar to common practices in neuroimaging studies, a widely used method is region of interest (ROI) analysis, which relies on the structural anatomy of the brain. This approach involves selecting specific regions within the brain based on their anatomical landmarks or predefined brain atlases. By focusing on these regions of interest, researchers can analyze the DOT data specifically within these areas, allowing for more targeted and accurate examination of the functional activations. This structural-ROI-based analysis in DOT is an approach commonly employed in neuroimaging studies, where researchers define specific regions of interest based on structural anatomy to investigate brain activity and connectivity patterns [7], particularly when a magnetic resonance (MR) device is available. However, a notable drawback of using DOT in human brain studies is the reliance on a structural MRI image for the accurate localization of functional activations within the anatomy. This requirement for an MRI scan limits the usability of DOT techniques in situations where an MRI scan is not easily accessible.
Here, we investigate whether an ROI analysis could be constructed based on the intrinsic signal/brain characteristics across voxels rather than relying on a structural-ROI. To test this hypothesis, we analyzed DOT data recorded from the well-studied sensory-motor area, where the spatial locations of activations are known. The data were collected from a group of healthy subjects while they performed finger movements with their right hands. The cerebral maps obtained from DOT were compared with the maps derived from fMRI data, providing a basis for comparison and validation.
2. Materials and Methods
2.1. Subjects and Experimental Design
A total of nine participants who were right-handed and had no history of neurological disease were included in the study. Prior to the experiment, the participants were given a thorough explanation of the procedures and purpose of the study, and they provided written consent to participate. The study received ethical approval from the local ethics committee at the University of La Laguna with approval code CEIBA2015-0153 and was conducted in accordance with the guidelines stated in the Declaration of Helsinki.
A block design began with a 16 s resting condition, which consisted of the observation of a static word (Stop) in the center of the screen. The instructions appeared on the screen during all periods of each task block. The execution condition consisted of the performance of the opposition movement between the thumb finger versus the rest of the fingers for 16 s. A metronome set at 3 Hz was used for the execution condition. In order to stabilize physiological fluctuations and ensure steady-state magnetization of the tissue during fMRI, a 20 s dummy time was incorporated prior to each motor execution. The visual presentation of the experimental paradigm was facilitated through the use of Presentation software, developed by Neurobehavioral Systems, Inc., based in Albany, California. A total of twenty-four task blocks for each condition were performed with both DOT and fMRI devices. All instruments and facilities belonged to the Magnetic Resonance Service for Biomedical Research (Servicio de Resonancia Magnética para Investigaciones Biomédicas-SRMIB SEGAI) at the University of La Laguna, Santa Cruz de Tenerife, Spain.
2.2. Data Acquisition and Preprocessing in MRI
Functional magnetic resonance images were collected using a 3.0 T Signa Excite HD scanner manufactured by General Electric (GE) Healthcare. For precise anatomical localization, a T1-weighted volume was acquired with the following parameters: repetition time (TR) of 6 ms, echo time (TE) of 1 ms, flip angle of 12°, matrix size of 256 × 256 pixels, in-plane resolution of 0.98 × 0.98 mm, spacing between slices of 1 mm, slice thickness of 1 mm, and no interslice gap. The acquired anatomical slices encompassed the entire brain and were obtained parallel to the anterior–posterior commissure. During the motor paradigm, a series of 385 T2-weighted echo-planar imaging (EPI) volumes were obtained. The EPI sequence parameters included 36 axial slices covering the entire head, with a field of view of 25.6 mm, slice thickness of 4 mm, interslice gap of 1 mm, matrix size of 64 × 64, flip angle of 90°, TR of 2 s, and TE of 22.1 ms.
The preprocessing of fMRI volumes was conducted using Statistical Parametric Mapping (SPM12) software developed by The Wellcome Trust Centre for Neuroimaging at University College London. The following steps were applied: realignment to correct for motion artifacts, slice timing correction, registration with the T1-weighted structural image, and transformation into the standard anatomical space of the Montreal Neurological Institute (MNI). To suppress noise and account for residual differences in functional and gyri anatomy, the EPI images were subjected to isotropic smoothing with an 8 mm full-width half-maximum kernel. Additionally, a high-pass filter with a cutoff period of 64 s was used to eliminate low-frequency noise associated with breathing and pulse signals [8].
2.3. Data Acquisition and Preprocessing for DOT Measurements
To acquire the DOT data, a DYNOT 232 instrument manufactured by NIRx Medizintechnik GmbH in Berlin, Germany, was utilized. The instrument employs continuous-wave measurements and operates with two laser sources at frequencies of 760 nm and 830 nm. The measurements were performed in a time-multiplexed scanning fashion with a sampling rate of 1.8 Hz. For light transmission and detection, optical fibers (optodes) were used, allowing near-infrared (NIR) light to travel to and from the DOT device. In this study, a total of thirty-two optical fibers were employed to measure hemodynamic changes in the contralateral cerebral hemisphere, specifically the left side. These optical fibers were configured as source–detector pairs, enabling the establishment of 1024 optical channels to capture and analyze the changes in the measured light intensity. The optodes were arranged in a rectangular grid at a distance of 1 between each of them, covering the C3 position referring to the EEG 10–20 system [9] (Figure 1a).
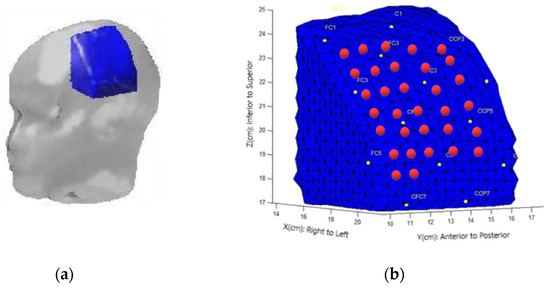
Figure 1.
Finite model element (FEM) selection. (a) Atlas with an FEM (blue) covering the sensory-motor cerebral area C3. (b) Localizations of optical fibers (circles) on the boundary. Red dots correspond to source–detector pairs. Yellow dots correspond to EEG 10–20 system.
Optical channels were preprocessed following the approach in prior studies that includes the following: (1) optical channels were filtered using Bayesian filtering to remove physiological noise [10]; (2) optical fiber grid positions on individual heads were marked for a posterior translocation from individual space to precalculated forward model space from the BrainModeler tool from NIRx NAVI imaging. The BrainModeler tool utilizes finite element models (FEMs) [11] to describe uniform optical properties (µa = 0.06 cm−1, µs 0 = 10 cm−1). This tool defines the source–detector pair placement on the head’s surface and the internal optical properties, creating a forward model that characterizes changes in boundary data due to absorption variations in the tissue for each channel–node combination. A submesh was selected for the cerebral hemisphere, depending on the positions of the fiber grid. The left hemisphere’s submesh comprised 4518 nodes and 19,573 tetrahedrons with dimensions of 7.65 cm (width) × 7.05 cm (height) × 7.20 cm (thickness), as depicted in Figure 1b. (3) DOT volume reconstruction employed the normalized difference method [12], which establishes a connection between surface head measurements and changes in the internal optical properties relative to a reference medium, utilizing the perturbation approach [13]. Alterations in absorption at two distinct wavelengths were leveraged to generate reconstructed images representing relative concentrations of oxyhemoglobin (HbO) and deoxyhemoglobin (HbR) with the aid of extinction coefficients for both wavelengths [14]. Reconstructing DOT images presents a challenge, as it involves the inversion of the weight matrix J, which becomes an ill-posed problem due to the significant attenuation of NIR light with increasing depth. To address this, the weight matrix is inverted using a truncated singular value decomposition algorithm with the selection of the truncated number of singular values determined by the minimum description length as a selection criterion. A total of 1397 DOT volume series with a size for each volume of 64 × 64 × 64 voxels were reconstructed for each hemoglobin state, HbO and HbR.
2.4. Functional Region of Interest (Functional-ROI)
Once DOT and fMRI data were preprocessed and normalized to standard MNI space, functional-ROI was calculated. This calculation is based on the assumption that brain regions involved in a particular function tend to exhibit similar temporal fluctuations in neural activity [15]. This implies that neighboring voxels within a brain region should exhibit similar patterns of activity over time. Therefore, it provides information about the coherence of neural activity within a specific brain region. The time series for each voxel within the DOT volume is obtained by extracting the hemodynamic (BOLD, HbO and HbR) signals, which reflects hemodynamic changes related to neural activity. Thus, for a voxel at time , the rank R(t) is defined as:
where C is the number of neighbors (7 voxels) of the voxel, and is the mean across its neighbors at the ith time point. Then, Kendall’s coefficient is used to measure the similarity of the time series among neighboring voxels within the ROI. The Kendall coefficient of concordance (KCC) is a statistical measure which provides a measure of how well the time-series data within a cluster of neighboring voxels are synchronized or correlated. In other words, KCC helps assess the homogeneity or regularity of neural activity within a particular region of the brain [16]. A KCC value of 0 indicates no concordance among the time series of neighboring voxels. This implies a lack of synchronization in neural activity in that region, suggesting that the activity patterns are dissimilar and irregular. Meanwhile, a KCC value of 1 indicates perfect concordance among the time series in the neighboring voxels. This signifies that the time-series data are highly synchronized, indicating a highly regular and coordinated pattern of neural activity in that brain region. Finally, the obtained KCC values are then transformed into Z-scores to allow for statistical comparisons based on one sample t-test (family-wise error rate; FWER threshold p < 0.001). As a result, the statistical maps of the group analysis, which spatially represent the synchronization of HbO, HbR, and BOLD signals within the reconstructed DOT volume, serve as functional-ROIs during the general linear model (GLM) calculation.
2.5. General Linear Model (GLM) for Both fMRI and DOT Data Sets
The approach developed by the authors to treat DOT volumes as if they were fMRI volumes using canonical SPM 12 software was used. In order to improve the signal-to-noise ratio, both the fMRI and DOT volumes underwent filtering by applying a high-pass filter based on discrete cosine transformation. The filter had a cutoff period of 64 s. The design matrix utilized in the analysis included two regressors: one for the rest condition and another for the task condition defined as (Equation (2)). These regressors were convolved with the canonical hemodynamic response function (HRF). It is worth noting that the convolutions were reversed to visualize the negative response corresponding to the HbR signal. Then, the estimation using the GLM was performed:
where represents the hemodynamic response which can be BOLD, HbO or HbR, denotes the regressors that explain the data, represents the coefficients indicating the extent to which each regressor explains the data, and signifies the variance in the data that remains unexplained by the regressors (i.e., noise).
After completing the estimation, cerebral activation maps were created through a fixed-effects analysis. It is important to note that a fixed-effects analysis does not facilitate making general population-level conclusions but is well suited for this specific sample. To specifically examine the motor execution condition compared to the rest condition, a contrast was computed. This resulted in the production of T-contrast maps for each dataset in both the DOT and fMRI modalities.
3. Results
Cerebral maps onto a standard space (MNI), generated through GLM analysis incorporating both structural and functional-ROIs, were visualized using XjView 8.1 for measurements obtained from DOT and fMRI.
3.1. GLM Analysis for the fMRI and DOT Datasets Using Structural-ROI
Previous research has revealed that during finger-to-thumb opposition movements, the primary sensorimotor cortex (SMC) exhibits contralateral activation, which extends throughout the pre- and postcentral gyri. A GLM analysis using a structural-ROI (see Figure A1) was calculated to ensure the results for the following analysis steps using the same dataset. As expected, Figure 2 shows the cerebral activations across the left pre- and postcentral gyri, covering the following Brodmann areas (BAs): BA2 and BA3, which correspond to the primary somatosensory cortex, and BA4 related to the motor cortex (M1).
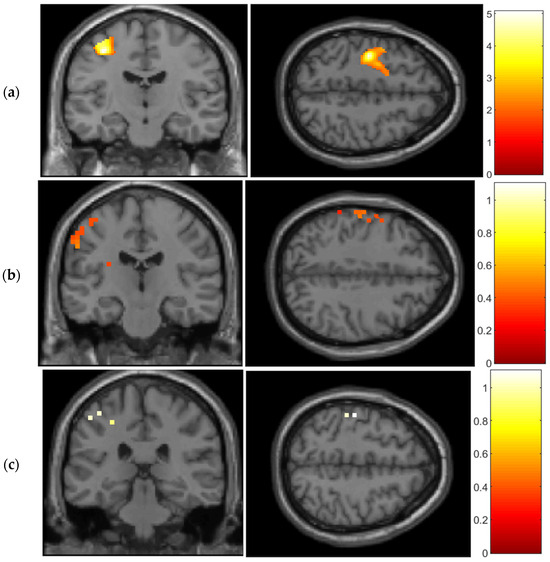
Figure 2.
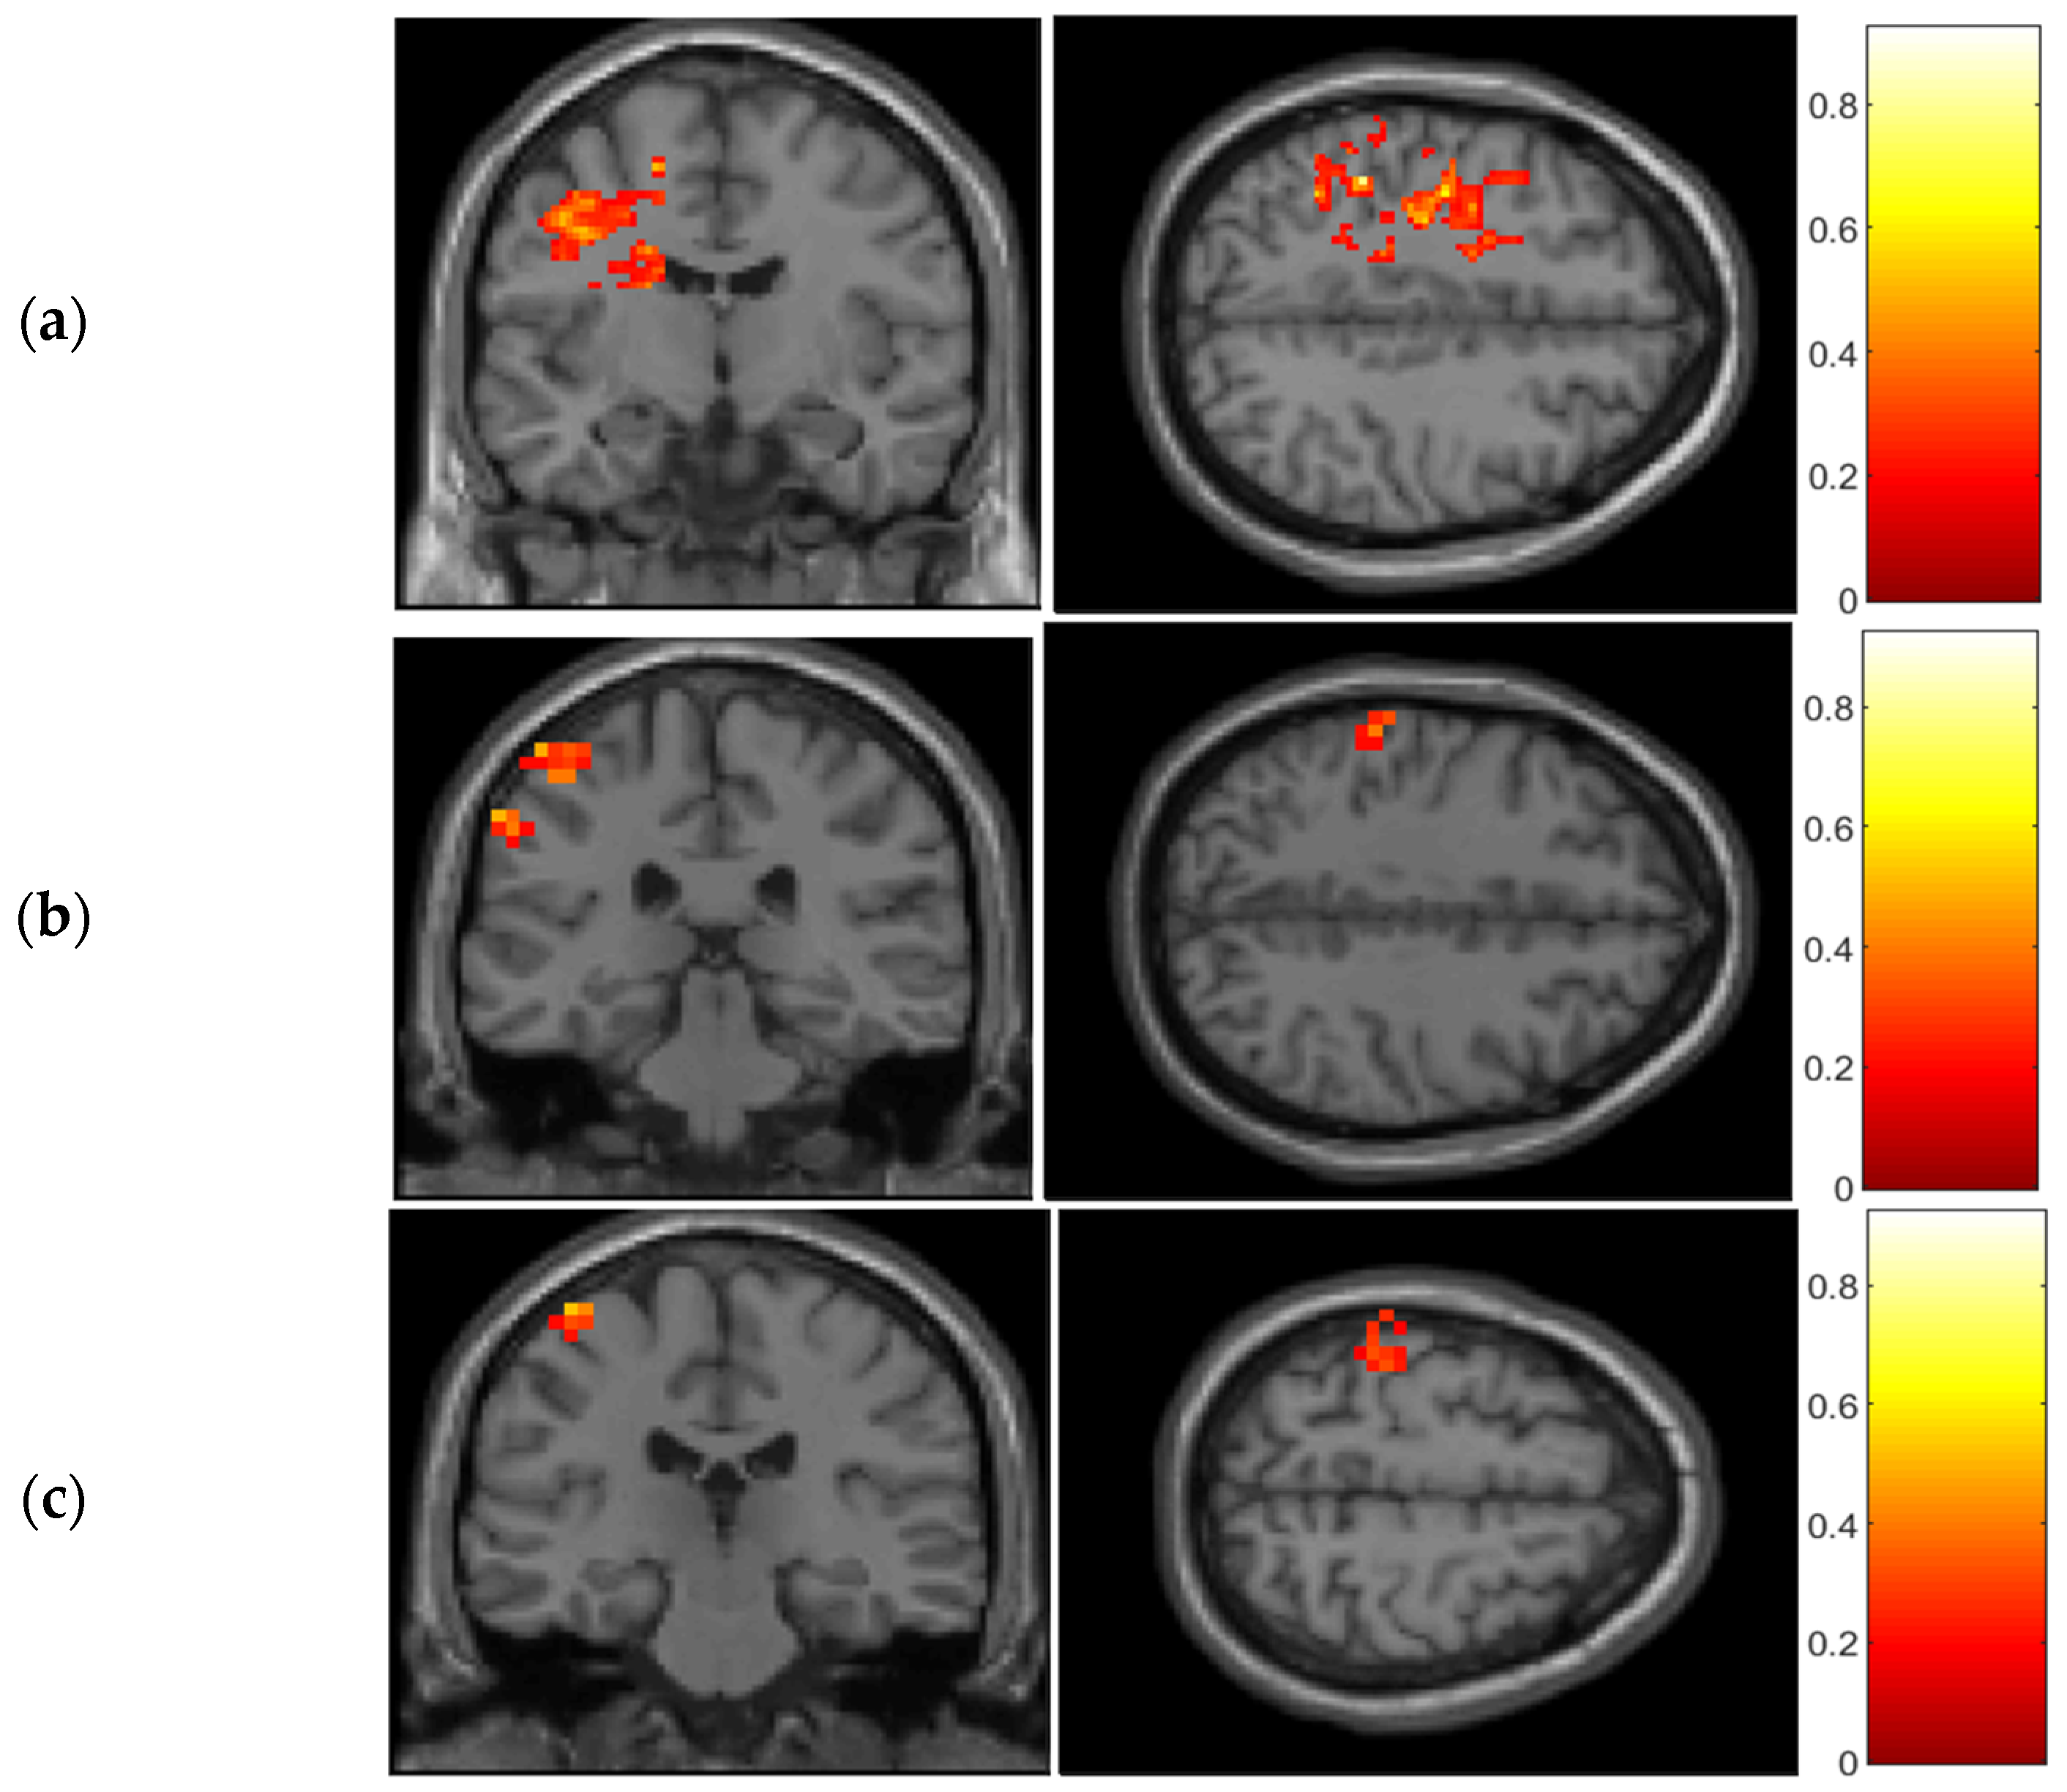
The t-contrast maps of cerebral activation for the motor execution > rest contrast measured by the fMRI and DOT devices in a subject group (N = 9) for (a) BOLD, (b) HbO and (c) HbR signals in coronal and axial views. All results were mapped onto a standard space (MNI). FWER threshold p < 0.05 at the voxel level for all signals.
Figure 2 shows t-maps for the BOLD (FWER-threshold p < 0.05; (Peak MNI coordinates: −46; −18; 28)), HbO (FWER-threshold p < 0.05; (Peak MNI coordinates SMC: −24; −32; 52, M1: −55; −18; 37)) and HbR (FWER-threshold p < 0.05; (Peak MNI coordinates SMC: −44; −27; 54, M1: −23; 3; 49)) signals in coronal and axial views on the contralateral side.
3.2. GLM Analysis for the fMRI and DOT Datasets Using the Functional-ROI
The resulting t-maps reveal cerebral activations robustly in the contralateral pre- and postcentral gyri, specifically in Brodmann areas 1, 2, 3, 4, and 6, for both HbO and HbR (see Figure A2). Compared to the GLM based on structural-ROI, GLM using functional-ROI seems to be less sensitive to constant event-related hemodynamic responses. However, its major advantage is the ability to detect unpredicted (event-nonrelated) hemodynamic responses that the GLM structural-ROI method itself failed to identify (see Figure A2).
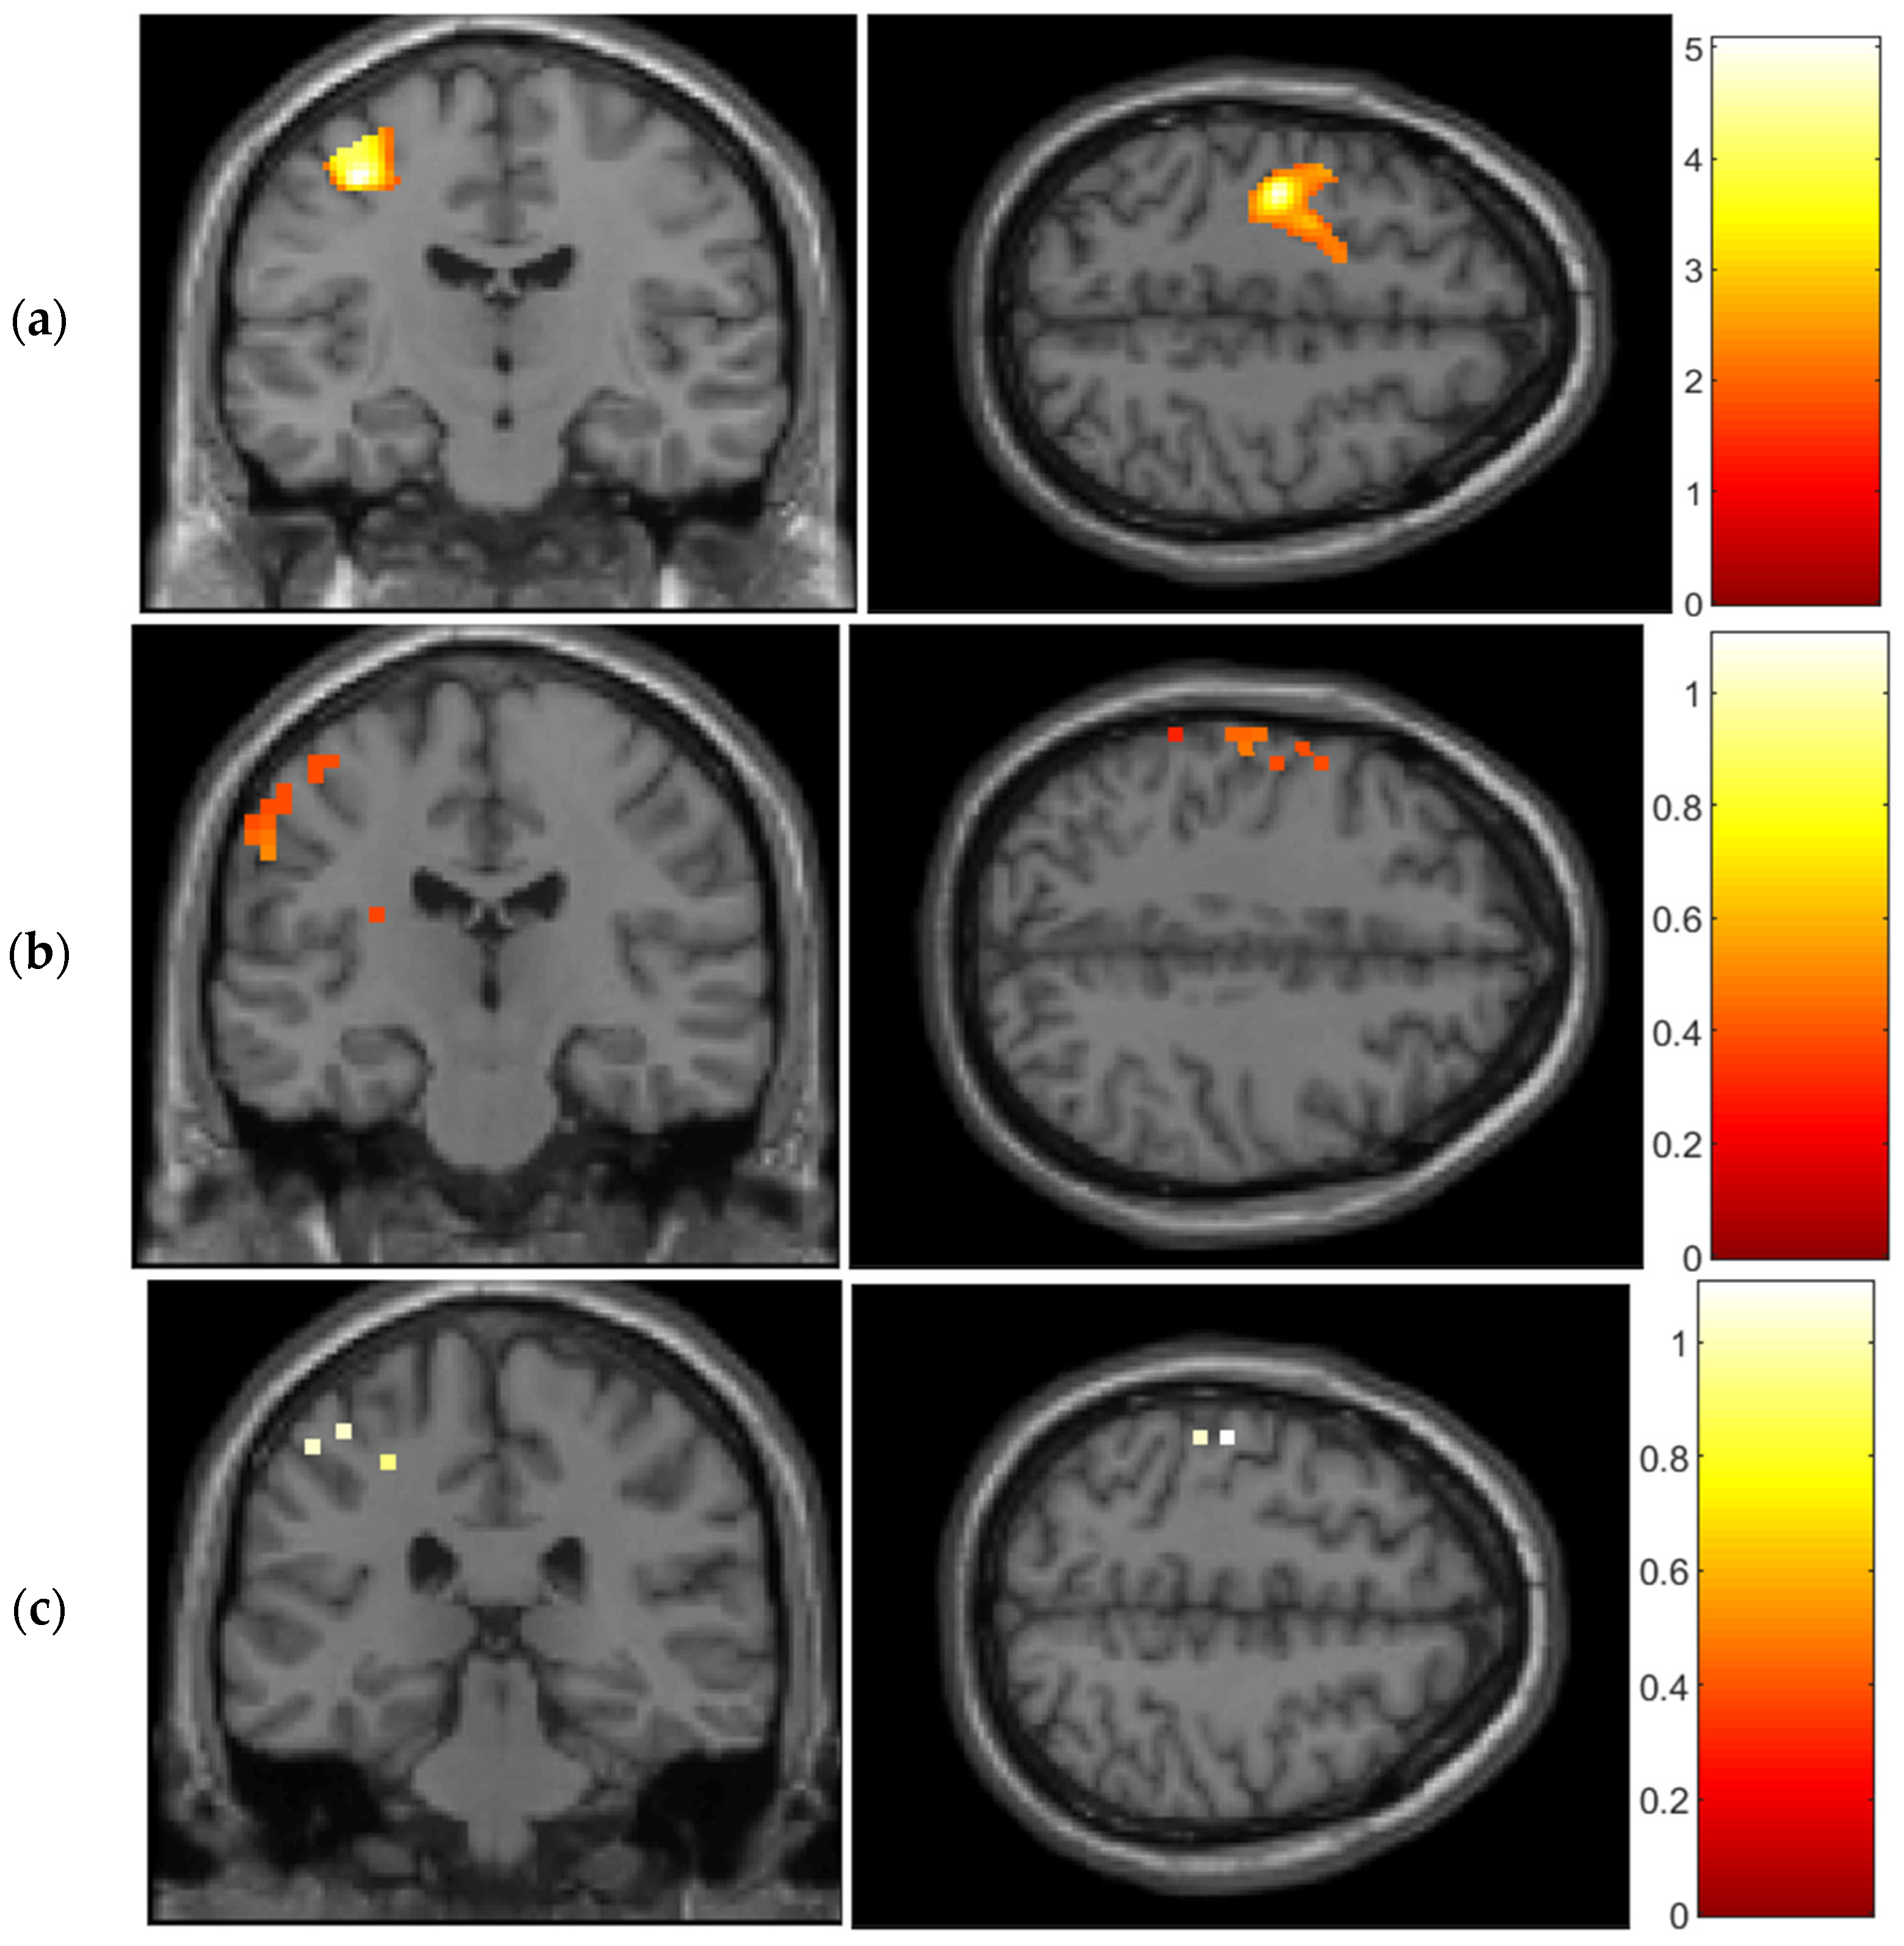
Unpredicted hemodynamic responses combined with event-related hemodynamic responses help to understand the high complexity of human brain function, reaching the highest spatial resolution for loci at the gyri level. Figure 3 shows t-maps calculated on functional-ROI corresponding to BOLD (FWER-threshold p < 0.05, (Peak MNI coordinates: −36; −16; 52)), HbO (FWER-threshold p < 0.05, (Peak MNI coordinates: −43; −34; 57)) and HbR (FWER-threshold p < 0.05, (Peak MNI coordinates: −39; −34; 61)) signals in coronal and axial views on the contralateral side.
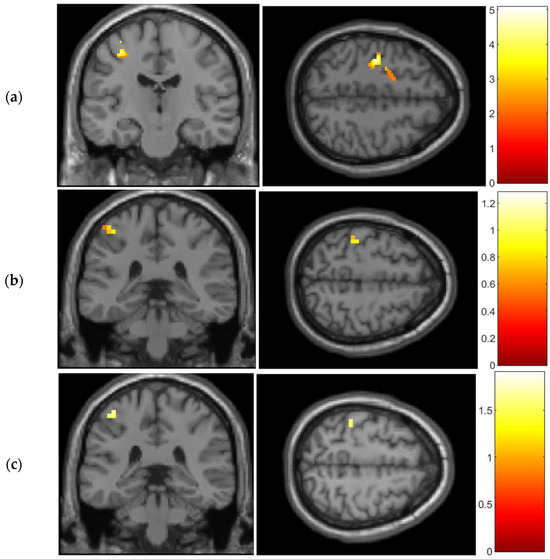
Figure 3.
The T-contrast maps of cerebral activation using functional-ROI for the motor execution > rest contrast measured by the fMRI and DOT devices in a subject group (N = 9) for (a) BOLD, (b) HBO and (c) HbR signals in coronal and axial views. All results were mapped onto a standard space (MNI). FWER-threshold p < 0.05 at the voxel level for all signals. The color bar depicts the signal changes.
3.3. Comparison Structural and Functional-ROI
3.3.1. Frequency Domain Analysis
Functional-ROIs analysis relies on assessing the temporal homogeneity of a voxel and its neighboring voxels independent of the hemodynamic model employed by the GLM. Consequently, the signal dynamics of these voxels were analyzed using both structural and functional-ROIs for all signals. Figure 4 shows a frequency analysis revealing a main peak at 0.03 Hz (corresponding to the task which lasted 16 s) and well represented by GLM analysis. However, the magnitude of task frequency (0.03) is also increased in the GLM analysis when the functional-ROI is applied (max 0.35) (Figure 4b) in contrast to the structural-ROI GLM analysis (max 0.2) (Figure 4a). A higher magnitude indicates stronger neural activity in the area being measured. A structural-ROI covers a broader anatomical region in the brain and does not distinguish between specific functional areas, encompassing all the voxels within that anatomical zone. In contrast, a functional-ROI is more targeted, containing only the voxels actively engaged in the task. The strong correlation between the functional-ROI and neural activity indicates its precise representation and capture of neural processes.
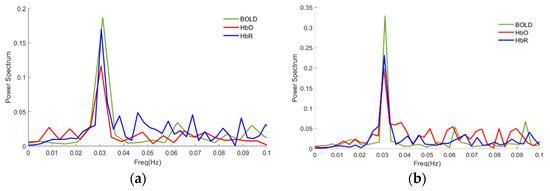
Figure 4.
Power spectrum for the time series of BOLD (green lines); HbO (red lines); HbR (blue lines) signals in the cerebral activation maps generated by (a) GLM using structural-ROI, (b) GLM using functional-ROI. Vertical axis: Normalized Power Spectrum; Horizontal axis: Frequency (Hz).
3.3.2. Images Analysis
Figure 5 shows that the optical imaging combined with the utilization of a functional-ROI is capable of detecting subtle variations in the lateral distribution of activation foci. Moreover, these brain regions are situated within deep sulcal structures, posing challenges for optical approaches to access them. The loci distributions for both the GLM using a structural-ROI and GLM using a functional-ROI results are along the sensorimotor and motor cortices.
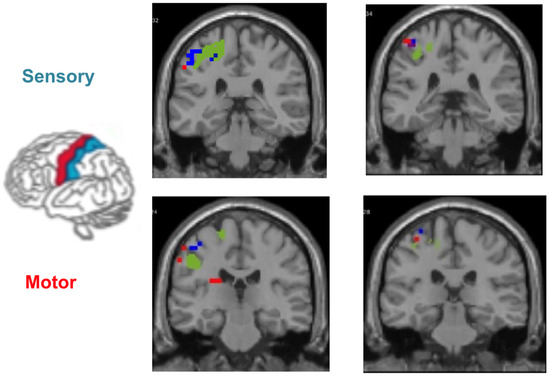
Figure 5.
T-contrast maps measured by DOT and fMRI devices in a subject group (N = 9) on the left hemisphere localized on the postcentral gyri (upper figure) and the precentral gyri (bottom figure). All results were mapped onto a standard space (MNI) and statistically analyzed by GLM using a structural-ROI (left images) and GLM using a functional-ROI (right images). FWER threshold p < 0.05 at the voxel level for motor execution > rest contrast. BOLD (green), HbR (blue) and HbO (red) signals are displayed in coronal view.
Although the activation patterns show the strongest qualitative similarities in both methods, consistent differences worth mentioning were also observed. GLM using functional-ROI shows the major number of voxels distributed across the postcentral gyri (BA1, BA2 and BA3), which covers the primary somatosensory cortex for DOT and fMRI measurements. This fact matches prior studies in fMRI during finger tapping, which showed higher regional homogeneity in the sensory cortex than in the motor cortex itself [17]. The premovement sensory cortex shows a slight delay in encoding information about the impending activity of the forelimb muscles compared to the motor cortex. As a result, the sensory cortex receives information regarding motor output before the arrival of sensory feedback signals. This suggests that sensory processing engages in the real-time processing of somatosensory signals through interactions with anticipatory information [18].
4. Discussion
Finger-tapping tasks are widely utilized in neuroimaging studies to investigate somatosensory and motor functions. This choice is primarily due to the higher amplitude of cerebral activations observed during finger tapping compared to other paradigms, such as cognitive tasks. Additionally, the spatial distribution of cerebral activations elicited by finger tapping is well established and reproducible.
Firstly, creating a functional-ROI, in contrast to using structural-ROI, is based on anatomy to mask the background signals that are mixed with external layers (skull and scalp). The results presented here demonstrate that applying functional-ROI to DOT volumes enables the attainment of precise cerebral activation information at the level of the gyri. This approach effectively eliminates extracerebral signals and does not rely on structural anatomy, which can be particularly challenging in situations where MRI devices are unavailable. A functional-ROI analysis may reveal shared neurovascular coupling mechanisms involved in both synchronized spontaneous and task-related activities. Here, we demonstrate the strong reliability of functional-ROI analysis when applied to DOT volumes by comparing it with fMRI volumes.
As we expected, the outcomes obtained from the GLM analysis using a structural-ROI (Figure 1) align with previous research conducted on both fMRI and DOT datasets [4]. These studies have specifically focused on the sensory-motor cortices, namely the pre- and postcentral gyri. Furthermore, the functional-ROI analysis (Figure A2) also aligns with previous fMRI studies [17,19] that have investigated sensorimotor areas during finger movements.
Secondly, the results obtained from the GLM analysis using a functional-ROI reveal detailed cortical activation patterns in the pericentral motor and somatosensory cortices during task performance (Figure 5). Previous fMRI studies have demonstrated that these functional maps bear striking similarity to Penfield’s electrophysiological maps, suggesting that non-invasive techniques can access the homuncular organization in healthy adults [20,21]. The findings presented in this study validate similar approaches utilizing high-density optical imaging [18]. By combining a functional-ROI approach with a model-driven analysis (GLM), it becomes possible to accurately localize major cerebral activations in the pre- and postcentral gyri across a group of subjects while they perform contralateral movements, using both neuroimaging technologies. This methodology yields a spatial distribution of activations that aligns with the anatomical homuncular organization in the pre- and postcentral gyri. It is important to note that in this study, individual finger movements cannot be distinguished. However, the results demonstrate the spatial localization of general finger movements, which is consistent with a recent study presenting an integrated-isolate model of action and motor control [22].
A notable inconsistency in this study is the dissimilarity in spatial distribution patterns between DOT and fMRI, which exhibit differences in voxel activation. These inconsistencies in hemodynamic behavior are explained by the neurovascular coupling. Initially, when neuronal activity begins, there is an increase in HbR due to the initial consumption [23] of oxygen. If neuronal activity persists, it triggers a vasodilation process [24], during which HbR is washed out by the arrival of oxygenated blood from the broader vasodilation occurring in neighboring regions. It is worth noting that both DOT and fMRI techniques measure hemodynamic changes but do so using different signals or sampling rates. Moreover, in this scenario, the issue might arise due to the utilization of a standardized finite element (FE) mesh. The employment of a generic head model for the forward light modeling could necessitate the alignment of subject-specific MR anatomy with the head model’s MR anatomy to pinpoint the optodes’ positions accurately. This process may result in diminished spatial accuracy of the derived activation foci due to variations in brain structures and the thickness of extracerebral tissue.
Finally, DOT is an imaging technique specialized in providing detailed insights into tissue composition, including parameters such as oxygenation and variations in chromophore concentrations like HbO and HbR. However, it should be noted that DOT does not inherently offer direct information about blood flow dynamics, which is a capability of Speckle Contrast Optical Tomography (SCOT) [25]. Although both SCOT and DOT fall within the realm of optical imaging, they serve distinct purposes. SCOT is engineered for the real-time monitoring of blood flow and perfusion, making it the method of choice for applications where dynamic vascular assessments are paramount [26]. Conversely, DOT is a versatile tool that excels in the comprehensive study of tissue composition, oxygenation levels, and a broad spectrum of physiological and pathological processes.
5. Conclusions
The fine-grained resolution of functional cortical activations presented here, along with several advantages such as non-invasiveness and safety, makes it suitable for specific clinical applications where other imaging methods may not be feasible. These applications include patients with medullary lesions, brain injuries, or muscle atrophy, allowing them to interact with their environment, especially during movements. Additionally, the potential applications of optical technology in monitoring hemodynamic changes for controlling robotic structures, particularly in the context of brain–computer interfaces (BCIs) and exoskeletons, are noteworthy. Moreover, this approach can provide valuable insights, particularly when animal models are employed to test and develop new technologies. Animal models may have limited access to neuroimaging tools for creating structural anatomical ROIs, making functional-ROI based on neural synchronization a more accessible and convenient option when working with DOT technology. Considering the less invasive nature of optical technology compared to electrophysiological microarray implants, future research should prioritize the design of brain implants based on optical technology for recording inputs from the sensorimotor cortex.
Author Contributions
E.H.-M. conceptualization, data analysis. data interpretation and original draft preparation, C.d.D. project administration, E.H.-M., F.M. and O.P.-D. analyzed the data, C.d.D., F.M. and J.L.G.-M. conducted the experiment. E.H.-M., F.M. and J.L.G.-M. review and editing. All authors contributed to the final manuscript. All authors have read and agreed to the published version of the manuscript.
Funding
Co-funded regional financing with European Regional Development Funds (ERDF). Consejería de Economía y Empleo, Agencia Canaria de Investigación, Innovación y Sociedad de la Información. Ref: ProID2021010096, 2021–2023. European funding, Convocatoria para la Recualificación del Sistema Universitario Español; NextGenerationEU. European Regional Development Fund (MAC/1.1b/098); Cooperation Program Interreg MAC II (Madeira-Azores-Canarias) 2014–2020. Vicerrectorado de Investigacion, Transferencia y Campus de Santa Cruz en la convocatoria de expresiones de interés para proyectos dirigidos por noveles investigadores. Plan de incentivación de la actividad investigadora de la universidad de la laguna 2023.
Institutional Review Board Statement
The study was conducted in accordance with the Declaration of Helsinki and approved by the Ethics Committee of University of La Laguna (protocol code CEIBA2015-0153) for studies involving humans.
Informed Consent Statement
Informed consent was obtained from all subjects involved in the study.
Data Availability Statement
The data presented in this study are available on request from the corresponding author. The data are not publicly available due to [Human data under protection].
Acknowledgments
We express our sincere gratitude to the volunteers who generously participated in this study. We would also like to extend our thanks to Jose Maria Perez Gonzalez for his invaluable assistance with data acquisition. Additionally, we appreciate the English review and edits provided by Patrick Dennis.
Conflicts of Interest
The authors declare no conflict of interest.
Appendix A

Figure A1.
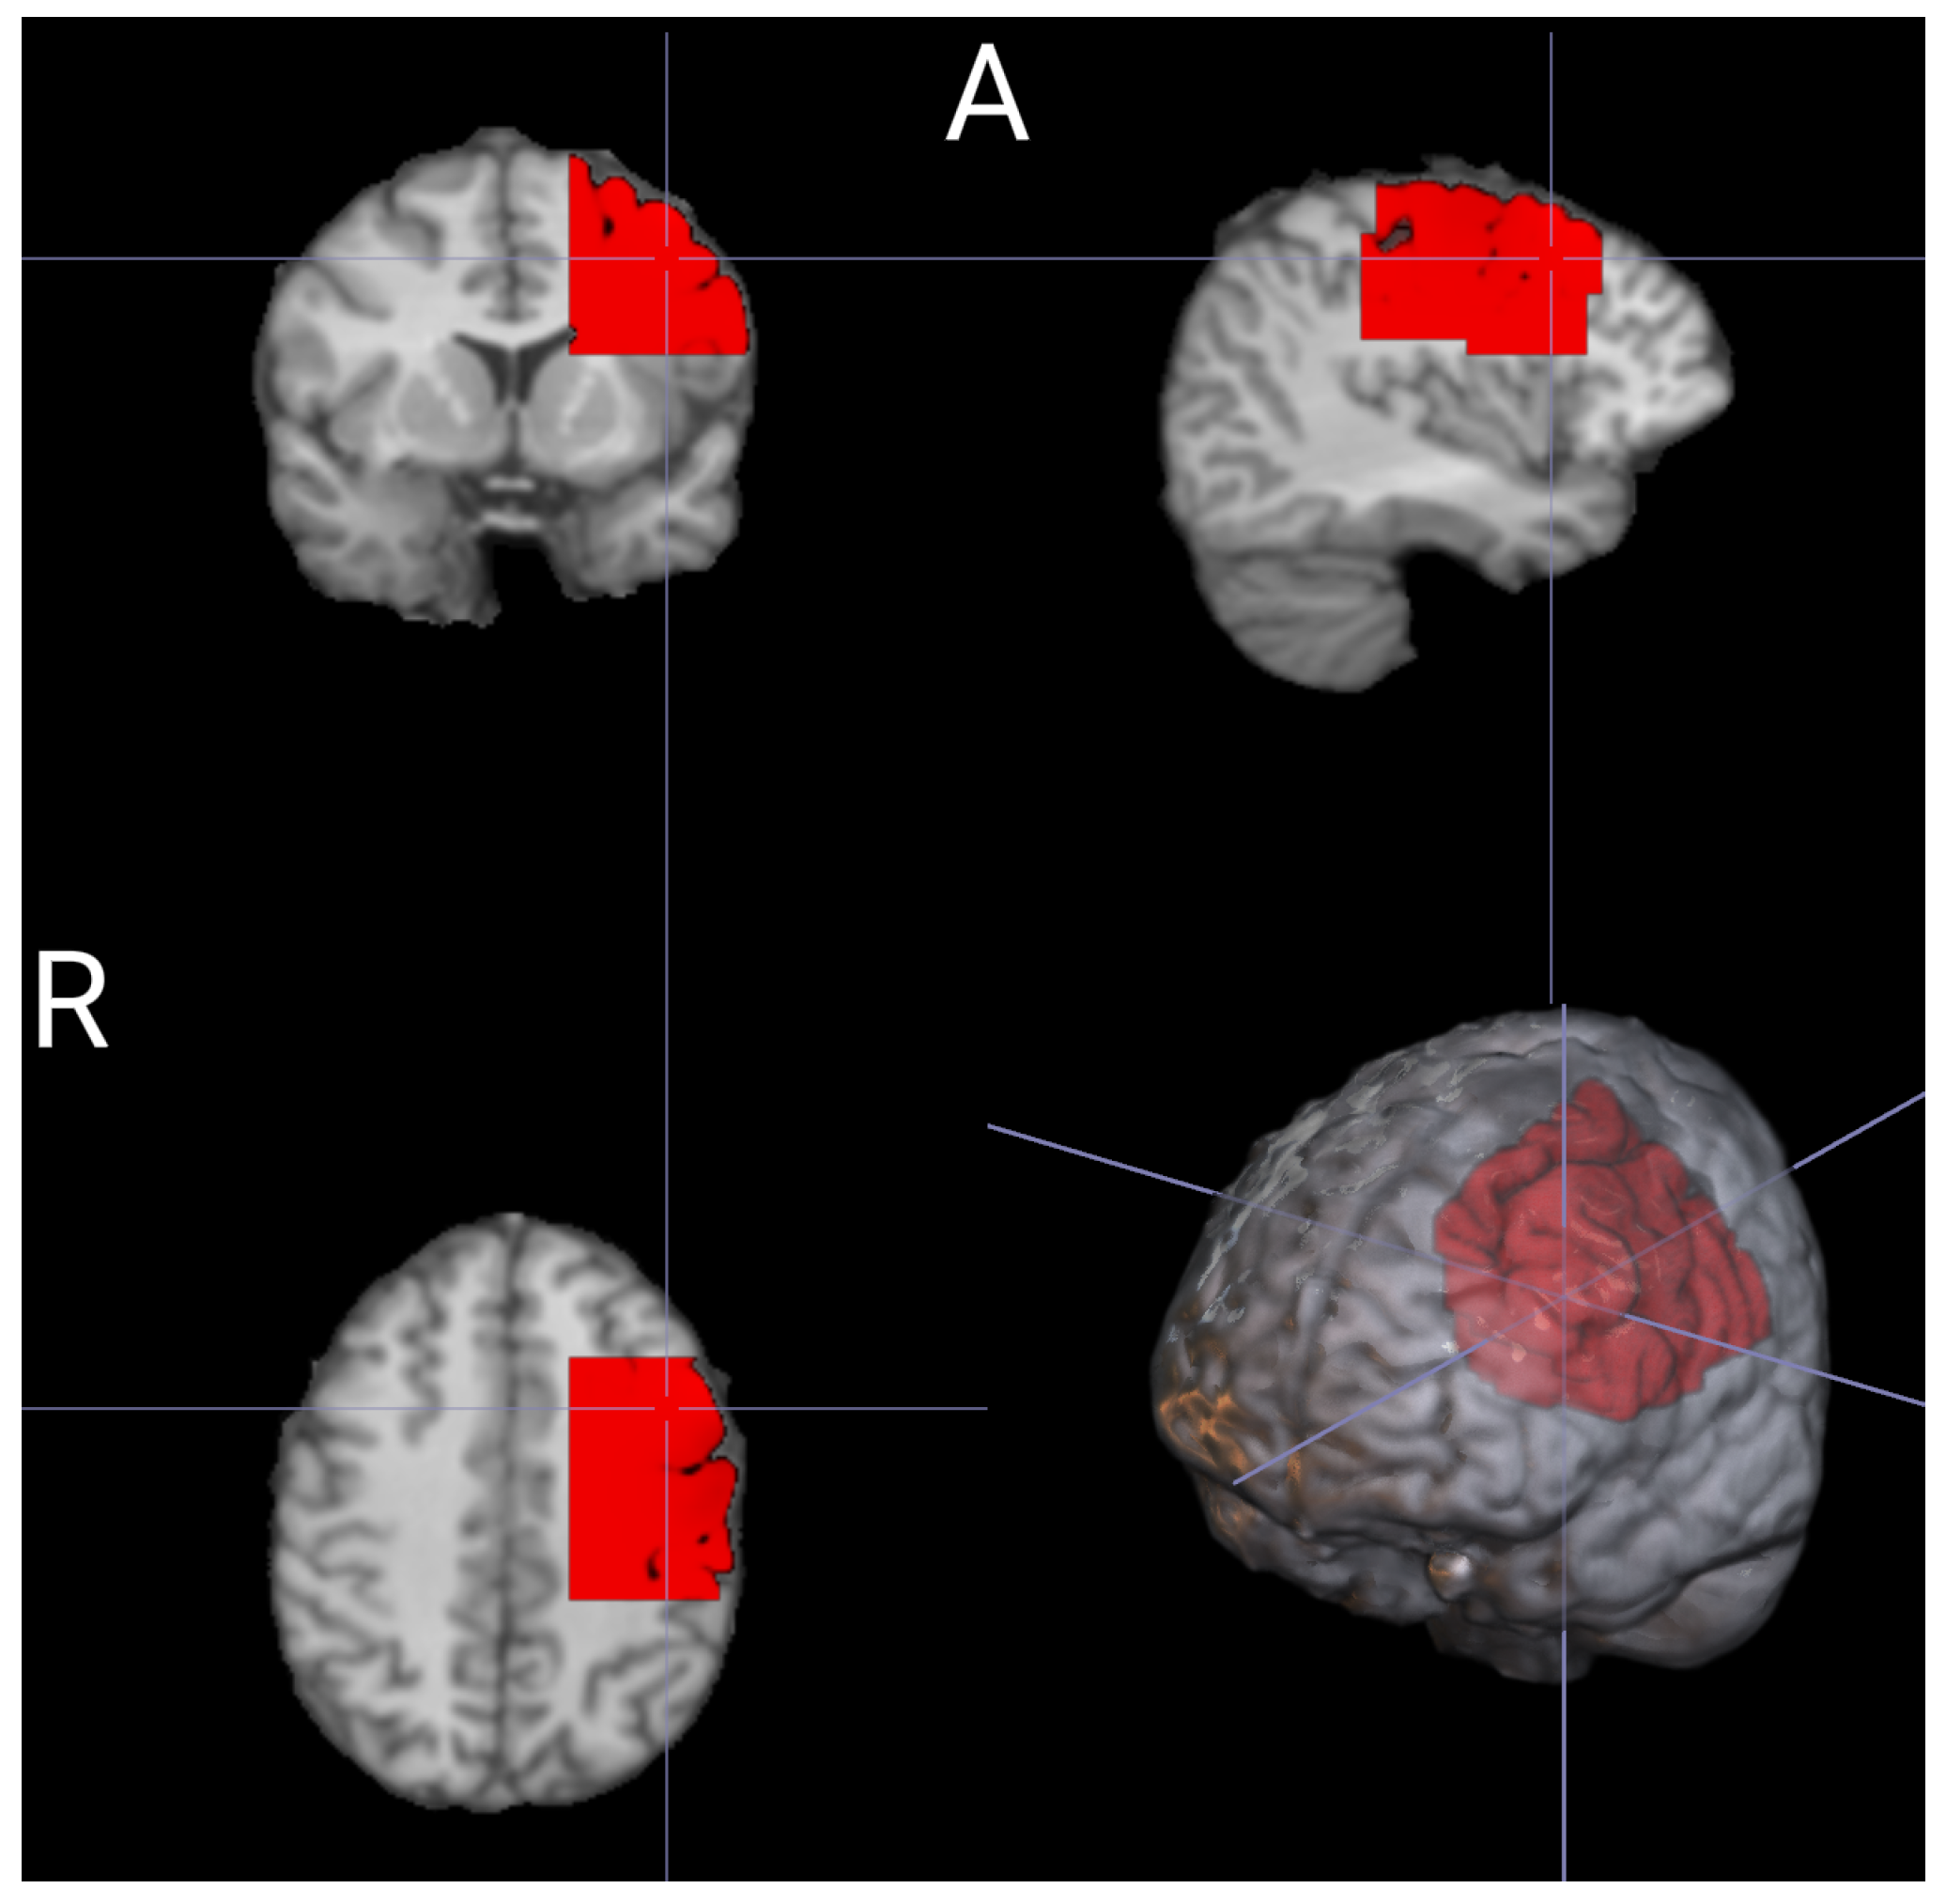
The structural-ROI (red) represents the selected submesh from the BrainModeler atlas in standard MNI space. This ROI encompasses the left pre- and post-sensorimotor and motor gyri, excluding external layers like the skull and scalp.
Figure A1.
The structural-ROI (red) represents the selected submesh from the BrainModeler atlas in standard MNI space. This ROI encompasses the left pre- and post-sensorimotor and motor gyri, excluding external layers like the skull and scalp.
Appendix B

Figure A2.
Unpredicted hemodynamic response. Statistical maps indicating t-test (FWER p < 0.001) results of the z-score of the amplitude of fluctuation differences for (a) BOLD; (b) HbO and (c) HbR signals for the group subjects (N = 9) during the contralateral finger movements in coronal and axial views. All results were mapped onto standard space (MNI).
References
- Hernandez-Martin, E.; Gonzalez-Mora, J.L. Diffuse optical tomography in the human brain: A briefly review from the neurophysiology to its applications. Brain Sci. Adv. 2020, 6, 289–305. [Google Scholar] [CrossRef]
- Hernandez-Martin, E.; Marcano, F.; Casanova, O.; Modroño, C.; Plata-Bello, J.; González-Mora, J.L. Comparing diffuse optical tomography and functional magnetic resonance imaging signals during a cognitive task: Pilot study. Neurophotonics 2017, 4, 015003. [Google Scholar] [CrossRef]
- Estefania, H.-M.; Cristian, M.; Niels, J.; Luis, G.-M.J. Does the diffuse optical tomography have more spatial sensitivity than fMRI to measure functional changes at cerebral gyri level? In Optics and the Brain; Optica Publishing Group: Washington, DC, USA, 2020; p. BM2C-4. [Google Scholar]
- Hernandez-Martin, E.; Marcano, F.; Modroño, C.; Janssen, N.; González-Mora, J.L. Diffuse optical tomography to measure functional changes during motor tasks: A motor imagery study. Biomed. Opt. Express 2020, 11, 6049–6067. [Google Scholar] [CrossRef] [PubMed]
- Haeussinger, F.B.; Dresler, T.; Heinzel, S.; Schecklmann, M.; Fallgatter, A.J.; Ehlis, A.-C. Reconstructing functional near-infrared spectroscopy (fNIRS) signals impaired by extra-cranial confounds: An easy-to-use filter method. Neuroimage 2014, 95, 69–79. [Google Scholar] [CrossRef] [PubMed]
- Virtanen, J.; Noponen, T.E.J.; Meriläinen, P. Comparison of principal and independent component analysis in removing extracerebral interference from near-infrared spectroscopy signals. J. Biomed. Opt. 2009, 14, 54032. [Google Scholar] [CrossRef] [PubMed]
- Poldrack, R.A. Region of interest analysis for fMRI. Soc. Cogn. Affect. Neurosci. 2007, 2, 67–70. [Google Scholar] [CrossRef] [PubMed]
- Ashburner, J.; Barnes, G.; Chen, C.-C.; Daunizeau, J.; Flandin, G.; Friston, K.; Kiebel, S.; Kilner, J.; Litvak, V.; Moran, R.; et al. SPM8 Manual Functional Imaging Laboratory; Wellcome Centre for Human Neuroimaging: London, UK, 2008. [Google Scholar]
- Klem, G.H.; Lüders, H.O.; Jasper, H.H.; Elger, C. The ten-twenty electrode system of the International Federation. Electroencephalogr. Clin. Neurophysiol. 1999, 52, 3–6. [Google Scholar]
- Hernandez-Martin, E.; Gonzalez-Mora, J.L. Diffuse Optical Tomography Using Bayesian Filtering in the Human Brain. Appl. Sci. 2020, 10, 3399. [Google Scholar] [CrossRef]
- Arridge, S.R.; Schweiger, M.; Hiraoka, M.; Delpy, D.T. A finite element approach for modeling photon transport in tissue. Med. Phys. 1993, 20, 299–309. [Google Scholar] [CrossRef]
- Pei, Y.; Graber, H.L.; Barbour, R.L. Influence of systematic errors in reference states on image quality and on stability of derived information for DC optical imaging. Appl. Opt. 2001, 40, 5755–5769. [Google Scholar] [CrossRef]
- Graber, H.L.; Chang, J.-H.; Lubowsky, J.; Aronson, R.; Barbour, R.L. Near-infrared absorption imaging of dense scattering media by steady-state diffusion tomography. In Proceedings of the Photon Migration and Imaging in Random Media and Tissues, Los Angeles, CA, USA, 17–22 January 1993; Volume 1888, pp. 372–387. [Google Scholar]
- Boas, D.A.; Dale, A.M. Simulation study of magnetic resonance imaging–guided cortically constrained diffuse optical tomography of human brain function. Appl. Opt. 2005, 44, 1957–1968. [Google Scholar] [CrossRef]
- Zang, Y.; Jiang, T.; Lu, Y.; He, Y.; Tian, L. Regional homogeneity approach to fMRI data analysis. Neuroimage 2004, 22, 394–400. [Google Scholar] [CrossRef]
- Kendall, M.G. Rank Correlation Methods; Griffin: Salisbury South, Australia, 1948. [Google Scholar]
- Lv, Y.; Margulies, D.S.; Villringer, A.; Zang, Y.-F. Effects of finger tapping frequency on regional homogeneity of sensorimotor cortex. PLoS ONE 2013, 8, e64115. [Google Scholar] [CrossRef]
- Koch, S.P.; Habermehl, C.; Mehnert, J.; Schmitz, C.H.; Holtze, S.; Villringer, A.; Steinbrink, J.; Obrig, H. High-resolution optical functional mapping of the human somatosensory cortex. Front. Neuroenergetics 2010, 2, 12. [Google Scholar] [CrossRef] [PubMed]
- Yuan, R.; Di, X.; Kim, E.H.; Barik, S.; Rypma, B.; Biswal, B.B. Regional homogeneity of resting-state fMRI contributes to both neurovascular and task activation variations. Magn. Reson. Imaging 2013, 31, 1492–1500. [Google Scholar] [CrossRef] [PubMed]
- Kurth, R.; Villringer, K.; Curio, G.; Wolf, K.J.; Krause, T.; Repenthin, J.; Schwiemann, J.; Deuchert, M.; Villringer, A. fMRI Shows Multiple Somatotopic Digit Representations in Human Primary Somatosensory Cortex. Neuroreport 2000, 11, 1487–1491. [Google Scholar] [CrossRef] [PubMed]
- Schweizer, R.; Voit, D.; Frahm, J. Finger representations in human primary somatosensory cortex as revealed by high-resolution functional MRI of tactile stimulation. Neuroimage 2008, 42, 28–35. [Google Scholar] [CrossRef] [PubMed]
- Gordon, E.M.; Chauvin, R.J.; Van, A.N.; Rajesh, A.; Nielsen, A.; Newbold, D.J.; Lynch, C.J.; Seider, N.A.; Krimmel, S.R.; Scheidter, K.M.; et al. A somato-cognitive action network alternates with effector regions in motor cortex. Nature 2023, 617, 351–359. [Google Scholar] [CrossRef] [PubMed]
- Bahar, S.; Suh, M.; Zhao, M.; Schwartz, T.H. Intrinsic optical signal imaging of neocortical seizures: The ‘epileptic dip’. Neuroreport 2006, 17, 499–503. [Google Scholar] [CrossRef]
- Tyler, C.W.; Likova, L.T.; Nicholas, S.C. Analysis of Neural-BOLD Coupling Through Four Models of the Neural Metabolic Demand. Front. Neurosci. 2015, 9, 419. [Google Scholar] [CrossRef]
- Varma, H.M.; Valdes, C.P.; Kristoffersen, A.K.; Culver, J.P.; Durduran, T. Speckle contrast optical tomography: A new method for deep tissue three-dimensional tomography of blood flow. Biomed. Opt. Express 2014, 5, 1275–1289. [Google Scholar] [CrossRef] [PubMed]
- Liao, L.-D.; Tsytsarev, V.; Delgado-Martínez, I.; Li, M.L.; Erzurumlu, R.; Vipin, A.; Orellana, J.; Lin, Y.R.; Lai, H.Y.; Chen, Y.Y.; et al. Neurovascular coupling: In vivo optical techniques for functional brain imaging. Biomed. Eng. Online 2013, 12, 38. [Google Scholar] [CrossRef] [PubMed]


Disclaimer/Publisher’s Note: The statements, opinions and data contained in all publications are solely those of the individual author(s) and contributor(s) and not of MDPI and/or the editor(s). MDPI and/or the editor(s) disclaim responsibility for any injury to people or property resulting from any ideas, methods, instructions or products referred to in the content. |
© 2023 by the authors. Licensee MDPI, Basel, Switzerland. This article is an open access article distributed under the terms and conditions of the Creative Commons Attribution (CC BY) license (https://creativecommons.org/licenses/by/4.0/).