
A Mathematical Morphological Network Fault Diagnosis Method for Rolling Bearings Based on Acoustic Array Signal


Abstract
:1. Introduction
2. Materials and Methods
2.1. Single-Scale Mathematical Morphology
2.2. Multi-Scale Mathematical Morphology
2.3. Multi-Scale Weight Fusion
2.4. Multiscale Mathematical Morphology Network
3. Results
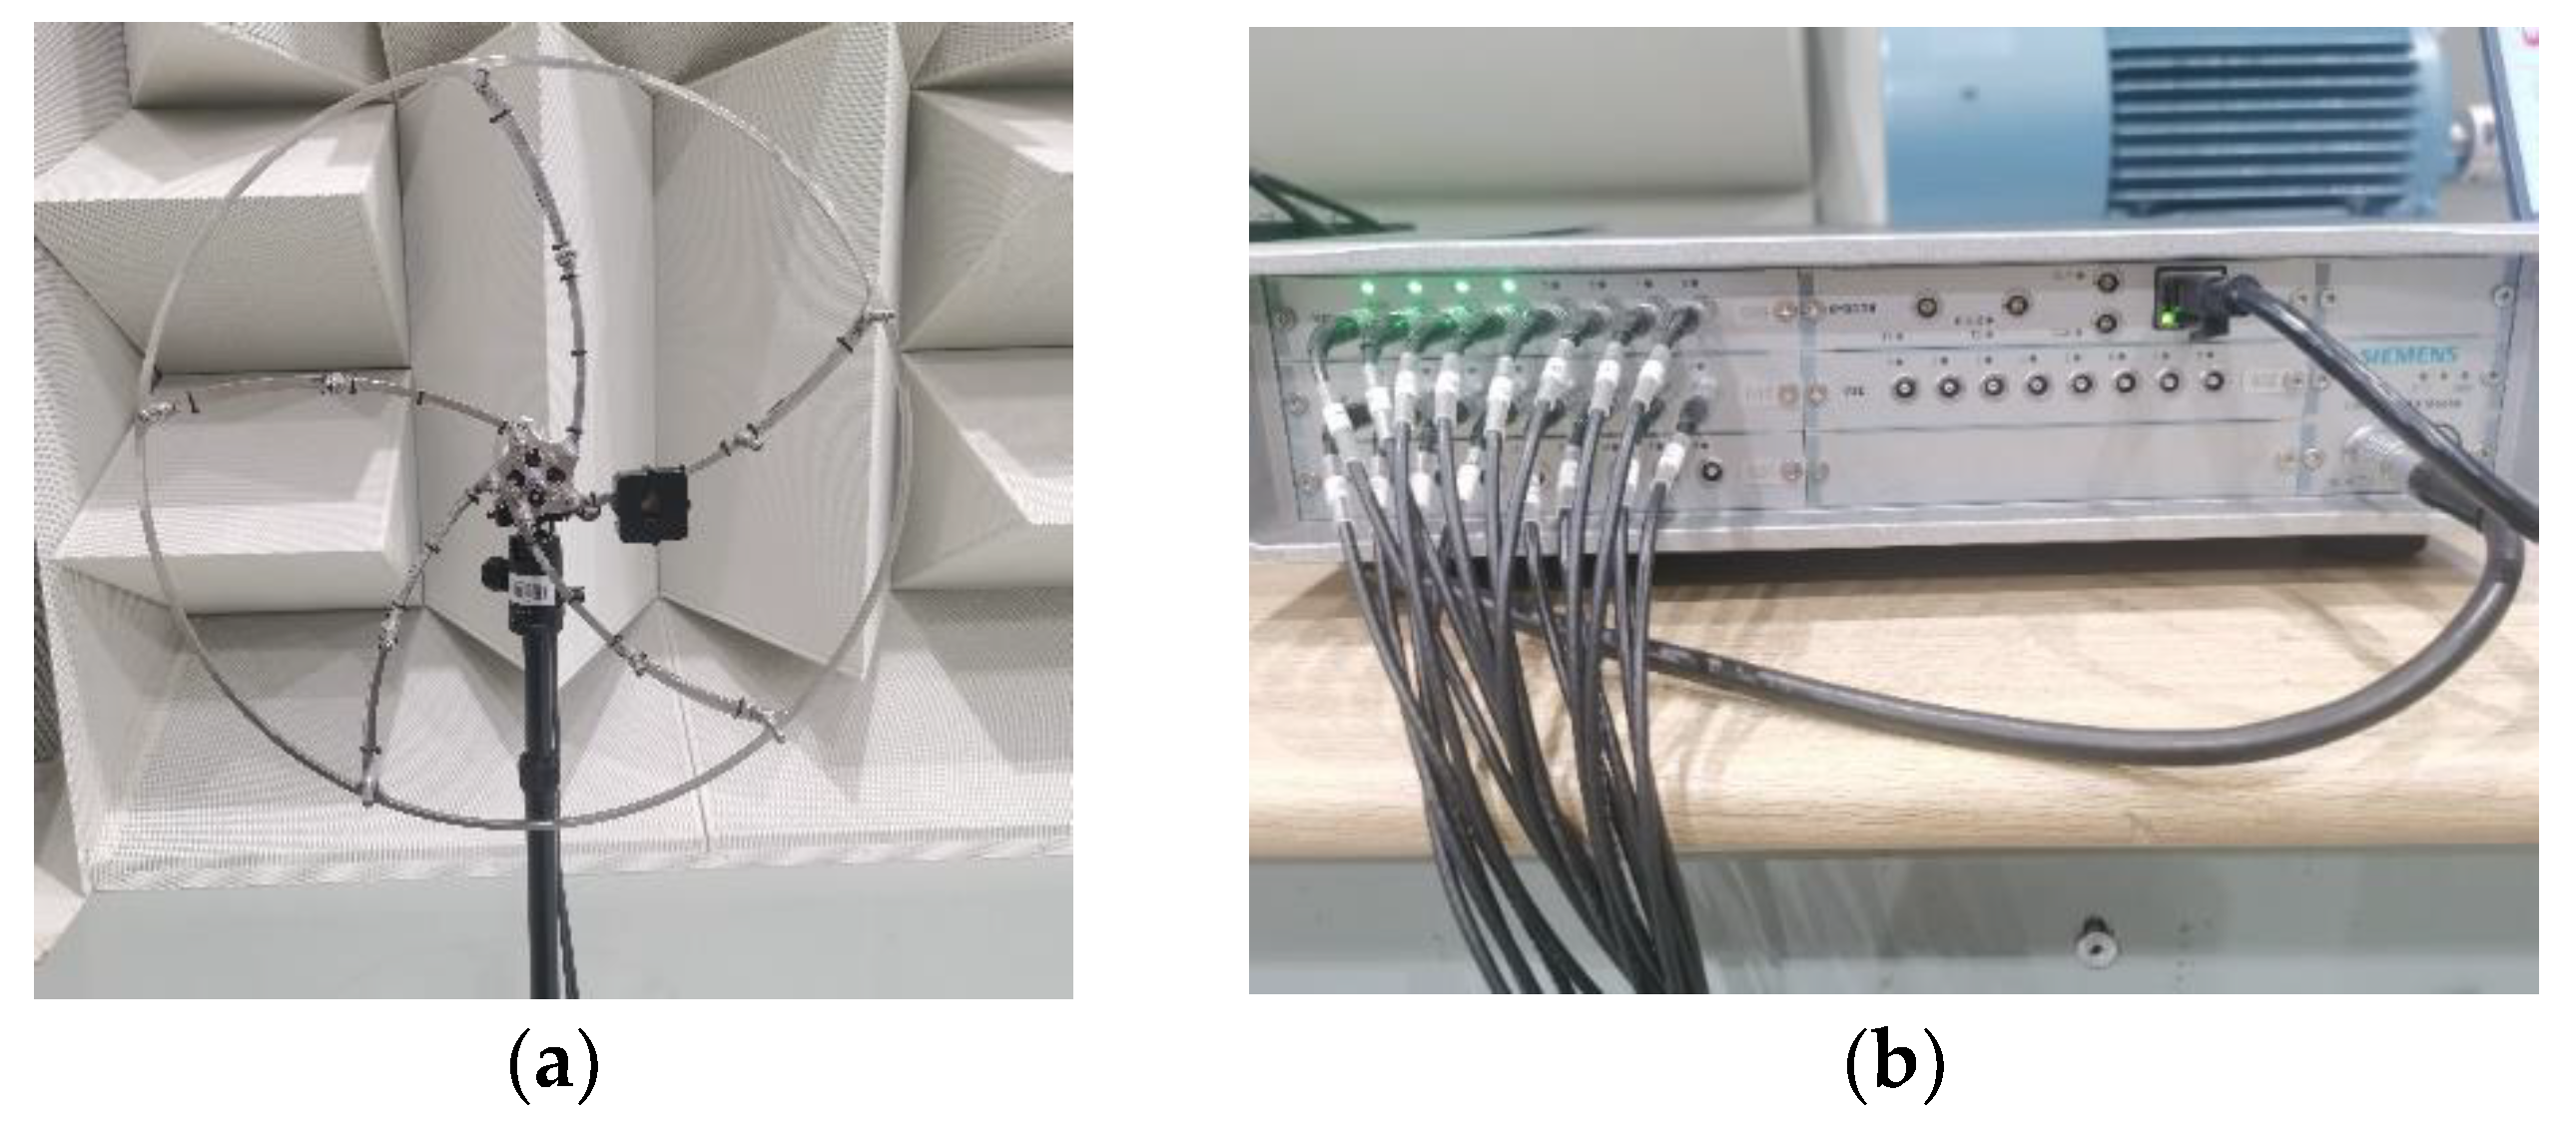
3.1. Experimental Introduction
3.2. Analysis Results
3.3. Comparison of Results with Other Methods
3.4. Experimental Analysis of Stability
4. Discussion and Conclusions
Author Contributions
Funding
Institutional Review Board Statement
Informed Consent Statement
Data Availability Statement
Acknowledgments
Conflicts of Interest
References
- Leaman, F.; Vicuna, C.M.; Clausen, E. A Review of Gear Fault Diagnosis of Planetary Gearboxes Using Acoustic Emissions. Acoust. Aust. 2021, 49, 265–272. [Google Scholar] [CrossRef]
- Liu, F.; Wu, R.; Teng, F.; Liu, Y.; Lu, S.; Ju, B.; Cao, Z. A Two-Stage Learning Model for Track-Side Acoustic Bearing Fault Diagnosis. IEEE Trans. Instrum. Meas. 2021, 70, 1–12. [Google Scholar] [CrossRef]
- Pacheco-Chérrez, J.; Fortoul-Díaz, J.A.; Cortés-Santacruz, F.; Aloso-Valerdi, L.M.; Ibarra-Zarate, D.I. Bearing fault detection with vibration and acoustic signals: Comparison among different machine leaning classification methods. Eng. Fail. Anal. 2022, 139, 106515. [Google Scholar] [CrossRef]
- Yuan, X.; Liu, H.; Zhang, H. Enhanced Rolling Bearing Fault Diagnosis Combining Novel Fluctuation Entropy Guided-VMD with Neighborhood Statistical Model. Appl. Sci. 2023, 13, 192. [Google Scholar] [CrossRef]
- He, C.; Shi, H.; Si, J.; Li, J. Physics-informed interpretable wavelet weight initialization and balanced dynamic adaptive threshold for intelligent fault diagnosis of rolling bearings. J. Manuf. Syst. 2023, 70, 579–592. [Google Scholar] [CrossRef]
- Xue, J.; Xu, H.; Liu, X.; Zhang, D.; Xu, Y. Application of enhanced empirical wavelet transform and correlation kurtosis in bearing fault diagnosis. Meas. Sci. Technol. 2022, 34, 035023. [Google Scholar] [CrossRef]
- Ding, S.; Rui, Z.; Lei, C.; Zhuo, J.; Shi, J.; Lv, X. A rolling bearing fault diagnosis method based on Markov transition field and multi-scale Runge-Kutta residual network. Meas. Sci. Technol. 2023, 34, 125150. [Google Scholar] [CrossRef]
- Xue, L.; Lei, C.; Jiao, M.; Shi, J.; Li, J. Rolling Bearing Fault Diagnosis Method Based on Self-Calibrated Coordinate Attention Mechanism and Multi-Scale Convolutional Neural Network Under Small Samples. IEEE Sens. J. 2023, 23, 10206–10214. [Google Scholar] [CrossRef]
- Li, Y.; Zhou, J.; Li, H.; Meng, G.; Bian, J. A Fast and Adaptive Empirical Mode Decomposition Method and Its Application in Rolling Bearing Fault Diagnosis. IEEE Sens. J. 2023, 23, 567–576. [Google Scholar] [CrossRef]
- Xu, Y.; Li, Z.; Wang, S.; Li, W.; Sarkodie-Gyan, T.; Feng, S. A Hybrid Deep-Learning Model for Fault Diagnosis of Rolling Bearings. Measurement 2021, 169, 108502. [Google Scholar] [CrossRef]
- Wen, L.; Li, X.; Gao, L.; Zhang, Y. A New Convolutional Neural Network-Based Data-Driven Fault Diagnosis Method. IEEE Trans. Ind. Electron. 2017, 65, 5990–5998. [Google Scholar] [CrossRef]
- Ye, Z.; Yu, J. AKRNet: A novel convolutional neural network with attentive kernel residual learning for feature learning of gearbox vibration signals. Neurocomputing 2021, 447, 23–37. [Google Scholar] [CrossRef]
- Xu, Z.; Li, C.; Yang, Y. Fault diagnosis of rolling bearings using an Improved Multi-Scale Convolutional Neural Network with Feature Attention mechanism. ISA Trans. 2020, 110, 379–393. [Google Scholar] [CrossRef] [PubMed]
- Zhang, X.; Han, P.; Xu, L.; Zhang, F.; Wang, Y.; Gao, L. Research on Bearing Fault Diagnosis of Wind Turbine Gearbox Based on 1DCNN-PSO-SVM. IEEE Access 2020, 8, 192248–192258. [Google Scholar] [CrossRef]
- Jiang, Q.; Bao, B.; Hou, X.; Huang, A.; Jiang, J.; Mao, Z. Feature Mining and Sensitivity Analysis with Adaptive Sparse Attention for Bearing Fault Diagnosis. Appl. Sci. 2023, 13, 718. [Google Scholar] [CrossRef]
- Wang, X.; Li, A.; Han, G. A Deep-Learning-Based Fault Diagnosis Method of Industrial Bearings Using Multi-Source Information. Appl. Sci. 2023, 13, 933. [Google Scholar] [CrossRef]
- Fu, S.; Wu, Y.; Wang, R.; Mao, M. A Bearing Fault Diagnosis Method Based on Wavelet Denoising and Machine Learning. Appl. Sci. 2023, 13, 5936. [Google Scholar] [CrossRef]
- Chen, R.; Tang, L.; Hu, X.; Wu, H. Fault Diagnosis Method of Low-Speed Rolling Bearing Based on Acoustic Emission Signal and Subspace Embedded Feature Distribution Alignment. IEEE Trans. Ind. Inform. 2021, 17, 5402–5410. [Google Scholar] [CrossRef]
- Brusa, E.; Delprete, C.; Di Maggio, L.G. Deep Transfer Learning for Machine Diagnosis: From Sound and Music Recognition to Bearing Fault Detection. Applied Sci. 2021, 11, 11663. [Google Scholar] [CrossRef]
- Chen, T.G.; Yu, D.J. A Novel Method for Enhanced Demodulation of Bearing Fault Signals Based on Acoustic Metamaterials. IEEE Trans. Ind. Inform. 2022, 18, 6857–6864. [Google Scholar] [CrossRef]
- Shi, H.; Li, Y.; Bai, X.; Zhang, K.; Sun, X. A two-stage sound-vibration signal fusion method for weak fault detection in rolling bearing systems. Mech. Syst. Signal Process. 2022, 172, 109012. [Google Scholar] [CrossRef]
- Glowacz, A.; Tadeusiewicz, R.; Legutko, S.; Caesarendra, W.; Irfan, M.; Liu, H.; Brumercik, F.; Gutten, M.; Sulowicz, M.; Daviu, J.A.A. Fault diagnosis of angle grinders and electric impact drills using acoustic signals. Appl. Acoust. 2021, 179, 108070. [Google Scholar] [CrossRef]
- He, S.; Hu, D.; Yu, G.; Liao, A.; Shi, W. Trackside acoustic detection of axle bearing fault using wavelet domain moving beamforming method. Appl. Acoust. 2022, 195, 108851. [Google Scholar] [CrossRef]
- Yan, X.; Liu, Y.; Jia, M. A Feature Selection Framework-Based Multiscale Morphological Analysis Algorithm for Fault Diagnosis of Rolling Element Bearing. IEEE Access 2019, 7, 123436–123452. [Google Scholar] [CrossRef]
- Li, Y.; Li, G.; Yang, Y.; Liang, X.; Xu, M. A fault diagnosis scheme for planetary gearboxes using adaptive multi-scale morphology filter and modified hierarchical permutation entropy. Mech. Syst. Signal Process. 2018, 105, 319–337. [Google Scholar] [CrossRef]
- Deng, F.; Yang, S.; Tang, G.; Hao, R.; Zhang, M. Self adaptive multi-scale morphology AVG-Hat filter and its application to fault feature extraction for wheel bearing. Meas. Sci. Technol. 2017, 28, 045011. [Google Scholar] [CrossRef]
- Feng, Y.; Lu, B.; Zhang, D. Multiscale morphological manifold for rolling bearing fault diagnosis. Proc. Inst. Mech. Eng. Part C: J. Mech. Eng. Sci. 2016, 231, 3516–3529. [Google Scholar] [CrossRef]
- Lv, J.; Yu, J. Average combination difference morphological filters for fault feature extraction of bearing. Mech. Syst. Signal Process. 2018, 100, 827–845. [Google Scholar] [CrossRef]
- Li, Y.; Liang, X.; Zuo, M.J. A new strategy of using a time-varying structure element for mathematical morphological filtering. Measurement 2017, 106, 53–65. [Google Scholar] [CrossRef]
- Chen, Z.; Gao, N.; Sun, W.; Chen, Q.; Yan, F.; Zhang, X.; Iftikhar, M.; Liu, S.; Ren, Z. A Signal Based Triangular Structuring Element for Mathematical Morphological Analysis and Its Application in Rolling Element Bearing Fault Diagnosis. Shock. Vib. 2014, 2014, 590875. [Google Scholar] [CrossRef]
- Hu, Z.; Wang, C.; Zhu, J.; Liu, X.; Kong, F. Bearing fault diagnosis based on an improved morphological filter. Measurement 2016, 80, 163–178. [Google Scholar] [CrossRef]
- Li, B.; Zhang, P.L.; Wang, Z.J.; Mi, S.S.; Liu, D.S. A weighted multi-scale morphological gradient filter for rolling element bearing fault detection. ISA Trans. 2011, 50, 599–608. [Google Scholar] [CrossRef] [PubMed]
- Woo, S.; Park, J.; Lee, J.Y.; Kweon, I.S. CBAM: Convolutional Block Attention Module. In Proceedings of the European Conference on Computer Vision (ECCV), Munich, Germany, 8–14 September 2018; pp. 3–19. [Google Scholar]
- He, K.; Zhang, X.; Ren, S.; Sun, J. Deep Residual Learning for Image Recognition. In Proceedings of the 2016 IEEE Conference on computer vision and pattern recognition (CVPR), Las Vegas, NV, USA, 27–30 June 2016; pp. 770–778. [Google Scholar]
- Vulli, A.; Srinivasu, P.N.; Sashank, M.S.K.; Shafi, J.; Choi, J.; Ijaz, M.F. Fine-Tuned DenseNet-169 for Breast Cancer Metastasis Prediction Using FastAI and 1-Cycle Policy. Sensors 2022, 22, 2988. [Google Scholar] [CrossRef] [PubMed]
- Wan, L.; Chen, Y.; Li, H.; Li, C. Rolling-Element Bearing Fault Diagnosis Using Improved LeNet-5 Network. Sensors 2020, 20, 1693. [Google Scholar] [CrossRef]


| Structural Parameter | Parameter Value | Structural Parameter | Parameter Value |
|---|---|---|---|
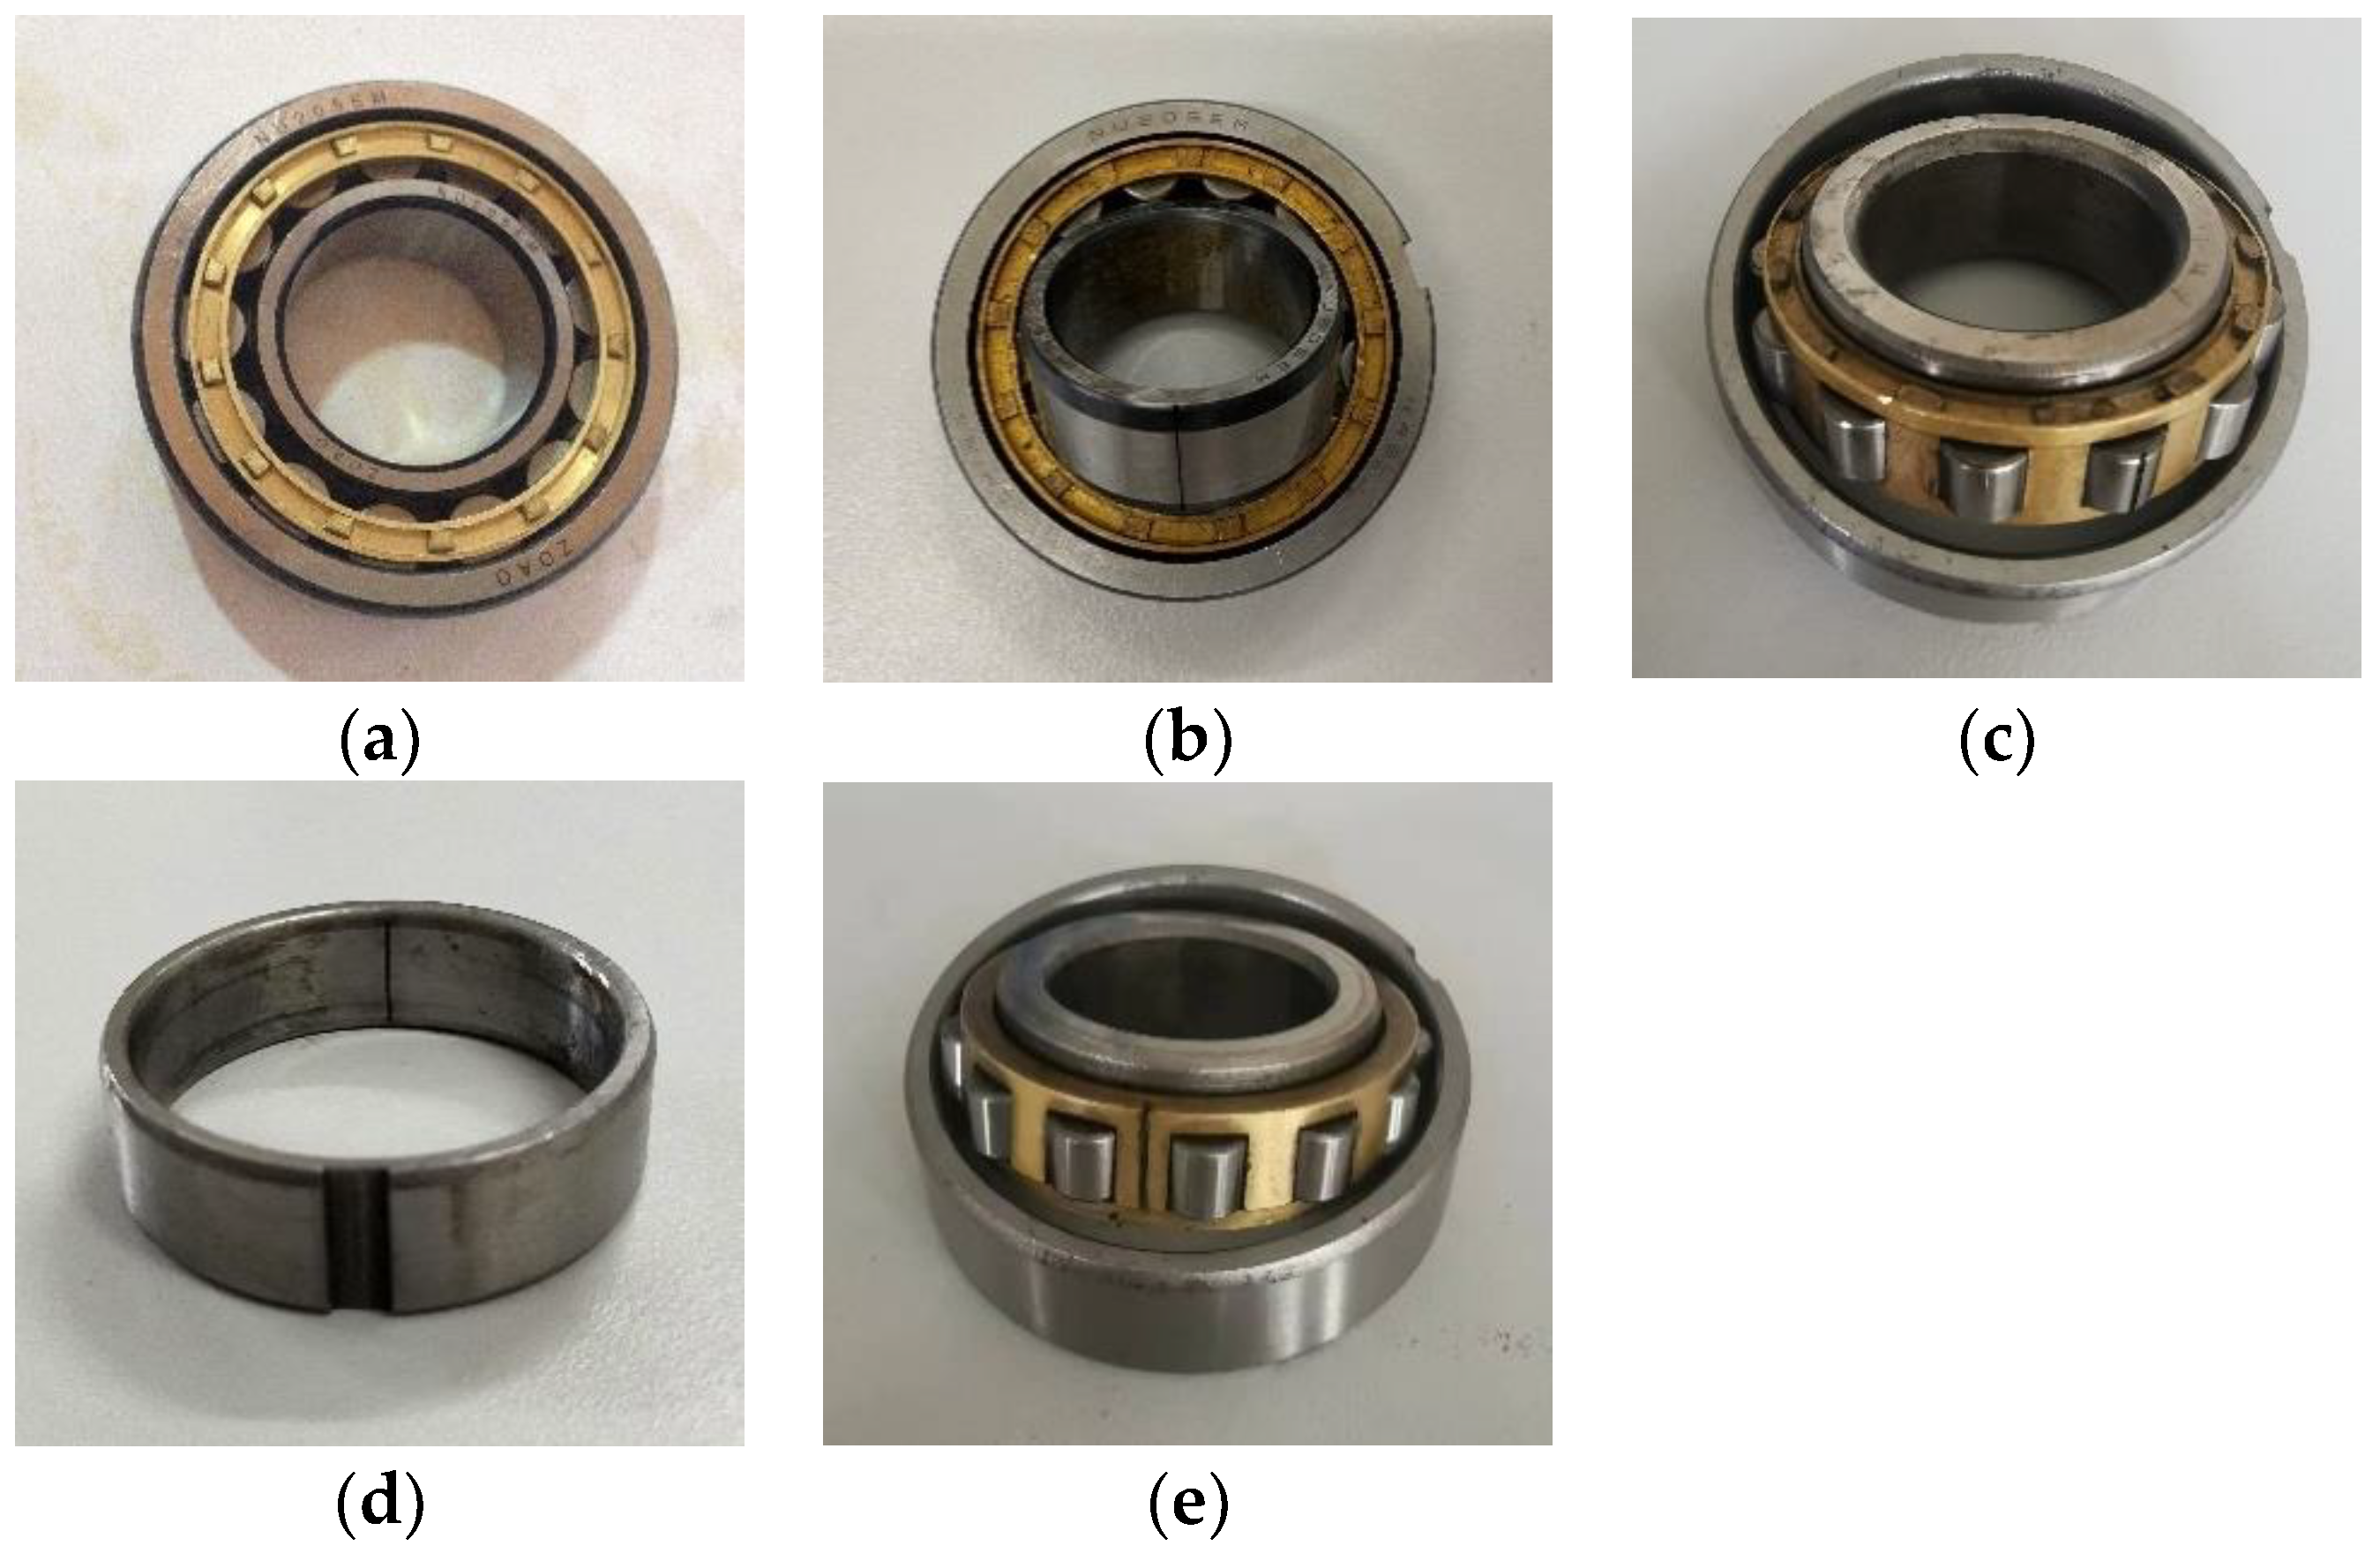
| Bearing type | NU205 | Contact angle | 0° |
| Inside diameter | 25 mm | The number of roller | 13 |
| Pitch diameter | 43.8 mm | Outside diameter | 52 mm |
| Bearing Condition | Working Speed (r/min) | Training/Testing Sample Size | Label |
|---|---|---|---|
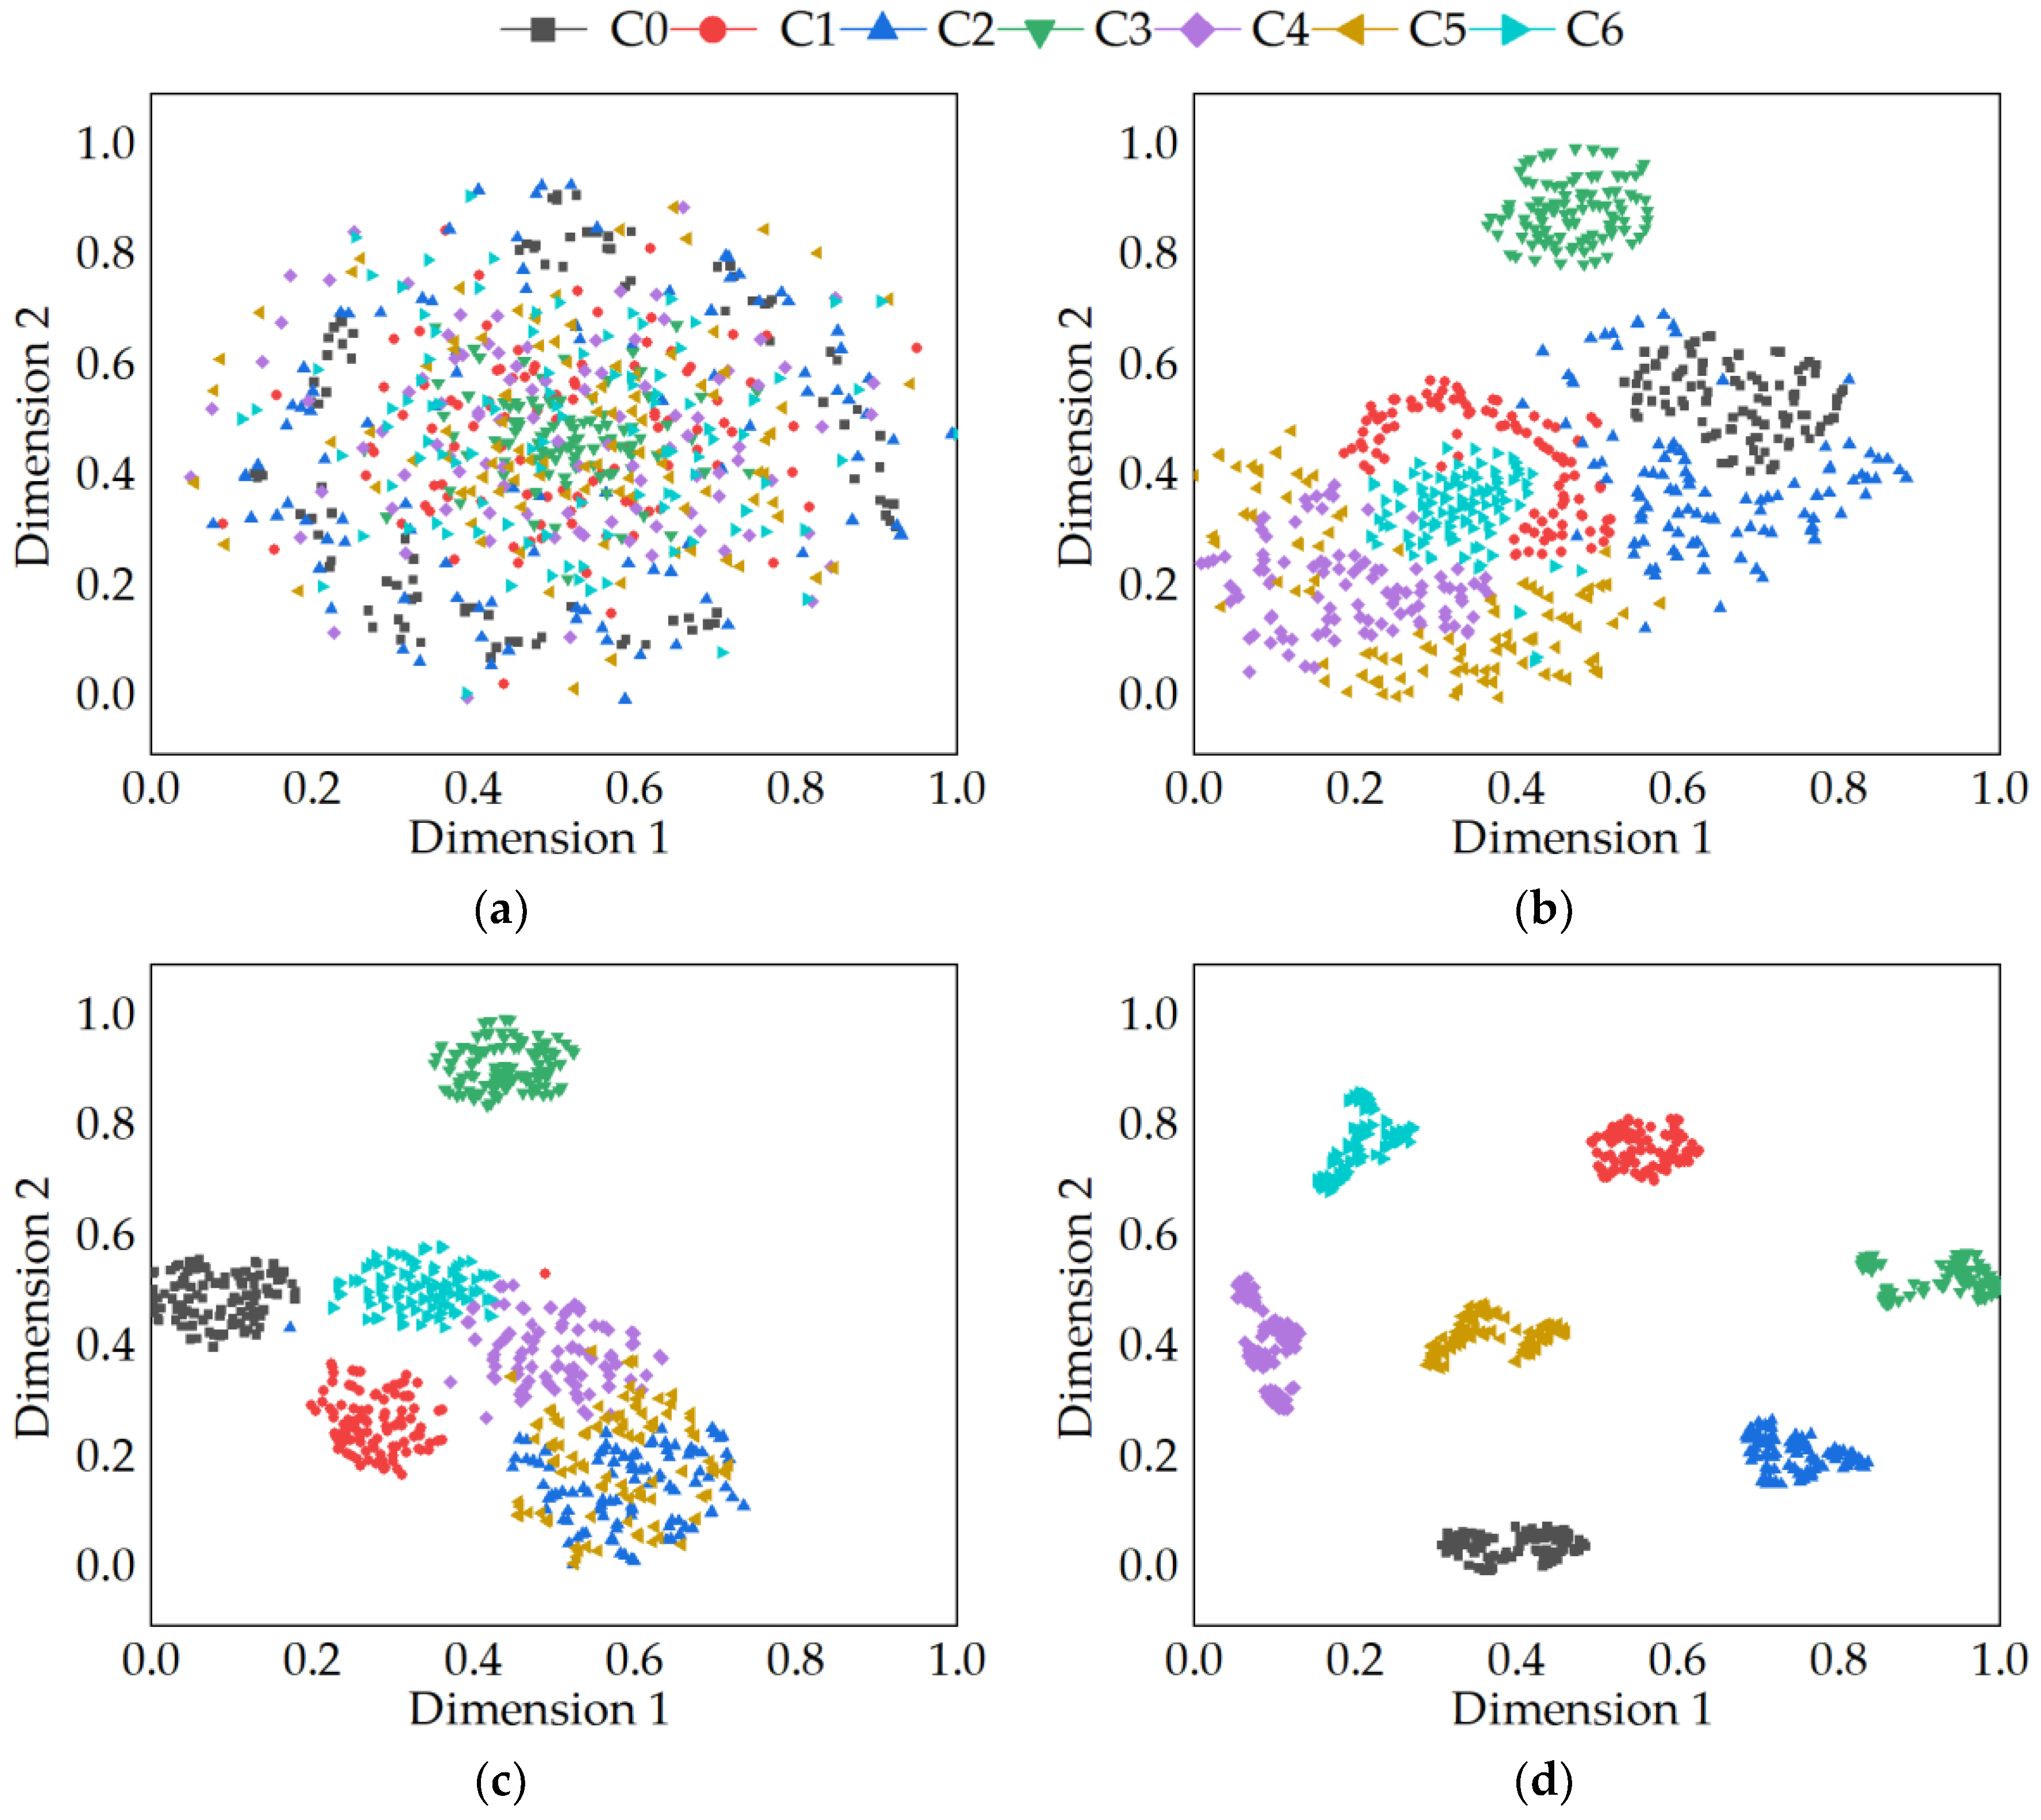
| Normal bearings | 980 | 400/200 | C0 |
| Outer fault | 980 | 400/200 | C1 |
| Inner fault | 980 | 400/200 | C2 |
| Ball fault | 980 | 400/200 | C3 |
| Cage fault | 980 | 400/200 | C4 |
| Compound fault of inner and outer | 980 | 400/200 | C5 |
| Compound fault of outer and cage | 980 | 400/200 | C6 |
| Type of Layer | Parameter | Output Size |
|---|---|---|
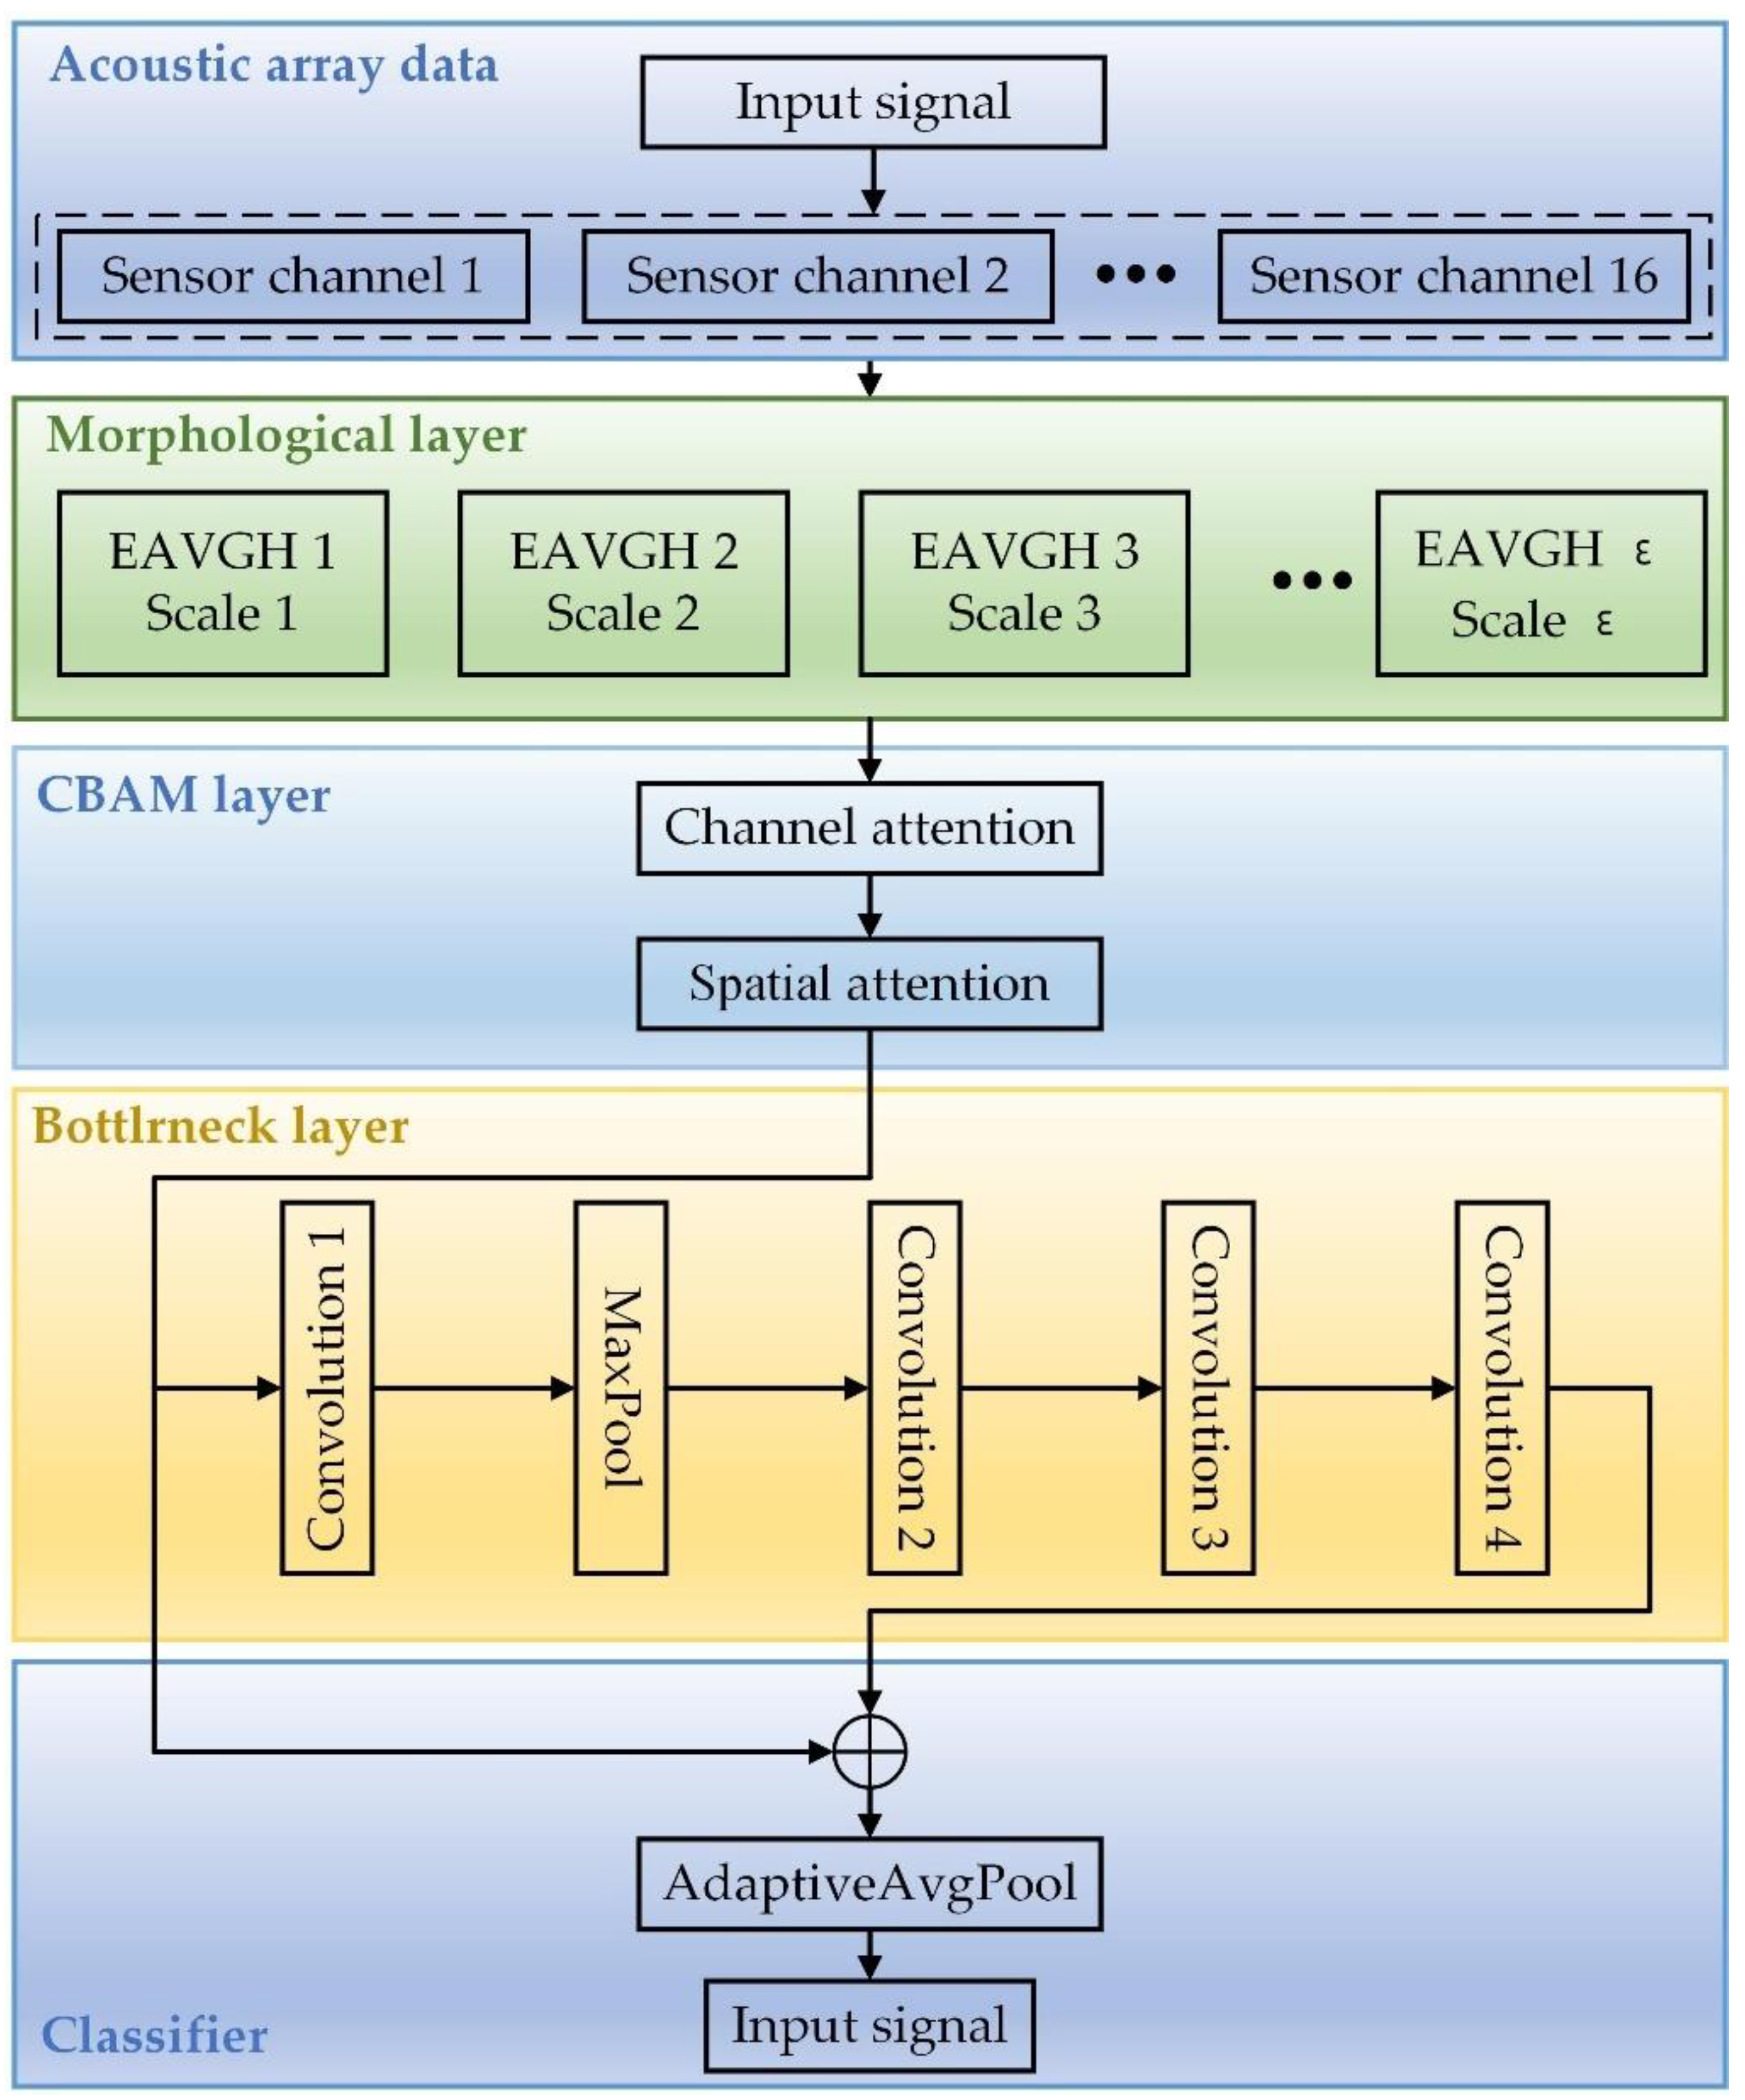
| Input layer | - | 16 |
| Morphological layer | λ1, λ2, λ3, λ4 | 64 |
| Channel attention | Avg-pool/max-pool | 64 |
| Spatial attention | Avg-pool/max-pool | 64 |
| Conv1 | kernel = 7, stride = 2, dilation = 3 | 128 |
| MaxPool | kernel = 3, stride = 2, dilation = 1 | 128 |
| Bottlrneck | ||
| Conv2 | kernel = 1, stride = 2 | 128 |
| Conv3 | kernel = 3, stride = 1, padding = 1 | 128 |
| Conv4 | kernel = 1, stride = 1 | 256 |
| AdaptiveAvgPool1d | - | 256 |
| Classifier | 256-7 | 7 |
| Models | Parameters |
|---|---|
| LeNet-5 | 2 × (Conv-Pool)-2 × fc-Classifier |
| ResNet | 2 × [Conv-Pool]-1 × Res-Pool-Classifier |
| DenseNet | 2 × [Conv-Pool]-2 × Den-Pool-Classifier |
| 1st | 2nd | 3rd | 4th | 5th | Average | Total Time | |
|---|---|---|---|---|---|---|---|
| ResNet | 92.7 | 93.1 | 93.5 | 94.0 | 94.9 | 93.64 | 28.87 s |
| DenseNet | 97.2 | 94.5 | 92.1 | 96.5 | 97.4 | 95.54 | 92.07 s |
| LeNet-5 | 88.0 | 80.7 | 87.4 | 88.8 | 78.1 | 84.60 | 28.67 s |
| Proposed method | 98.7 | 98.0 | 98.1 | 98.8 | 99.2 | 98.56 | 22.97 s |
| Scale | Method | 1st | 2nd | 3rd | 4th | 5th | Average |
|---|---|---|---|---|---|---|---|
| 10% | ResNet | 89.2 | 88.7 | 87.9 | 90.8 | 87.5 | 88.82 |
| DenseNet | 72.2 | 74.5 | 75.6 | 74.5 | 78.5 | 75.06 | |
| LeNet-5 | 74.7 | 78.4 | 74.7 | 75.7 | 77.3 | 76.16 | |
| Proposed method | 96.1 | 95.9 | 95.0 | 95.7 | 93.8 | 95.30 | |
| 30% | ResNet | 90.3 | 90.6 | 89.5 | 91.2 | 89.1 | 90.14 |
| DenseNet | 89.1 | 87.6 | 89.1 | 90.6 | 88.8 | 89.04 | |
| LeNet-5 | 80.1 | 77.6 | 74.3 | 76.6 | 72.1 | 76.14 | |
| Proposed method | 98.1 | 97.9 | 98.8 | 98.2 | 98.6 | 98.32 | |
| 50% | ResNet | 90.9 | 91.3 | 90.6 | 92.1 | 91.3 | 91.24 |
| DenseNet | 95.2 | 93.7 | 93.1 | 95.5 | 94.8 | 94.46 | |
| LeNet-5 | 86.9 | 85.2 | 83.8 | 87.1 | 80.1 | 84.62 | |
| Proposed method | 98.3 | 98.1 | 98.2 | 98.2 | 98.4 | 98.24 |
Disclaimer/Publisher’s Note: The statements, opinions and data contained in all publications are solely those of the individual author(s) and contributor(s) and not of MDPI and/or the editor(s). MDPI and/or the editor(s) disclaim responsibility for any injury to people or property resulting from any ideas, methods, instructions or products referred to in the content. |
© 2023 by the authors. Licensee MDPI, Basel, Switzerland. This article is an open access article distributed under the terms and conditions of the Creative Commons Attribution (CC BY) license (https://creativecommons.org/licenses/by/4.0/).
Share and Cite
Luo, Y.; Yang, Y.; Kang, S.; Tian, X.; Kang, X.; Sun, F. A Mathematical Morphological Network Fault Diagnosis Method for Rolling Bearings Based on Acoustic Array Signal. Appl. Sci. 2023, 13, 12671. https://doi.org/10.3390/app132312671
Luo Y, Yang Y, Kang S, Tian X, Kang X, Sun F. A Mathematical Morphological Network Fault Diagnosis Method for Rolling Bearings Based on Acoustic Array Signal. Applied Sciences. 2023; 13(23):12671. https://doi.org/10.3390/app132312671
Chicago/Turabian StyleLuo, Yuanqing, Yingyu Yang, Shuang Kang, Xueyong Tian, Xiaoqi Kang, and Feng Sun. 2023. "A Mathematical Morphological Network Fault Diagnosis Method for Rolling Bearings Based on Acoustic Array Signal" Applied Sciences 13, no. 23: 12671. https://doi.org/10.3390/app132312671
APA StyleLuo, Y., Yang, Y., Kang, S., Tian, X., Kang, X., & Sun, F. (2023). A Mathematical Morphological Network Fault Diagnosis Method for Rolling Bearings Based on Acoustic Array Signal. Applied Sciences, 13(23), 12671. https://doi.org/10.3390/app132312671