Abstract
Auto-driving detection usually acquires low-light infrared images, which pose a great challenge to the autopilot function at night due to their low contrast and unclear texture details. As a precursor algorithm in the field of automatic driving, the infrared image contrast enhancement method is of great significance in accelerating the operation speed of automatic driving target recognition algorithms and improving the accuracy of object localization. In this study, a convolutional neural network model including feature extraction and image enhancement modules is proposed to enhance infrared images. Specifically, the feature extraction module consists of three branches, a concatenation layer, and a fusion layer that connect in parallel to extract the feature images. The image enhancement module contains eight convolutional layers, one connectivity layer, and one difference layer for enhancing contrast in infrared images. In order to overcome the problem of the lack of a large amount of training data and to improve the accuracy of the model, the brightness and sharpness of the infrared images are randomly transformed to expand the number of pictures in the training set and form more sample pairs. Unlike traditional enhancement methods, the proposed model directly learns the end-to-end mapping between low- and high-contrast images. Extensive experiments from qualitative and quantitative perspectives demonstrate that our method can achieve better clarity in a shorter time.
1. Introduction
High-quality infrared images play a crucial role in scenarios such as auto-driving, fault diagnosis, and fire detection [1,2,3,4]. However, the quality of infrared images obtained in real-life scenarios tends to be poor due to environmental effects and the limitations of infrared thermal imaging technology [5]. The low contrast and unclear texture details of infrared images largely increase the difficulty of subsequent processing, such as detection, perception, and location [1,6,7,8]. Low-contrast infrared images lead to large deviations in target localization, so the first step in target localization is to increase the contrast of the image. Traditional infrared image enhancement methods are mainly divided into three types: histogram-based methods, transform function-based methods, and transform domain-based methods. Most of the traditional methods need to set parameters artificially, which enormously reduces the flexibility of applications [9]. Moreover, it takes a longer time to process larger-resolution images via traditional methods. Predicting the target and background precisely is crucial to achieve the aim of improving image contrast robustly. Unlike with fixed filters, we try to learn the filters suitable for extracting the target and background sub-images using a data-driven method. Inspired by the ability of convolutional neural networks (CNNs) in the image classification field, we propose a novel approach to predicting target and background features using filters learned by a CNN for infrared image enhancement.
In this paper, we propose a convolutional neural network model to enhance the quality of infrared images. The model consists of two parts: a feature extraction module and an image enhancement module. We consider low-contrast infrared image enhancement as a supervised learning problem, and the model learns the end-to-end mapping between low- and high-contrast images, directly. Then, the targets and background clutters are predicted from the extracted multiscale feature images by the learned feature extraction module. Finally, the weak infrared image is enhanced by zooming in on the target while removing background clutter in the image enhancement module.
The contributions of our work can be summarized in three ways.
(1) Convolutional neural networks consisting of a feature extraction module and image enhancement module are applied to infrared image enhancement.
(2) The low- and high- contrast images are considered the input and output of the model for training. To overcome the lack of a large amount of training data, the brightness and clarity of the infrared images are randomly reduced to form sample pairs.
(3) Extensive experiments show that our method can not only effectively improve the quality of infrared images, but also reduce processing time.
2. Related work
2.1. Traditional Methods
Histogram equalization (HE) is one of the most common methods used to improve image contrast [10]. The main idea is to count the histogram of grayscale pixels in an image, and then, adjust the distribution characteristics of the grayscale pixels to improve the image contrast. This method treats each pixel point in the image individually without considering the relationship between its domains. To solve this problem, many scholars have proposed improved methods for HE. Liu et al. [11] proposed a two-dimensional HE algorithm that uses the contextual information around each pixel to enhance the image contrast. In addition, many scholars also transform the image from the spatial domain to the frequency domain via fast Fourier transform or wavelet transform, and process the relevant frequencies to adjust the image contrast. Singh et al. [12] combined lifting discrete wavelet transform and singular value decomposition for low-contrast image enhancement. Zhang et al. [13] conducted a gradient-domain-based visualization method for high-dynamic-range compression and detail enhancement of infrared images. Since then, researchers have proposed filtering framework algorithms based on this technique. Song et al. [14] proposed a detail enhancement algorithm for infrared images based on local edge-preserving filtering, which divides the image into base and detail layers. Then, the base layer and detail layer are processed separately to obtain the respective enhanced images, and finally, a better ratio is selected to fuse the enhanced images of the base and the detail layer components. As a result, it takes a long time to enhance images with a larger resolution using the filtering framework algorithm.
2.2. Deep Learning Method
Convolutional neural networks are widely used in areas such as image classification and target detection. In addition, researchers have also applied them to image enhancement [15,16,17,18]. Shen et al. [19] combined convolutional neural networks with retinex theory to propose MSR-net for low-light image enhancement. Kuang et al. [20] proposed a conditional generative adversarial network to address infrared image enhancement, which can avoid background noise being amplified and further enhance contrast and details. Cai et al. [21] proposed a trainable end-to-end system named DehazeNet, which takes a hazy image as input and outputs its medium transmission map, which is subsequently used to recover a haze-free image via an atmospheric scattering model. Qian et al. [22] proposed a neural network named a multi-scale error feedback network to enhance low-light images. Wang et al. [23] presented an innovative target attention deep neural network to achieve discriminative enhancement in an end-to-end manner. The above study illustrates that CNNs are useful for being able to enhance the contrast of infrared images.
3. Methodology
In this section, we use convolutional neural networks consisting of feature extraction and enhancement modules to enhance infrared images. The input image is first processed by the feature extraction module, and then, goes to the image enhancement module and finally outputs the enhanced image. The function of the feature extraction module is to extract the features of the input IR image and to concatenate and fuse these features to obtain a pre-fused image. The enhancement module is utilized to enhance the pre-fused image and to obtain a result similar to the target image. In the proposed method, infrared image enhancement is considered a supervised learning problem, and low- and high-contrast images are considered input and output data, respectively. Figure 1 shows the structure of our model.
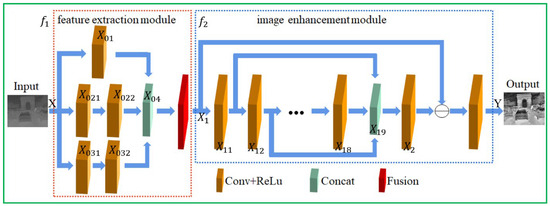
Figure 1.
Structure of the proposed convolutional neural network for infrared image enhancement.
We define the low-contrast image as the input X, and the corresponding high-contrast image as the output . Assuming that f1 and f2 denote the function of the feature extraction and image enhancement modules, respectively, our model can be written as a combination of two functions:
The feature extraction module consists of three branches, a concatenation layer, and a fusion layer. The three branches are connected in parallel to extract the first, second, and third feature images from the input infrared image. The first branch includes a convolutional layer and a ReLU activation layer.
Here, X01 denotes the output of the first branch, and * denotes the convolution operation. W01 and b01 denote the convolution kernel of the convolution layer and offset, respectively. max corresponds to ReLU operation.
The second and third branches both include two convolutional layers and a ReLU activation layer:
where X0i denotes the output of the i branch, and X0i1 denotes the output of the first convolutional layer and ReLU activation layer of the first branch. W0i1 and b0i1 are the convolutional kernel and offset for the first convolutional layer in branch i, respectively. W0i2 and b0i2 are the convolutional kernel and offset for the second convolutional layer in branch i, respectively.
The concatenation layer connects the feature image outputs from the three branches by channel. The input of the fusion layer is the output of the concatenation layer, and outputs the pre-fusion image, including a convolutional layer and a ReLU activation layer.
Here, X04 denotes the output of the splicing layer. W04 and b04 denote the convolution kernel of the convolution layer in the fusion layer and the offset, respectively.
The training images in the dataset usually have low luminance, so an image enhancement module is proposed following the convolutional difference strategy. The input of the image enhancement module is X1, which generates an output X2 with the same width and height.
Here, X11 denotes the output of the first convolution. W11 and b11 denote the convolution kernel and offset of the first convolution, respectively. W1i and b1i denote the convolution kernel and offset of the i convolution, respectively. The images after each convolution are then joined by the channel and convoluted again as follows:
where X19 denotes the output after concatenation, and X2 denotes the output after convolution. W19 and b19 denote the convolution kernel and offset, respectively. Finally, the final output image is obtained by convolving the difference between X1 and X2:
where W2 and b2 denote the convolution kernel and offset of the convolution, respectively. The sizes of the convolution kernels used in the convolution are 3 and 5.
4. Experiments
The experiments were conducted by using the deep learning framework TensorFlow 2.8.0 on a GPU RTX 2080Ti. Both the input and output image sizes were 200 × 200. Before training the model, the input image was first transformed into a grayscale image, and then, normalized to input the model. Adam was used as the optimizer, and the learning rate was set to 0.0001. The batchsize and epoch were set to 8 and 50, respectively.
Let be the training dataset, where Xi denotes the input infrared image, and Yi denotes the corresponding output image. N is the number of training pairs. The infrared images used for training were derived from the FLIR thermal dataset, which contains a total of 14,000 8-bit images. FLIR is a thermal imaging dataset with a large number of low-contrast thermal imaging images, including mainly pedestrians and cars [24,25]. Complex image components and low contrast make it extremely difficult to recognize targets, hence the need for contrast enhancement of infrared images.
For the dataset of FLIR, similar images in the dataset were first removed and 6500 images were selected. Then, 500 images were randomly selected from these images to be flipped 45°, 90°, 135°, 180°, 225°, 270°, and 315° to enrich the training set and improve the quality of the model, which resulted in a total of 4000 images. The original 6000 images and the 4000 images obtained after flipping were treated as labeled images. Finally, the contrast of the target image was reduced to obtain the training image. A training set containing 10,000 pairs was created, and 1000 images were selected from the dataset to form the test set.
The structural similarity index measure (SSIM) [26] and mean square error (MSE) [27] loss functions were used for the image enhancement class regression tasks. The SSIM is defined as follows:
where x is the original image, and y is the target image. μx and μy are the means of x and y, respectively. and are the variances of x and y. is the covariances of x and y, respectively. c1 and c2 are constant to maintain stability, and are defined as follows:
where L is the dynamic range of the image, , and . The MSE is defined as
where xi and yi are the pixel points of x and y, respectively.
Figure 2 illustrates the loss changes with iteration number for MSE and SSIM. After two epochs, the loss values of the two types are reduced to 1/2 of that in the first epoch. After four epochs, the change in MSE loss is very small, but the change in SSIM loss is larger. Therefore, in terms of convergence speed, the MSE loss can reach stability in fewer epochs during training.
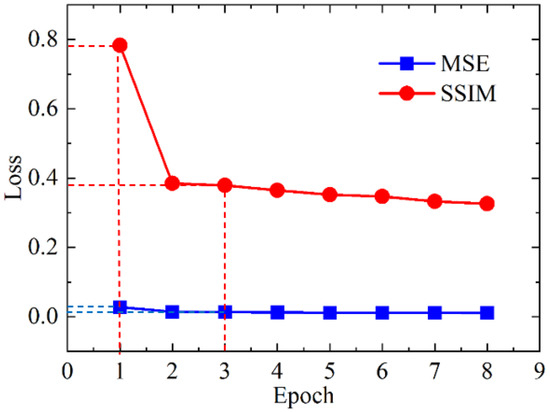
Figure 2.
MSE and SSIM loss functions.
5. Results and Discussion
Figure 3 shows the input images, target images, and predicted images obtained using our proposed method. The target images and the predicted images are close in detail and contrast, and their subjective visual effects are similar. Table 1 shows the evaluation metrics, including contrast per pixel (CPP) [28], mean pixel contrast (MPC) [29], enhancement measure evaluation (EME) [30], image clarity (IC) [31], and entropy (E) [28]. Their formulas have the following representation:
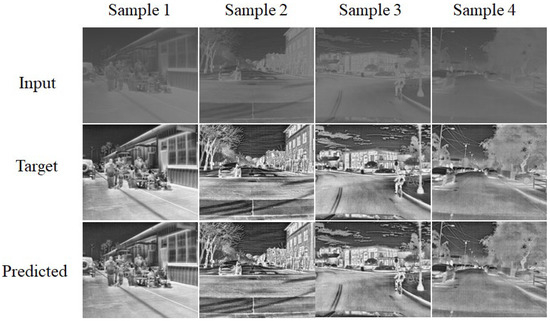
Figure 3.
Input images, target images, and predicted images for road scenes.

Table 1.
Metrics of target images and predicted images and their deviation.
In Equation (1), and represent the size of the image, and is the gradient vector of the image. In Equation (2), is the average contrast. and are the contrast of the input image and the processed image, respectively. For Equation (3), the image is broken up into blocks, is the given transform, and is an enhancement parameter. is a constant value of 0.0001. In Equation (4), represents the standard deviation and is the mean value of all pixels. In Equation (5), represents the set of image pixel values, is the pixel of the image, and represents the probability that one pixel value will appear.
For the first input image, the predicted results and the target image only differ significantly in the EME evaluation index, and are close in other aspects. For the second and third input images, there are large differences between the predicted and target images on EME and CPP, and all other aspects are close. For the fourth input image, the predicted result and the target image only have a large difference on CPP, and the other aspects are close to each other. The results show that the predicted results are very close to the target images in terms of details. However, there is still room for improvement in our approach to EME and CPP.
Figure 4 shows the input images and enhanced images of our method and other algorithms. We selected four representative images for a comprehensive comparison, including sequences with multiple targets, no targets, and mixed targets. For the first image, the HE method makes the roof of the car on the road too dark and other parts of the car too bright. Although the SSR [32] and MSR methods do not make the car appear obviously locally too bright or too dark, they make the lines on the road unclear. Our method not only avoids partial over-brightening or over-darkening of the cars, but also maintains the details of the lines on the road. For the second image, the HE method makes the sky darker, resulting in some clouds not being easy to notice. The images processed using the SSR and MSR methods have more clouds, but the details on the road are still unclear. The use of our method to enhance the image can not only clearly exhibit the clouds in the sky, but also preserve the details on the road. For the third image, the HE method makes the car and the building on the right appear too bright, and the SSR and MSR methods make some textures of the building blurred, so their images are not as detailed as those of the HE method. Our method not only avoids the local over-brightness caused by the HE method, but also makes the details of the building clearer than the SSR and MSR methods. For the fourth image, the HE method not only makes the tires of the car appear too bright, but also gives the trees above part of the image similar brightness to the night sky, which lowers the contrast between trees and the night sky. Our proposed method improves the contrast between trees and the night sky and clarifies the details between layers.
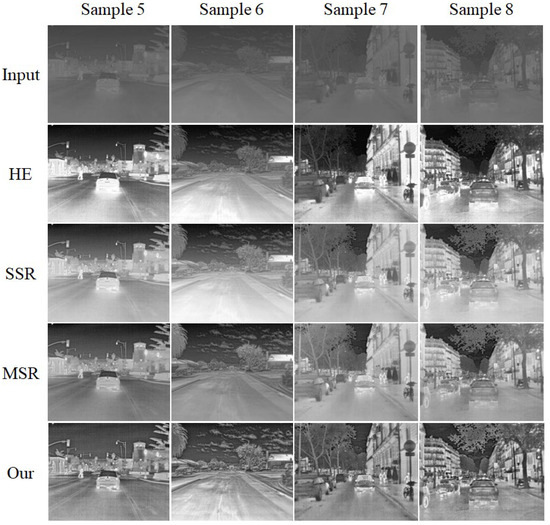
Figure 4.
Results of different infrared image enhancement algorithms.
Table 2 shows the objective evaluation index values for sample 5 and sample 6 in Figure 4. We can see in sample 5 that the CPP and MPC values of the image enhanced using the proposed method are larger than those of images enhanced using the other methods. The EME values of the images enhanced using our method are lower than those of images enhanced using the HE method, but higher than those using the SSR and MSR methods. In terms of image sharpness, the IC values of the images enhanced using the proposed method are lower than those of images enhanced using the HE and MSR methods. For sample 6, the CPP and MPC values of the images enhanced using the proposed method are significantly higher than those of images enhanced using the other methods, and the EME values of the enhanced images are also higher than those of images enhanced using the other methods. In terms of image sharpness, the IC values of the images enhanced using the proposed method are lower than those of images enhanced using the HE and MSR methods in samples 6 and 7. In addition, a comparison of the mean values of 300 images in test dataset shows that our designed algorithm has a clear advantage in CPP, MPC, and EME evaluations, but is slightly inferior to MSR in IC comparisons. Therefore, improving IC will be the main direction of the subsequent optimization of our algorithm. The above subjective evaluation and objective index evaluation show that the proposed method can not only enhance the contrast of the infrared image, but also highlight the image details, which can effectively improve the quality of infrared images.
Table 2.
Evaluation indexes of different enhancement algorithms.
To study the computational speed of different algorithms, 10 images of size 200 × 200 were tested using an i5 CPU. Table 3 shows the average time required for enhancing the ten images using MSR, LEPF [18], PSO [33], and the proposed method. The convolutional neural network method proposed in this study requires the shortest average time of 2.02 s, and the MSR algorithm is the next shortest. In contrast, the LEPF algorithm takes the longest average time of 302.3 s. This shows the unique advantage of the short time required for the convolutional neural network method to enhance the image.
Table 3.
Average time required for infrared enhancement using different algorithms.
6. Summary
In this paper, a convolutional neural network model for low-contrast infrared grayscale image enhancement is proposed, which directly learns the mapping relationship between low-contrast images and high-contrast images. Low- and high- contrast images are considered the input and output of the model for training. To overcome the lack of a large amount of training data, the brightness and clarity of the infrared images are randomly reduced to form sample pairs. Experiments on the training and test sets demonstrate the advantages of our method over other methods, including its advantages in enhancing the quality of infrared images as well as in processing speed. The proposed algorithm serves as a precursor algorithm for automatic driving image recognition, which not only greatly improves the image processing speed, but also enhances the contrast between the target and the background. In addition, the algorithm can also be used for image enhancement processing in complex tracking systems, which can quickly and effectively deal with the noise in infrared images and improve the contrast of images.
Author Contributions
Conceptualization, F.Z.; methodology, L.F.; software, L.F.; validation, L.F.; formal analysis, S.Z.; investigation, S.Z.; resources, S.Z.; data curation, S.Z.; writing—original draft preparation, S.Z.; writing—review and editing, F.Z.; visualization, L.F.; supervision, F.Z.; project administration, F.Z.; funding acquisition, F.Z. All authors have read and agreed to the published version of the manuscript.
Funding
This research received no external funding.
Institutional Review Board Statement
Not applicable.
Informed Consent Statement
Not applicable.
Data Availability Statement
Restrictions apply to the availability of these data. Data was obtained from Thinkmore company and are available from the authors with the permission of Thinkmore company.
Conflicts of Interest
The authors declare no conflict of interest.
References
- Ju, J.; Zheng, H.; Li, C.; Li, X.; Liu, H.; Liu, T. AGCNNs: Attention-guided convolutional neural networks for infrared head pose estimation in assisted driving system. Infrared Phys. Technol. 2022, 123, 104146. [Google Scholar] [CrossRef]
- Jia, Y.; Wang, H.; Chen, W.; Wang, Y.; Yang, B. An attention-based cascade R-CNN model for sternum fracture detection in X-ray images. CAAI Trans. Intell. Technol. 2022, 7, 658–670. [Google Scholar] [CrossRef]
- Zhang, Q.; Xiao, J.; Tian, C.; Lin, J.C.; Zhang, S. A robust deformed convolutional neural network (CNN) for image denoising. CAAI Trans. Intell. Technol. 2022, 8, 331–342. [Google Scholar] [CrossRef]
- Dai, D.; Li, Y.; Wang, Y.; Bao, H.; Wang, G. Rethinking the image feature biases exhibited by deep convolutional neural network models in image recognition. CAAI Trans. Intell. Technol. 2022, 7, 721–731. [Google Scholar] [CrossRef]
- Zhao, C.; Wang, J.; Su, N.; Yan, Y.; Xing, X. Low contrast infrared target detection method based on residual thermal backbone network and weighting loss function. Remote Sens. 2022, 14, 177. [Google Scholar] [CrossRef]
- Guoqiang, W.; Hongxia, Z.; Zhiwei, G.; Wei, S.; Dagong, J. Bilateral filter denoising of Lidar point cloud data in automatic driving scene. Infrared Phys. Technol. 2023, 131, 104724. [Google Scholar] [CrossRef]
- Yang, Z.L. Intelligent Recognition of Traffic Signs Based on Improved YOLO v3 Algorithm. Mob. Inf. Syst. 2022, 2022, 7877032. [Google Scholar] [CrossRef]
- Ren, B.; Cui, J.Y.; Li, G. A Three-dimensional Point Cloud Denoising Method Based on Adaptive Threshold. Acta Photonica Sin. 2022, 51, 319–332. [Google Scholar]
- Li, Y.; Zhang, Y.; Geng, A.; Cao, L.; Chen, J. Infrared image enhancement based on atmospheric scattering model and histogram equalization. Opt. Laser Technol. 2016, 83, 99–107. [Google Scholar] [CrossRef]
- Li, S.; Jin, W.; Li, L.; Li, Y. An improved contrast enhancement algorithm for infrared images based on adaptive double plateaus histogram equalization. Infrared Phys. Technol. 2018, 90, 164–174. [Google Scholar] [CrossRef]
- Liu, X.; Pedersen, M.; Wang, R. Survey of natural image enhancement techniques: Classification, evaluation, challenges, and perspectives. Digit. Signal Process. 2022, 127, 103547. [Google Scholar] [CrossRef]
- Singh, K.K.; Pandey, R.K.; Suman, S. Contrast enhancement using lifting wavelet transform. In Proceedings of the 2014 International Conference on Control, Instrumentation, Communication and Computational Technologies (ICCICCT), Kanyakumari District, Kanyakumari, India, 10–11 July 2014; Volume 33, pp. 446–471. [Google Scholar]
- Zhang, F.; Xie, W.; Ma, G.; Qin, Q. High dynamic range compression and detail enhancement of infrared images in the gradient domain. Infrared Phys. Technol. 2014, 67, 441–454. [Google Scholar] [CrossRef]
- Song, Q.; Wang, Y.; Bai, K. High dynamic range infrared images detail enhancement based on local edge preserving filter. Infrared Phys. Technol. 2016, 77, 464–473. [Google Scholar] [CrossRef]
- Zhou, Z.; Shi, Z.; Ren, W. Linear Contrast Enhancement Network for Low-Illumination Image Enhancement. IEEE Trans. Instrum. Meas. 2022, 72, 1–16. [Google Scholar] [CrossRef]
- Bi, X.; Shang, Y.; Liu, B.; Xiao, B.; Li, W.; Gao, X. A Versatile Detection Method for Various Contrast Enhancement Manipulations. IEEE Trans. Circuits Syst. Video Technol. 2023, 33, 491–504. [Google Scholar] [CrossRef]
- Zhu, X.; Lin, M.; Zhao, M.; Fan, W.; Dai, C. Adaptive underwater image enhancement based on color compensation and fusion. Signal Image Video Process. 2023, 17, 2201–2210. [Google Scholar] [CrossRef]
- Pang, L.; Zhou, J.; Zhang, W. Underwater image enhancement via variable contrast and saturation enhancement model. Multimedia Tools Appl. 2023, 1–22. [Google Scholar] [CrossRef]
- Shen, L.; Yue, Z.; Feng, F.; Chen, Q.; Liu, S.; Ma, J. Msr-net: Low-light image enhancement using deep convolutional network. arXiv 2017, arXiv:1711.02488. [Google Scholar]
- Kuang, X.; Sui, X.; Liu, Y.; Chen, Q.; Gu, G. Single infrared image enhancement using a deep convolutional neural network. Neurocomputing 2018, 332, 119–128. [Google Scholar] [CrossRef]
- Cai, B.; Xu, X.; Jia, K.; Qing, C.; Tao, D. DehazeNet: An End-to-End System for Single Image Haze Removal. IEEE Trans. Image Process. 2016, 25, 5187–5198. [Google Scholar] [CrossRef]
- Qian, Y.; Jiang, Z.; He, Y.; Zhang, S.; Jiang, S. Multi-scale error feedback network for low-light image enhancement. Neural Comput. Appl. 2022, 34, 21301–21317. [Google Scholar] [CrossRef]
- Wang, D.; Lai, R.; Guan, J. Target attention deep neural network for infrared image enhancement. Infrared Phys. Technol. 2021, 115, 103690. [Google Scholar] [CrossRef]
- Jia, X.; Zhu, C.; Li, M.; Tang, W.; Zhou, W. LLVIP: A visible-infrared paired dataset for low-light vision. In Proceedings of the IEEE/CVF International Conference on Computer Vision, Montreal, BC, Canada, 11–17 October 2021; pp. 3496–3504. [Google Scholar]
- Bao, C.; Cao, J.; Hao, Q.; Cheng, Y.; Ning, Y.; Zhao, T. Dual-YOLO Architecture from Infrared and Visible Images for Object Detection. Sensors 2023, 23, 2934. [Google Scholar] [CrossRef]
- Chen, C.-Y.; Chuang, C.-H.; Lin, H.-Y.; Zhuo, D.-Y. Imaging evaluation of computer-generated hologram by using three-dimensional modified structural similarity index. J. Opt. 2022, 24, 055702. [Google Scholar] [CrossRef]
- Kim, B.; Ryu, K.H.; Heo, S. Mean squared error criterion for model-based design of experiments with subset selection. Comput. Chem. Eng. 2022, 159, 107667. [Google Scholar] [CrossRef]
- Luque-Chang, A.; Cuevas, E.; Pérez-Cisneros, M.; Fausto, F.; Valdivia-González, A.; Sarkar, R. Moth Swarm Algorithm for Image Contrast Enhancement. Knowledge-Based Syst. 2020, 212, 106607. [Google Scholar] [CrossRef]
- Park, P.C.; Choi, G.W.; Zaid, M.M.; Elganainy, D.; Smani, D.A.; Tomich, J.; Samaniego, R.; Ma, J.; Tamm, E.P.; Beddar, S.; et al. Enhancement pattern mapping technique for improving contrast-to-noise ratios and detectability of hepatobiliary tumors on multiphase computed tomography. Med Phys. 2019, 47, 64–74. [Google Scholar] [CrossRef]
- Shin, Y.-G.; Park, S.; Yeo, Y.-J.; Yoo, M.-J.; Ko, S.-J. Unsupervised Deep Contrast Enhancement With Power Constraint for OLED Displays. IEEE Trans. Image Process. 2019, 29, 2834–2844. [Google Scholar] [CrossRef]
- Li, M.; Ruan, B.; Yuan, C.; Song, Z.; Dai, C.; Fu, B.; Qiu, J. Intelligent system for predicting breast tumors using machine learning. J. Intell. Fuzzy Syst. 2020, 39, 4813–4822. [Google Scholar] [CrossRef]
- Xie, S.J.; Lu, Y.; Yoon, S.; Yang, J.; Park, D.S. Intensity Variation Normalization for Finger Vein Recognition Using Guided Filter Based Singe Scale Retinex. Sensors 2015, 15, 17089–17105. [Google Scholar] [CrossRef]
- Wan, M.; Gu, G.; Qian, W.; Ren, K.; Chen, Q.; Maldague, X. Particle swarm optimization-based local entropy weighted histogram equalization for infrared image enhancement. Infrared Phys. Technol. 2018, 91, 164–181. [Google Scholar] [CrossRef]
Disclaimer/Publisher’s Note: The statements, opinions and data contained in all publications are solely those of the individual author(s) and contributor(s) and not of MDPI and/or the editor(s). MDPI and/or the editor(s) disclaim responsibility for any injury to people or property resulting from any ideas, methods, instructions or products referred to in the content. |
© 2023 by the authors. Licensee MDPI, Basel, Switzerland. This article is an open access article distributed under the terms and conditions of the Creative Commons Attribution (CC BY) license (https://creativecommons.org/licenses/by/4.0/).