Abstract
To investigate the damage characteristics of reinforced concrete (RC) buildings during explosive incidents, a large RC slab (4 m × 5 m × 0.15 m) was meticulously designed, fabricated, and subjected to explosion experiments, which were complemented by comprehensive numerical simulations. The dynamic response parameters of the RC slabs under 0.5–1 kg TNT explosions were tested using polyvinylidene fluoride (PVDF) pressure sensors, displacement sensors, and acceleration sensors. The damage morphologies under 5–40 kg TNT explosions were investigated using ANSYS/LS–DYNA 17.0 software. The results show that, with an increase in TNT charge, the RC slab gradually showed minor damage (5 kg), moderate damage (10–20 kg), heavy damage (25 kg), and complete destruction (30–40 kg). For the 20 kg TNT explosion condition, a 1020 mm × 760 mm explosion crater appeared on the top surface, which was in agreement with the 934 mm × 906 mm explosion crater obtained from the simulation. Based on the results, suitable P–I (pressure–impulse) curves for the 4 m × 5 m × 0.15 m RC slab were established. The results can provide a reference for damage assessments of large-sized buildings during explosion accidents.
1. Introduction
Reinforced concrete is widely used in many kinds of buildings because of its low cost and outstanding mechanical properties. With the rapid development of modern industry, there are an increasing number of explosion incidents caused by industrial explosion accidents, and reinforced concrete buildings are subjected to explosion damage. As one of the main load-bearing components of a building, the dynamic response and damage characteristics of the reinforced concrete slabs under explosion load have important effects on the whole structure of the building.
Recently, many studies on the dynamic response characteristics of reinforced concrete slabs under explosion loads have been reported [1,2]. Shi [3] studied fragments of reinforced concrete slabs (1 m × 2 m × 0.12 m) under the conditions of nearby explosions. Based on the experimental results, Wang [4] introduced an Arbitrary Lagrangian Eulerian-FEM-smoothed particle hydrodynamics (ALE–FEM–SPH) coupling method to predict the spalling damage of RC slabs (1 m × 2 m × 0.12 m) subjected to a blast load. In terms of other blast loading conditions, Peng [5] studied the dynamic behaviors of RC slabs (2.4 m × 1.0 m × 0.1 m) under long-duration (85–135 ms) near-planar explosion loadings in a specified apparatus. Colombo [6] carried out a research investigation on the structural response of RC slabs subjected to combined fire and blast. Yang [7] studied the blast resistance of air-backed RC slabs against underwater contact explosions. Li [8] investigated the failure characteristics of two-way RC slabs (1 m × 1 m × 0.04 m) under combined blast and fragment loading and conducted numerical studies based on the finite element-smoothed particle hydrodynamics (FEM–SPH) method. Yao [9] analyzed and compared the failure modes of reinforced concrete slabs under different explosion conditions. Reifarth [10] studied the surface damage characteristics of external RC slabs (4.4 m × 1.46 m × 0.15 m) reinforced by carbon (CFRP) and E-glass (GFRP) fibers. Yuan [11] revealed the failure modes and blast-resistant mechanism of steel-wire-mesh-reinforced high-performance concrete slabs (1.5 m × 1.5 m × 0.15 m) protected by an ultrahigh-molecular-weight polyethylene (UHMWPE) fiber-reinforced cloth (FRC). In addition, polyurea-woven glass fiber mesh composites and engineered cementitious composites were also reported as reinforcement materials for RC slabs [12,13]. Almustafa [14] investigated the practicality of using machine learning to predict the maximum displacement of fiber-reinforced polymer-strengthened RC slabs. There are a few relevant studies on large-sized RC slabs and large-charge explosion tests.
For damage assessment, pressure–impulse (P–I) curves can not only reflect the damage effect of the explosion peak overpressure but can also consider the influence of the cumulative impulse generated by explosion overpressure, and they are the most scientific and effective evaluation tool at present. Based on the dimensionless analysis method of the single-degree-of-freedom (SDOF) model, Li [15,16] adopted the failure criterion based on maximum displacement to obtain the normalized P–I curves of the SDOF system. Wesevich et al. [17] obtained the P–I curves of brick walls based on the test data of 236 groups of brick walls under explosions. Krauthammer et al. [18,19,20] studied the P–I curves of reinforced concrete members by using the SDOF numerical solution method. The approximate positions of the overpressure asymptotes and impulse asymptotes of the P–I curves were determined using the energy balance method. Then, the P–I curve corresponding to the critical damage degree was obtained through a large number of numerical simulation calculations and necessary curve fitting methods. Li et al. [21] derived the P–I curves of reinforced concrete slabs through a numerical simulation.
In this paper, explosion tests and simulation studies on RC slabs (4 m × 5 m × 0.15 m) with different TNT charges were carried out, and the dynamic response and damage characteristics of the slabs were determined. Based on the results, the P–I curves of the 4 m × 5 m × 0.15 m RC slab were established, which could provide reference for the damage assessment and safety protection of RC slabs and buildings.
2. Materials and Methods
2.1. Experiment Setup
2.1.1. Reinforced Concrete Slab
An RC slab model (as shown in Figure 1 and Figure 2) was designed with a size of 4 m × 5 m and a thickness of 150 mm. C35 concrete was used, the section reinforcement ratio was 1.2%, and HRB400 steel bars were adopted. The slabs had double-layer bidirectional reinforcement, and the diameter of the steel bars was 10 mm with a spacing of 85 mm.
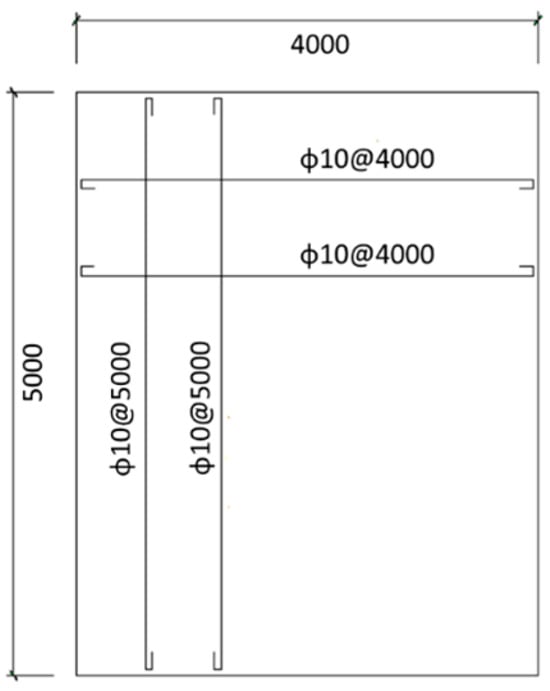
Figure 1.
Schematic diagram of the sections and reinforcement of the RC slab.
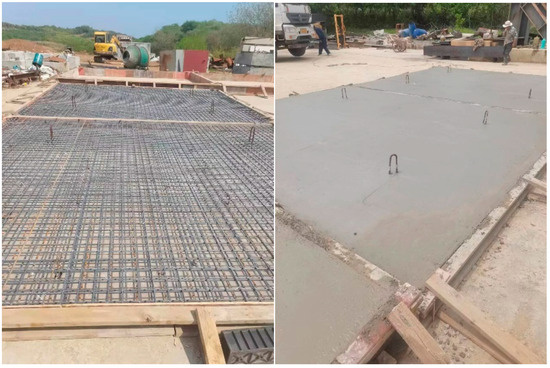
Figure 2.
Casting process of the RC slab test model.
Three 150 mm × 150 mm × 150 mm cube specimens were reserved during the casting of the slabs, and the compressive strength was tested using a YE200A pressure testing machine. The compressive strengths of the cast concrete cube specimens were 36.6 MPa, 37.2 MPa, and 37.9 MPa, and the average strength was 37.2 MPa. The mechanical properties of the Φ10 mm HRB400 steel bars were measured using a WAW–E600C microcomputer-controlled electro-hydraulic universal testing machine. The ultimate strength was 542 MPa, and the yield strength was 405 MPa.
2.1.2. Experimental Process
During the test, an RC slab was placed on a support platform, and the simple support method was chosen to fix the slab considering the large self-weight. The RC slab was simply supported with the two long sides placed on L-shaped RC supports. The width of the contact surface between the support and the slab model was 150 mm. The PVDF pressure films, displacement sensors, and acceleration sensors (as shown in Figure 3) were installed on the top (explosion loading surface) and bottom surfaces. After the sensors were confirmed to work normally, TNT charges were suspended in the center of the slab at different heights and then detonated.
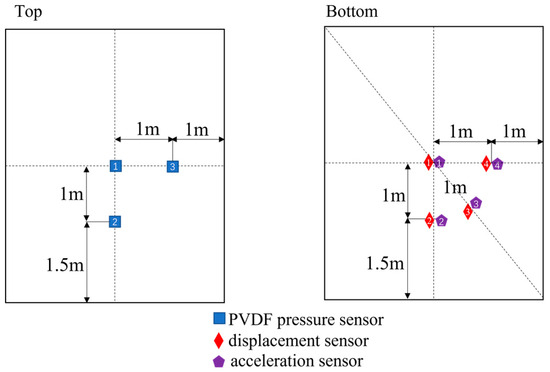
Figure 3.
Schematic diagram of the layout of the measuring points.
PVDF piezoelectric films (LDT1 028K) were used to test the surface explosion pressure of the slab. Linear displacement sensors (Xi’an Xinmin Electronic Technology Co., Ltd., Xi’an, China) were tested with a power supply of 10 V DC, a measuring range of 0–200 mm, and an accuracy of 0.1%. Acceleration sensors from Yangzhou Xitemu Electronics Co., Ltd. (Yangzhou, China) were used, with a range of 800–20,000 g, a frequency response range of 1~12,000 Hz, an axial sensitivity of 0.003 PC/m·s–2, and a maximum transverse sensitivity of <10%. A DH8302 data acquisition instrument (Jiangsu Donghua Test Technology Co., Ltd., Jingjiang, China) with 16 channels was used, with the highest continuous sampling rate of 1 MHz/channel and a voltage indication error of not more than 0.05% FS. A DH5863 charge amplifier (Jiangsu Donghua Test Technology Co., Ltd.) with 16 channels, a charge of 0–1,000,000 pC, and a bandwidth of 0.3 Hz ~ 600 kHz (+0.5 dB~–3 dB) was used to transform the charge signals of the acceleration sensors into voltage signals. An EinScan Pro 2X 3D scanner was used to scan the damaged area of the boards after the explosion, the error of which was generally less than 0.01 mm, and the screen resolution was 1280 × 1024 pixels.
The TNT was detonated using an 8# Industrial electric detonator with three specifications (a length-to-diameter ratio of 1:1) of 0.5 kg, 1 kg, and 10 kg. The design of the explosion test conditions is shown in Table 1, and the test layout is shown in Figure 4. The slab–1 is the same as slab–2. Two identical slabs were made for the experiments; one slab was used for the dynamic response tests, and the other slab was used for the damage test.

Table 1.
Design of the explosion test conditions.
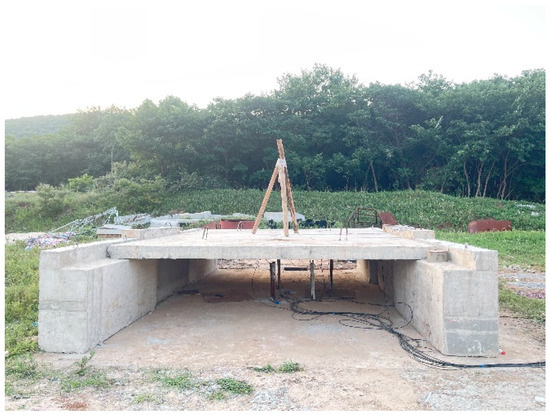
Figure 4.
Typical test layout.
2.2. Numerical Simulation
2.2.1. Finite Element Model
ANSYS/LS–DYNA 17.0 software was used to simulate the explosion tests [21]. SOLIDWORKS 2020 software was used to establish a three-dimensional model of the RC slab, and HYPERMESH 2020 software was imported for mesh generation. The thicknesses of the protective layer were 30 mm (Y direction) and 20 mm (X direction and Z direction), and the steel bar had double-layer bidirectional reinforcement, as shown in Figure 5. The strength was C35, the rebar adopted a BEAM161 unit, the mesh size was 10 mm, and the detonation center was 1 m away from the top surface of the slab. In the simulations, the RC slab was simply supported with the long sides placed on L-shaped RC supports. Surface contact between the concrete-bearing unit and the RC slab unit was established, and the friction coefficient was 0.6.
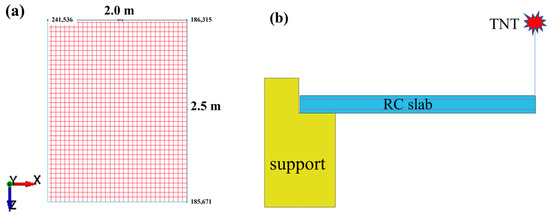
Figure 5.
The schematic diagram: (a) the quarter finite element model of the RC slab; (b) the calculation diagram.
2.2.2. Material Model
- (1)
- Concrete material model
The concrete follows the *MAT_CONCRETE_DAMAGE_REL3 constitutive model [22]. The constitutive model can effectively simulate the mechanical behavior of concrete under large deformation and a high strain rate. Combined with the keyword *DEFINE_CURVE to define the strain rate curve, the reinforcement effect of concrete under various strain rates can be considered. The ideal parameters of the concrete model are shown in Table 2. The concrete constitutive model does not consider failure. To simulate the damage of concrete elements under explosion, concrete failure is defined by the keyword *MAT_ADD_EROSION algorithm. The failure criterion is defined by the phase combination of MXPRES (maximum compressive stress) = 3.5 × 10⁷, MNPRES (maximum tensile stress) = –3.5 × 10⁶, and EPSSH (maximum shear strain) = 0.9.
Table 2.
C35 concrete parameters *.
- (2)
- Steel bar material model
The *MAT_PLASTIC_KINEMATIC constitutive model is adopted for the steel bar. The constitutive model is a dynamic hardening model with the same properties in all directions, which is suitable for simulating a steel bar model with a high stress rate under explosion impact. The constitutive model considers the strain rate effect and failure of the steel bar. The ideal parameters of the steel bar model are shown in Table 3.
Table 3.
HRB400 steel bar parameters *.
3. Results and Discussion
3.1. Dynamic Response Characteristics of the RC Slab
3.1.1. Explosion Pressure
Three PVDF sensors were used to determine the explosion pressure reaching the surface of the slabs under different explosion conditions. Typical PVDF pressure–time history curves are shown in Figure 6a. With an increasing TNT charge, the explosion pressures measured by the three PVDF sensors also increased, and the pressure in the middle of the slab was the largest. The maximum explosion pressure with different scaled distances of 0.8–1.26 kg/m1/3 is shown in Figure 6b.
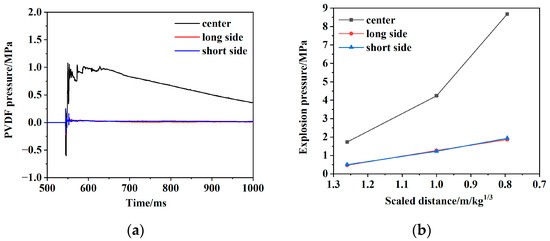
Figure 6.
Explosion pressure results: (a) typical PVDF pressure–time history curves (Test 1, 0.5 kg TNT, 1 m) and (b) variation in explosion pressure with the TNT charge.
3.1.2. Displacement
Four displacement sensors were used to determine the relative displacement change of the slabs. Typical displacement–time history curves are shown in Figure 7a. A high-frequency signal was recorded by the displacement sensor at the moment of the explosion, and obvious forward displacement occurred. The bottom surface vibrated backwards under the explosion, and the pull rod of the displacement sensor shrank. With an increase in TNT charge, both the displacement value measured by the displacement sensors and the overall displacement amplitude increased. The difference between the displacement curves in Figure 7a may be caused by the loosening of the diagonal line sensor after the first impact of the explosion wave.
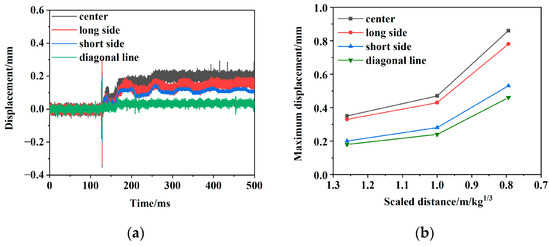
Figure 7.
Displacement results: (a) typical displacement–time history curve (Test 1, 0.5 kg TNT, 1 m) and (b) variation in maximum displacement with the TNT charge.
The absolute value of the maximum displacement at the time that the explosion wave reached the slab had a scaled distance of 0.8–1.26 kg/m1/3, as shown in Figure 7b. Under the 0.5–1 kg TNT explosions, the overall displacement of the slab was small, and the displacement in the middle of the slab was the largest under the same conditions.
3.1.3. Acceleration
Four acceleration sensors were used to determine the vibration characteristics under different explosion conditions. Typical acceleration–time history curves are shown in Figure 8. With the increase in the TNT charge, there was also an increase in the acceleration value measured by the acceleration sensor. The maximum accelerations under different TNT charge conditions are shown in Table 4.
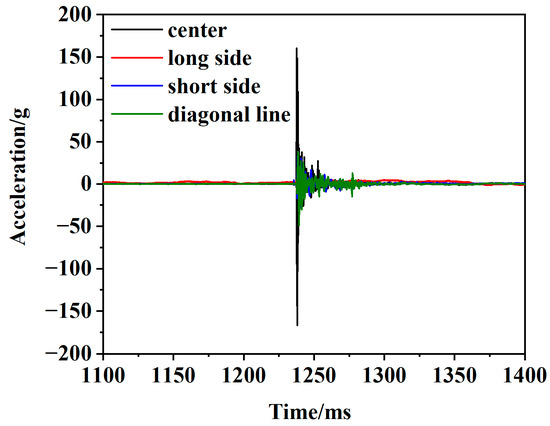
Figure 8.
Typical acceleration–time history curve (Test 2, 1 kg TNT, 1 m).
Table 4.
Acceleration results.
3.2. Damage Characteristics under Different TNT Charges
Based on the above calculation model with ideal parameters, the damage characteristics of the slabs under 5–40 kg TNT explosions were studied. As shown in Figure 9, under the 5 kg TNT explosion, there was no obvious change in the whole top surface of the slab. A small number of cracks appeared on the bottom surface, the concrete did not fall off, and the steel bar was not exposed. Under the 10–15 kg TNT explosion, obvious ring cracks appeared on the top surface, and the center of the slab was obviously broken. Many longitudinal and annular cracks appeared on the bottom surface, a small amount of the concrete fell off, and the steel bar in the explosion craters was exposed without obvious deformation. Under the 20 kg TNT explosion, a large number of ring cracks appeared on the slab, the concrete fell off in a medium range, and the steel bars in the center of the explosion craters were slightly deformed. Under the explosion of more than 25 kg of TNT, intensive ring cracks appeared on the top surface of the slab, and a large range of concrete fell off and collapsed in the centers of the top and bottom surface positions. The steel bars in the center of the explosion craters were obviously deformed or even broken.
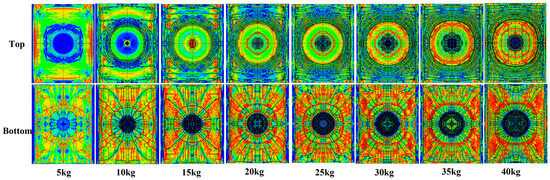
Figure 9.
Damage to the top and bottom surfaces.
The side damages of the slab were under the 5–40 kg TNT explosions, as shown in Figure 10. Under the 5 kg TNT explosion, a small amount of concrete fell off under the side of the slab, and the slab was slightly bent and deformed. Under the 10–15 kg TNT explosions, the slab showed an overall bending and obvious cracks. Under the 20 kg TNT explosion, more concrete fell off below the side. Under the 25–40 kg TNT explosions, a large number of cracks appeared on the side, and large pieces of concrete fell off.
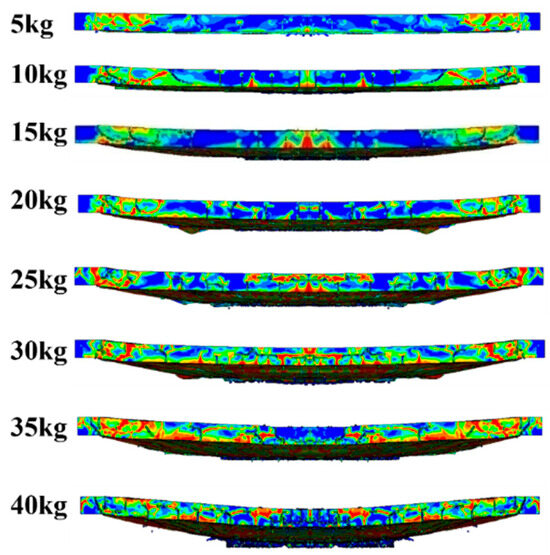
Figure 10.
Damage to the short side surfaces (4 m).
When the blast wave reached the surface of the reinforced concrete slab, the compressive stress wave caused damage to the top surface of the slab and propagated to the bottom surface of the slab to form a strong tensile wave, resulting in the spallation and collapse of the concrete. The damage in the tensile area of the reinforced concrete slab was more serious; there were several longitudinal and annular cracks in the longitudinal middle of the bottom surface, and some layer cracks appeared at the bottom. With the increasing TNT charge, the annular and radial cracks of the reinforced concrete slab gradually increased. The failure mode of the slab was mainly when there was an annular crack on the top surface, with the center of the slab as the circle center, and a local failure on the top surface center, accompanied by different degrees of spalling and lamination failure at the bottom. The lamination failure zone also expanded with the increase in the charge amount.
According to the numerical simulation results, the damage degrees under the explosions of TNT can be classified as shown in Table 5.
Table 5.
The damage degrees under the explosion of TNT with different charges.
3.3. Damage Characteristics of the RC Slab
The state of the RC slab under the 20 kg TNT explosion is shown in Figure 11a–f. On the top surface of the concrete, an explosion crater appeared, as shown in Figure 11a. More than 10 long cracks appeared on the bottom surface, as shown in Figure 11b. The RC slab bent along the centerline, and annular cracks and radial cracks appeared on both the top and bottom of the slab, as shown in Figure 11a,b. The concrete spalling fell off in a medium range in the center of the bottom surface.
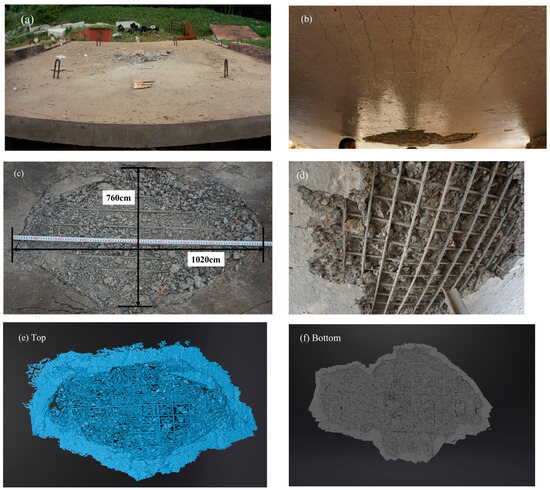
Figure 11.
Damage characteristics of the RC slab: (a) the top face after explosion, (b) the bottom face with cracks after explosion, (c) the length and width of the blast crater, (d) the explosion crater of the bottom face, (e) a 3D scan figure of the crater of the top face, and (f) a 3D scan figure of the crater of the bottom face.
The explosion crater was elliptical with a size of 1020 mm × 760 mm, as shown in Figure 11c, mainly because the 20 kg of TNT used was composed of two 10 kg cylinders. The steel bars were exposed in the blast crater on the top surface with no obvious fracture and being slightly bent. As shown in Figure 11d, the steel bars were also exposed in the blast crater on the bottom surface, and they were obviously bent but not broken. Figure 11e,f show the 3D scan figures of the explosion craters on the top and bottom surfaces, as well as the state of the steel bars in the craters.
Taking into account the actual material parameters, the average compressive strength of the concrete (37.2 MPa) and the yield strength of the steel bar (405 MPa) were used in the simulation detailed below.
The recalculation results are shown in Figure 12. Under the 20 kg TNT explosion, the concrete on the surface of the slabs fell off into pits, the rebar was exposed, the concrete slab bent along the centerline, and the top surface of the slab exhibited annular cracks and radial cracks. The maximum size of the short side crater on the top surface was 934 mm, and the maximum size of the long side crater was 906 mm. Compared with the test of 1020 mm × 760 mm, the relative errors were 8% and 19%, respectively.
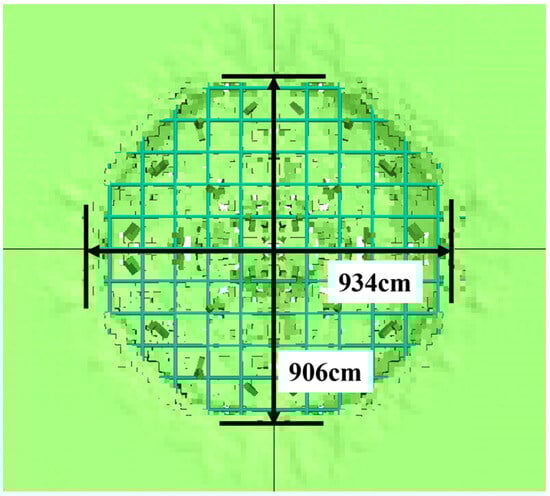
Figure 12.
The simulation result of the blast crater.
3.4. P–I Curves
P–I curves can predict the damage degree of RC components under the action of an explosion load to determine the safety distance. According to the damage index D calculated using Equation (1) [23], the definitions of the damage degree of the slabs are shown in Table 6.
where Rr is the mid-span flexural residual bearing capacity of the slab, and Rb is the mid-span reference limit bending moment of the slab.
Table 6.
Damage degree based on damage index D.
LS–DYNA software was used to simulate the residual bearing capacity of the RC slab. The method proposed by Ng and Krauthammer [18,19,20] was used to determine the asymptote of the response of the component. To simplify the calculation, triangular loads were assumed to act uniformly on the surface of the plate. The *DEFINE_CURVE command could easily set the load mode, peak value, and duration. When determining the critical point, the pressure was kept constant to determine whether the P–I combination was in the safe or damaged section. If safe, the impulse was increased until the point was in a broken state. Otherwise, the impulse was reduced until a safe point was reached. After a series of simulations, the asymptotes of the 4 m × 5 m × 0.15 m RC slab could be determined, as shown in Table 7.
Table 7.
Pressure and impulse limits corresponding to different damage degrees *.
According to P–I curve Equation (2) [23], the P–I curves shown in Figure 13 were obtained. The P–I curve could well distinguish various damage degrees and could be used as the critical boundary to distinguish various types of damage.
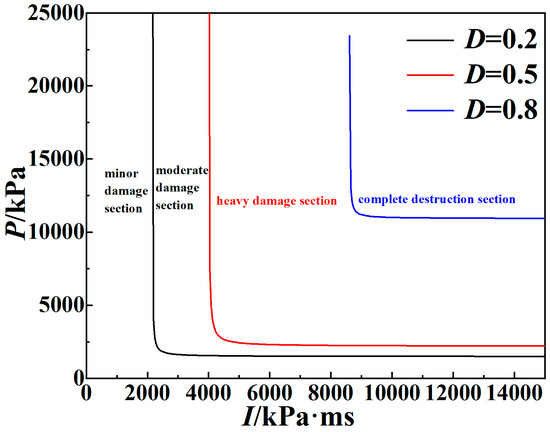
Figure 13.
The P–I curves of a 4 m × 5 m × 0.15 m RC slab.
Under the condition of a non-contact explosion, if the charge amount of the TNT and the explosion distance are determined, the load characteristics reaching the surface of the 4 m × 5 m × 0.15 m RC slab can be obtained through a theoretical, experimental, or numerical analysis, and then the explosion pressure Pslab and the impulse Islab can be obtained. The position of the Pslab–Islab combination point can be found according to the above P–I curves, and the damage degree of the slab can be determined according to the section where the point is located.
4. Conclusions
In conclusion, the dynamic response and damage characteristics of slabs (4 m × 5 m × 0.15 m) under the explosion of different TNT charges were determined. Based on the experimental and numerical results, the following conclusions can be drawn: Under the 0.5–1 kg TNT explosion, there were no obvious cracks or deformation of the reinforced concrete slab, and the explosion pressure, displacement, and acceleration changed with the change in TNT charge. Under the 20 kg TNT explosion, a 1020 mm × 760 mm explosion crater appeared on the top surface, and multiple cracks appeared on the bottom surface, with obvious bending as a whole, indicating moderate damage. When the TNT charge exceeded 35 kg at the explosion height of 1 m, the slab showed a completely ineffective damage response.
Based on LS–DYNA software simulations and a verification test, P–I curves for the 4 m × 5 m × 0.15 m RC slab were established successfully. According to the P–I curves, the damage degree under different non-contact explosions could be obtained easily and quickly. Only the 4 m × 5 m × 0.15 m RC slab with a section reinforcement ratio of 1.2% was considered in this study. The results could provide a reference for damage investigations of other RC slabs with different dimensions, reinforcement ratios, and concrete strengths under other explosion conditions such as contact explosions, internal explosions, and multiple explosions. Therefore, in the next investigation, the influence of more factors on the damage characteristics of reinforced concrete slabs will be analyzed to establish a more comprehensive P–I curve cluster. The P–I curve cluster will be meaningful for the assessment and safety protection of RC slabs and even RC buildings.
Author Contributions
Conceptualization, J.Y. and S.D.; methodology, J.Y.; software, S.L. and G.Z.; validation, J.Y.; investigation, J.Y. and S.L.; data curation, S.L.; writing—original draft preparation, J.Y.; writing—review and editing, J.Y. and S.L.; supervision, P.Z.; project administration, P.Z. All authors have read and agreed to the published version of the manuscript.
Funding
This research received no external funding.
Institutional Review Board Statement
Not applicable.
Informed Consent Statement
Not applicable.
Data Availability Statement
The data used to support the findings of this study are available from the corresponding author upon request. The data are not publicly available due to privacy.
Conflicts of Interest
Author Peng Zhang was employed by the company Jiangxi Hongdu Aviation Industry Group Co. Ltd. The remaining authors declare that the research was conducted in the absence of any commercial or financial relationships that could be construed as a potential conflict of interest.
References
- Peyman, S.; Eskandari, A. Analytical and Numerical Study of Concrete Slabs Reinforced by Steel Rebars and Perforated Steel Plates under Blast Loading. Results Eng. 2023, 19, 101319. [Google Scholar] [CrossRef]
- Tian, S.; Yan, Q.; Du, X.; Chen, F.; Zhang, B. Experimental and Numerical Studies on the Dynamic Response of Precast Concrete Slabs under Blast Load. J. Build. Eng. 2023, 70, 106425. [Google Scholar] [CrossRef]
- Shi, Y.; Wang, J.; Cui, J. Experimental Studies on Fragments of Reinforced Concrete Slabs under Close–in Explosions. Int. J. Impact Eng. 2020, 144, 103630. [Google Scholar] [CrossRef]
- Wang, Z.; Chen, W.; Hao, H.; Dong, Y.; Huang, Z. Numerical Prediction of Blast Fragmentation of Reinforced Concrete Slab using ALE–FEM–SPH Coupling Method. Finite Elem. Anal. Des. 2023, 220, 103948. [Google Scholar] [CrossRef]
- Peng, Q.; Zhou, D.; Wu, H.; Ma, L.; Fang, Q. Experimental and Numerical Studies on Dynamic Behaviors of RC Slabs under Long–Duration Near–Planar Explosion Loadings. Int. J. Impact Eng. 2022, 160, 104085. [Google Scholar] [CrossRef]
- Colombo, M.; Martinelli, P.; Arano, A.; Verli, J.A.; Hendriks, M.A.N.; Kanstad, T.; Prisco, M.D. Experimental Investigation on the Structural Response of RC Slabs Subjected to Combined Fire and Blast. Structures 2021, 31, 1017–1030. [Google Scholar] [CrossRef]
- Yang, G.; Fan, Y.; Wang, G.; Cui, X.; Leng, Z.; Lu, W. Blast Resistance of Air–backed RC Slab Against Underwater Contact Explosion. Def. Technol. 2023, in press. [Google Scholar] [CrossRef]
- Li, Y.; Chen, Z.; Ren, X.; Tao, R.; Gao, R.; Fang, D. Experimental and Numerical Study on Damage Mode of RC Slabs under Combined Blast and Fragment Loading. Int. J. Impact Eng. 2020, 142, 103579. [Google Scholar] [CrossRef]
- Yao, S.; Zhang, D.; Chen, X.; Lu, F.; Wang, W. Experimental and Numerical Study on the Dynamic Response of RC Slabs under Blast Loading. Eng. Fail. Anal. 2016, 66, 120–129. [Google Scholar] [CrossRef]
- Reifarth, C.; Castedo, R.; Santos, A.P.; Chiquito, M.; López, L.M.; Pérez–Caldentey, A.; Martínez–Almajano, S.; Alañon, A. Numerical and Experimental Study of Externally Reinforced RC Slabs using FRPs Subjected to Close–in Blast Loads. Int. J. Impact Eng. 2021, 156, 103939. [Google Scholar] [CrossRef]
- Yuan, P.; Xiang, H.; Xu, S.; Liu, J.; Su, Y.; Qu, K.; Wu, C. Experimental and Numerical Study of Steel Wire Mesh Reinforced G–HPC Slab Protected by UHMWPE FRC under Multiple Blast Loadings. Eng. Struct. 2023, 275, 115224. [Google Scholar] [CrossRef]
- Liao, Y.; Shi, S.; Chen, S.; Ming, X.; Ge, L. Numerical Evaluation of the Retrofit Effectiveness for Polyurea–Woven Glass Fiber Mesh Composite Retrofitted RC Slab Subjected to Blast Loading. Structures 2022, 36, 215–232. [Google Scholar] [CrossRef]
- Wu, J.; Zha, H.; Wang, X.; Zhou, H.; Chen, Y.; Du, X.; Wang, Y.; Wu, J.; Zhang, H. Blast Resistance of ECC and Composites Slabs Subjected to Near–field Explosion. Thin Wall. Struct. 2023, 189, 110885. [Google Scholar] [CrossRef]
- Almustafa, M.K.; Nehdi, M.L. Machine Learning Prediction of Structural Response for FRP Retrofitted RC Slabs Subjected to Blast Loading. Eng. Struct. 2021, 244, 112752. [Google Scholar] [CrossRef]
- Li, Q.; Meng, H. Pressure–Impulse Diagram for Blast Loads Based on Dimensional Analysis and Single–Degree–of–Freedom Model. J. Eng. Mech. 2002, 128, 87–92. [Google Scholar] [CrossRef]
- Li, Q.; Meng, H. Pulse Loading Shape Effects on Pressure–Impulse Diagram of an Elastic–Plastic, Single–Degree–of–Freedom Structural Model. Int. J. Mech. Sci. 2002, 44, 85–98. [Google Scholar] [CrossRef]
- Wesevich, J.W.; Oswald, C.J. Empirical Based Concrete Masonry Pressure–Impulse Diagrams for Varying Degrees of Damage; American Society of Civil Engineers: Reston, NY, USA, 2005; pp. 2083–2094. [Google Scholar]
- Soh, T.B.; Krauthammer, T. Load–Impulse Diagrams of Reinforced Concrete Beams Subjected to Concentrated Transient Loading; Technical Report: PTC–TR–006–2004; University Park, Protective Technology Center, Pennsylvania State University: State College, PA, USA, 2004. [Google Scholar]
- Ng, P.H.; Krauthammer, T. Pressure–Impulse Diagrams for Reinforced Concrete Slabs; Technical Report: PTC–TR–007; University Park, Protective Technology Center, Pennsylvania State University: State College, PA, USA, 2004. [Google Scholar]
- Krauthammer, T.; Astarlioglu, S.; Blasko, J.; Soh, T.B.; Ng, P.H. Pressure–Impulse Diagrams for the Behavior Assessment of Structural Components. Int. J. Impact Eng. 2008, 35, 771–783. [Google Scholar] [CrossRef]
- Zhou, G.; Lin, Z.; Wang, M.; Fan, J.; Wang, R.; Geng, Z.; Zhang, Y. Damage Behavior of Extra–Wide Reinforced Concrete Box Girder with Multiple Chambers under Repeated Explosive Loads: Testing and Numerical Simulation. Structures 2023, 54, 1560–1576. [Google Scholar] [CrossRef]
- Malvar, L.; Crawford, J.; Wesevich, J.; Simons, D. A Plasticity Concrete Material Model for DYNA3D. Int. J. Imp. Eng. 1997, 19, 847–873. [Google Scholar] [CrossRef]
- Li, Z.; Shi, Y.; Shi, X. Damage Analysis and Assessment of RC Slab under Blast Load. Chin. J. Build. Struct. 2009, 30, 60–66. [Google Scholar]
Disclaimer/Publisher’s Note: The statements, opinions and data contained in all publications are solely those of the individual author(s) and contributor(s) and not of MDPI and/or the editor(s). MDPI and/or the editor(s) disclaim responsibility for any injury to people or property resulting from any ideas, methods, instructions or products referred to in the content. |
© 2023 by the authors. Licensee MDPI, Basel, Switzerland. This article is an open access article distributed under the terms and conditions of the Creative Commons Attribution (CC BY) license (https://creativecommons.org/licenses/by/4.0/).