Article

Permissible Scale Factors for Various Intensity Measures in Aftershock Ground Motion Scaling

1
Shanghai Earthquake Agency, Shanghai 200062, China
2
Shanghai Sheshan National Geophysical Observatory, Shanghai 201602, China
3
Key Lab of Structures Dynamic Behavior and Control of the Ministry of Education, Harbin Institute of Technology, Harbin 150090, China
4
Key Lab of Smart Prevention and Mitigation of Civil Engineering Disaster of the Ministry of Industry and Information Technology, Harbin Institute of Technology, Harbin 150090, China
5
Department of Disaster Mitigation for Structures, Tongji University, Shanghai 201804, China
*
Author to whom correspondence should be addressed.
Appl. Sci. 2023, 13(22), 12515; https://doi.org/10.3390/app132212515
Submission received: 26 October 2023 / Revised: 15 November 2023 / Accepted: 19 November 2023 / Published: 20 November 2023
(This article belongs to the Section Civil Engineering)

Abstract

:
This manuscript investigates the bias introduced by scaling aftershock ground motions when evaluating the performance of structures subjected to earthquake sequences. The study focuses on different hysteretic behaviors exhibited by structures and selects eight intensity measures as scale indicators. A benchmark database comprising 274 recorded mainshock–aftershock ground motions is utilized for analysis. The findings reveal that scaling aftershock records using intensity measures such as SI (seismic intensity), PGV (peak ground velocity), IC (Arias intensity), and Sa (spectral acceleration) relative to mainshock records effectively controls the mean bias within 30% throughout the entire period range, given a maximum scale factor of 10.0. However, it is observed that the additional damage in systems exhibiting un-degrading hysteretic behavior is more significantly affected by aftershock ground motion scaling compared to systems with degrading hysteretic behavior. Furthermore, scaling aftershock ground motions upwards using relative Sa tends to overestimate the additional damage incurred by structures. These results emphasize the importance of considering the specific hysteretic behavior of structures when applying aftershock ground motion scaling, as well as selecting appropriate intensity measures for accurate evaluation of structural performance.

1. Introduction

Mainshock–aftershock (MSAS) sequences, which involve subsequent destructive aftershocks, have been observed in numerous historical earthquakes [1,2,3,4]. For example, notable MSAS sequences occurred during the 2008 M7.9 Wenchuan earthquake in Sichuan, China, and the 2010 M7.0 Darfield earthquake in New Zealand. In these cases, the time intervals between the mainshock and the subsequent destructive aftershocks were relatively short, leaving insufficient time for the damaged structures to undergo repairs before being subjected to further aftershocks. As a result, the damaged structures tend to experience more severe damage during the aftershocks.
The current seismic codes employed worldwide do not adequately account for the effects of aftershocks. Consequently, structures designed according to these codes may experience unacceptable levels of damage after an earthquake sequence. Since the current seismic codes do not consider the influence of aftershocks, they fail to address the increased vulnerability of structures to subsequent events in MSAS sequences. This highlights the need for improved understanding and incorporation of aftershock effects in seismic design practices to ensure more resilient and safe structures.
The impact of MSAS on the seismic behavior of structures has garnered significant attention in recent years [2,3,4,5,6,7,8,9,10,11,12,13,14,15,16,17,18,19,20,21,22,23,24,25,26,27,28,29,30,31,32,33,34,35,36,37,38,39,40,41,42,43,44,45,46,47]. The objective of these studies is to quantify the additional damage caused by aftershocks and propose methods to incorporate their effects into performance evaluation and seismic design. Numerous investigations [2,3,4,5,6,7,8,9,10,11,12,13,14,15,16,17,18] have focused on the inelastic response spectra of MSAS sequences, aiming to develop a straightforward tool for integrating aftershocks into seismic design or conducting rapid performance assessments. Additionally, many studies [19,20,21,22,23,24,25,26,27,28,29,30,31,32,33,34,35,36,37,38,39,40,41,42,43,44,45,46,47] have used multiple-degree-of-freedom (MDOF) structures to simulate the damage progression of structures under MSAS sequences and evaluate the vulnerability and economic losses induced by such sequences.
One of the key considerations regarding the impact of aftershocks is the production of MSAS ground motions. Given the limited availability of recorded MSAS ground motions, numerous studies have resorted to generating artificial MSAS ground motions [5,6,7,12,13,14,17,29,30,31,33,42,43]. This involves the random selection of aftershock seed and appropriate amplitude scaling. Additionally, several studies have used recorded MSAS ground motions [9,10,11,16,27,28,36,44,45,46,47]. However, regardless of whether artificial or recorded MSAS ground motions were employed in these studies, the aftershock ground motions were generally scaled to a specific intensity level. For example, Hatzigeorgiou and Beskos [5] and Hatzigeorgiou [6] scaled the peak ground acceleration (PGA) of the aftershock record to 0.8526 or 0.7767 times the PGA of its mainshock record. Zhai et al. [7] scaled the PGA of aftershock records to different levels (from 0.047 g to 0.2 g) based on the prediction results of the ground motion prediction equation. The relative PGA of the aftershock record (defined as the ratio of PGA of the aftershock record to that of the mainshock record) was scaled from 0.5 to 1.5 to study the effects of aftershocks [12,13], while the range was further broadened (i.e., from about 0.17 to 6.0) in Ref. [14]. Similarly, the relative spectral acceleration (Sa) of the aftershock record (defined as the ratio of Sa of the aftershock record to that of the mainshock record) was scaled from 0.5 to 1.0 in Refs. [11,16,17,41]. In order to assess the vulnerability of mainshock-damaged structures, the incremental dynamic analysis process was generally applied to aftershock ground motions, and the intensities (usually quantified by PGA or Sa) of aftershock records were scaled incrementally until the mainshock-damaged structure collapse [27,28,29,30,31,33,36,42,43,44,45,46,47].
However, in the aforementioned studies, large-scale factors are often required during the process of scaling aftershock records. Over-scaling aftershock records can introduce unacceptable bias in the additional damage induced by aftershocks and subsequently affect the cumulative damage caused by MSAS sequences. Moreover, the introduced bias significantly depends on the scale indicator and scale factor used. Therefore, it is crucial to carefully determine the scale indicator and scale factor applied to aftershock records to avoid unacceptable bias. Nevertheless, to our knowledge, no previous work has specifically focused on the bias introduced by aftershock ground motion scaling, and no existing method has been developed to quantitatively determine the scale indicator and scale factor for aftershock records.
The innovation of this study lies in assessing the impact of scaling ground motion on additional damage by quantifying the introduced bias caused by aftershock ground motion scaling. To achieve this, the study uses a benchmark database consisting of 274 recorded MSAS ground motions obtained from crustal earthquakes worldwide. Single-degree-of-freedom (SDOF) systems have been employed for assessing structure responses to select and scale ground motions [48,49]. Various SDOF systems with different hysteretic behaviors, such as stiffness degradation, pinching, and strength deterioration, are employed. The manuscript proposes a methodology to measure the bias introduced by aftershock ground motion scaling. Eight different intensity measures are chosen as alternative indicators for scaling, and the biases resulting from aftershock ground motion scaling are analyzed using statistical methods.

2. Ground Motions and Structures

This research study examines a total of 274 recorded MSAS ground motions obtained from various global crustal seismic sequences [16]. The ground motions are sourced from four prominent strong motion databases, namely the Pacific Earthquake Engineering Research Center (PEER) Next Generation Attenuation (NGA) relationships database, the European Strong-Motion dataset, the Center for Engineering Strong Motion Data (CESMD), and the China Earthquake Networks Center. To ensure consistency and comparability, the dataset used in this study excludes records from soft soil sites (i.e., average shear--wave velocity over the top 30 m of the site Vs30 is smaller than 180 m/s). Furthermore, only the strongest aftershock record is chosen from each MSAS sequence, based on the criterion of having the highest PGA. By using a diverse range of recorded MSAS ground motions from reputable databases, this study aims to provide a comprehensive analysis of the impact of scaling aftershock ground motions on the additional damage experienced by structures. The exclusion of soft soil sites and the selection of the strongest aftershock records contribute to a focused investigation and enhance the reliability and relevance of the findings.
In this manuscript, we employ inelastic SDOF systems as a means to simulate the response of structures under the influence of ground motions. The period of the inelastic system spans from 0.1 to 3.0 s, with an increment of 0.1 s. A viscous damping ratio of 5% is presumed for the system. The lateral strength of the system is ascertained by means of the strength reduction factor R, which is computed using the subsequent equation:
R = m S a ,   ms F y
where m is the mass of the system, which is assumed to be 1.0 herein; Sa,ms is the spectral acceleration of the mainshock ground motion; and Fy is the yield strength of the inelastic SDOF system. To examine the impacts of various yield strengths, three different values of the strength reduction factor R (i.e., R = 2, 4, and 6) are taken into account in this study.
Four distinct hysteretic systems are chosen for analysis: (1) the elastic-perfectly-plastic (EPP) system, (2) the modified Clough (MC) system, (3) the pinching (PH) system [50], and (4) the stiffness strength degradation (SSD) system [51]. The objective of employing these different hysteretic systems is to investigate the impact of stiffness degradation, pinching, and strength deterioration on the bias introduced by aftershock ground motion scaling. For a comprehensive understanding of the hysteretic systems and their parameter assumptions, please refer to the detailed description provided in Reference [16]. In this study, the modified Park–Ang damage index [51] is used to quantitatively assess the cumulative damage caused by the MSAS ground motions. This damage index is defined as follows:
D I = x m x y x u x y + β E H x u F y = μ 1 μ u 1 + β E H F y μ u x y
where μ is the ductility demand; xu is the ultimate deformation capacity of the structure under monotonic loadings; μu is the corresponding ultimate ductility capacity of the structure under monotonic loadings, defined as the ratio of the structure’s maximum deformation under monotonic loadings to its yield displacement, and given a value of 10 in this study; β is a positive dimensionless parameter to scale the effect of hysteretic energy dissipation on the final damage of the structure; and EH is the hysteretic energy dissipation of structure under ground motion. The median value of β (i.e., β = 0.15) [52] is used in this study. The additional damage D I induced by the aftershock is defined as:.
D I = D I seq D I ms
where DIseq is the damage index induced by MSAS ground motions, and DIms is the damage index induced by only mainshock ground motions.
In order to evaluate the potential impact caused by ground motions on various systems with different periods, eight distinct intensity measures are employed as alternative indicators of magnitude. The list of eight intensity measures is: (1) Spectral acceleration, Sa, i.e., the spectral acceleration at the fundamental period of the structure Sa(T1); (2) peak ground acceleration, PGA; (3) Arias intensity, IA [53]; (4) Park–Ang characteristic intensity, IC [54]; (5) Housner spectrum intensity, SI [55]; (6) peak ground velocity, PGV; (7) root-mean-square displacement, drms; (8) peak ground displacement, PGD. The relative intensity measure I M of the aftershock ground motion is defined as follows:
I M = I M as I M ms
where IMas and IMms are intensity measures of the aftershock and mainshock ground motions, respectively.

3. Methodology

This study aims to quantify the impact of ground motion scaling on additional damage by assessing the bias introduced through the scaling of aftershock records. The methodology for computing this bias is outlined in this section. To quantify the bias, the additional damage induced by aftershocks is compared between the original unscaled aftershock records and the scaled aftershock records. The variation in additional damage, quantified by D I in this study, versus relative intensity I M of the aftershock record is firstly studied. Figure 1 shows the variation of D I versus I M for a system with T = 1.0 s and R = 4. The results for S a and S I are both shown in Figure 1. It can be seen that there is no additional damage (i.e., D I  = 1.0) when the intensity of the aftershock record is small (e.g., I M 0.3 ). Then the additional damage gradually increases with the increase in I M . Based on the aforementioned observations, a theoretical model is proposed to elucidate the correlation between the extent of additional damage and the relative intensity of aftershocks:
λ ( D I | I M ) = { 1.0 I M I M 1 1.0 ( I M I M 1 ) b I M > I M 1
where λ ( D I | I M ) is the median additional damage on the condition of I M ; and I M 1 is the intensity threshold, beyond which aftershocks begin to induce the additional damage.
Equation (5) is first fitted for the unscaled database (i.e., benchmark database in this manuscript), and the regressed model is used as the benchmark model. Figure 1 also shows the fitted model (i.e., the benchmark model represented by the red straight line) for the system with T = 1.0 s and R = 4. Then each aftershock record in the benchmark database is scaled up (i.e., SF > 1.0) gradually with a series of factors from 1.5 to 10.0, and the corresponding values of D I are computed with the scaled ground motions. The scaled aftershock ground motions with SFj, whose I M is below the scale threshold (determined from benchmark database), are used to regress the model. In this study, the primary emphasis is placed on the case of scaling up the aftershock records. This is because in previous studies, the scaling of aftershock records has typically been performed to investigate the additional damage experienced by mainshock-damaged structures. Aftershock records with small intensities that do not induce additional damage are considered less critical for engineering structures and are therefore not the main focus of this research. Therefore, we scale up each aftershock record, i.e., SF > 1.0.
The disparities between the anticipated D I value of the benchmark model and the model created from scaled ground motions (referred to as the “scaled model” hereafter) indicate the bias introduced by scaling aftershock ground motions in terms of the median. The bias is computed as:
B = 1 n i = 1 n | 1 λ ^ i ,   scaled | S F j λ ^ i ,   unscaled |
where B is the bias introduced by aftershock ground motion scaling with an given scale factor SFj; n is the number of scaled aftershock ground motions, whose I M is below the scale threshold; λ ^ i ,   unscaled is the median D I predicted by the benchmark model, while λ ^ i ,   scaled | S F j is the median D I predicted by the scaled model with the given scale factor SFj. The flowchart in Figure 2 illustrates the process of calculating the bias as defined in Equation (6).
The availability of ground motions that can be effectively used is influenced by two factors: the usable spectral frequency of each record and scale threshold [56]. The scale threshold in Figure 2 is the maximum intensity measure (IM) of unscaled MSAS sequences. The IM of the ground motions after scaling with SF should not exceed the scale threshold. Figure 3a illustrates the quantity of unscaled mainshock–aftershock ground motions that can be used. The number of usable ground motions in Figure 3a is computed considering the usable spectral frequency of each record, defined as exceeding 1.25 times the high-pass corner frequency used in the record processing, as specified in the NGA database [57]. Figure 3b,c display the number of scaled aftershock ground motions that can be used for a period of T = 1.0 s, considering both the usable spectra frequency of each record and the scale threshold for eight different scale indicators. The number of usable ground motions in Figure 3b,c is determined based on the following principle: for a given IM, the IM of the ground motions should not exceed the maximum IM in the unscaled database (i.e., benchmark database). It is important to note that when the aftershock ground motions are scaled up using the PGA as the scaling indicator, the number of usable records decreases significantly, resulting in only 40 usable records for a scale factor of 10.0. However, for the other seven scale indicators, the number of usable records remains around or above 200 when the scale factor is 10.0.

4. Statistical Results

In this study, a total of about 1.1 million values of D I are computed (corresponding to 274 MSAS ground motions, 30 periods of system, 3 yield strengths, 4 kinds of hysteretic systems, and 11 SFs including SF = 1.0). It was found that no single IM could adequately capture the potential for damage caused by ground motions across systems with varying periods [58,59]. Thus, the whole-period region (i.e., 0.1–3.0 s in this manuscript) is first divided into three parts: short-period region (0.1–0.5 s), medium-period region (0.6–1.5 s), and long-period region (1.6–3.0 s), and the biases of systems in the same region are averaged. In Section 4.1, Section 4.2 and Section 4.3, we examine the bias present in a particular geographic area, drawing upon the findings of EPP systems. In Section 4.4, the bias is discussed from the point of view of the whole-period region, and the implications of hysteresis are also investigated.

4.1. Short-Period Region

Figure 4 illustrates the comparison between the benchmark model and scaled model for the EPP system with a radius (R) of 4 and a time period (T) of 0.2 s. The aftershock records are scaled using two different scaling factors, denoted as S a and P G A . Additionally, the values of the IMs derived from the scaled ground motions, which serve as the basis for the scaled model, are depicted in Figure 4. Furthermore, Figure 4 presents the outcomes of the bias introduced by the scaling of ground motions. It can be observed that using S a as the scale indicator produces a lower bias than P G A for this system after scaling aftershock records six times (i.e., SF = 6.0). For example, the bias corresponding to S a and SF = 6.0 is 11% (as shown in Figure 4b), while the bias for P G A and SF = 6.0 is 33% (as shown in Figure 4d). The platform section disappears in the scaled model, indicating the minimum I M in the scaled database exceeds the intensity threshold and aftershock start to induce additional damage.
The study computes the mean biases that arise from the adjustment of aftershock ground motions in EPP systems within the short-period range of 0.1 to 0.5 s. The results are depicted in Figure 5, which showcases the biases for eight distinct scale indicators. The results demonstrate a gradual increase in biases with higher SF. For the biases corresponding to S a and P G A , the results of different Rs are close to each other, and no clear trend can be observed among the different Rs. For the biases corresponding to the other six scale indicators, the biases increase with the decrease in R, indicating that using the other six scale indicators produces higher biases for stronger systems (e.g., R = 2). After incrementally scaling aftershock record up to ten times, the biases corresponding to S a and P G A are generally within 30% and 50%, respectively, while the biases corresponding the other six scale indicators can exceed 50%, especially for stronger systems (e.g., R = 2). It should be noted that using S I and P G V as scale indicators produces biases within 30% for systems with R being 4 or even larger, indicating that S I and P G V can be used as alternative scale indicators for systems with short periods and larger R (e.g., R > 4). However, although I A and I C are acceleration-related intensity measures, using them as scale indicators has no advantage of introducing lower biases.

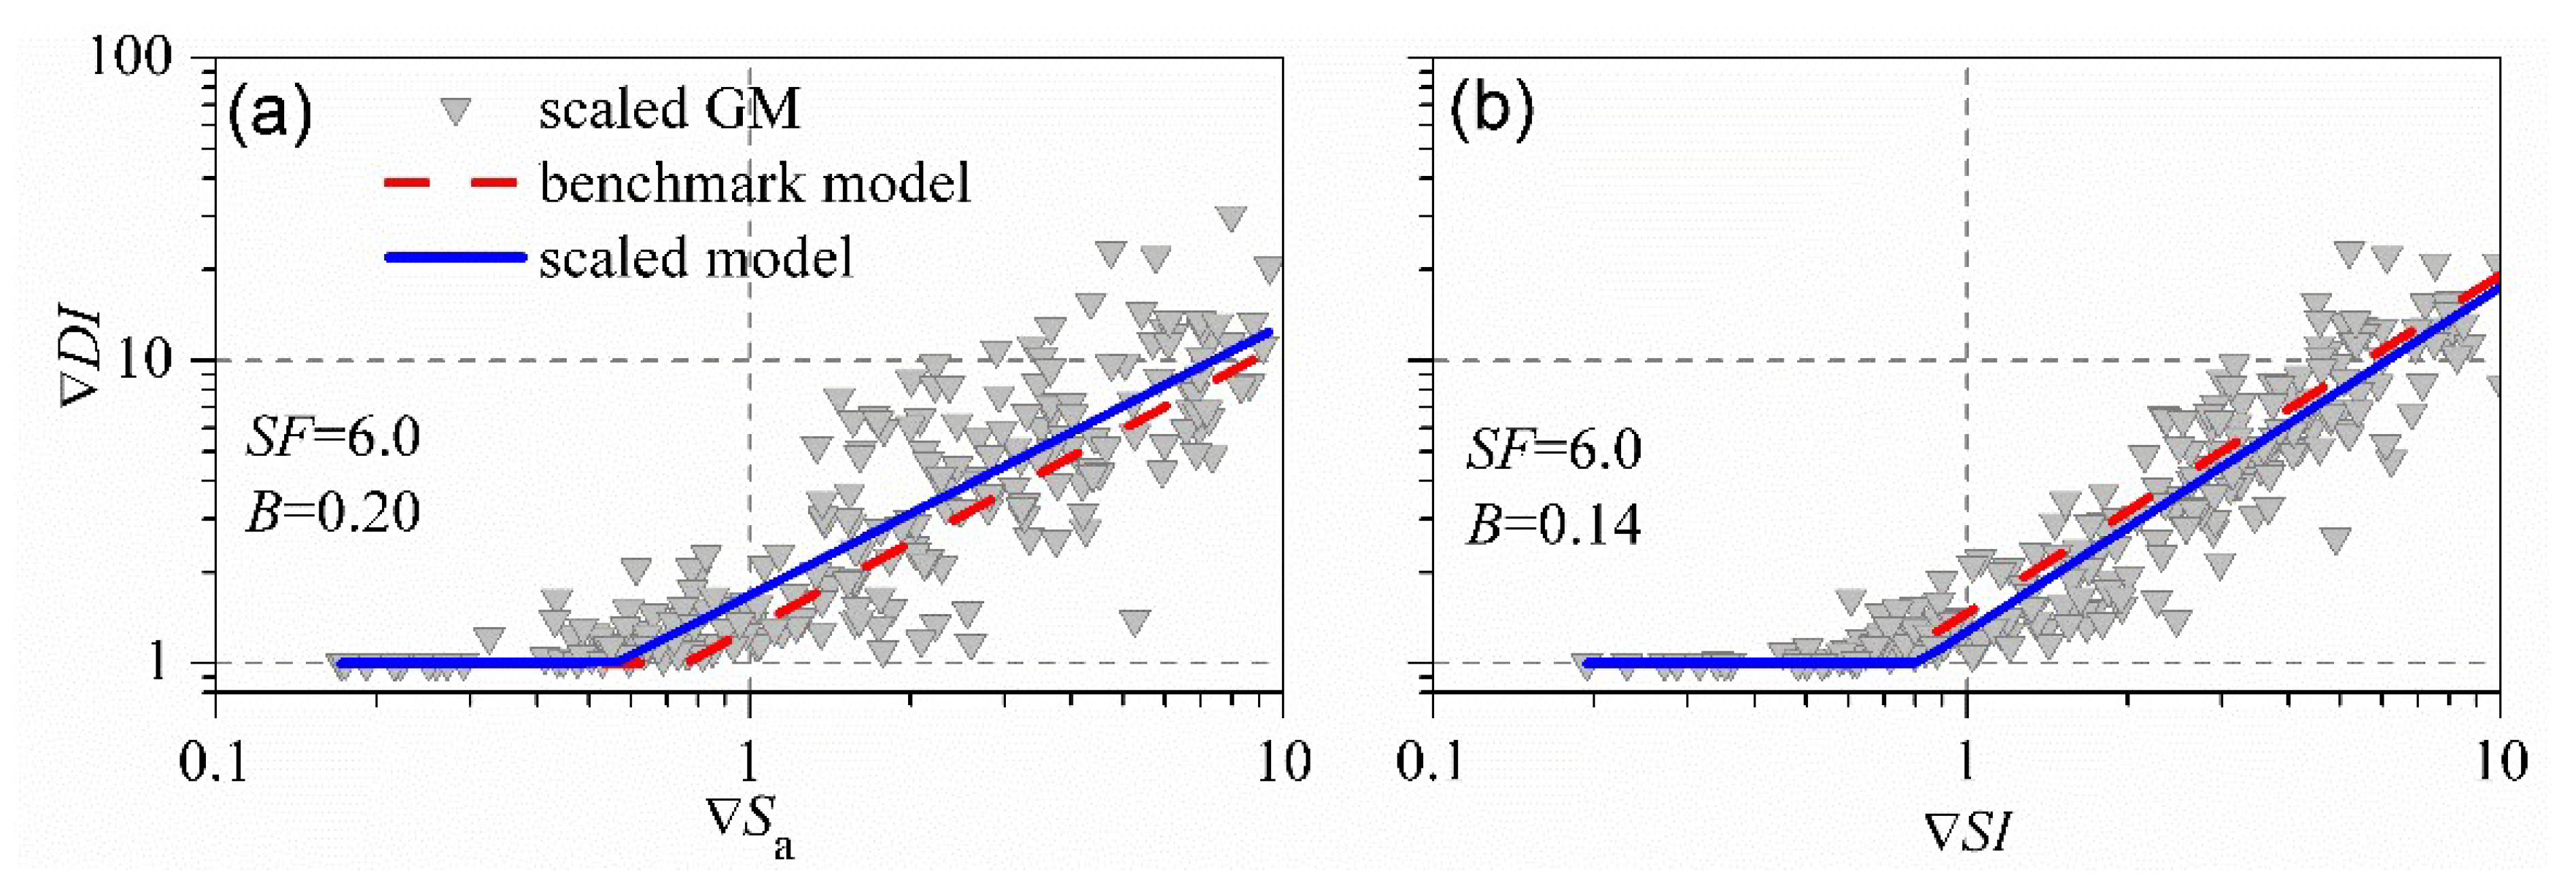
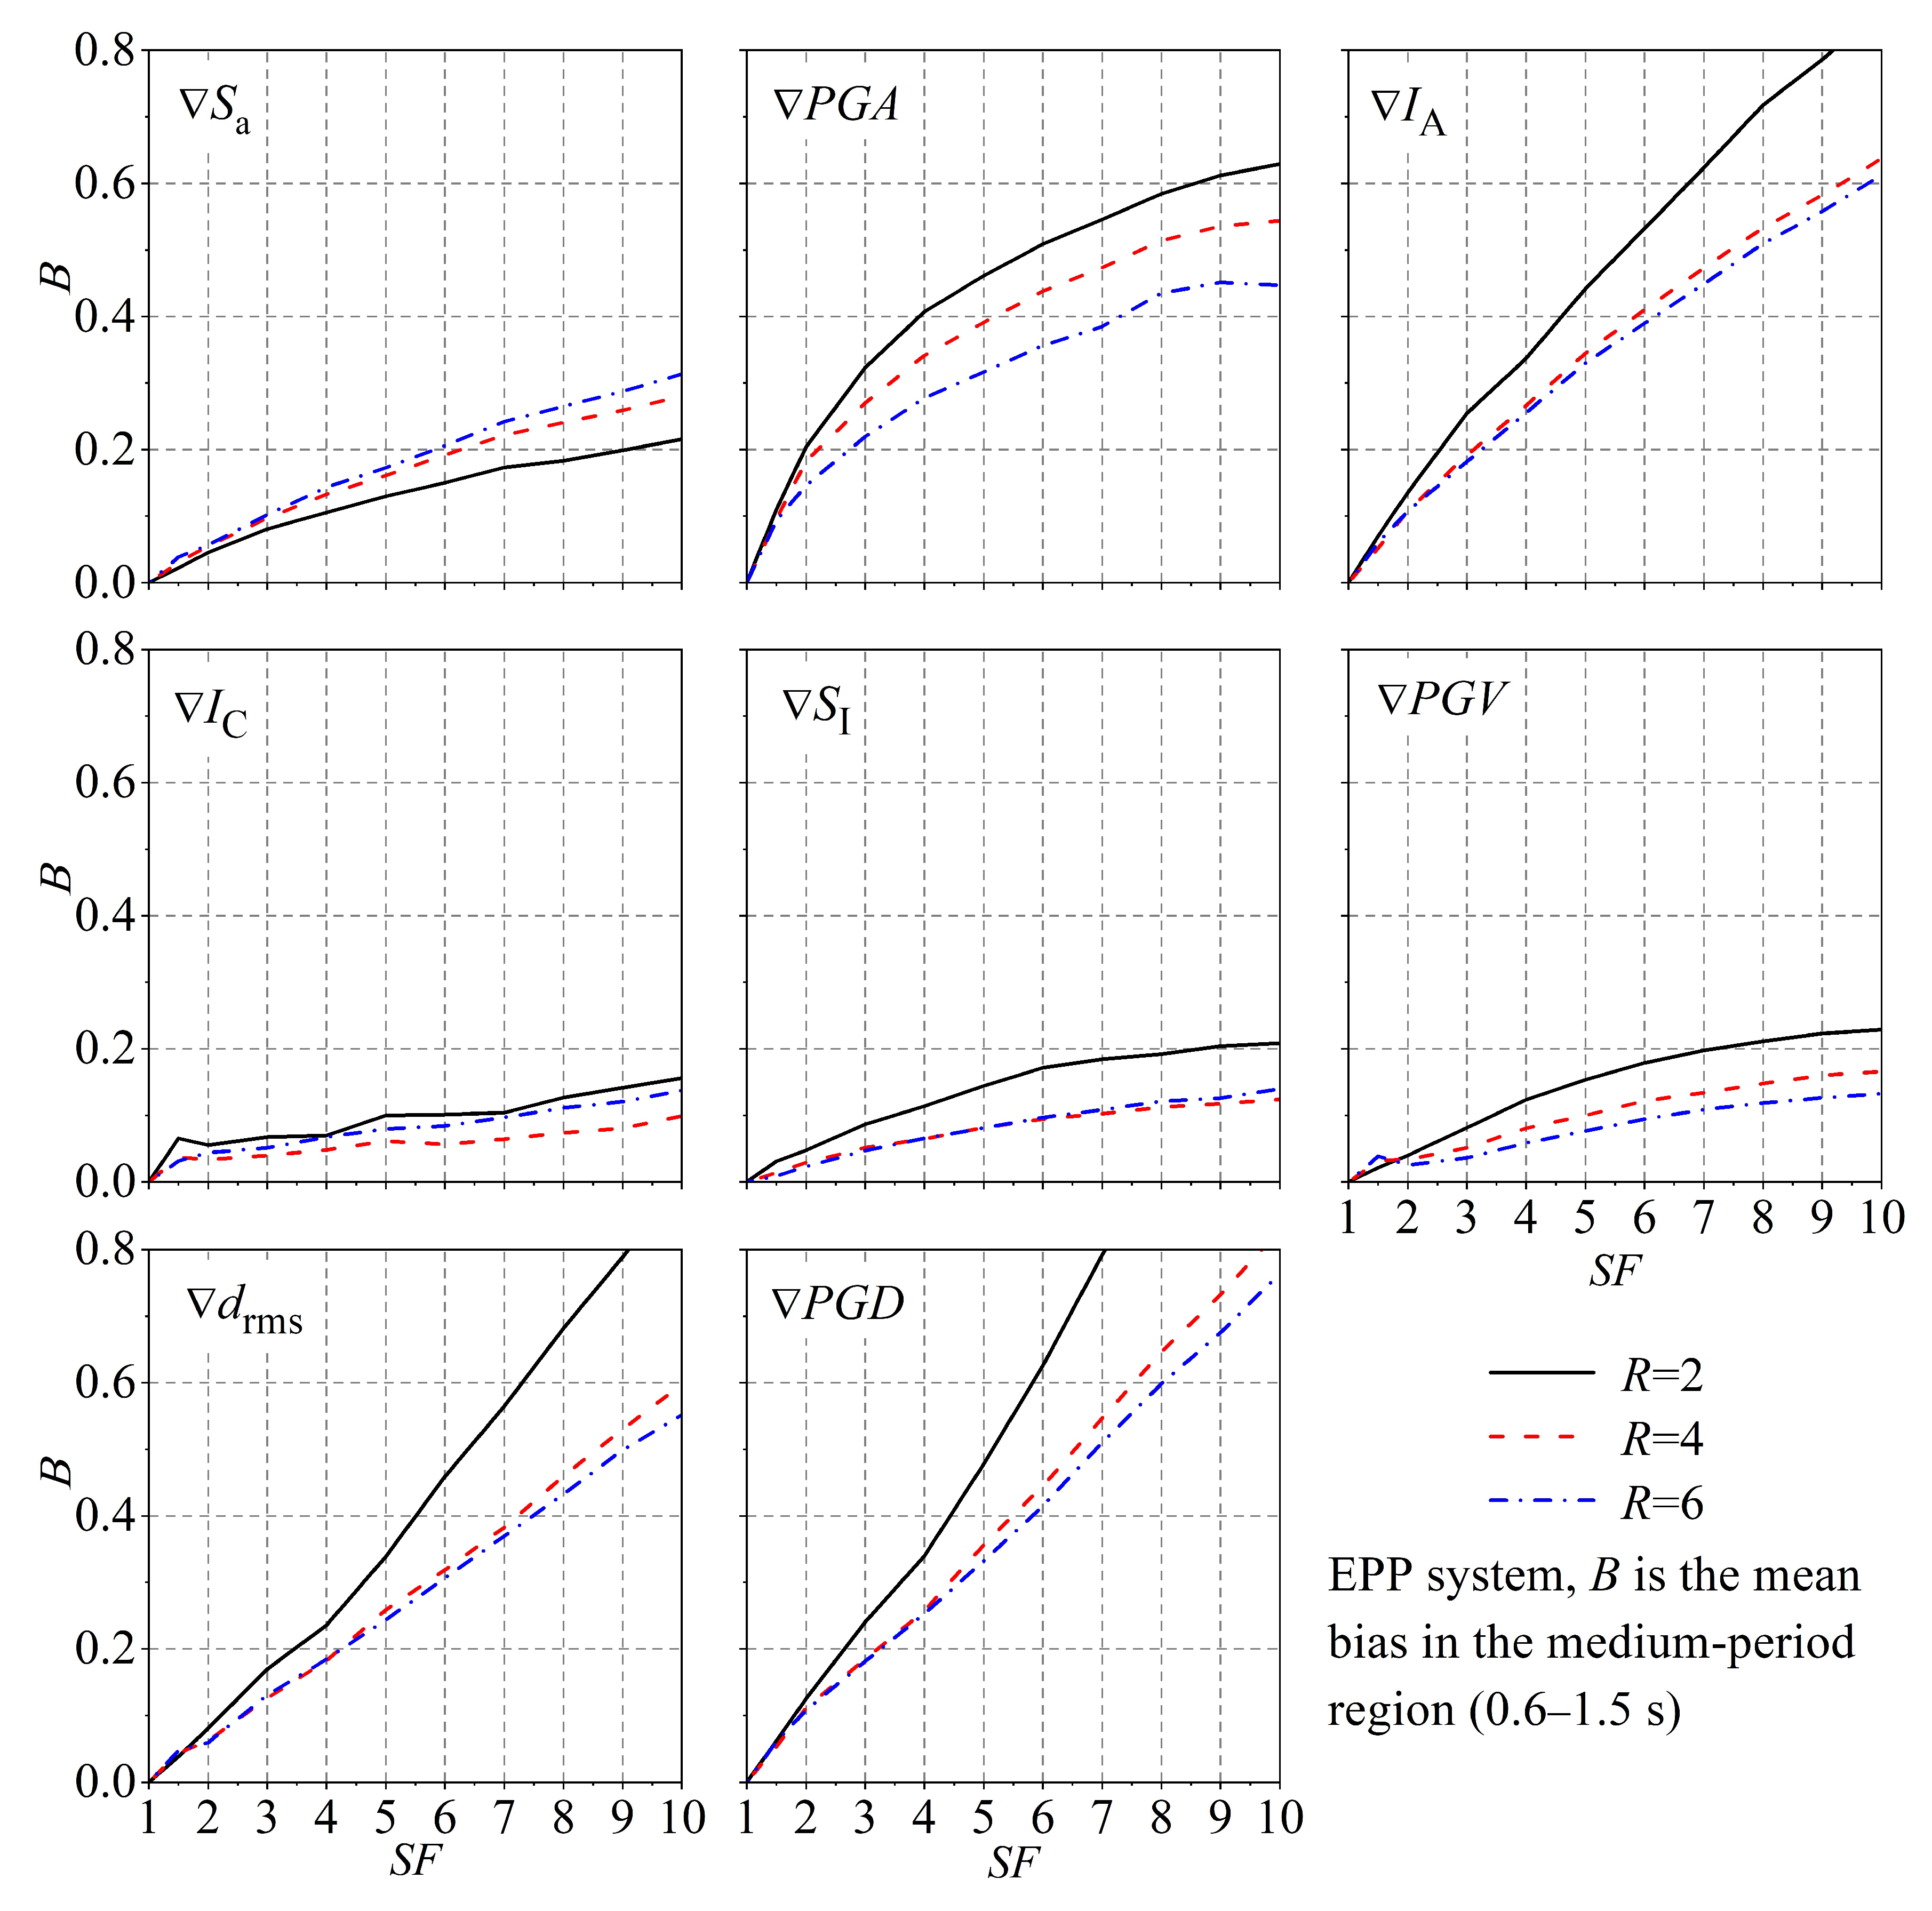
4.2. Medium-Period Region

Figure 6 illustrates the comparison between the benchmark model and the scaled model for the EPP system with a radius (R) of 4 and a period (T) of 1.0 s. The ground motions in the scaled model are adjusted using scaling factors of S a and S I , respectively. Figure 6 shows the comparison between the benchmark model and scaled model for the EPP system with R = 4 and T = 1.0 s, when the ground motions are scaled with S a and S I , respectively. The results for unscaled ground motions and fitted benchmark model can be found in Figure 1. Different from the system with T = 0.2 s (Figure 4), the platform section still appears in the scaled model, indicating that the minimum I M in the scaled database is below the intensity threshold, and some aftershock records in the scale database would induce no additional damage ( D I  = 1.0) in the medium-period region. Using S I as the scale indicator induces lower bias (i.e., 14%) than using S a as the scale indicator (20%).
In the medium-period range of 0.6–1.5 s, the average biases resulting from the scaling of ground motions are calculated for EPP systems. Figure 7 displays the findings for eight different scale indicators. In comparison with the results in Figure 5, significantly lower biases are observed in Figure 7, especially for the scale indicators of S I , P G V , S a , and I C . The biases are generally within 20% even for SF being 10.0, when S I and I C are used as the scaled indicators, and corresponding biases for P G V and S a are generally within 30%. It is interesting to note that I C shows superior performance as the scale indicator compared to other intensity measures, because it induces the lowest biases among eight different scale indicators. Although IC is computed based on acceleration [54], the dimension of IC is between acceleration and velocity. Consequently, IC is capable of effectively capturing the potential for damage caused by ground motion on systems that are sensitive to both acceleration and velocity. Moreover, the computation of IC incorporates the duration of ground motion, which contributes to the additional damage. The dependence of bias on the strength reduction factor R varies across the eight different scale indicators. For example, using S I as the scaling parameter tends to produce higher bias for stronger systems (e.g., R = 2), while using S a as the scale indicator tends to produce higher bias for weaker systems (e.g., R = 6).

4.3. Long-Period Region

Figure 8 shows a comparison between the benchmark model and the scaled model for the EPP system with a strength reduction factor R of 4 and a period T of 2.0 s. The ground motions are scaled using S a and P G D , respectively. Similar to the system with T = 1.0 s (Figure 6), the platform section appears in the scaled model, indicating that the minimum I M in the scaled database is below the intensity threshold, and some aftershock records in the scale database would induce no additional damage for systems (i.e., D I  = 1.0) in the long-period region. Using S a as the scale indicator induces lower bias (i.e., 26%) than using P G D as the scale indicator (39%). Based on a thorough analysis of the data presented in Figure 4, Figure 6, and Figure 8, it can be deduced that using S a as the scaling parameter to scale up aftershock records (SF > 1.0) tends to result in an overestimation of the additional damage. This can be observed in Figure 4b, Figure 6a, and Figure 8b, where the predicted outcomes of the scaled model (blue straight line) are generally higher than those of the benchmark model (red dashed line). On the other hand, for P G A and S I , scaling up the aftershock records tends to underestimate the additional damage. This can be observed in Figure 4d and Figure 6b, respectively, where the predicted outcomes of the scaled model (blue straight line) are generally lower than those of the benchmark model (red dashed line).
In the long-period range of 1.6–3.0 s, the average biases resulting from ground motion scaling are computed for EPP systems. The outcomes are presented in Figure 9 for eight distinct scale indicators. The scale indicators of S I , P G V , and I C demonstrate superior performance compared to the remaining five scale indicators, including those associated with ground displacement (e.g., P G D ). Furthermore, the biases associated with these three scale indicators typically fall within a range of 30%. The biases introduced by aftershock ground motion scaling with S a are generally within 40%. The performance of P G D is worse than the above scale indicators, and the corresponding biases can exceed 60%. Similar to the results in the short-period region, the performance of different scale indicators for the systems in the long-period region is also inconsistent with the correlation analysis of natural ground motions, because the scale indicators related to the ground displacement show worse performance than those related to the ground velocity.

4.4. Whole-Period Region

To comprehensively investigate the influence of scaling ground motion on the occurrence of further damage in systems characterized by different periods and lateral strengths, the biases arising from the scaling of aftershock ground motion are averaged over a span of 30 periods and three values of R. The average bias for systems exhibiting energy proportional to plastic deformation (EPP) across the complete spectrum of periods is illustrated in Figure 10. Furthermore, Figure 10 also presents the corresponding outcomes for systems with modified Clough (MC), pinching (PH), and strength softening and deterioration (SSD) hysteretic behaviors, in order to assess the effects of aftershock ground motion scaling on the occurrence of additional damage in systems exhibiting different hysteretic behavior.
The findings presented in Figure 10 demonstrate that the scaling of aftershock ground motion has a greater impact on the additional damage incurred by EPP systems, with the exception of cases where the scale indicators used are P G A and P G V . This is due to the fact that the biases observed in EPP systems are generally higher compared to systems that exhibit degradation or pinching behavior, such as MC systems, PH systems, or SSD systems. In the context of scale indicators, it is observed that biases within 20% are evident in degrading systems, whereas biases associated with EPP systems surpass this threshold. Furthermore, the relationship between bias and hysteretic systems varies depending on the specific scale indicators employed. For example, the differences among the biases of four hysteretic systems are large for P G D , while the corresponding differences are small for P G V . The scale indicators of S I , P G V , I C , and S a exhibit superior performance compared to the other four scale indicators, effectively managing bias within a range of 30%, even for large SF. In different engineering contexts, the permissible bias varies. Based on the results from Figure 10, and considering the allowed bias, the maximum allowable SF can be determined for different structures and IM.

5. Conclusions

This manuscript assesses the impact of ground motion scaling on the additional damage caused by aftershocks. The evaluation is conducted by quantifying the bias introduced through the scaling of aftershock ground motions. The research employs a variety of single-degree-of-freedom (SDOF) systems that display different types of hysteretic behaviors, including stiffness degradation, pinching, and strength deterioration. Additionally, a dataset of 274 recorded mainshock–aftershock (MSAS) ground motions obtained from global crustal earthquakes is employed to simulate the structural damage under these MSAS ground motions. Eight different intensity measures, including acceleration-related (i.e., PGA, IA, and IC), velocity-related (i.e., PGV), displacement-related (i.e., drms and PGD), and spectra-related (i.e., Sa and SI), are selected as alternative scale indicators for aftershock records. The primary discoveries can be summarized as follows:
(1)
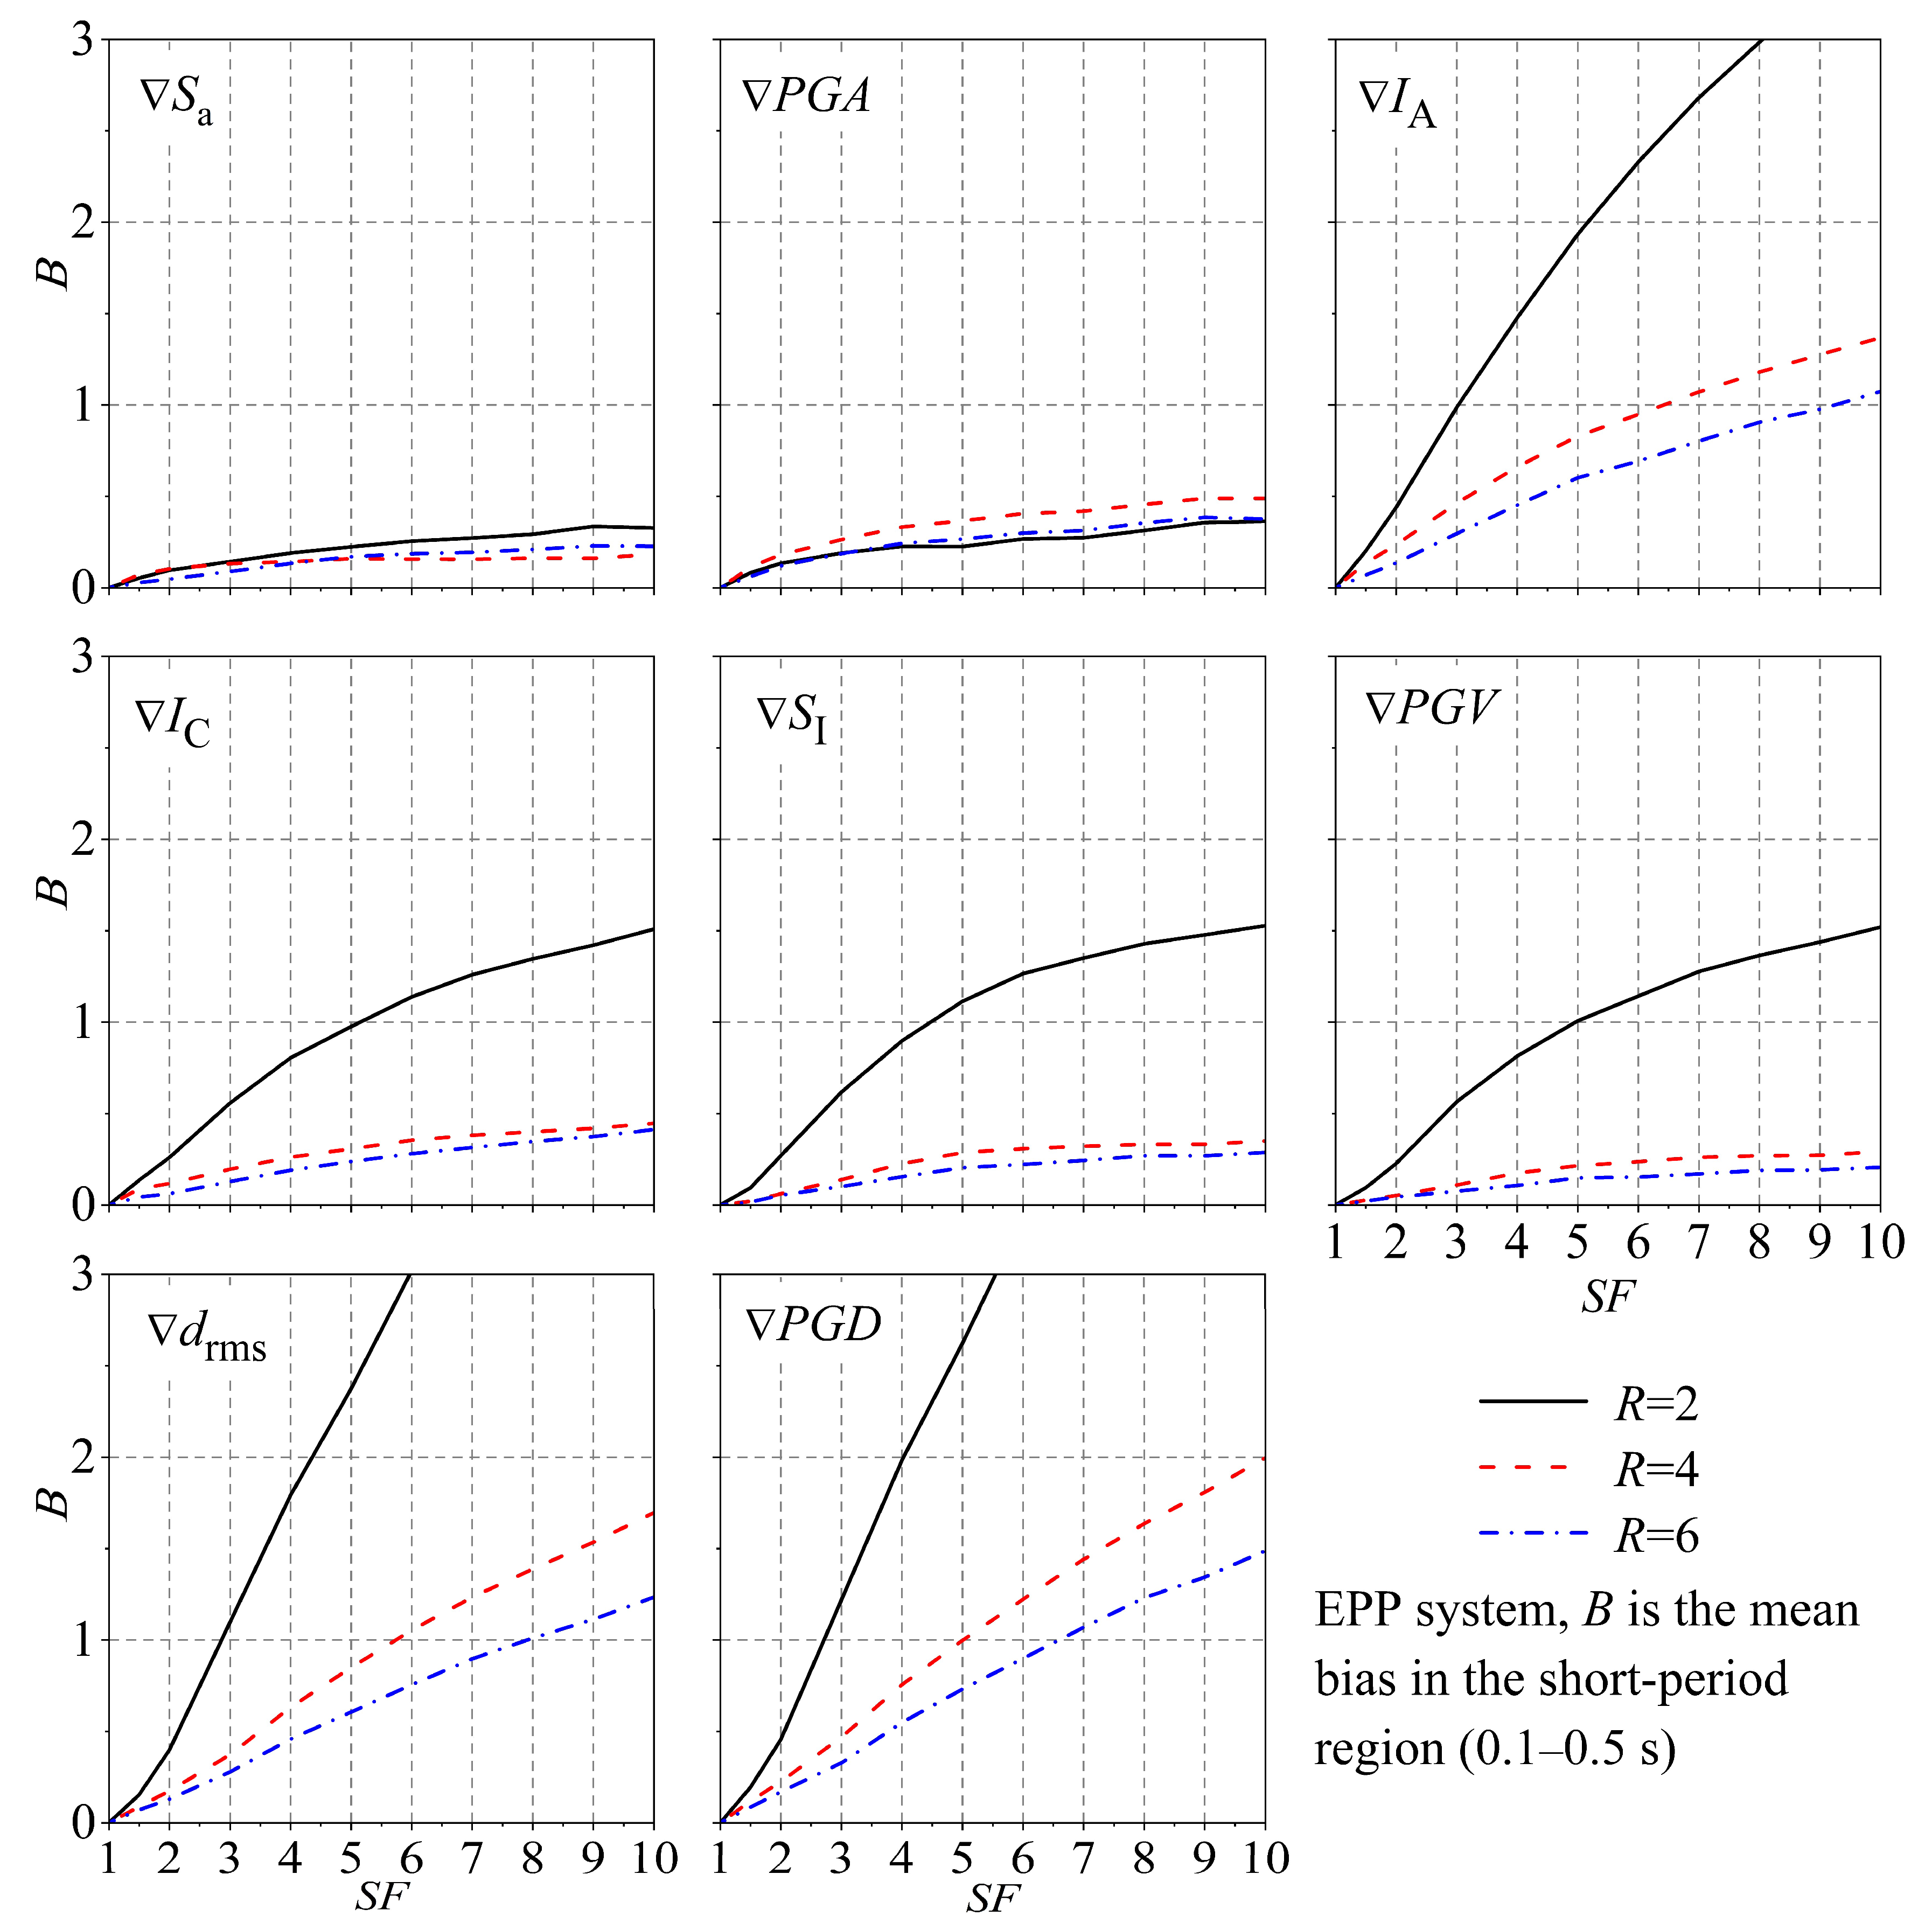
For systems in the short-period region, using S a as the scale indicator would introduce the biases within 30% for a scale factor as large as 10.0, while the corresponding bias increases to 50% when P G A is used as a scale indicator.
(2)
For systems in the medium-period region, the biases are generally within 20% even for a scale factor of 10.0, when S I and I C are used as the scaled indicators, and corresponding biases for P G V and S a are generally within 30%. The superiority of I C as the scale indicator can be explained by two points: the first is that the dimension of IC is between acceleration and velocity, and the second is that the computation of IC incorporates the effects of duration.
(3)
In the long-period region, the biases resulting from the scaling of aftershock ground motion with parameters such as S I , P G V , and I C are typically below 30% when the scale factor is less than 10.0. However, the bias associated with the parameter S a increases to 40%, which is still lower than the biases observed for displacement-related intensity measures (e.g., P G D ).
(4)
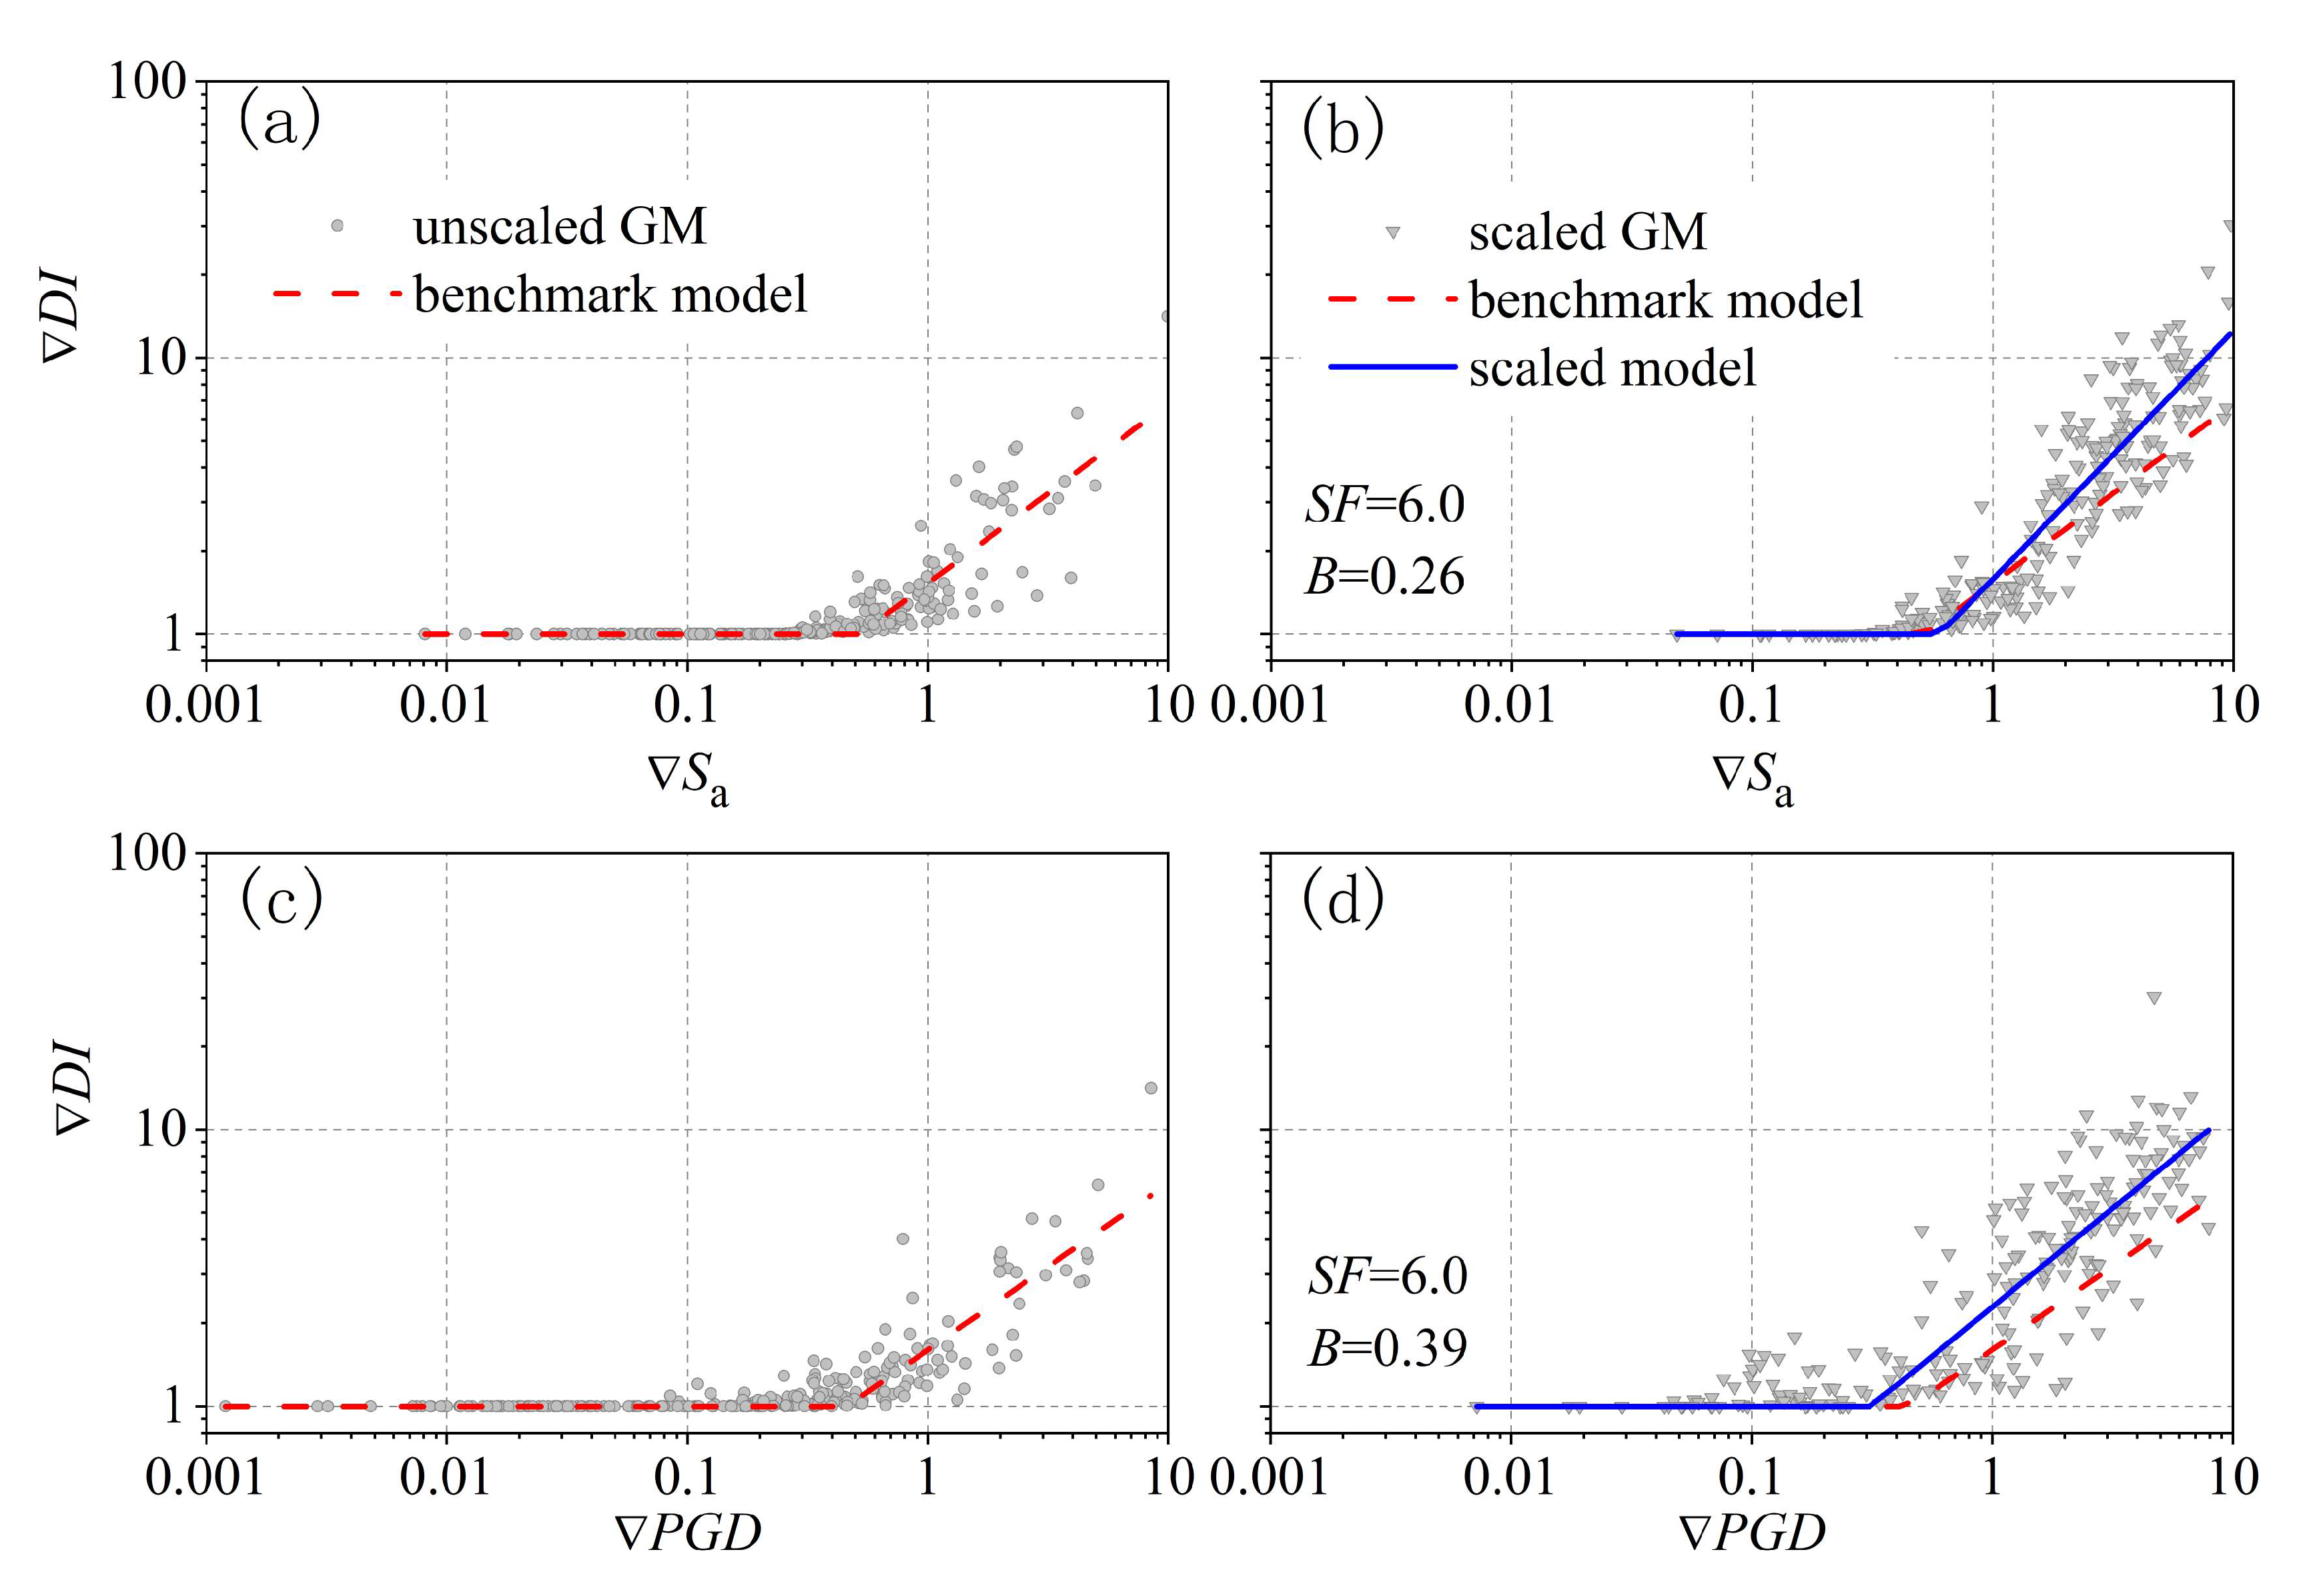
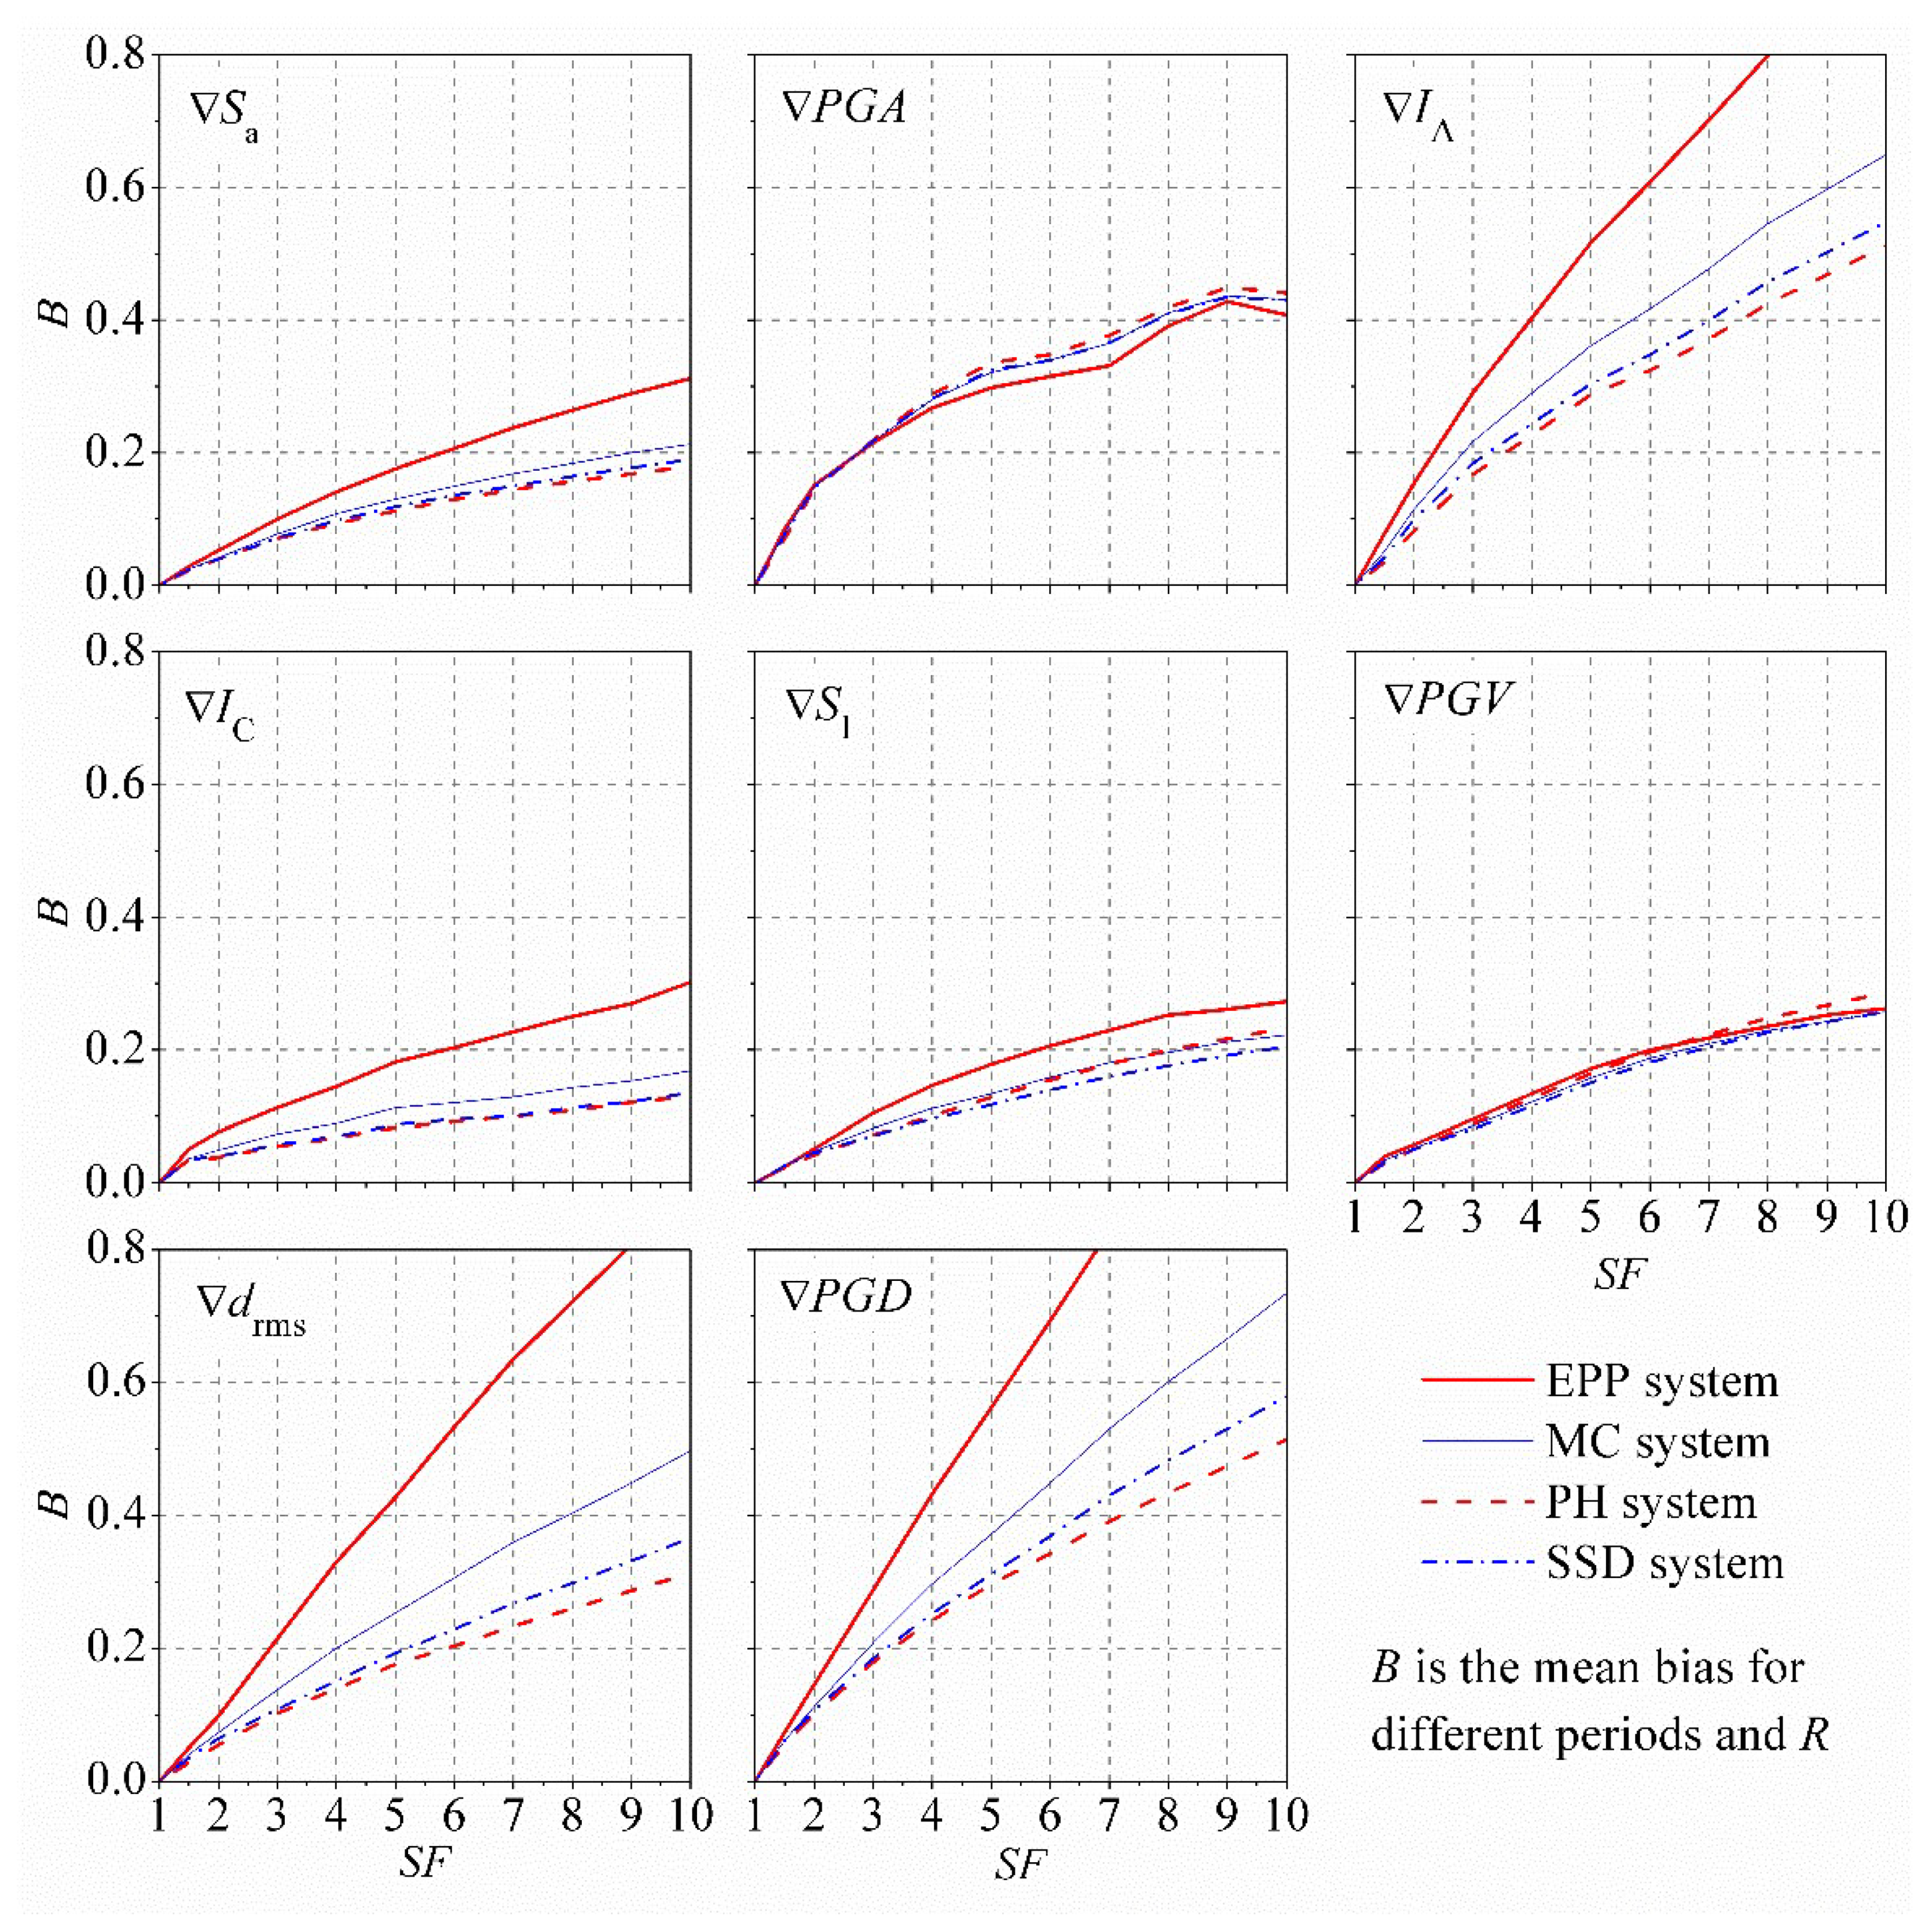
After studying the mean bias in the whole-period region, it can be found that the performance of S I , P G V , I C , and S a is superior to the other four scale indicators, and they can control the mean bias within 30% even for scale factors as large as 10.0. Aftershock ground motion scaling tends to introduce higher bias in the additional damage of EPP systems than degrading systems.
(5)
Scaling aftershock ground motions up (i.e., SF > 1.0) using S a tends to overestimate the additional damage to structures.
This study has some limitations that need to be further addressed in future research. Several SDOF systems were employed in this study to assess the impact of scaling ground motion on additional damage. The investigation needs to be expanded to multi-degree-of-freedom systems for more practical applications.

Author Contributions

Conceptualization, B.Z.; Software, B.Z.; Formal analysis, J.H.; Investigation, C.Y.; Resources, B.Z. and Q.K.; Data curation, J.H. and Q.K.; Writing—original draft, B.Z.; Writing—review & editing, J.H. and W.W.; Visualization, C.Y.; Supervision, W.W. All authors have read and agreed to the published version of the manuscript.

Funding

This investigation was supported by Shanghai Municipal Science and Technology Commission Project (Grant No. 22dz1200200 and 22dz1201400) and Shanghai Municipal Finance Project (Grant No. 090301). This support is greatly appreciated.

Institutional Review Board Statement

Not applicable.

Informed Consent Statement

Not applicable.

Data Availability Statement

Data are contained within the article.

Conflicts of Interest

The authors declare no conflict of interest.

References

  1. Ruiz-García, J. Mainshock-aftershock ground motion features and their influence in building’s seismic response. J. Earthq. Eng. 2012, 16, 719–737. [Google Scholar] [CrossRef]
  2. Moustafa, A.; Takewaki, I. Characterization of earthquake ground motion of multiple sequences. Earthq. Struct. 2012, 3, 629–647. [Google Scholar] [CrossRef]
  3. Yaghmaei-Sabegh, S. Time–frequency analysis of the 2012 double earthquakes records in north-west of iran. Bull. Earthq. Eng. 2014, 12, 585–606. [Google Scholar] [CrossRef]
  4. Yaghmaei-Sabegh, S.; Wang, H. Aftershock ground motion characteristics during the 2012 varzaghan–ahar doublet events, northwest of iran. Nat. Hazards 2022, 111, 2579–2599. [Google Scholar] [CrossRef]
  5. Hatzigeorgiou, G.D.; Beskos, D.E. Inelastic displacement ratios for SDOF structures subjected to repeated Earthquakes. Eng. Struct. 2009, 31, 2744–2755. [Google Scholar] [CrossRef]
  6. Hatzigeorgiou, G.D. Ductility demand spectra for multiple near- and far-fault earthquakes. Soil Dyn. Earthq. Eng. 2010, 30, 170–183. [Google Scholar] [CrossRef]
  7. Zhai, C.H.; Wen, W.P.; Chen, Z.; Li, S.; Xie, L.L. Damage spectra for the mainshock–aftershock sequence-type ground motions. Soil Dyn. Earthq. Eng. 2013, 45, 1–12. [Google Scholar] [CrossRef]
  8. Moustafa, A.; Takewaki, I. Response of nonlinear single-degree-of-freedom structures to random acceleration sequences. Eng. Struct. 2011, 33, 1251–1258. [Google Scholar] [CrossRef]
  9. Goda, K.; Taylor, C.A. Effects of aftershocks on peak ductility demand due to strong ground motion records from shallow crustal earthquakes. Earthq. Eng. Struct. Dyn. 2012, 41, 2311–2330. [Google Scholar] [CrossRef]
  10. Zhai, C.H.; Wen, W.P.; Li, S.; Chen, Z.; Chang, Z.; Xie, L.L. The damage investigation of inelastic SDOF structure under the mainshock-aftershock sequence-type ground motions. Soil Dyn. Earthq. Eng. 2014, 59, 30–41. [Google Scholar] [CrossRef]
  11. Zhai, C.; Wen, W.; Ji, D.; Li, S. The influences of aftershocks on the constant damage inelastic displacement ratio. Soil Dyn. Earthq. Eng. 2015, 79, 186–189. [Google Scholar] [CrossRef]
  12. Zhai, C.H.; Wen, W.P.; Li, S.; Xie, L.L. The ductility-based strength reduction factor for the mainshock-aftershock sequence-type ground motions. Bull. Earthq. Eng. 2015, 13, 2893–2914. [Google Scholar] [CrossRef]
  13. Zhang, Y.; Chen, J.; Sun, C. Damage-based strength reduction factor for nonlinear structures subjected to sequence-type ground motions. Soil Dyn. Earthq. Eng. 2017, 92, 298–311. [Google Scholar] [CrossRef]
  14. Pu, W.; Wu, M. Ductility demands and residual displacements of pinching hysteretic timber structures subjected to seismic sequences. Soil Dyn. Earthq. Eng. 2018, 114, 392–403. [Google Scholar] [CrossRef]
  15. Rinaldin, G.; Amadio, C. Effects of seismic sequences on masonry structures. Eng. Struct. 2018, 166, 227–239. [Google Scholar] [CrossRef]
  16. Wen, W.; Zhai, C.; Ji, D. Damage spectra of global crustal seismic sequences considering scaling issues of aftershock ground motions. Earthq. Eng. Struct. Dyn. 2018, 47, 2076–2093. [Google Scholar] [CrossRef]
  17. Wen, W.; Ji, D.; Zhai, C.; Li, X.; Sun, P. Damage spectra of the mainshock-aftershock ground motions at soft soil sites. Soil Dyn. Earthq. Eng. 2018, 115, 815–825. [Google Scholar] [CrossRef]
  18. Manafpour, A.R.; Kamrani, P. Performance capacity of damaged RC SDOF systems under multiple far-and near-field earthquakes. Soil Dyn. Earthq. Eng. 2019, 116, 164–173. [Google Scholar] [CrossRef]
  19. Hatzigeorgiou, G.D.; Liolios, A.A. Nonlinear behaviour of RC frames under repeated strong ground motions. Soil Dyn. Earthq. Eng. 2010, 30, 1010–1025. [Google Scholar] [CrossRef]
  20. Ruiz-García, J.; Negrete-Manriquez, J.C. Evaluation of drift demands in existing steel frames under as-recorded far-field and near-fault mainshock–aftershock seismic sequences. Eng. Struct. 2011, 33, 621–634. [Google Scholar] [CrossRef]
  21. Moustafa, A.; Takewaki, I. Modeling critical ground-motion sequences for inelastic structures. Adv. Struct. Eng. 2011, 13, 665–679. [Google Scholar] [CrossRef]
  22. Loulelis, D.; Hatzigeorgiou, G.D.; Beskos, D.E. Moment resisting steel frames under repeated earthquakes. Earthq. Struct. 2012, 3, 231–248. [Google Scholar] [CrossRef]
  23. Efraimiadou, S.; Hatzigeorgiou, G.D.; Beskos, D.E. Structural pounding between adjacent buildings subjected to strong ground motions. Part II: The effect of multiple earthquakes. Earthq. Eng. Struct. Dyn. 2013, 42, 1529–1545. [Google Scholar] [CrossRef]
  24. Faisal, A.; Majid, T.A.; Hatzigeorgiou, G.D. Investigation of story ductility demands of inelastic concrete frames subjected to repeated earthquakes. Soil Dyn. Earthq. Eng. 2013, 44, 42–53. [Google Scholar] [CrossRef]
  25. Goda, K.; Salami, M.R. Inelastic seismic demand estimation of wood-frame houses subjected to mainshock-aftershock sequences. Bull. Earthq. Eng. 2014, 12, 855–874. [Google Scholar] [CrossRef]
  26. Ruiz-García, J.; Marín, M.V.; Terán-Gilmore, A. Effect of seismic sequences in reinforced concrete frame buildings located in soft-soil sites. Soil Dyn. Earthq. Eng. 2014, 63, 56–68. [Google Scholar] [CrossRef]
  27. Shin, J.; Kim, J.; Lee, K. Seismic assessment of damaged piloti-type RC building subjected to successive earthquakes. Earthq. Eng. Struct. Dyn. 2014, 43, 1603–1619. [Google Scholar] [CrossRef]
  28. Goda, K. Record selection for aftershock incremental dynamic analysis. Earthq. Eng. Struct. Dyn. 2015, 44, 1157–1162. [Google Scholar] [CrossRef]
  29. Li, Y.; Song, R.; Van De Lindt, J.W. Collapse fragility of steel structures subjected to earthquake mainshock-aftershock sequences. J. Struct. Eng. 2014, 140, 04014095. [Google Scholar] [CrossRef]
  30. Raghunandan, M.; Liel, A.B.; Luco, N. Aftershock collapse vulnerability assessment of reinforced concrete frame structures. Earthq. Eng. Struct. Dyn. 2015, 44, 419–439. [Google Scholar] [CrossRef]
  31. Jeon, J.S.; DesRoches, R.; Lowes, L.N.; Brilakis, I. Framework of aftershock fragility assessment–case studies: Older California reinforced concrete building frames. Earthq. Eng. Struct. Dyn. 2015, 44, 2617–2636. [Google Scholar] [CrossRef]
  32. Ghosh, J.; Padgett, J.E.; Sánchez-Silva, M. Seismic damage accumulation in highway bridges in earthquake-prone regions. Earthq. Spectra 2015, 31, 115–135. [Google Scholar] [CrossRef]
  33. Jeon, J.S.; DesRoches, R.; Lee, D.H. Post-repair effect of column jackets on aftershock fragilities of damaged RC bridges subjected to successive earthquakes. Earthq. Eng. Struct. Dyn. 2016, 45, 1149–1168. [Google Scholar] [CrossRef]
  34. Hatzivassiliou, M.; Hatzigeorgiou, G.D. Seismic sequence effects on three-dimensional reinforced concrete buildings. Soil Dyn. Earthq. Eng. 2015, 72, 77–88. [Google Scholar] [CrossRef]
  35. Zhai, C.H.; Zheng, Z.; Li, S.; Xie, L.L. Seismic analyses of a RCC building under mainshock–aftershock seismic sequences. Soil Dyn. Earthq. Eng. 2015, 74, 46–55. [Google Scholar] [CrossRef]
  36. Ruiz-García, J.; Aguilar, J.D. Aftershock seismic assessment taking into account postmainshock residual drifts. Earthq. Eng. Struct. Dyn. 2015, 44, 1391–1407. [Google Scholar] [CrossRef]
  37. Hosseinpour, F.; Abdelnaby, A. Fragility curves for RC frames under multiple earthquakes. Soil Dyn. Earthq. Eng. 2017, 98, 222–234. [Google Scholar] [CrossRef]
  38. Jalayer, F.; Ebrahimian, H. Seismic risk assessment considering cumulative damage due to aftershocks. Earthq. Eng. Struct. Dyn. 2017, 46, 369–389. [Google Scholar] [CrossRef]
  39. Hosseinpour, F.; Abdelnaby, A.E. Effect of different aspects of multiple earthquakes on the nonlinear behavior of RC structures. Soil Dyn. Earthq. Eng. 2017, 92, 706–725. [Google Scholar] [CrossRef]
  40. Wang, G.; Wang, Y.; Lu, W.; Yan, P.; Zhou, W.; Chen, M. Damage demand assessment of mainshock-damaged concrete gravity dams subjected to aftershocks. Soil Dyn. Earthq. Eng. 2017, 98, 141–154. [Google Scholar] [CrossRef]
  41. Wen, W.; Zhai, C.; Ji, D.; Li, S.; Xie, L. Framework for the vulnerability assessment of structure under mainshock-aftershock sequences. Soil Dyn. Earthq. Eng. 2017, 101, 41–52. [Google Scholar] [CrossRef]
  42. Veismoradi, S.; Cheraghi, A.; Darvishan, E. Probabilistic mainshock-aftershock collapse risk assessment of buckling restrained braced frames. Soil Dyn. Earthq. Eng. 2018, 115, 205–216. [Google Scholar] [CrossRef]
  43. Furtado, A.; Rodrigues, H.; Varum, H.; Arêde, A. Mainshock-aftershock damage assessment of infilled RC structures. Eng. Struct. 2018, 175, 645–660. [Google Scholar] [CrossRef]
  44. Shokrabadi, M.; Burton, H.V. Building service life economic loss assessment under sequential seismic events. Earthq. Eng. Struct. Dyn. 2018, 47, 1864–1881. [Google Scholar] [CrossRef]
  45. Shokrabadi, M.; Burton, H.V. Risk-based assessment of aftershock and mainshock-aftershock seismic performance of reinforced concrete frames. Struct. Saf. 2018, 73, 64–74. [Google Scholar] [CrossRef]
  46. Shokrabadi, M.; Burton, H.V. Regional short-term and long-term risk and loss assessment under sequential seismic events. Eng. Struct. 2019, 185, 366–376. [Google Scholar] [CrossRef]
  47. Wen, W.; Zhang, M.; Zhai, C.; Liu, W. Resilience loss factor for evaluation and design considering the effects of aftershocks. Soil Dyn. Earthq. Eng. 2019, 116, 43–49. [Google Scholar] [CrossRef]
  48. Demir, A.; Palanci, M.; Kayhan, A.H. Probabilistic assessment for spectrally matched real ground motion records on distinct soil profiles by simulation of sdof systems. Earthq. Struct. 2021, 21, 395. [Google Scholar]
  49. Demir, A.; Palanci, M.; Kayhan, A.H. Evaluation the effect of amplitude scaling of real ground motions on seismic demands accounting different structural characteristics and soil classes. Bull. Earthq. Eng. 2023, 1–29. [Google Scholar] [CrossRef]
  50. Rahnama, M.; Krawinkler, H. Effects of Soft Soil and Hysteresis Model on Seismic Demands; John, A., Ed.; Blume Earthquake Engineering Center: Stanford, CA, USA, 1993. [Google Scholar]
  51. Kunnath, S.K.; Reinhorn, A.M.; Lobo, R.F. IDARC Version 3.0: A Program for the Inelastic Damage Analysis of Reinforced Concrete Structures; Technical report no. NCEER-92-0022; National Center for Earthquake Engineering Research, State University of New York at Buffalo: Amherst, NY, USA, 1992. [Google Scholar]
  52. Cosenza, E.; Manfredi, G.; Ramasco, R. The use of damage functionals in earthquake engineering: A comparison between different methods. Earthq. Eng. Struct. Dyn. 1993, 22, 855–868. [Google Scholar] [CrossRef]
  53. Arias, A. Arias, A. A measure of Earthquake Intensity. In Seismic Design for Nuclear Power Plants; Hansen, R.J., Ed.; Massachusetts Institute of Technology Press: Cambridge, MA, USA, 1970; pp. 438–483. [Google Scholar]
  54. Park, Y.J.; Ang, A.H.S.; Wen, Y.K. Seismic damage analysis of reinforced concrete buildings. J. Struct. Eng. 1985, 111, 740–757. [Google Scholar] [CrossRef]
  55. Housner, G.W. Spectrum Intensities of Strong-Motion Earthquakes. In Earthquake and Blast Effects on Structures; Earthquake Engineering Research Institute: Los Angeles, CA, USA, 1952; pp. 20–36. [Google Scholar]
  56. Ancheta, T.D.; Darragh, R.B.; Stewart, J.P.; Seyhan, E.; Silva, W.J.; Chiou, B.S.J.; Wooddell, K.E.; Graves, R.W.; Kottke, A.R.; Boore, D.M.; et al. NGA-West2 database. Earthq. Spectra 2014, 30, 989–1005. [Google Scholar] [CrossRef]
  57. Chiou, B.; Darragh, R.; Gregor, N.; Silva, W. Nga project strong-motion database. Earthq. Spectra 2008, 24, 23–44. [Google Scholar] [CrossRef]
  58. Riddell, R. On ground motion intensity indices. Earthq. Spectra 2007, 23, 147–173. [Google Scholar] [CrossRef]
  59. Zhai, C.H.; Xie, L.L. A new approach of selecting real input ground motions for seismic design: The most unfavourable real seismic design ground motions. Earthq. Eng. Struct. Dyn. 2007, 36, 1009–1027. [Google Scholar] [CrossRef]
Figure 1. Variation in additional damage versus relative intensity of the aftershock record for a system with T = 1.0 s and R = 4: (a) S a ; (b) S I .
Applsci 13 12515 g001
Figure 2. Flowchart for calculating the bias as stated in Equation (6).
Applsci 13 12515 g002
Figure 3. Relationship between the number of usable GMs versus other parameters: (a) unscaled ground motions; (b) scaled ground motions with Sa, PGA, IA, and IC; (c) scaled ground motions with SI, PGV, drms, and PGD.
Applsci 13 12515 g003
Figure 4. Comparison between the benchmark model and scaled model for the EPP system with R = 4 and T = 0.2 s: (a) S a , SF = 1.0; (b) S a , SF = 6.0; (c) P G A , SF = 1.0; (d) P G A , SF = 6.0.
Applsci 13 12515 g004
Figure 5. Potential distortion caused by the scaling of ground motion for EPP in the short-period range.
Applsci 13 12515 g005
Figure 6. Comparison between the benchmark model and scaled model for the EPP system with R = 4 and T = 1.0 s: (a) S a , SF = 6.0; (b) S I , SF = 6.0.
Applsci 13 12515 g006
Figure 7. Bias resulting from the scaling of ground motions assessed for the EPP systems in the medium-period region.
Applsci 13 12515 g007
Figure 8. Comparison between the benchmark model and scaled model for the EPP system with R = 4 and T = 2.0 s: (a) S a , SF = 1.0; (b) S a , SF = 6.0; (c) P G D , SF = 1.0; (d) P G D , SF = 6.0.
Applsci 13 12515 g008
Figure 9. Potential distortion caused by the scaling of ground motion for the EPP in the long-period range.
Applsci 13 12515 g009
Figure 10. Potential bias arising from the scaling of ground motion for systems operating within the entire period range.
Applsci 13 12515 g010
Disclaimer/Publisher’s Note: The statements, opinions and data contained in all publications are solely those of the individual author(s) and contributor(s) and not of MDPI and/or the editor(s). MDPI and/or the editor(s) disclaim responsibility for any injury to people or property resulting from any ideas, methods, instructions or products referred to in the content.

