Abstract
A simplified analysis method based on three-dimensional finite element analysis is proposed for the dynamic response of pile foundations under the action of vertically propagating SV waves. This method considers the impact of upper structure inertia force and free field deformation on the internal force of the pile separately. The former is considered using the Equivalent Base Shear Method, while the latter is analyzed using a finite element response acceleration method for underground structures. This study selected three seismic waves and their average values as loads to calculate the dynamic response of pile raft foundations. Through trial calculations, the seismic effect reduction coefficient range (0.35–0.4) of the representative values of the horizontal seismic inertia force corresponding to the upper structure was obtained. The error between the peak shear stress of the pile top obtained by the quasi-static method and the time history analysis results was less than 10%. The research results indicate that the proposed simplified analysis method can accurately obtain the peak shear stress and its distribution pattern of the pile body under horizontal seismic action while significantly improving the analysis efficiency. This method has high accuracy and efficiency in conducting seismic design comparison and analysis of multiple foundation schemes.
1. Introduction
Because the pile foundation can be adapted to different load types and geological conditions, it is widely used in high-rise buildings, bridges, wharves, nuclear power plants, and other large-scale projects. With the rapid development of pile foundation engineering and the need for earthquake prevention and disaster reduction, the dynamic response of pile foundations has become an important research highlight in the engineering field. The earthquake damage data [1,2] show the pile foundation has good seismic performance. But even if the stiffness of the pile is large and sufficient reinforcement for piles, it is hard to avoid damage under strong earthquakes. For bridge structures, pile foundation damage due to earthquakes often leads to serious consequences, such as falling beams [3,4,5,6]. For buildings, although it generally does not cause disastrous consequences such as the collapse of the superstructure, the concealment of pile foundation also makes it difficult to grasp the earthquake damage [7,8]. The setting of the pile foundation significantly improves the bearing capacity of the original foundation, so the failure of the pile may cause foundation instability. Therefore, it is necessary to study the dynamic characteristics of the pile foundation under the earthquake load.
At present, many methods have been accumulated in the research field of pile foundation dynamic response. According to the different simulation methods and calculation models of the soil around the pile, it can be divided into analytical method [9,10], experimental method [11,12], discrete model method [13,14], and numerical method [15,16]. For pile group foundation, the latter two methods are more widely used. The dynamic Winkler model of the foundation beam [17,18] belongs to the discrete model method. It uses continuously distributed and independent springs and dampers to replace the dynamic effect of the soil around the pile on the pile. It has the characteristics of a clear mechanical concept, simple and practical. The disadvantage is that the wave in the foundation cannot be considered, and the application is easily limited when the number of piles is large. The numerical analysis methods such as finite element [19,20] and boundary element [21,22] have higher accuracy than the discrete model method and can simulate more complex situations according to the actual situation, such as the heterogeneity of soil, the pile–soil interface, the coupled vibration of pile groups, and other complex vibration problems. Nevertheless, the numerical method has a huge amount of calculation and complicated boundary conditions, which makes it difficult to implement in practical engineering.
Existing tests and numerical calculations show that the deformation and internal force of the pile foundation are jointly affected by the motion interaction (free field deformation of the soil layer) and the inertial interaction (inertial force of the superstructure) [23,24]. In general, the two effects play equally important roles and should be considered. At present, the seismic design of the superstructure and underground pile foundation is calculated separately. In the seismic design of a pile foundation, the consideration of the horizontal shear force transmitted by the superstructure and the soil around the pile foundation at the same time is not well solved.
The dynamic time history analysis method can accurately analyze the seismic response of pile foundations and superstructures. However, due to the complexity of practical engineering problems, the use of time history analysis methods often requires a long computational time [25,26]. From the seismic calculation results of underground structures such as superstructures and rail transits, the quasi-static calculation method can give more practical calculation results, which is simple and has been widely used in engineering practice. Based on the seismic analysis methods of superstructure and underground structure, a simplified analysis method (Equivalent Base Shear Method + Response Acceleration Method, EBSM-RAM for short) for seismic design and analysis of pile foundation is proposed in this paper, aiming at the peak shear stress of pile top in the time history analysis results.
2. Methods (EBSM-RAM)
As mentioned above, the internal force of the pile body of the pile foundation is generally affected by inertial interaction and motion interaction. To simplify the calculation, the two effects are calculated separately, and then the combination is taken as the comprehensive effect of the earthquake load [27], as shown in Figure 1.
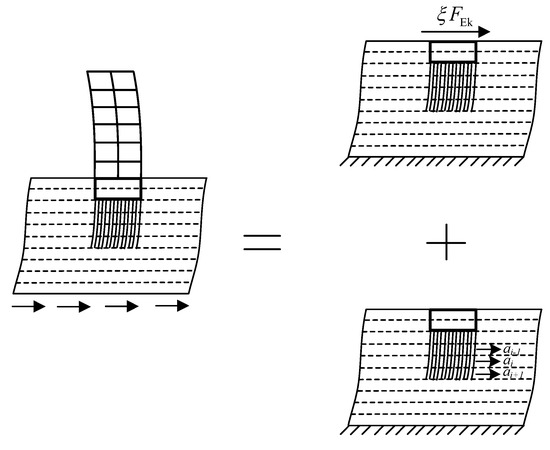
Figure 1.
Schematic diagram of EBSM-RAM.
The arrows in the figure indicate the horizontal ground motion at a certain time. FEK is the horizontal force generated by the superstructure on the top surface of the foundation, which represents the inertial force effect generated by the superstructure. The dynamic interaction between soil and pile foundation is a quasi-static calculation method in the seismic analysis of underground structures-finite element response acceleration method (RAM) [28], which takes the acceleration of soil layer generated by free field deformation as the load to consider the motion interaction. The research [1,2,16] shows that the failure of pile foundations mainly includes shear and bending failure at the pile top. The load effect studied in this paper is the shear stress of the pile body.
2.1. Solution of the Effect of Structural Inertial Force (EBSM)
The existing design and calculation methods for pile foundations to resist horizontal seismic action are to determine the horizontal and vertical seismic action of the structure on the pile foundation by using the bottom mode decomposition response spectrum method, bottom shear force method, or time history analysis under the assumption that the bottom of the structure is firmly supported, and use this as the static load to determine whether the bearing capacity of the pile foundation to resist horizontal earthquake meets the requirements. The EBSM (Figure 2) is easy to master and use, but the base shear obtained is the calculation result under constant load, while the peak result of time history analysis is the transient result, and the seismic damage effects of the two are completely different.
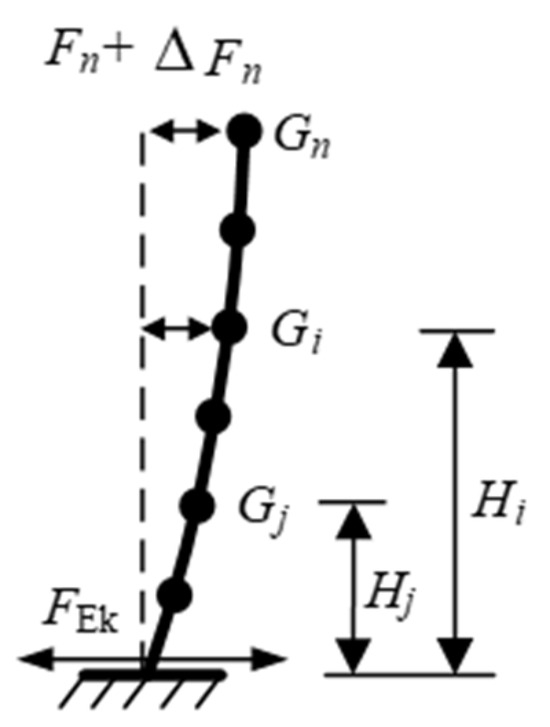
Figure 2.
Calculation diagram of horizontal earthquake action of structure (EBSM).
According to the provisions of the code for the seismic design of hydraulic structures [27], when the EBSM is used to calculate the seismic effect, the representative value of horizontal seismic inertial force will be reduced by the seismic effect reduction coefficient, which is generally 0.25. In consideration of the differences between ordinary buildings and hydraulic structures, to find suitable reduction factors, four groups of reduction factors are considered in the study, taking 0.25, 0.3, 0.35, and 0.4, respectively, for the calculation to optimize the reduction factors. When calculating the inertial action of the structure, only the foundation and the following parts are extracted, the reduced bottom shear force is applied to the top of the raft, and the static calculation is carried out to obtain the shear stress of the pile body.
2.2. Solution of Deformation Effect in Free Field (RAM)
The action effect of free field deformation, that is, the movement interaction between pile and soil, and the soil deformation will drive the deformation of the pile. Regarding the RAM [29,30,31] used in the seismic calculation of underground structures, inertial acceleration is applied to each layer of soil as a load to establish the maximum deformation of each layer of soil element closest to the free field movement (Figure 3). However, the pile foundation is different from the underground structure. There is an obvious boundary between the underground structure and the soil. The load is clearly and directly transmitted from the soil to the underground structure. For pile foundations (especially large-scale pile groups), there are many complex pile–soil interactions when the pile body is inserted into the soil, rather than the simple state of clear separation of soil and pile body like the conventional underground structure. Therefore, the method for determining the effective inertial acceleration of pile foundations should be different from that in the seismic calculation of underground structures and should be adjusted.
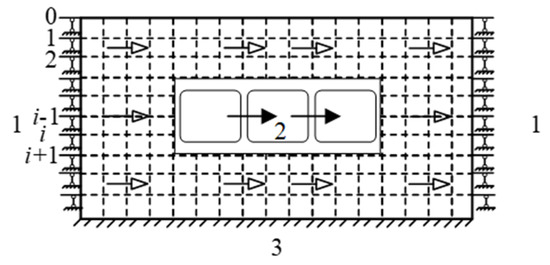
Figure 3.
RAM for lateral seismic response calculation (1-Horizontal slip boundary; 2-Inertial force; 3-Fixed boundary).
Firstly, the free field response of the soil layer is analyzed. The steady-state seismic response of multilayered linear elastic soil can be solved by a one-dimensional wave equation through programming [32], and the horizontal displacement Un of the nth layer soil can be obtained as shown in Formula (1):
where kn = ω/cn and cn = (μn/ρn)1/2 are the shear wave number and velocity of the nth layer, respectively, and En and Fn are the amplitude coefficients of the upward and downward waves in the nth layer medium, respectively. The detailed calculation process and derivation formula are recorded in the book [33] and will not be repeated here.
Then, the second-order derivative of Formula (1) on time t is obtained, which is the horizontal acceleration of the soil layer. In this paper, the acceleration of each soil layer corresponding to the maximum acceleration of the top soil layer in the free field analysis results is extracted as the effective inertial acceleration load in the quasi-static calculation, and the shear stress distribution of the pile body finally obtained is closest to the time history analysis results. The distribution of inertial acceleration load can best reflect the distribution characteristics of shear stress of pile body under real horizontal seismic load.
2.3. Effect Combination
Considering that the internal force of the pile body generated by the inertia force of the superstructure and the internal force of the pile body caused by the free field may not reach the peak at the same time, the calculation result of the EBSM-RAM is taken as
where Sj is the effect of the inertial force of the superstructure; Sf is the effect of free field deformation.
Dimensions of the pile foundation analysis model shall refer to the value of model size in response to acceleration method calculation in code for seismic design of urban rail transit structures [34]. That is, the bottom surface of the model is taken as the design seismic action reference plane, and the top surface is taken as the surface. The distance between the side boundary in the direction of applying the quasi-static load and the edge of the pile foundation is 2–3 times the horizontal dimension of the pile foundation. The horizontal dimension requirements in the non-load direction can be appropriately relaxed. The bottom surface of the calculation model adopts a fixed boundary, and the side surface adopts a horizontal sliding boundary.
2.4. Consideration of Nonlinear Characteristics of Soil
In practical engineering, the soil under a strong earthquake can easily show obvious nonlinear characteristics, which is mainly manifested in that the elastic modulus of soil will decrease with the increase of strain amplitude under cyclic shear load, and the damping will increase accordingly [35,36]. To ensure the calculation results better reflect the actual situation without significantly reducing the calculation efficiency, the equivalent shear modulus and Poisson’s ratio obtained from the one-dimensional soil free field analysis under the corresponding ground motion level are used for pseudo-static calculation in this paper.
3. Main Steps of the EBSM-RAM
Step 1: conduct free field analysis to determine the equivalent shear modulus of each layer of soil and extract the acceleration of each layer of soil as the effective inertial acceleration load when the acceleration of the top soil layer reaches the peak in the free field response process. Step 2: the maximum shear force generated at the bottom of the superstructure shall be calculated according to the Equivalent Base Shear Method in article 5.2.1 of the code for seismic design of buildings [37,38]. Step 3: refer to Section 2.3 for the three-dimensional calculation model of the pile foundation and surrounding soil. Step 4: using the acceleration load of each layer of soil obtained in step 1, the free field deformation effect of the foundation model in step 3 is solved to obtain Sj. Step 5: multiply the maximum base shear force obtained in step 2 by the reduction coefficient and apply it to the top of the raft in step 3 for static calculation and analysis to obtain Sf. Step 6: the Sj and Sf extracted from step 4 and step 5 are combined according to Formula (1) to obtain the final calculation result.
4. Example Verification
4.1. Model
The superstructure of the calculation model used in this study is a system composed of beam elements and mass elements, and the superstructure and pile foundation are connected by rigid domains. Through calculation, the maximum base shear force generated by the superstructure is 870 MN. The horizontal dimension of the raft is 55 m × 55 m, the thickness of the raft is 1.8 m, and 8 × 8 foundation piles are evenly distributed under the raft, of which the pile diameter is 3 m, the pile length is 37 m, and the pile spacing is about 3D (D is the pile diameter). The parameters of piles and rafts are shown in Table 1. Solid elements are used for piles, rafts, and soil and the interface shares nodes. The pile adopts an elastic model, while the soil adopts the Duncan–Zhang constitutive model. The Duncan –Zhang constitutive model belongs to a nonlinear elastic model, and the elastic modulus and Poisson’s ratio of the soil will change with the changes in the surrounding stress of the soil. An overview of the finite element model is shown in Figure 4.

Table 1.
Physical parameters of the pile, raft, and bedrock.
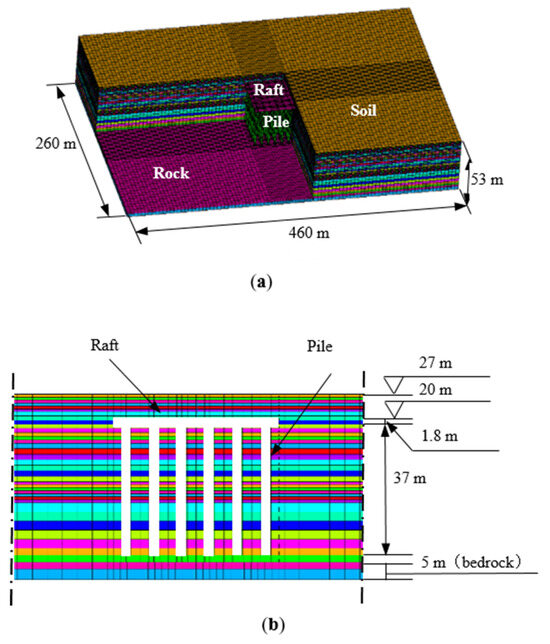
Figure 4.
Overview of the model: (a) 3D model diagram of pile raft foundation; (b) cross section diagram of pile raft foundation.
The horizontal dimension of the calculation model is approximately four times the size of the raft [39] (460 m in the X direction and 260 m in the Y direction), and the vertical dimension is 53 m. In this study, both the soil and pile were simulated using solid elements with shared nodes at the pile–soil–raft interface. The nonlinear deformation characteristics of this part of the soil were simulated by refining the soil grid around the pile. The maximum horizontal and vertical grid sizes of the model are 8 m and 3 m, respectively. The minimum grid sizes are 0.9 m and 1 m, respectively. Due to the large size of the model and considering that comparative analysis is the main focus of this study, the selection of grid size is based on meeting the requirements of dynamic calculation [40], that is, the vertical grid size (1/5–1/8)/Vs/fmax, and the horizontal grid size is taken as 3–5 hmax, where fmax is the highest frequency considered in the dynamic calculation, and hmax is the maximum value among the vertical grid sizes obtained for different soil layers.
The site class is III, the characteristic period is 0.65 s, and the rare earthquake action of 8 degrees seismic intensity is considered. According to the requirements of the specification, three sets of seismic waves, including the El Centro wave, Northridge wave, and artificial seismic wave (as shown in Figure 5), with the same size class and the corresponding peak value adjusted to 0.2 g, are used for the calculation to ensure that the actual ground motion is consistent with the one-dimensional wave theory solution. In the time history analysis, the model boundary adopts a viscoelastic artificial boundary [25].
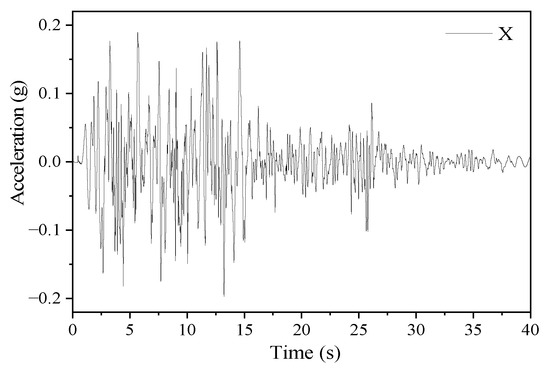
Figure 5.
Artificial seismic wave.
The basic parameters of the soil layer are shown in Table 2. The changes in the shear modulus and damping ratio of the soil with the shear strain are selected according to the sand, clay, and rock given by Idriss [41].
Table 2.
Soil parameters for free field computation.
4.2. Comparison of Shear Stress Distribution along the Pile Body
Figure 6 compares the distribution curves of shear stress along the pile length obtained by the dynamic time history analysis method and the EBSM-RAM. The distribution characteristics of shear stress in the pile body conform to the laws of existing research results [27]. In the figure, “NJL” represents the EBSM-RAM, and “Time” represents the time history analysis calculation result. The dynamic time history analysis results are extracted as the shear stress distribution of the central pile and the corner piles at the moment when the total shear force at the top of the pile is maximum, and “avg” represents the result of the average action of three seismic waves. In the quasi-static calculation results, “avg” represents the final result calculated by taking the average value of the equivalent shear modulus corresponding to three different seismic waves for the soil parameters and the average value of the three effective inertial accelerations for the shear load. In the time history analysis results, “avg” represents the average of the results calculated separately for three different seismic waves.
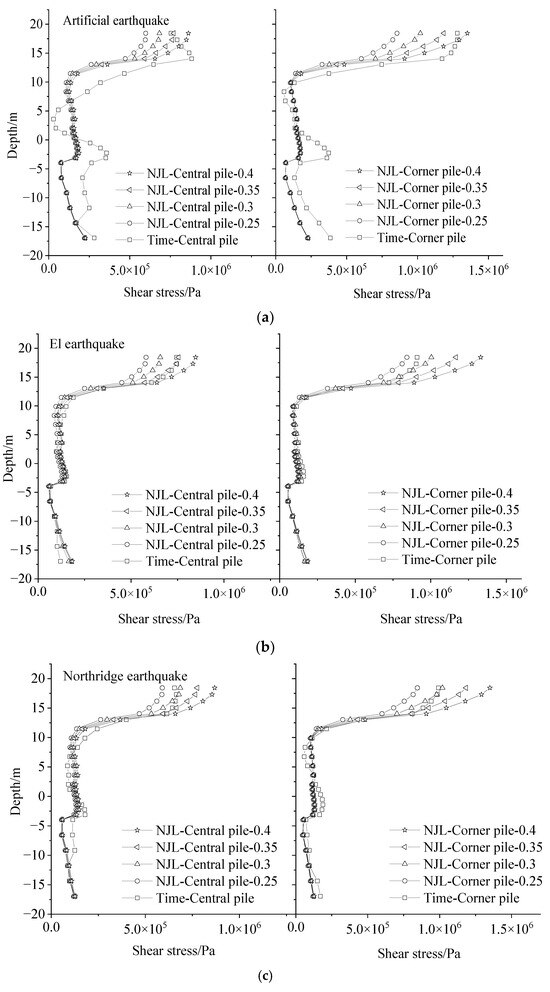
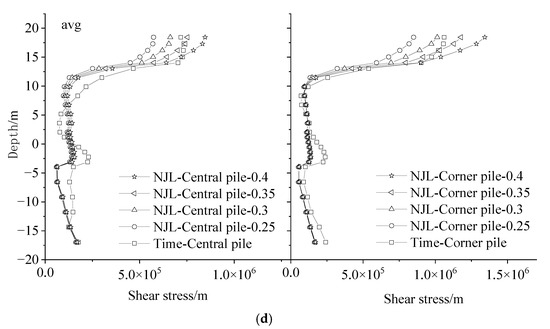
Figure 6.
Comparison of shear stress along the pile length between central pile and angle pile: (a) artificial earthquake; (b) EI earthquake; (c) Northridge earthquake; (d) avg.
Comparing Figure 6a–c, it can be seen that the time history analysis results under different earthquakes are similar but not the same, and the results of the time history analysis of a single seismic wave are different from those of the EBSM-RAM in some cases. However, when the average value of no less than three seismic wave inputs is taken according to the specification, the results of the simplified method and the time history analysis method are in good agreement, as shown in Figure 6d. Whether it is a corner pile or a center pile, for the comparison of the average results of the three seismic waves, the distribution characteristics of the shear stress along the pile body are very close to the results of the time history analysis, which can reflect the sudden change of shear stress in the soft and hard soil layers.
Comparing the calculation results corresponding to different reduction coefficients, it can be seen that the change of the reduction coefficient has a significant effect on the shear stress near the top of the pile, and the effect is less obvious the farther away from the top of the pile. This is because the reduction factor is mainly changed by the inertial load generated by the superstructure on the pile foundation, and the inertial load is gradually transmitted downward through the top of the pile. Hence, the impact of the top of the pile is naturally the most significant.
4.3. Comparison of Shear Stress Distribution at Pile Top of Pile Group
Figure 7 is the envelope diagram of the peak shear stress at the pile top of the pile group, in which the time history analysis results are taken from the peak value on the time history curve of the shear stress at the top of a single foundation pile. Similar to the conclusion in Section 4.2, the time history analysis results of different seismic wave inputs are pretty different from the results of the EBSM-RAM in some cases. However, when the average action results of three seismic inputs (Figure 7d) are taken, the results of quasi-static calculation and time history analysis are very close.
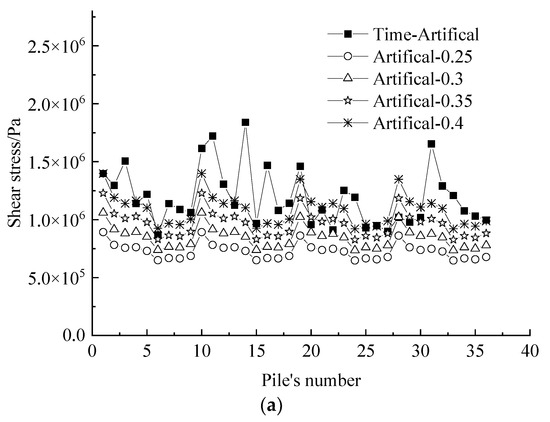
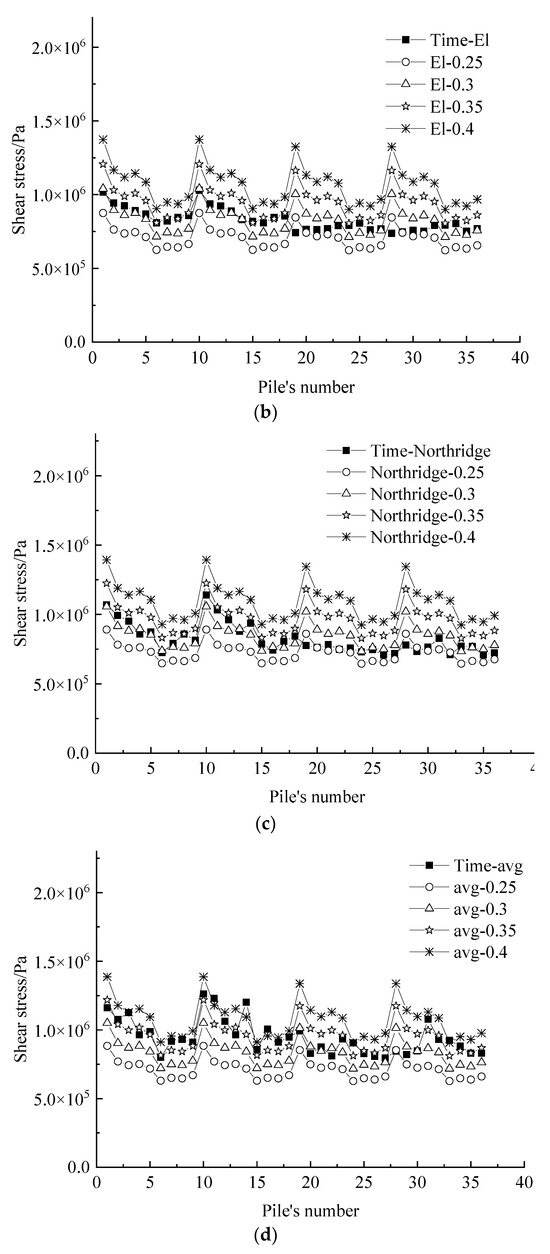
Figure 7.
Comparison of shear stress envelope of pile top of pile group: (a) artificial earthquake; (b) EI earthquake; (c) Northridge earthquake; (d) avg.
The results for the peak value of shear stress in the pile group of the quasi-static calculation and the time history analysis are compared in Table 3. It can be seen that with the increase in the reduction coefficient, the quasi-static calculation results gradually increase, and the gap with the time history analysis results gradually narrows until it grows in the opposite direction. When considering the average action of the three seismic waves, the quasi-static result corresponding to the reduction factor of 0.35 is the closest to the peak value of the time history analysis, with an error of only 3.41%; when it is 0.4, the quasi-static result exceeds the peak value of the time history analysis. It shows that the optimal reduction coefficient that can make the quasi-static calculation results and the peak value results of time history analysis most consistent is between 0.35 and 0.4.
Table 3.
The percentage error of maximum shear stress of the pile top was calculated by the EBSM-RAM and the time history analysis method.
Table 4 shows the envelope relationship between the quasi-static calculation results of all piles under the action of the average value of the three seismic waves and the peak results of the time history analysis. When the reduction factor is 0.25, the quasi-static pile top shear stress of 97% of the piles does not cover the peak results of the time history analysis. With the increase of the reduction factor, until it reaches 0.4, the probability of no envelope is only 11%, and the maximum error of the shear stress at the top of the pile without envelope is 9%. It can be considered that when the reduction factor is set to 0.4, the obtained quasi-static results envelop the peak results of the time history analysis.
Table 4.
Quasi-static results are less than the peak value of time history analysis probability and the percentage of error between them.
4.4. Components Computational Efficiency Comparison
It can be seen from the above results that the EBSM-RAM proposed in this paper can more accurately calculate the internal force of the pile foundation under the horizontal earthquake action. At the same time, the EBSM-RAM is more computationally efficient than the time history analysis. Taking the above example as an example, the number of finite element nodes in the time history analysis is about 300,000, the duration of the input seismic wave is 17 s, 15 cores (physical processor core of the central processing unit) are opened simultaneously on the server, and the calculation time of each example is about 24 h. When using the EBSM-RAM to calculate the same finite element model, the calculation time for each model is about 5 min. The scale of the finite element model will be larger than that of the above examples for different practical engineering problems. If the time history analysis method is used, the calculation time will be unacceptably large. The calculation time of the simplified method is much less affected by the size of the finite element model than that of the time history analysis method. The calculation results show that for multi-layer soil, the EBSM-RAM analysis method can reflect the position of shear stress mutation, especially for the foundation with apparent soft and hard layers. Since the EBSM-RAM is a static analysis, the calculation time is not affected by the duration of the seismic wave. Therefore, the simplified method has obvious advantages in expanding the analysis scale and improving the analysis efficiency.
5. Conclusions
Based on the seismic analysis methods of upper and underground structures, this article proposes an EBSM-RAM for the seismic design of pile foundations with the goal of peak shear stress at the pile top in the time history analysis results. The proposed method can accurately describe the shear stress and distribution characteristics of the pile body of a pile raft foundation under seismic loads, especially in situations where there are soft and hard layers within the pile length range that may lead to pile fracture and have high computational efficiency and accuracy. The following conclusions are drawn:
- (1)
- The results of the corner pile and the center pile by EBSM-RAM are closest to the time history analysis results when the reduction coefficient is around 0.35.
- (2)
- When the reduction coefficient is between 0.35 and 0.4, the quasi-static calculation results of the shear stress distribution at the top of the pile group are most similar to the results of the time history analysis, and the error of the peak shear stress at the top of the pile is less than 10%.
- (3)
- When conducting seismic design comparative analysis on multiple different pile raft foundations, only a reduction coefficient corresponding to the upper structure of the model needs to be calculated through time history analysis. This coefficient can be used for seismic calculation of other foundation schemes with the same upper structure. Avoiding multiple time history analysis calculations improves analysis efficiency.
Author Contributions
Conceptualization, methodology, software, validation, formal analysis, investigation, data curation, writing original draft, Y.X.; supervision, writing—review and editing, C.Y.; supervision, writing—review and editing, methodology, W.B. All authors have read and agreed to the published version of the manuscript.
Funding
This research was funded by the Scientific Research Project of North China University of Water Resources and Electric Power (Grant No. 202104009); Open Research Fund of Key Laboratory of Construction and Safety of Water Engineering of the Ministry of Water Resources, China Institute of Water Resources and Hydropower Research, Grant NO. 202110; IWHR Research & Development Support Program (No. SM0145B042021); National Natural Science Foundation of China (No. 51679092, No. 52179132); Henan Natural Science Fund for Distinguished Young Scholars (No. 232300421016); and Henan Provincial Key Young Teacher Training Program (No. 2021GGJS074).
Institutional Review Board Statement
Not applicable.
Informed Consent Statement
Not applicable.
Data Availability Statement
The data presented in this study are available on request from the corresponding author. The data are not publicly available due to structural confidentiality.
Conflicts of Interest
The authors declare no conflict of interest.
References
- Wang, X.W.; Shafieezadeh, A.; Ye, A. Optimal EDPs for Post-Earthquake Damage Assessment of Extended Pile-Shaft-Supported Bridges Subjected to Transverse Spreading. Earthq. Spectra 2019, 35, 1367–1396. [Google Scholar] [CrossRef]
- Motosaka, M.; Mitsuji, K. Building damage during the 2011 off the Pacific coast of Tohoku Earthquake. Soils Found. 2012, 52, 929–944. [Google Scholar] [CrossRef]
- Carey, T.J.; Mason, H.B.; Barbosa, A.R.; Scott, M.H. Multihazard Earthquake and Tsunami Effects on Soil-Foundation-Bridge Systems. J. Bridge Eng. 2019, 24, 04019004. [Google Scholar] [CrossRef]
- Gautam, D. On seismic vulnerability of highway bridges in Nepal: 1988 Udaypur earthquake (Mw 6.8) revisited. Soil Dyn. Earthq. Eng. 2017, 99, 168–171. [Google Scholar] [CrossRef]
- Zhang, X.; Guan, J.; Chen, X.; Pei, W.; Yu, S.; Wang, Y.; Wang, W. Effect of Permafrost on Seismic Performance of Railway Bridge Pile Foundation with Elevated Cap. Int. J. Struct. Stab. Dyn. 2022, 22, 2241002. [Google Scholar] [CrossRef]
- Zhang, X.; Yu, S.; Wang, W.; Guan, J.; Xu, Z.; Chen, X. Nonlinear Seismic Response of the Bridge Pile Foundation with Elevated and Embedded Caps in Frozen Soils. Soil Dyn. Earthq. Eng. 2022, 161, 107403. [Google Scholar] [CrossRef]
- Moehle, J. Preliminary Report on the Seismological and Engineering Aspects of the January 17; Northridge earthquake; Earthquake Engineering Research Center: Oakland, CA, USA, 1994. [Google Scholar]
- Seed, R.B. Preliminary Report on the Principal Geotechnical Aspects of the October 17; Loma Prieta earthquake; Earthquake Engineering Research Center, University of California: Oakland, CA, USA, 1990. [Google Scholar]
- Zheng, C.; Ding, X.; Sun, Y. Vertical Vibration of a Pipe Pile in Viscoelastic Soil Considering the Three-Dimensional Wave Effect of Soil. Int. J. Geomech. 2016, 16, 04015037. [Google Scholar] [CrossRef]
- Gupta, B.K.; Dipanjan, B. Timoshenko Beam Theory–Based Dynamic Analysis of Laterally Loaded Piles in Multilayered Viscoelastic Soil. J. Eng. Mech. 2018, 144, 04018091. [Google Scholar] [CrossRef]
- Zhang, X.; Yang, Z.J.; Chen, X.; Guan, J.; Pei, W.; Luo, T. Experimental Study of Frozen Soil Effect on Seismic Behavior of Bridge Pile Foundations in Cold Regions. Structures 2021, 32, 1752–1762. [Google Scholar] [CrossRef]
- Guan, Z.; Chen, X.; Li, J. Experimental Investigation of the Seismic Performance of Bridge Models with Conventional and Rocking Pile Group Foundations. Eng. Struct. 2018, 168, 889–902. [Google Scholar] [CrossRef]
- Tan, X.; Zhao, M.; Jin, Y.; Feng, L. Numerical Simulation of Loading Test on a Single Stone Column Using Discrete Element Method. J. Hunan Univ. 2019, 46, 106–113. [Google Scholar]
- Liu, Y. Numerical Simulation of Heat Transfer and Thermal Response Radius of Energy Piles; Zhejiang University of Technology: Hang Zhou, China, 2019. [Google Scholar]
- Deb, P.; Pal, S.K. Numerical Analysis of Piled Raft Foundation Under Combined Vertical and Lateral Loading. Ocean Eng. 2019, 190, 106431. [Google Scholar] [CrossRef]
- Bagheri, M.; Jamkhaneh, M.E.; Samali, B. Effect of Seismic Soil-Pile-Structure Interaction on Mid- and High-Rise Steel Buildings Resting on a Group of Pile Foundations. Int. J. Geomech. 2018, 18, 4018103.1–4018103.27. [Google Scholar] [CrossRef]
- Wang, J.; Gao, Y. Vertical Impedance of a Pile in Layered Saturated Viscoelastic Half-space Considering Radial Inhomogeneity. Soil Dyn. Earthq. Eng. 2018, 112, 107–117. [Google Scholar] [CrossRef]
- Brown, D.A.; O’Neill, M.W.; Hoit, M.; McVay, M.; El Naggar, M.H.; Chakraborty, S. Static and Dynamic Lateral Loading of Pile Groups; Nchrp Report 2001; National Academy Press: Washington, DC, USA, 2001. [Google Scholar]
- Zhang, Y.; Chen, X.; Zhang, X.; Ding, M.; Liu, Z. Nonlinear Response of the Pile Group Foundation for Lateral Loads Using Pushover Analysis. Earthq. Struct. 2020, 19, 273–286. [Google Scholar]
- Bas, S. Dynamic SSI Effects on Structural Response of a R/C Structure under Vertical Earthquake Motion. Earthq. Struct. 2021, 21, 333–349. [Google Scholar]
- Zhi, Y.; Zhong, H.; Yi, C. Time Effect of Vertically Loaded Piled Rafts in Layered Cross-Anisotropic Viscoelastic Saturated Soils. Comput. Geotech. 2020, 119, 103384. [Google Scholar]
- Pldab, A.; Jl, B.; Em, B. IBEM-FEM Model of a Piled Plate within a Transversely Isotropic Ialf-space. Eng. Anal. Bound. Elem. 2019, 101, 281–296. [Google Scholar]
- Özcebe, A.G.; Giretti, D.; Bozzoni, F.; Fioravante, V.; Lai, C.G. Centrifuge and Numerical Modelling of Earthquake-induced Soil Liquefaction under Free-field Conditions and by Considering Soil-Structure Interaction. Bull. Earthq. Eng. 2021, 19, 9–12. [Google Scholar] [CrossRef]
- Dhar, S.; Ozcebe, A.G.; Dasgupta, K.; Petrini, L.; Paolucci, R. Different Approaches for Numerical Modeling of Seismic Soil-Structure Interaction: Impacts on The Seismic Response of a Simplified Reinforced Concrete Integral Bridge. Earthq. Struct. 2019, 17, 373–385. [Google Scholar]
- Xie, Y.; Chi, S.; Wang, M. Influence of Variable Rigidity Design of Piled Raft Foundation on Seismic Performance of Buildings. Math. Probl. Eng. 2020, 2020, 1780197. [Google Scholar] [CrossRef]
- Wang, M.; Chi, S.; Xie, Y.; Zhou, X. Dynamic parameters inversion analysis of rockfill materials considering interaction effects based on weak earthquakes. Soil Dyn. Earthq. Eng. 2020, 130, 105968. [Google Scholar] [CrossRef]
- Song, E.X.; Wu, S.Y.; Liu, H.B. Quasi-static calculation method for seismic response of rigid pile composite foundation. Chin. J. Geotech. Eng. 2009, 31, 1723–1728. [Google Scholar]
- DL 5073-2000; Code for Seismic Design of Hydraulic Structures. China Electric Power Press: Beijing, China, 2001.
- Dong, Z.; Cai, B.; Yao, Y. Accuracy of the Response Acceleration Method and Response Displacement Method Considering Different Imbedding Depths of Underground Structures. J. Vib. Shock. 2017, 36, 216–220. [Google Scholar]
- Du, X.; Li, Y.; Xu, C. Review on Damage Cause and Disaster Mechanism of Daikai Subway Station During 1995 Osaka-Kobe Earthquake. Chin. J. Geotech. Eng. 2018, 40, 223–236. [Google Scholar]
- Xu, C.; Xu, Z.; Du, X. Comparative Study of Simplified Methods for Seismic Analysis of Underground Structure. Earthq. Eng. Eng. Dyn. 2017, 1, 65–80. [Google Scholar]
- Chang, D.; Cheng, S.; Wang, Y. One-dimensional Wave Equation Analyses for Pile Responses Subjected to Seismic Horizontal Ground Motions. Soils Found. 2014, 54, 313–328. [Google Scholar] [CrossRef]
- Du, X. Theories and Methods of Wave Motion for Engineering; Science Press: Beijing, China, 2009; pp. 1–70. [Google Scholar]
- GB 50909-2014; Code for Seismic Design of Urban Rail Transit Structures. China Planning Press: Beijing, China, 2014.
- Sundaram, R.; Gupta, S.; Gupa, S. Developments in Geotechnical Engineering; Springer: Singapore, 2019; pp. 369–393. [Google Scholar]
- Bhaduri, A.; Choudhury, D. Serviceability-based Finite-element Approach on Analyzing Combined Pile-raft Foundation. Int. J. Geomech 2020, 20, 04019178. [Google Scholar] [CrossRef]
- GB 50011-2010; Code for Seismic Design of Buildings. China Architecture& Building Press: Beijing, China, 2016.
- Jiang, K.X.; Liu, J.P.; Li, J.; Kang, S.B.; Jiang, K. Analysis method for horizontal seismic action of precast concrete floors. J. Civ. Environ. Eng. 2023, 1–13. (In Chinese) [Google Scholar]
- Hokmabadi, A.S.; Fatahi, B. Influence of foundation type on seismic performance of buildings considering soil–structure interaction. Int. J. Struct. Stab. Dyn. 2016, 16, 1550043. [Google Scholar] [CrossRef]
- Luo, C.; Yang, X.; Zhan, C.; Jin, X.; Ding, Z. Nonlinear 3D finite element analysis of soil–pile–structure interaction system subjected to horizontal earthquake excitation. Soil Dyn. Earthq. Eng. 2016, 84, 145–156. [Google Scholar] [CrossRef]
- Idriss, I. Response of Soft Soil Sites During Earthquakes; Memorial Symposium to honor Professor Harry Bolton Deed: Berkeley, CA, USA, 1990. [Google Scholar]
Disclaimer/Publisher’s Note: The statements, opinions and data contained in all publications are solely those of the individual author(s) and contributor(s) and not of MDPI and/or the editor(s). MDPI and/or the editor(s) disclaim responsibility for any injury to people or property resulting from any ideas, methods, instructions or products referred to in the content. |
© 2023 by the authors. Licensee MDPI, Basel, Switzerland. This article is an open access article distributed under the terms and conditions of the Creative Commons Attribution (CC BY) license (https://creativecommons.org/licenses/by/4.0/).