

Toward Lightweight Diabetic Retinopathy Classification: A Knowledge Distillation Approach for Resource-Constrained Settings
 ,
,
Abstract
:1. Introduction
- The research involves various image preprocessing techniques to enhance image quality and highlight key areas of interest in the image.
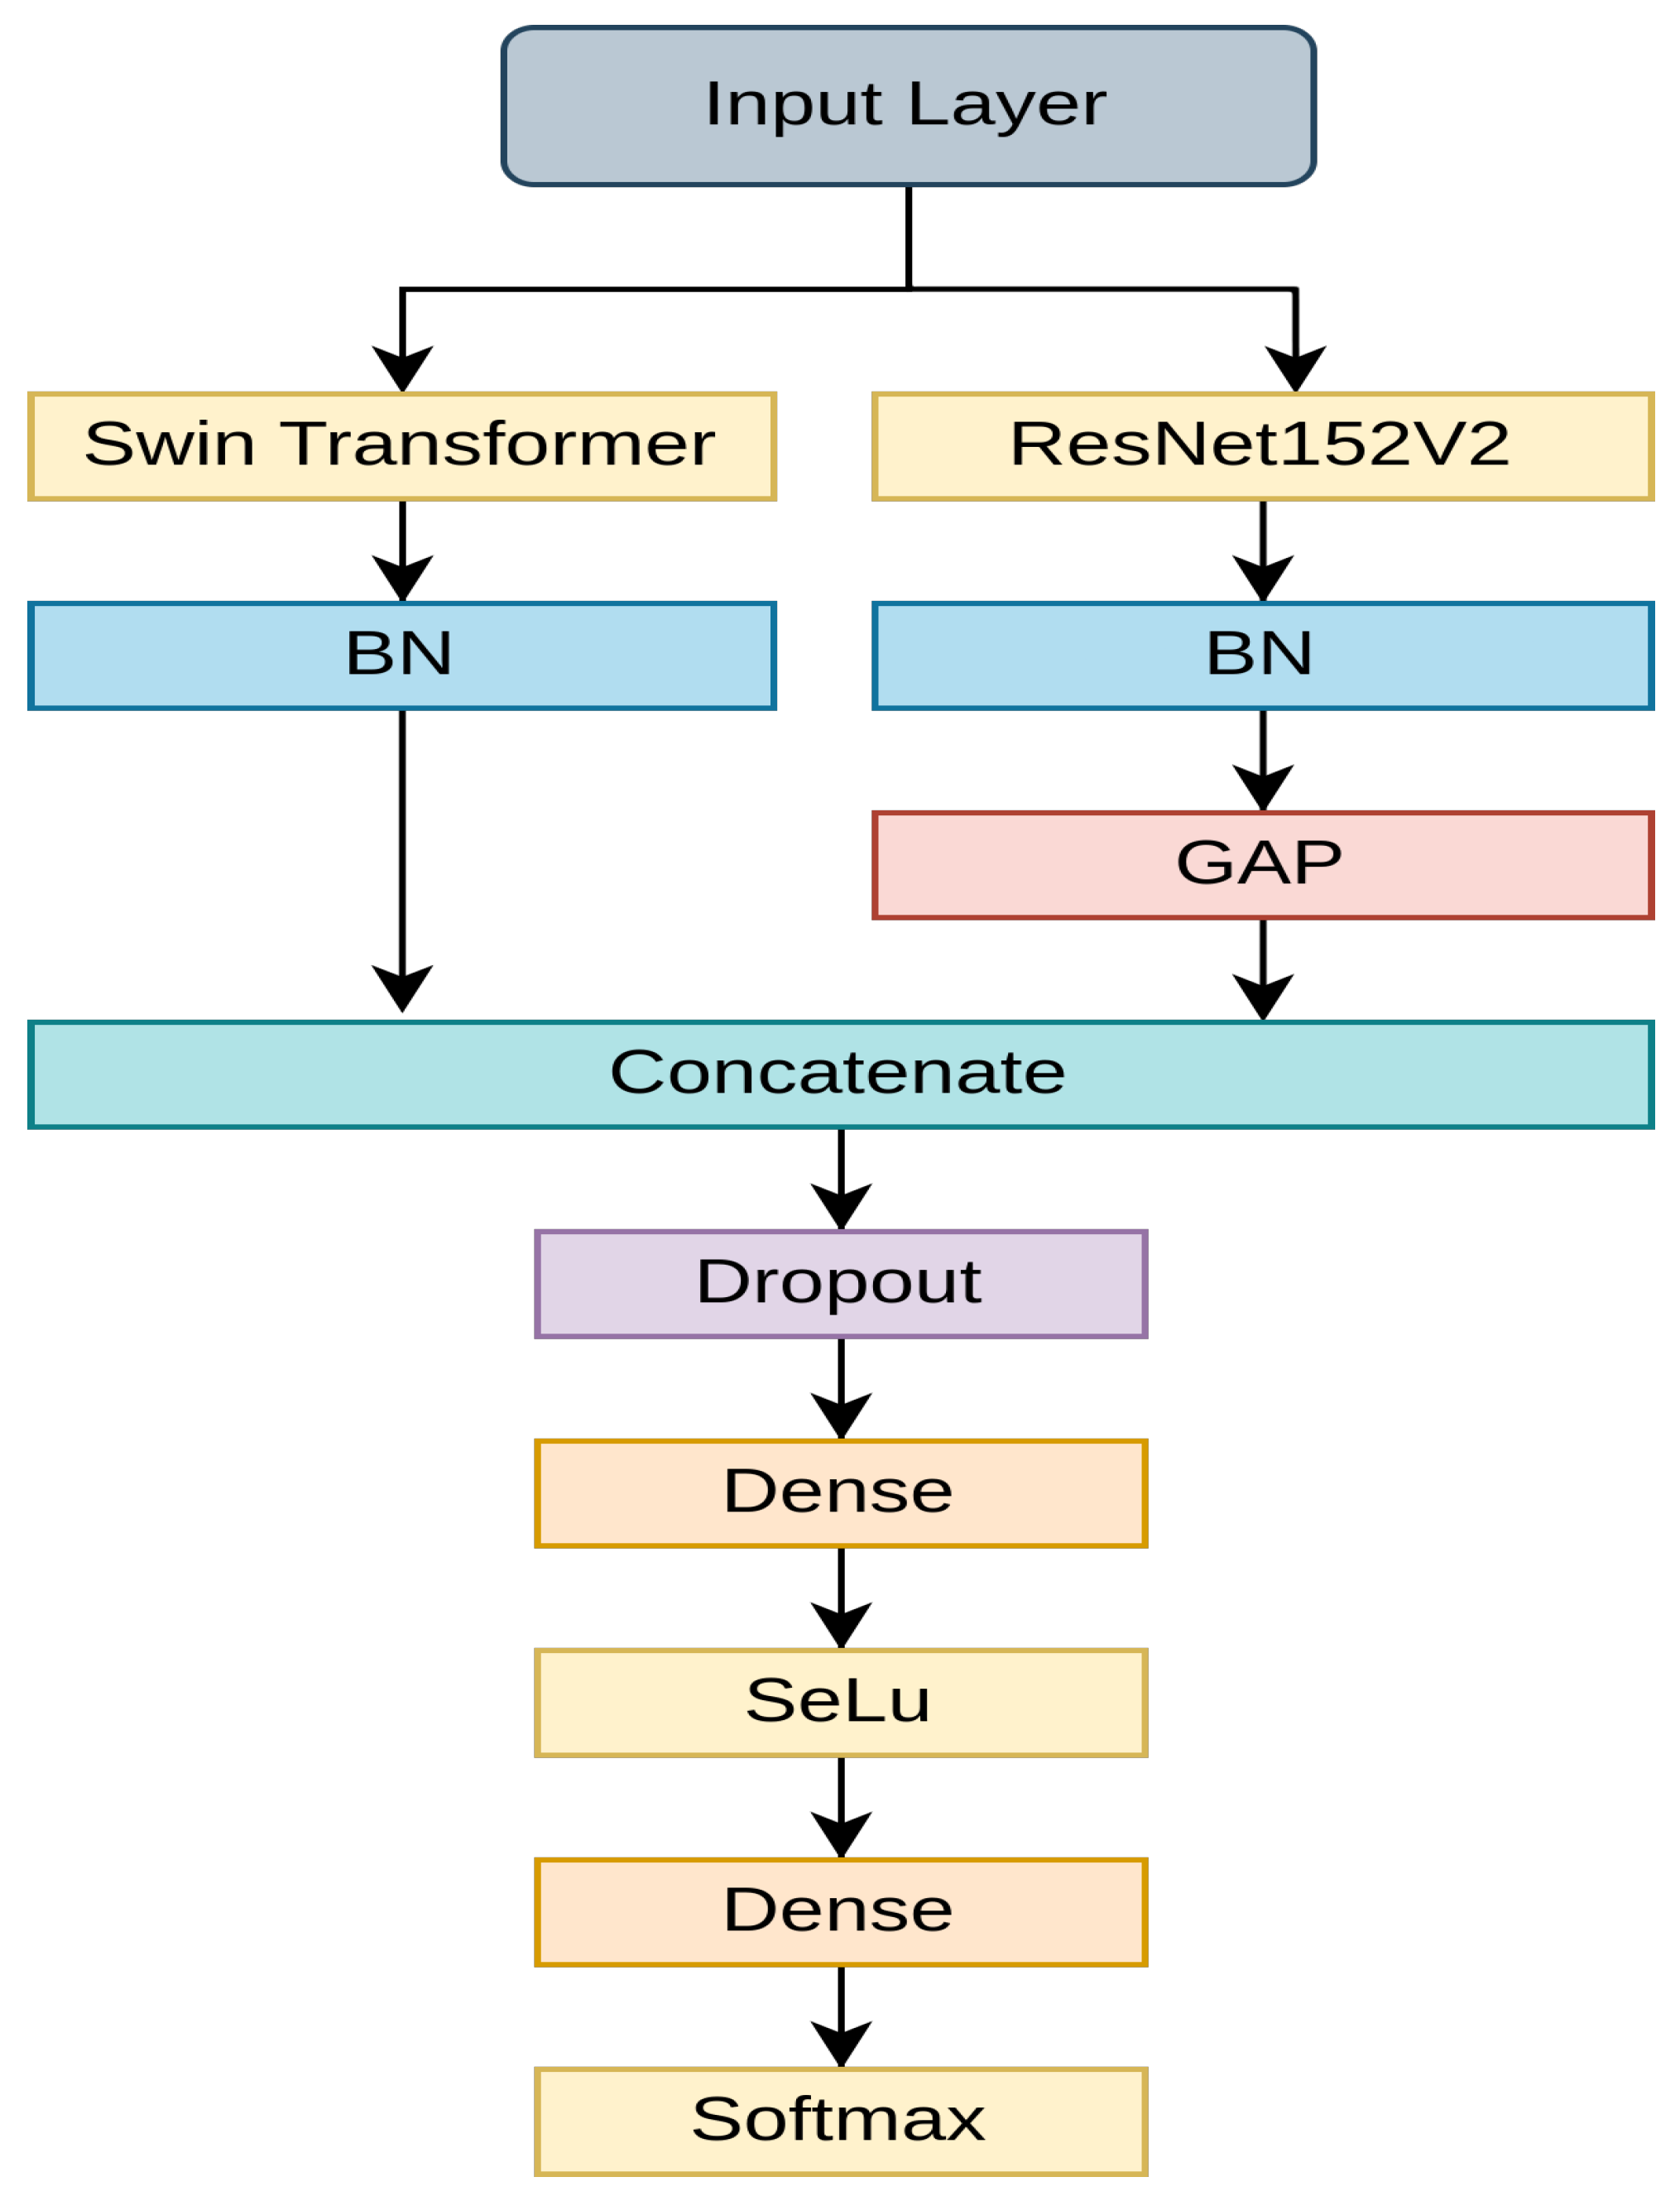
- A robust fusion model is proposed that employs Swin Transformer and ResNet152V2; it serves as an instructive guide for knowledge distillation.
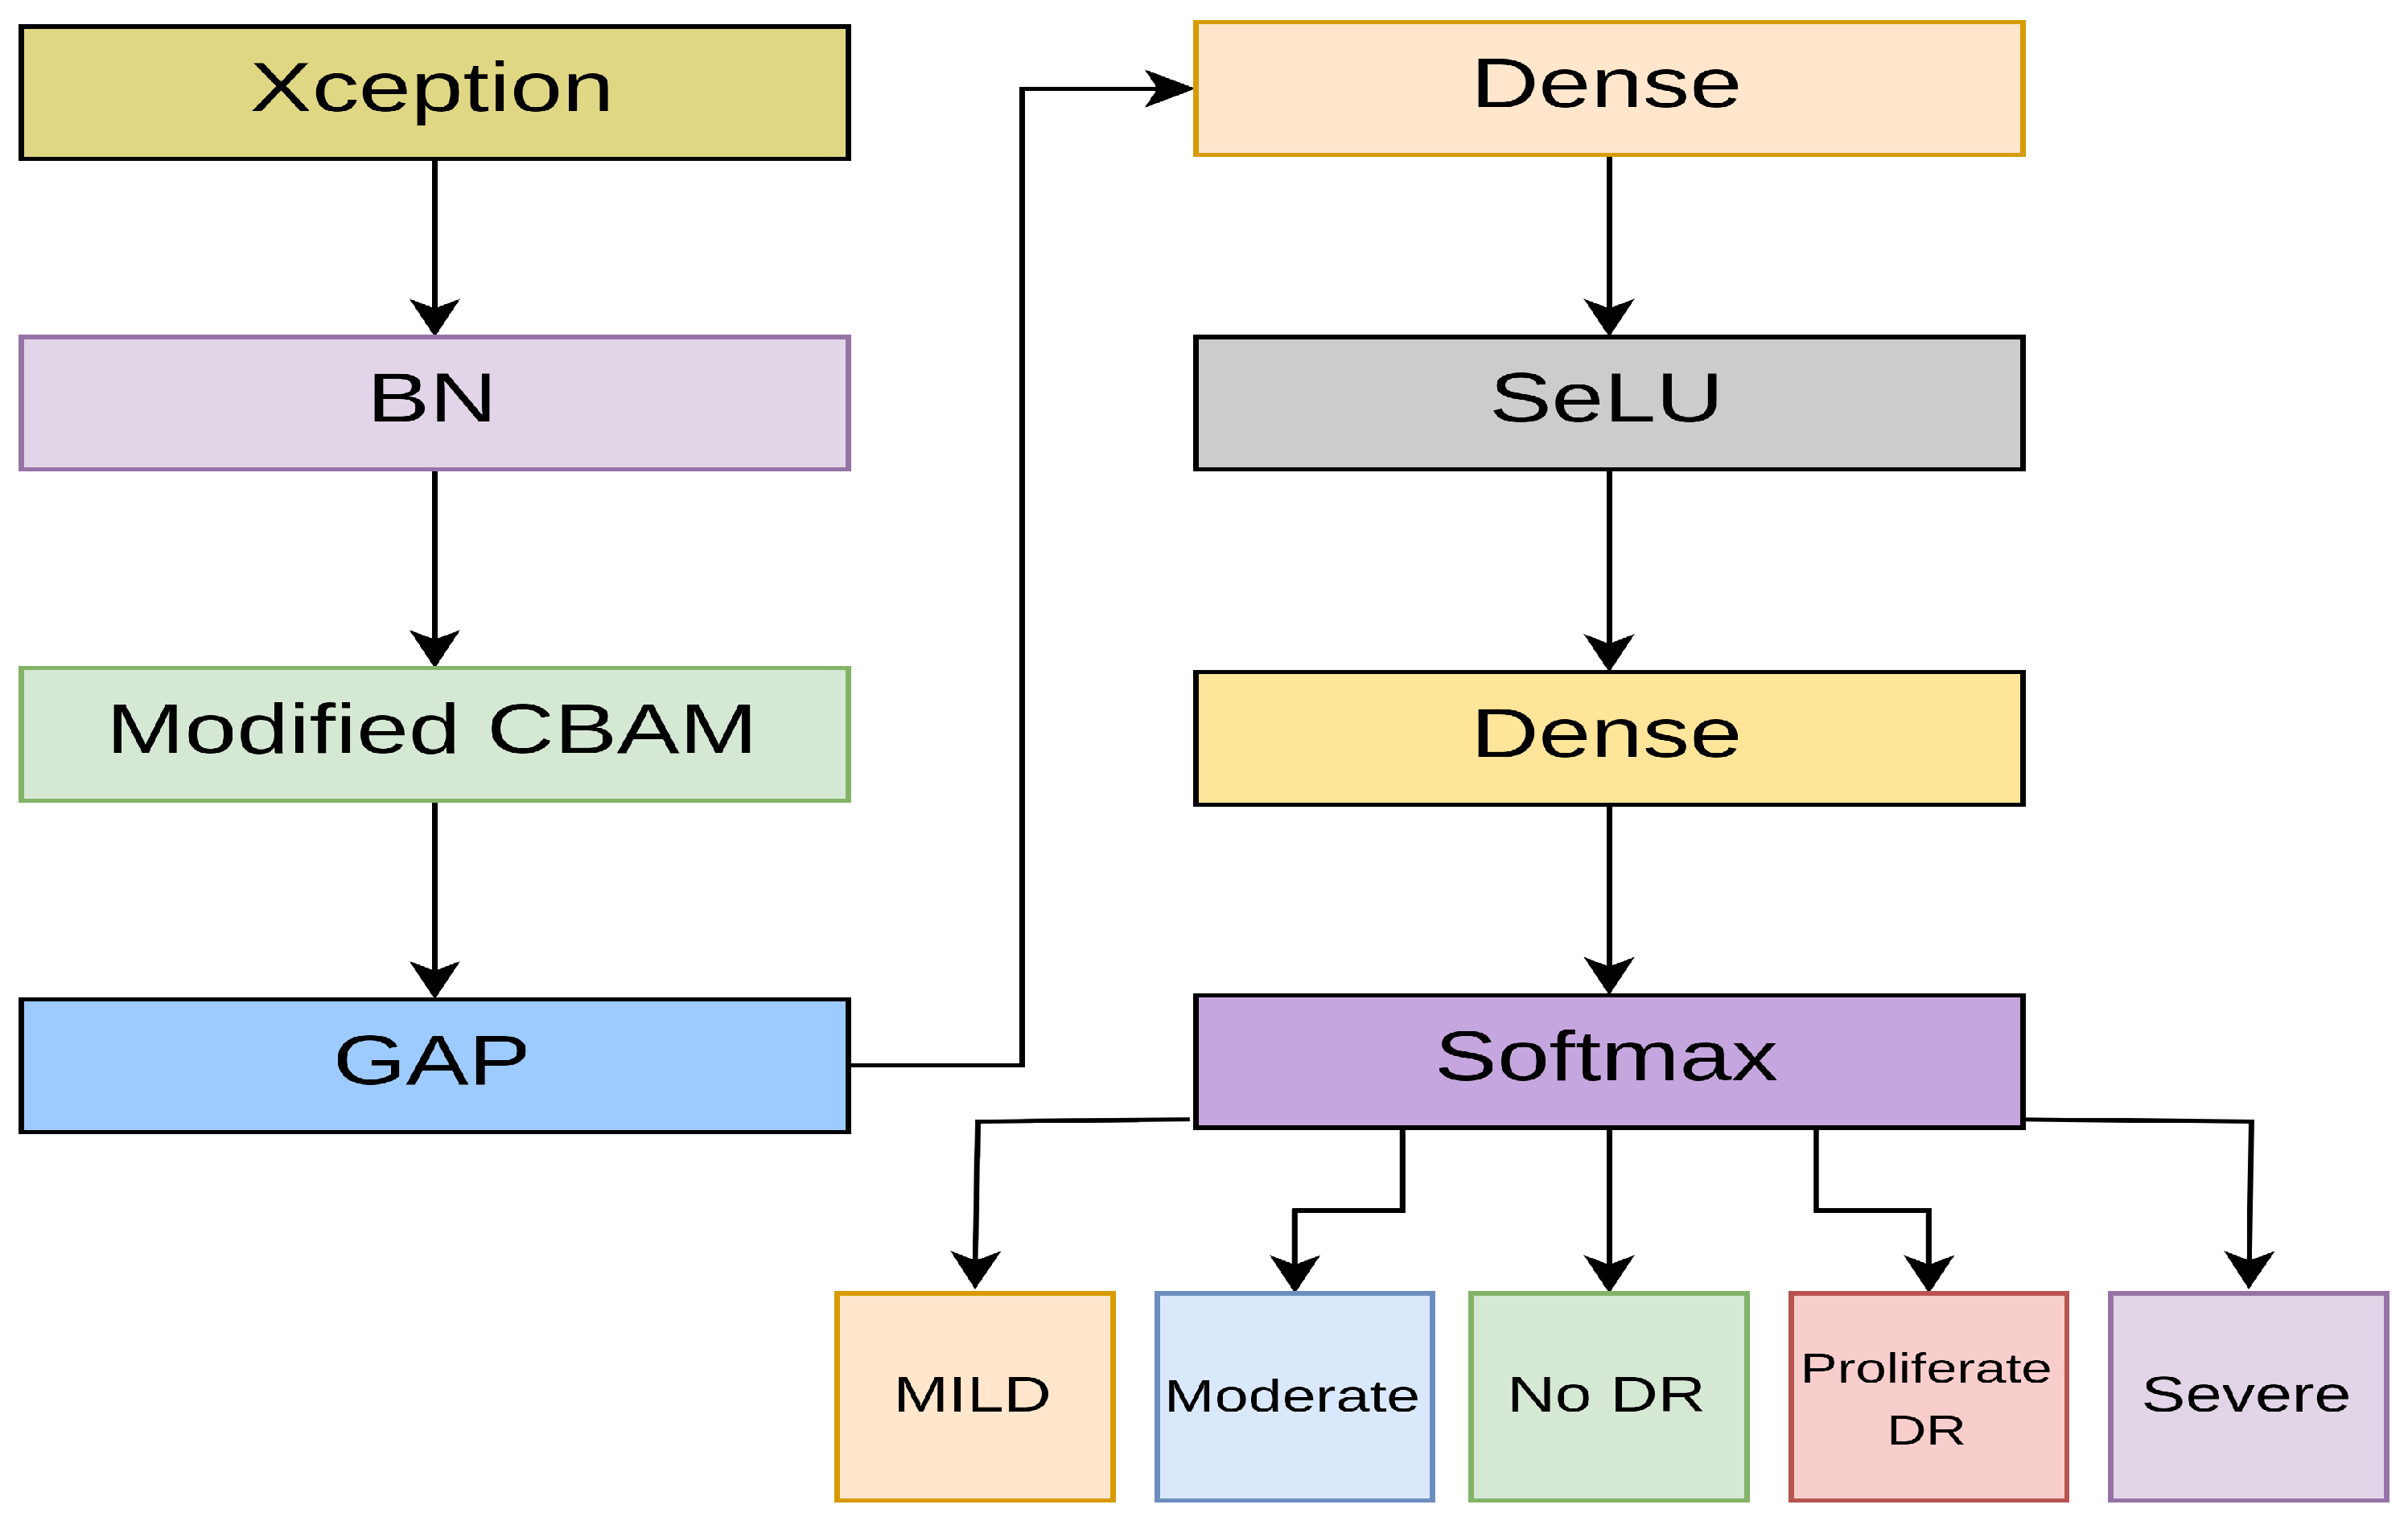
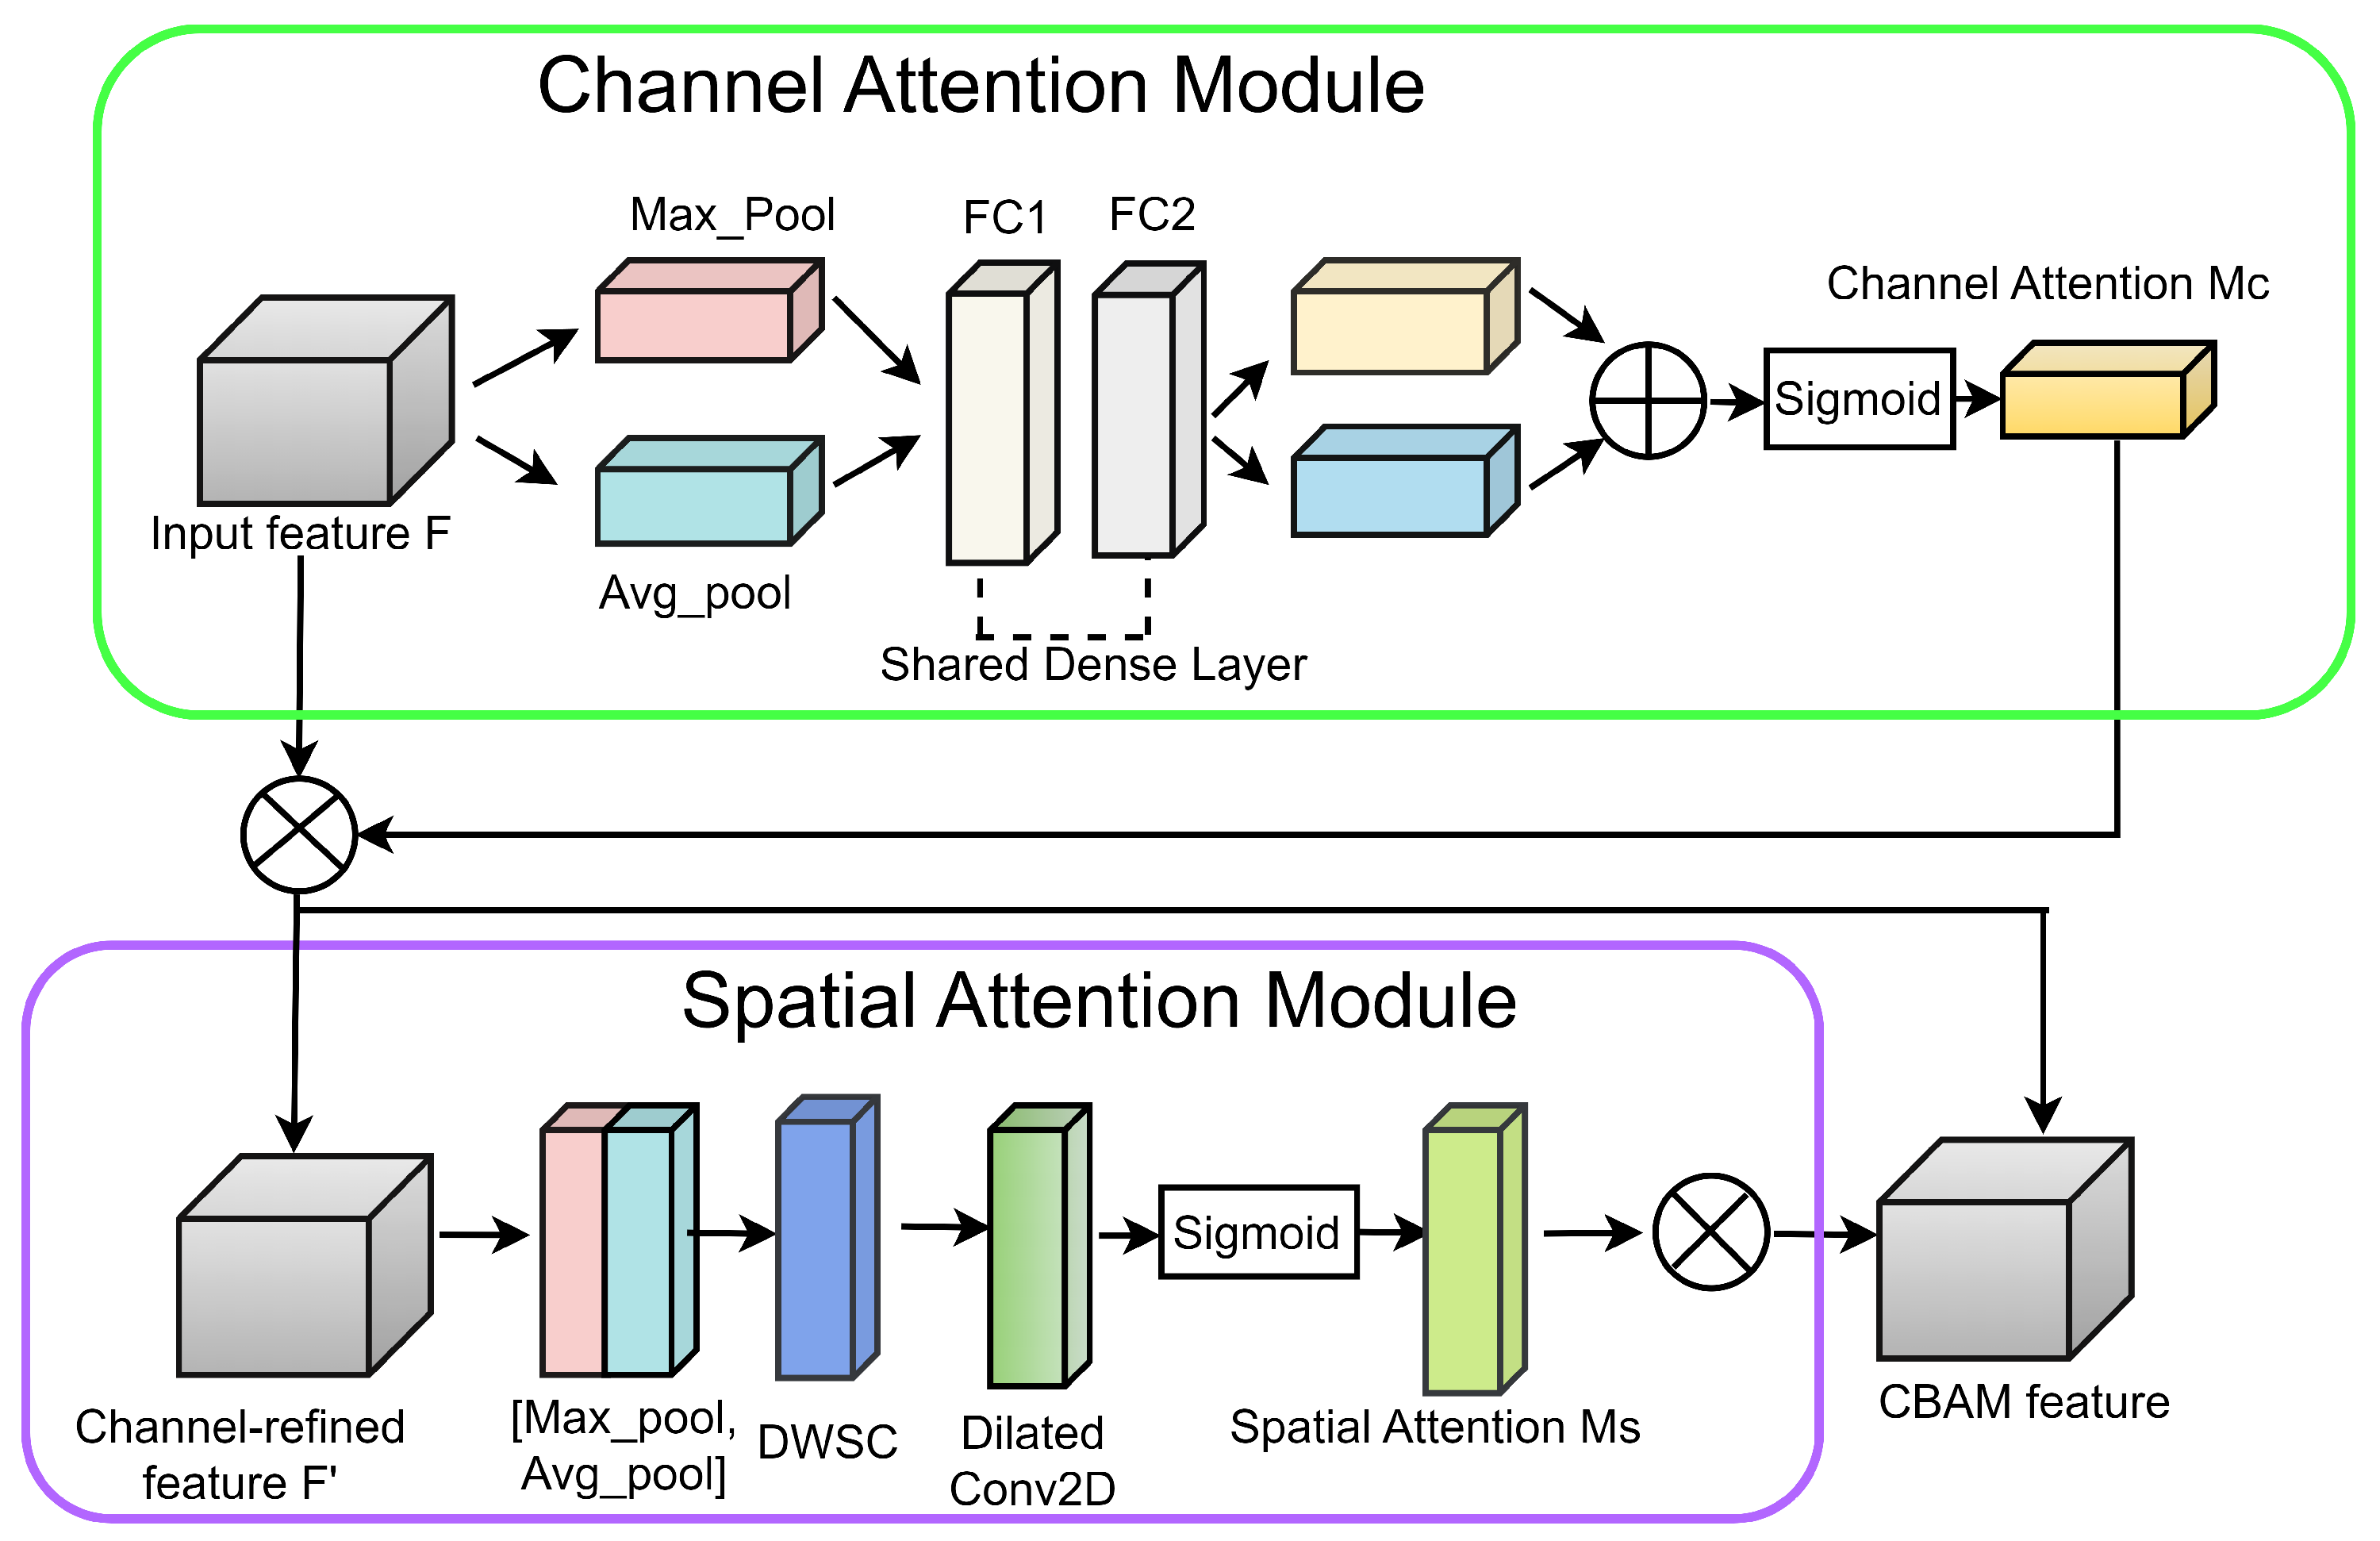
- For efficiency, this research presents a compact student model by merging Xception and a tailored CBAM block, which is 102 megabytes.
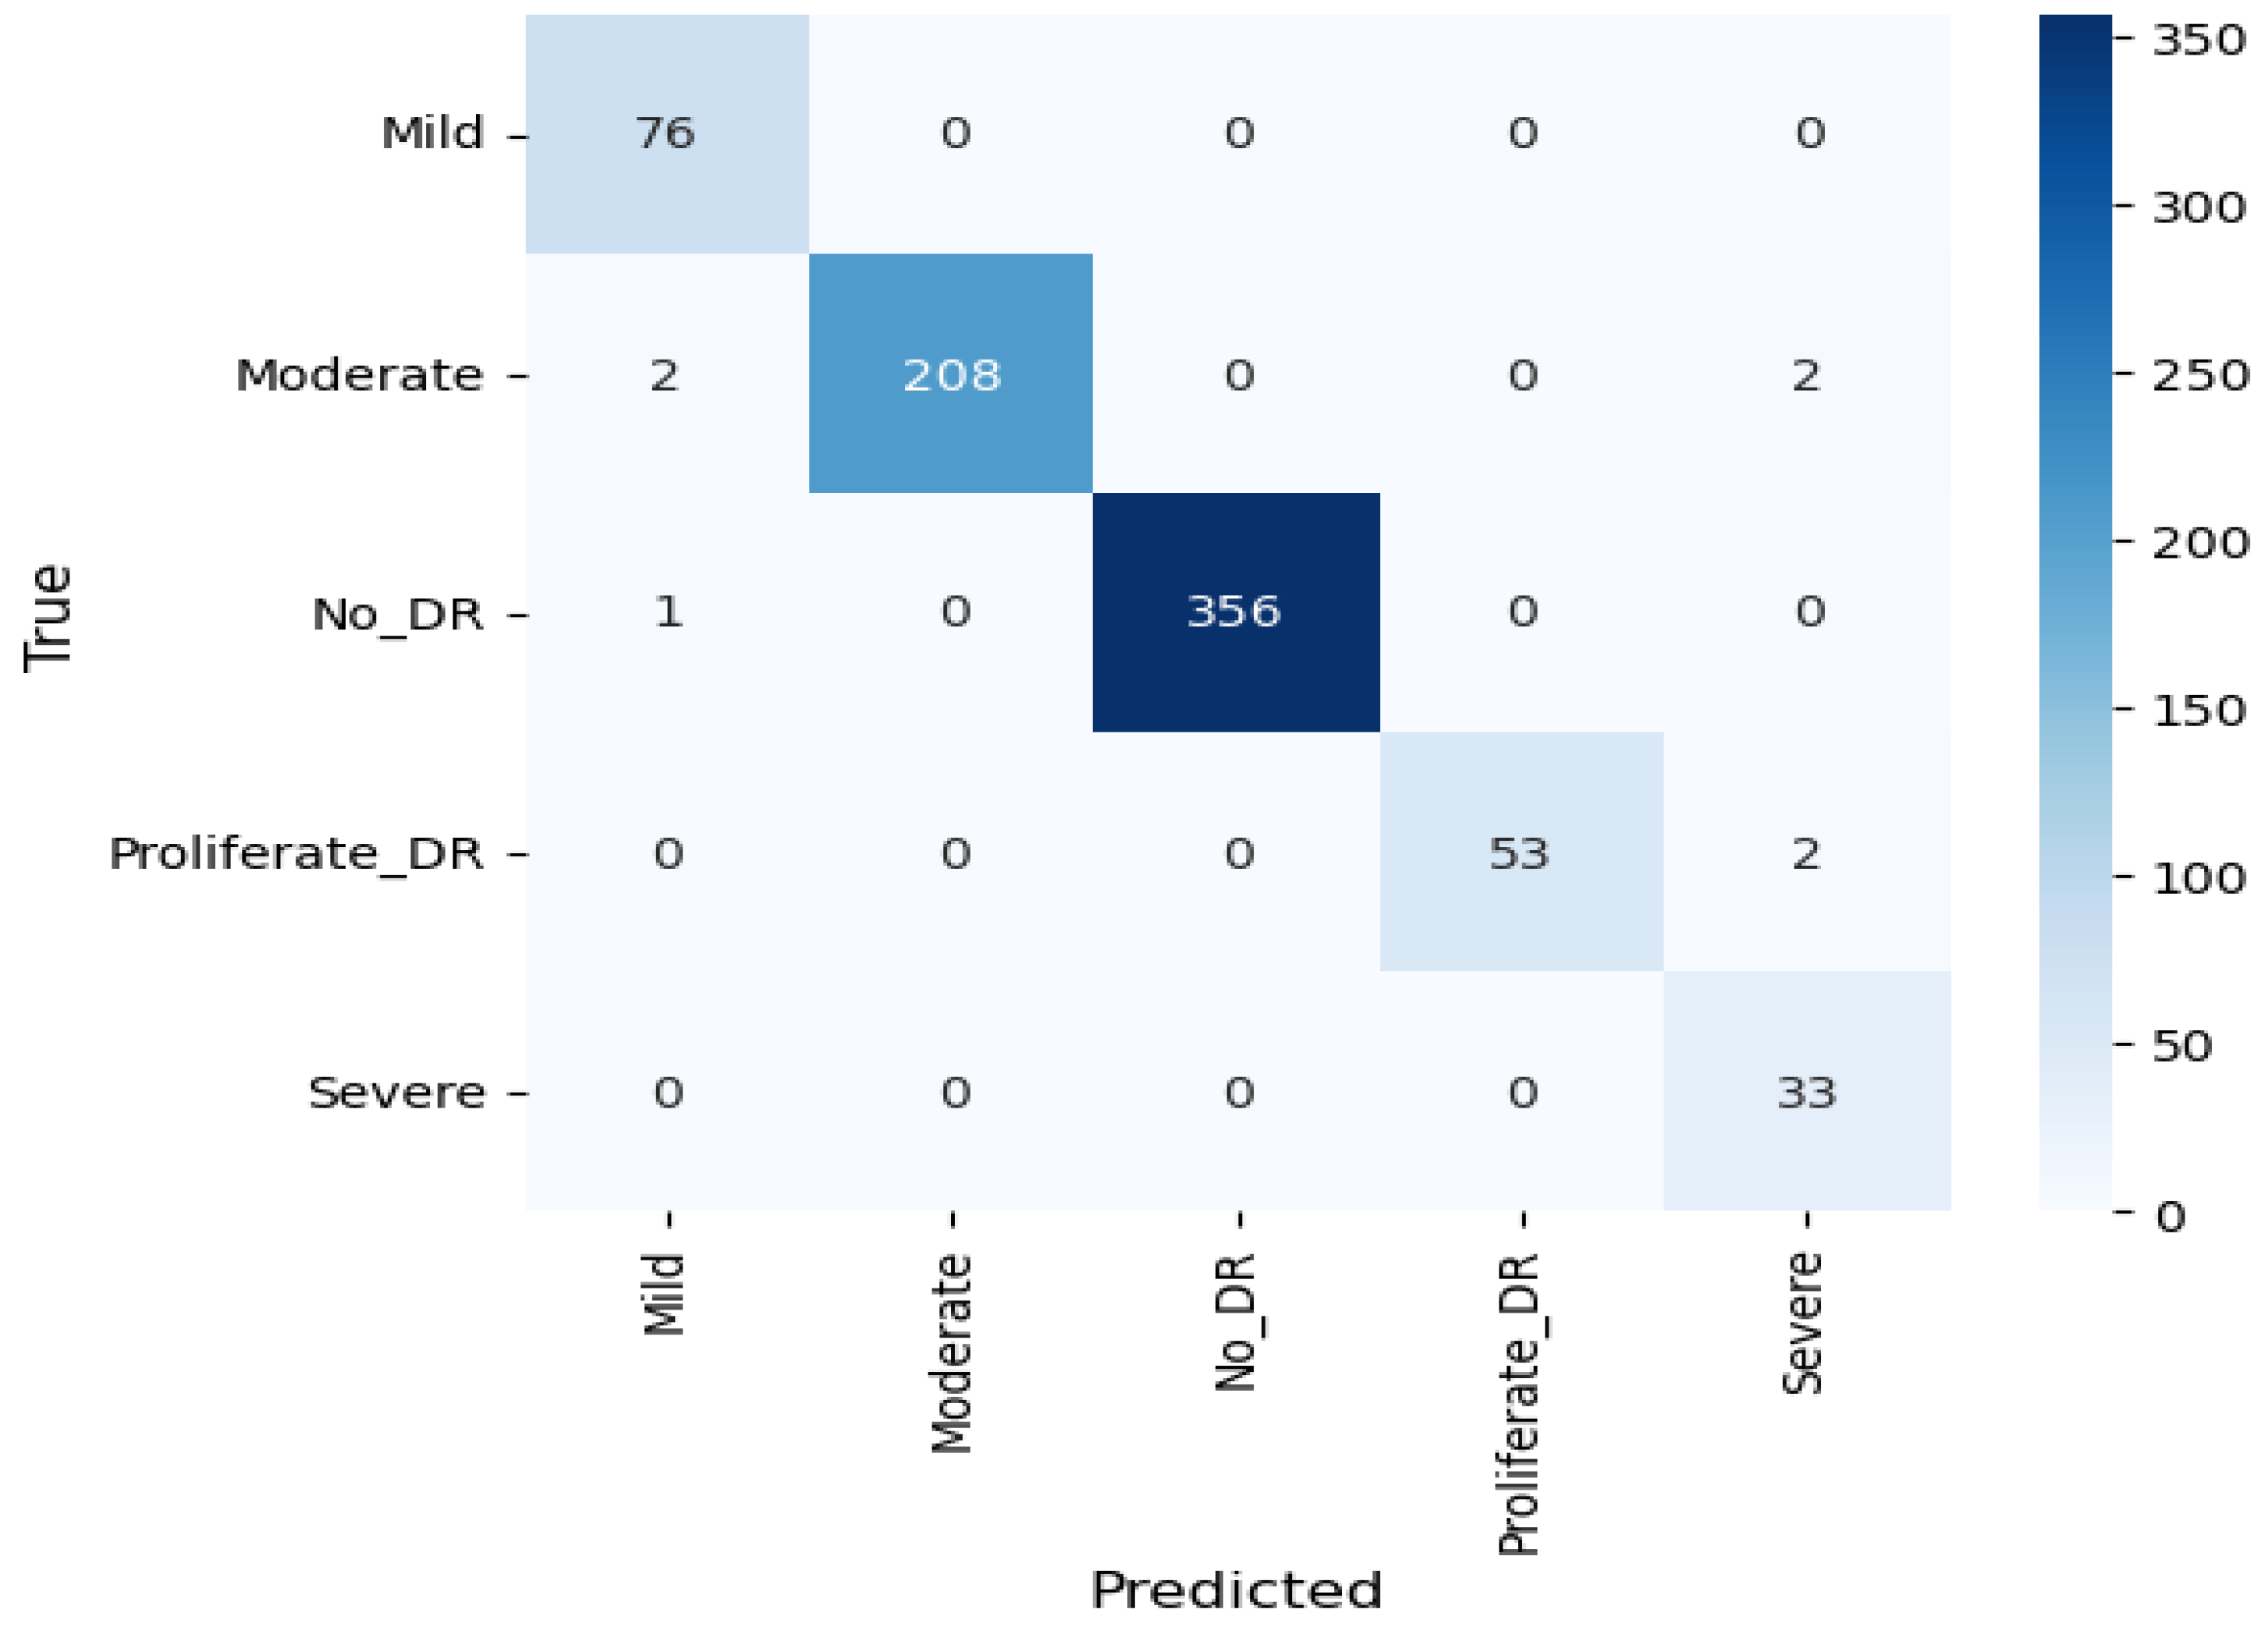
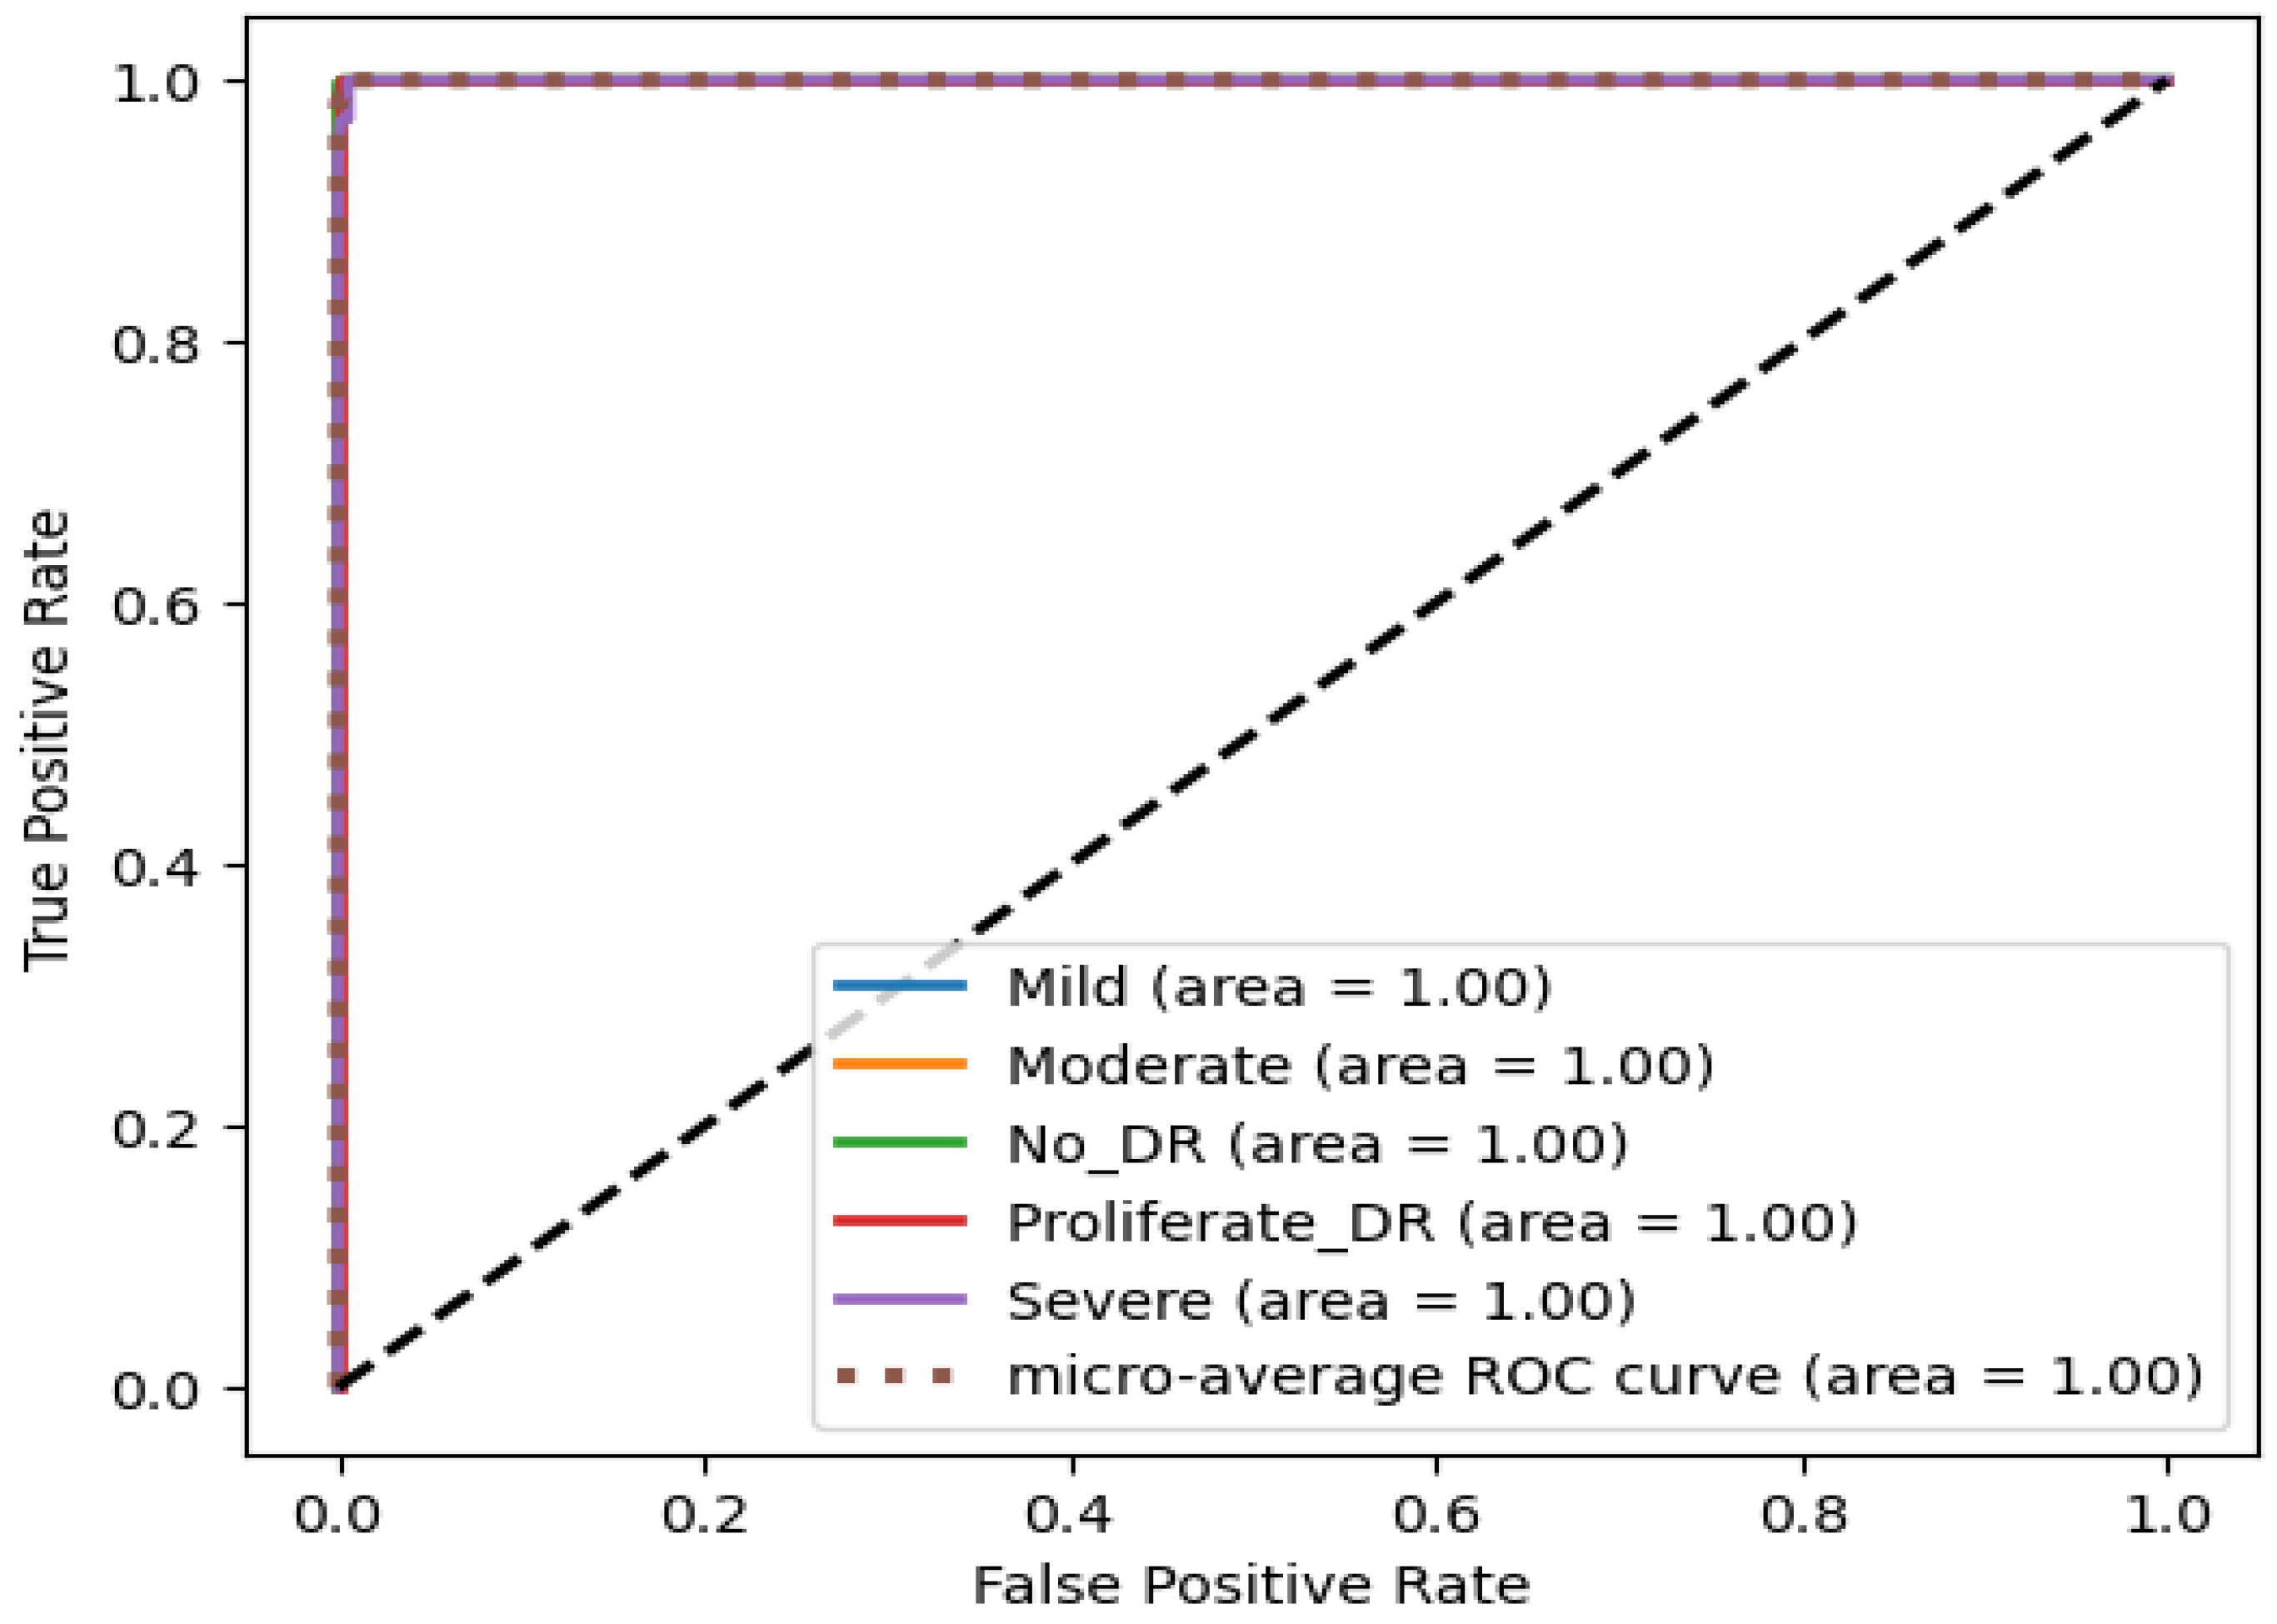
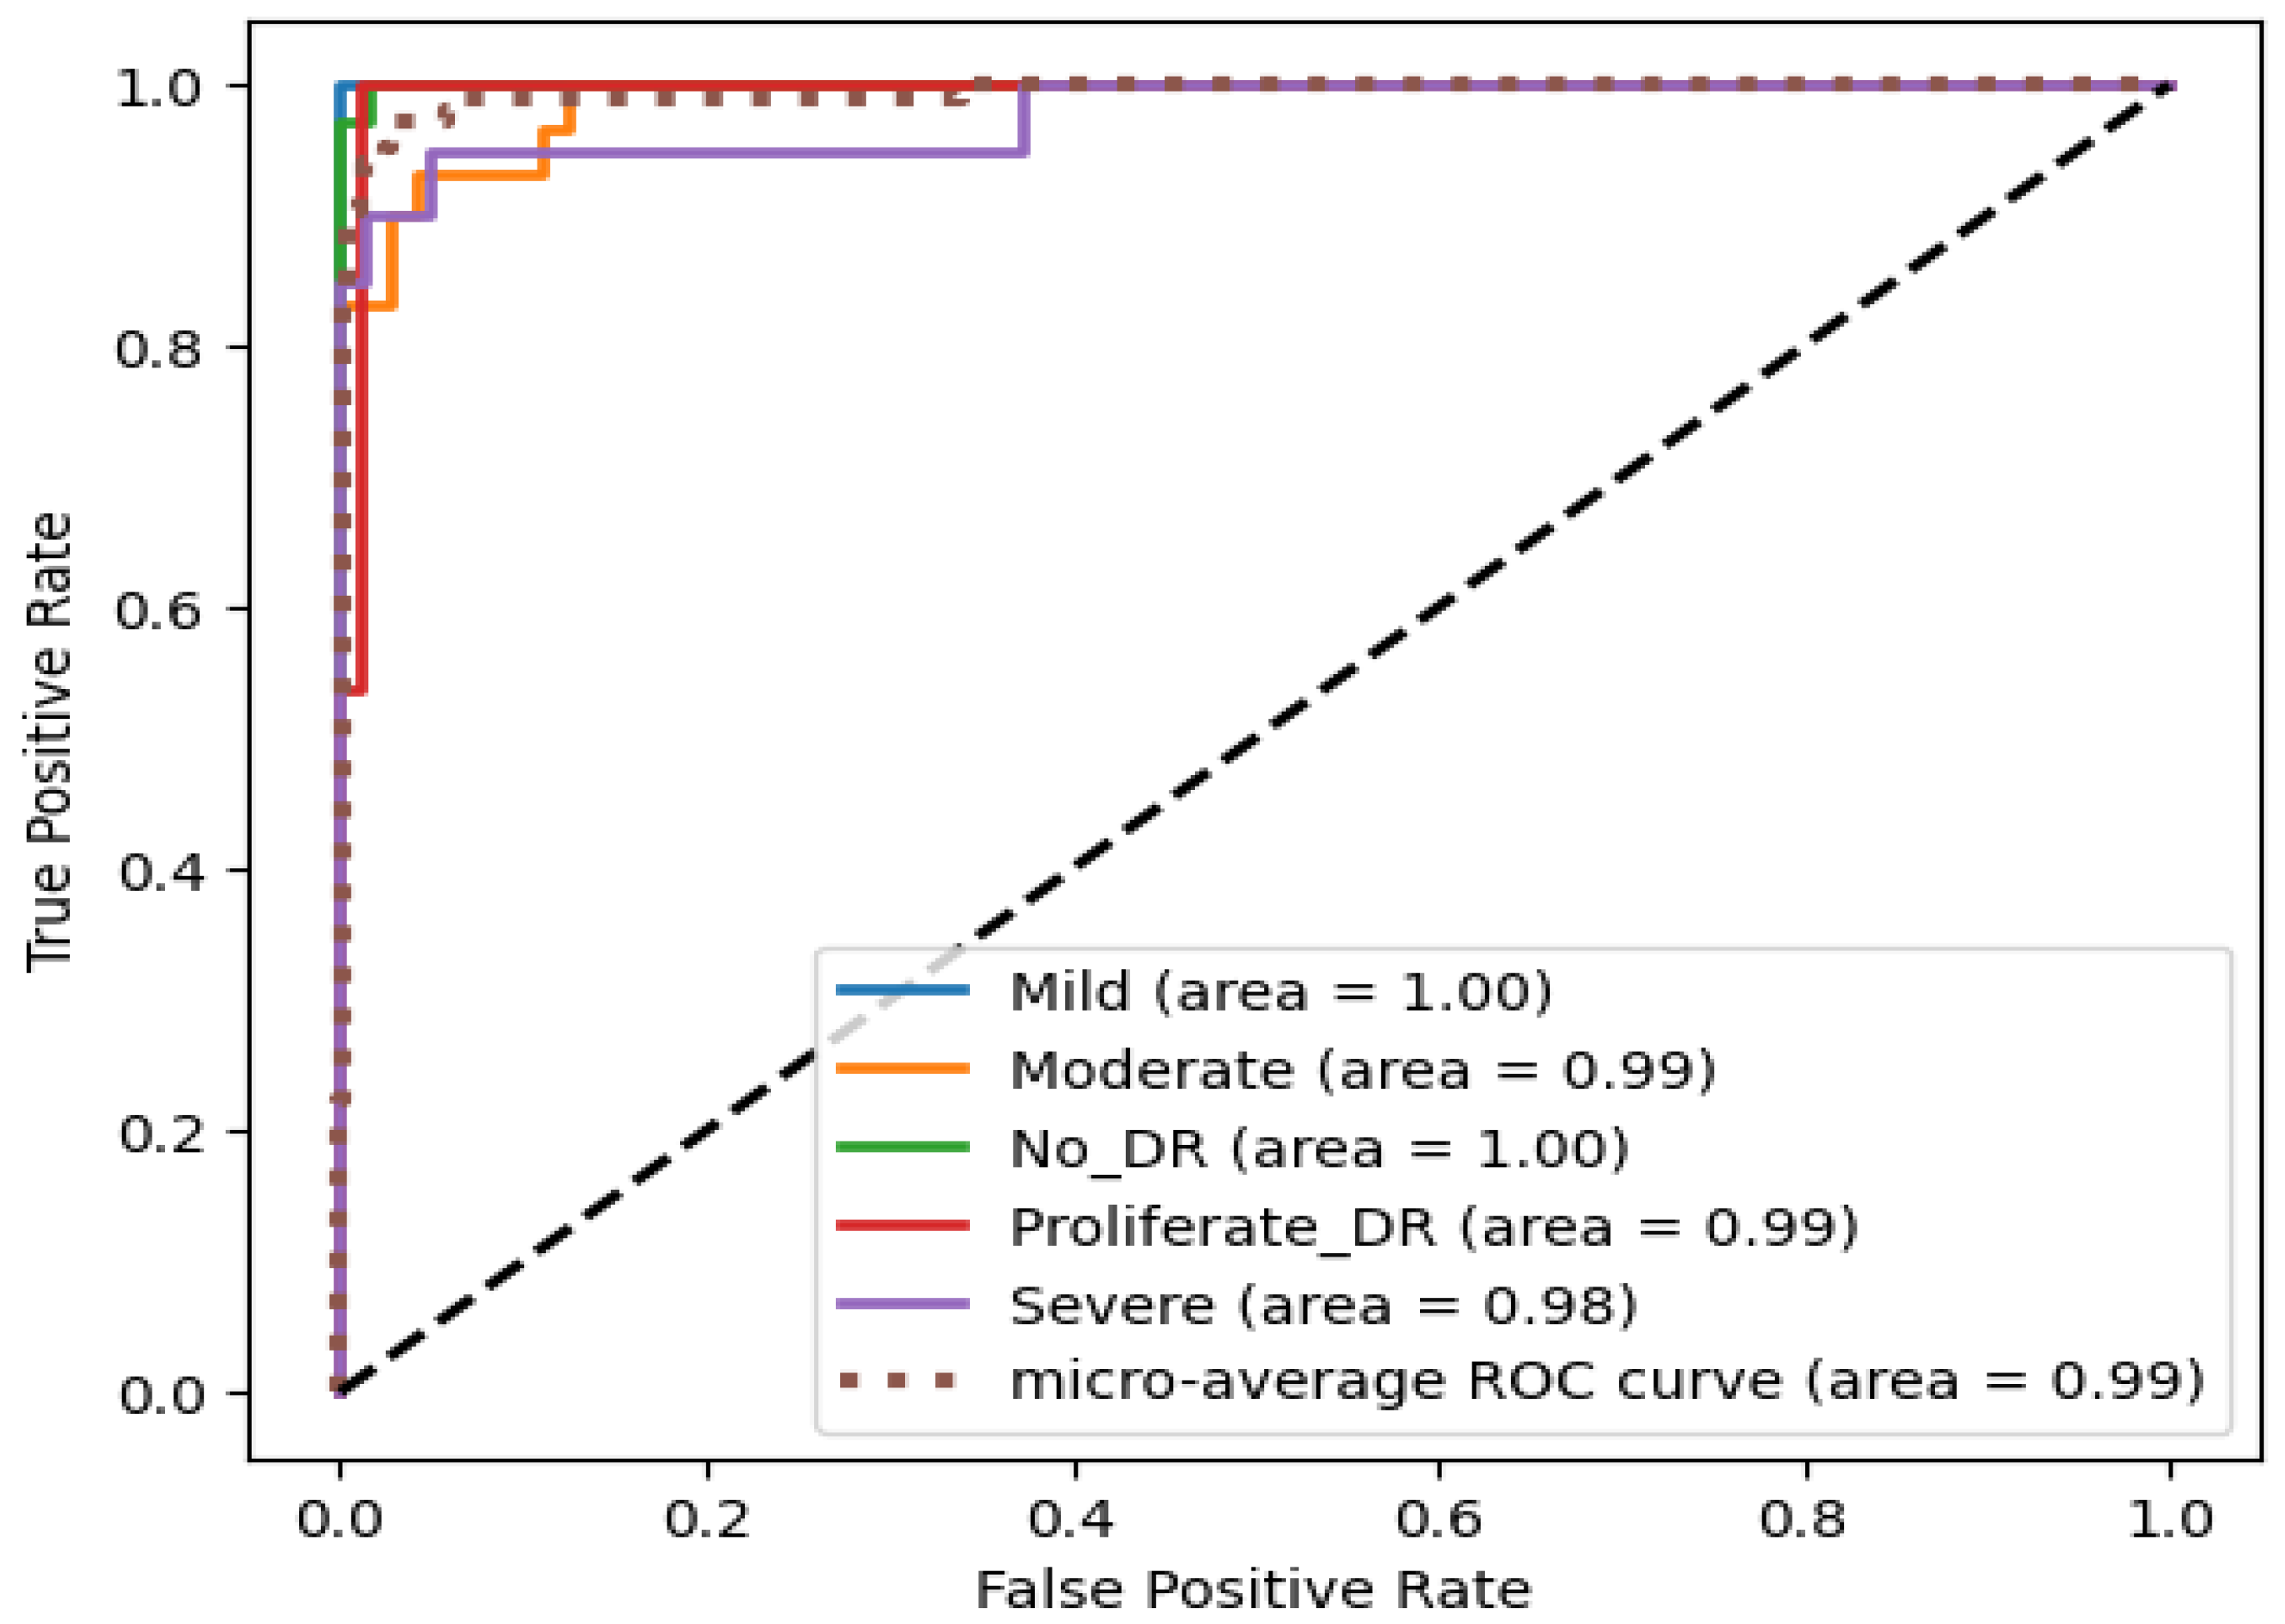
- The effectiveness of the proposed model is demonstrated by an empirical evaluation on the challenging APTOS and IDRiD datasets, which yielded excellent results, with 100% accuracy in binary classification and a remarkable 99.04% in multi-class classification on the APTOS dataset. Moreover, the accuracies were 98.05% for binary classification and 94.17% for multi-class accuracy on the IDRiD dataset.
2. Related Work
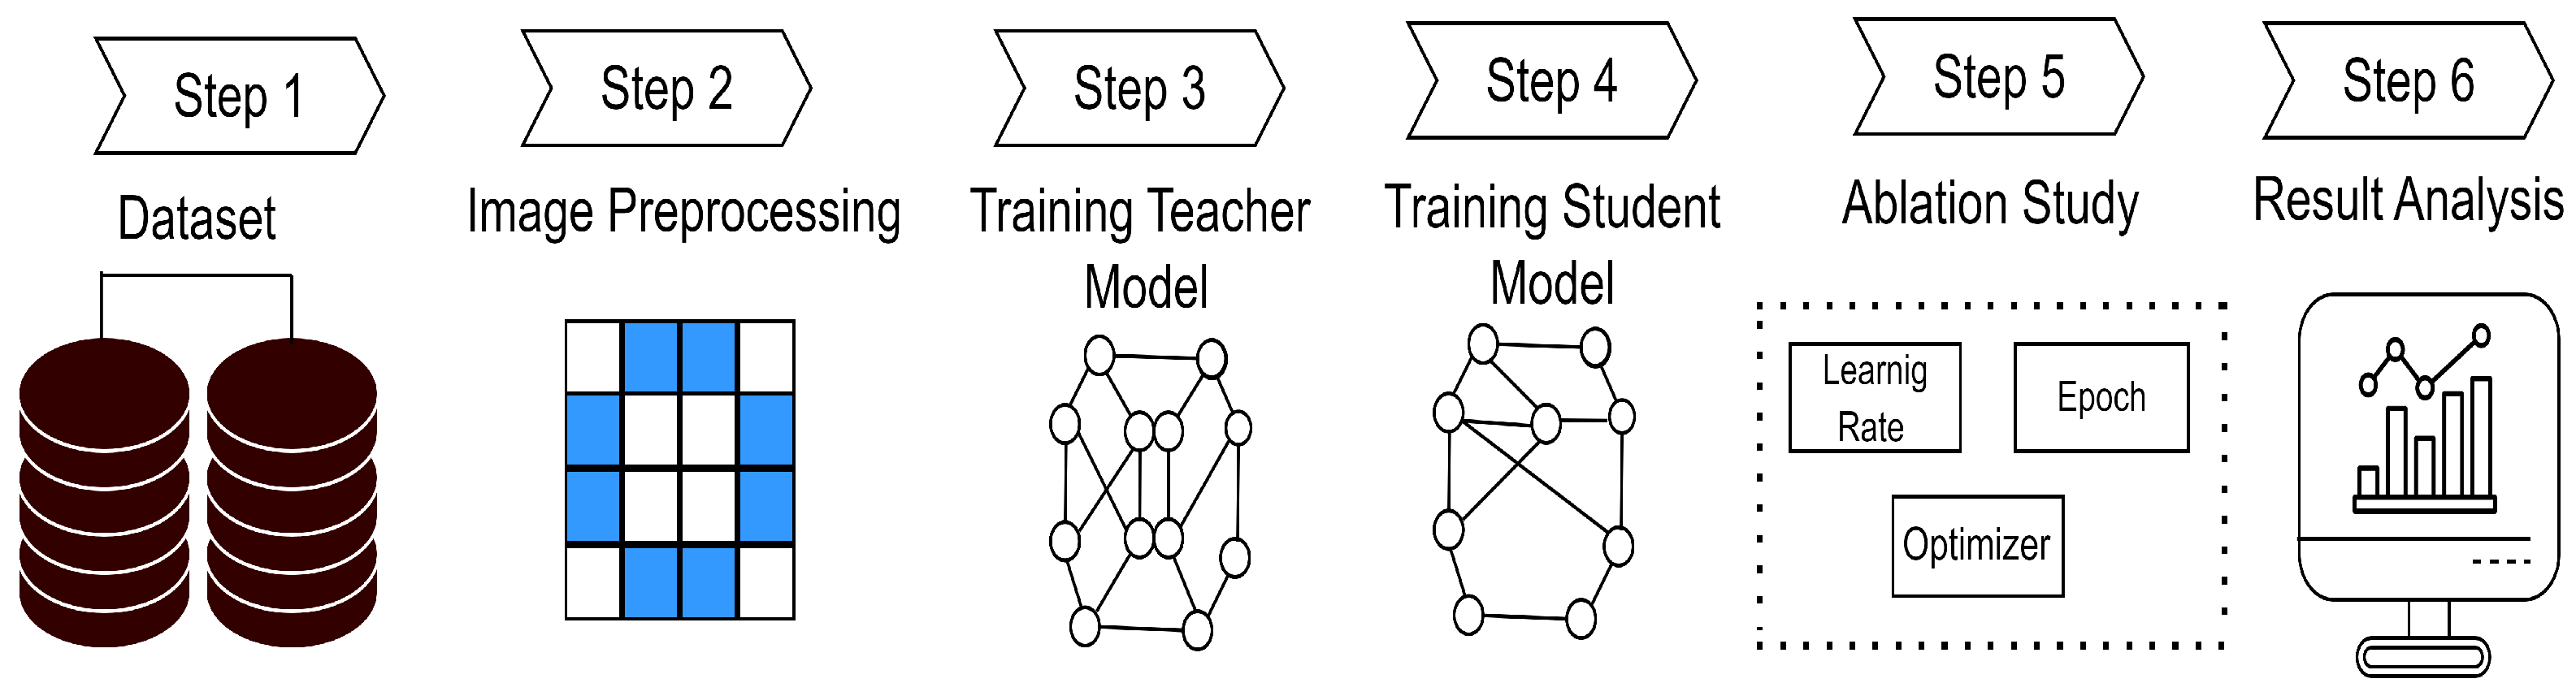
3. Methodology
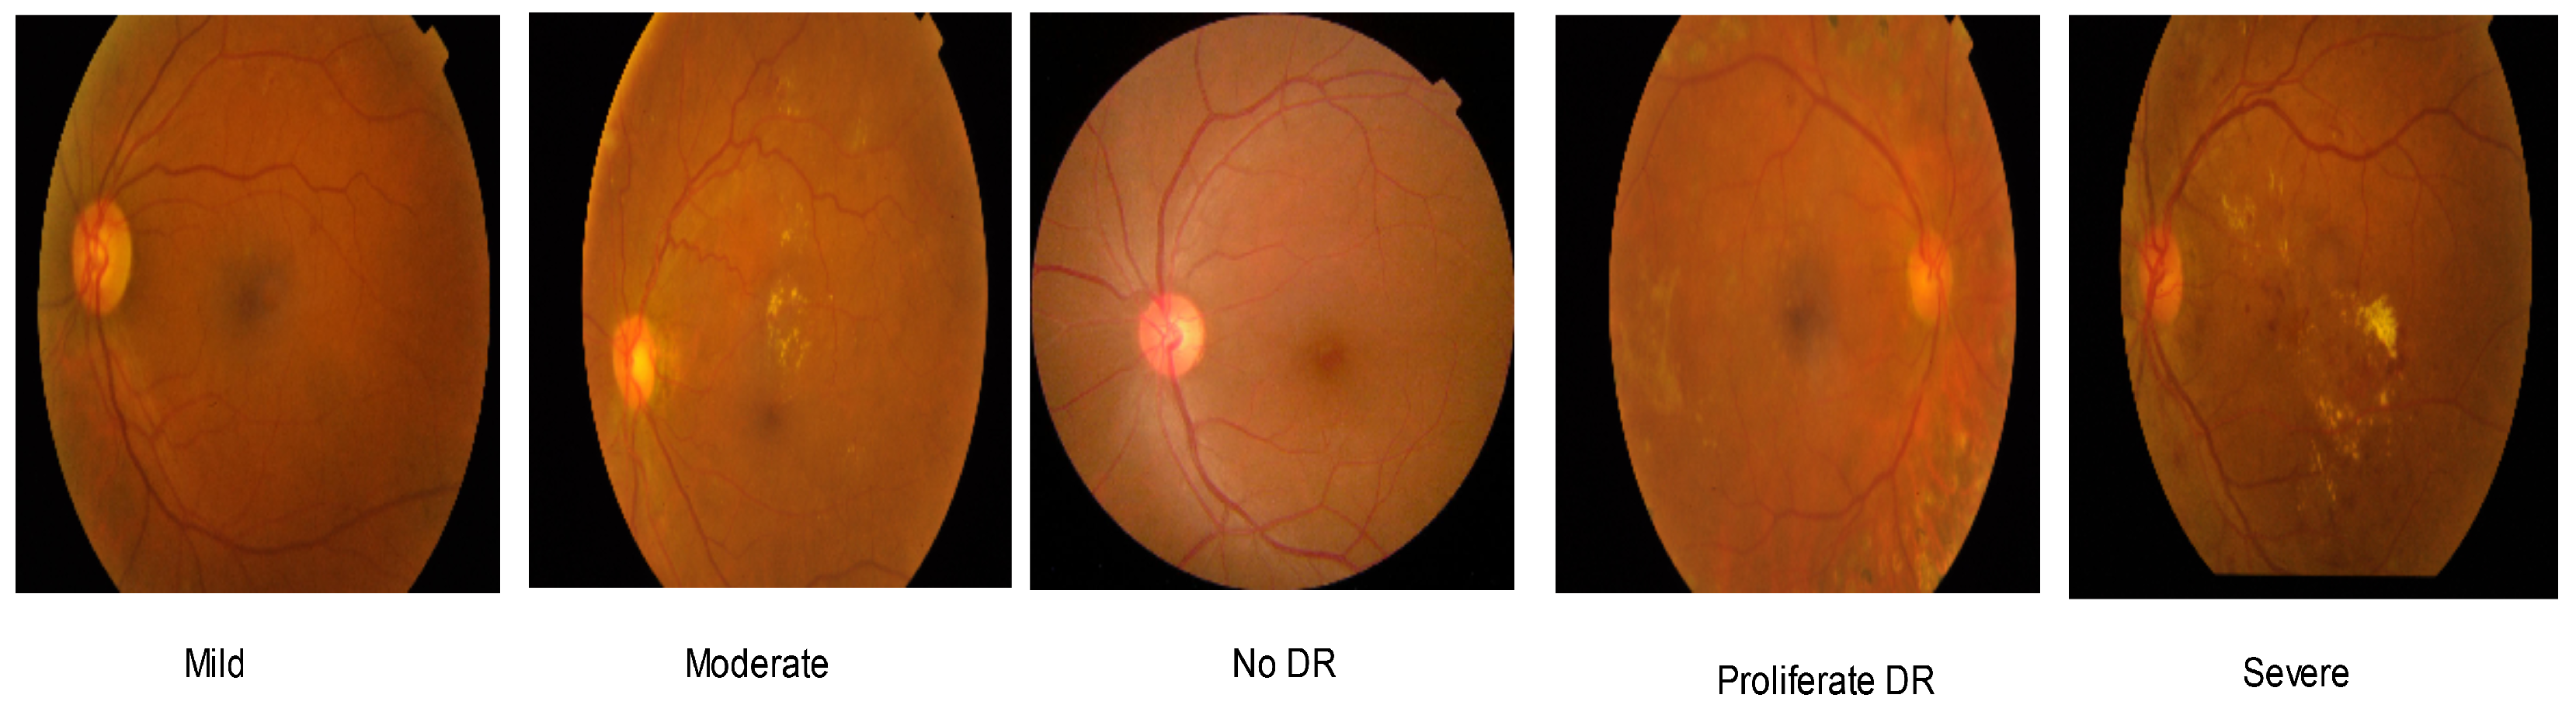
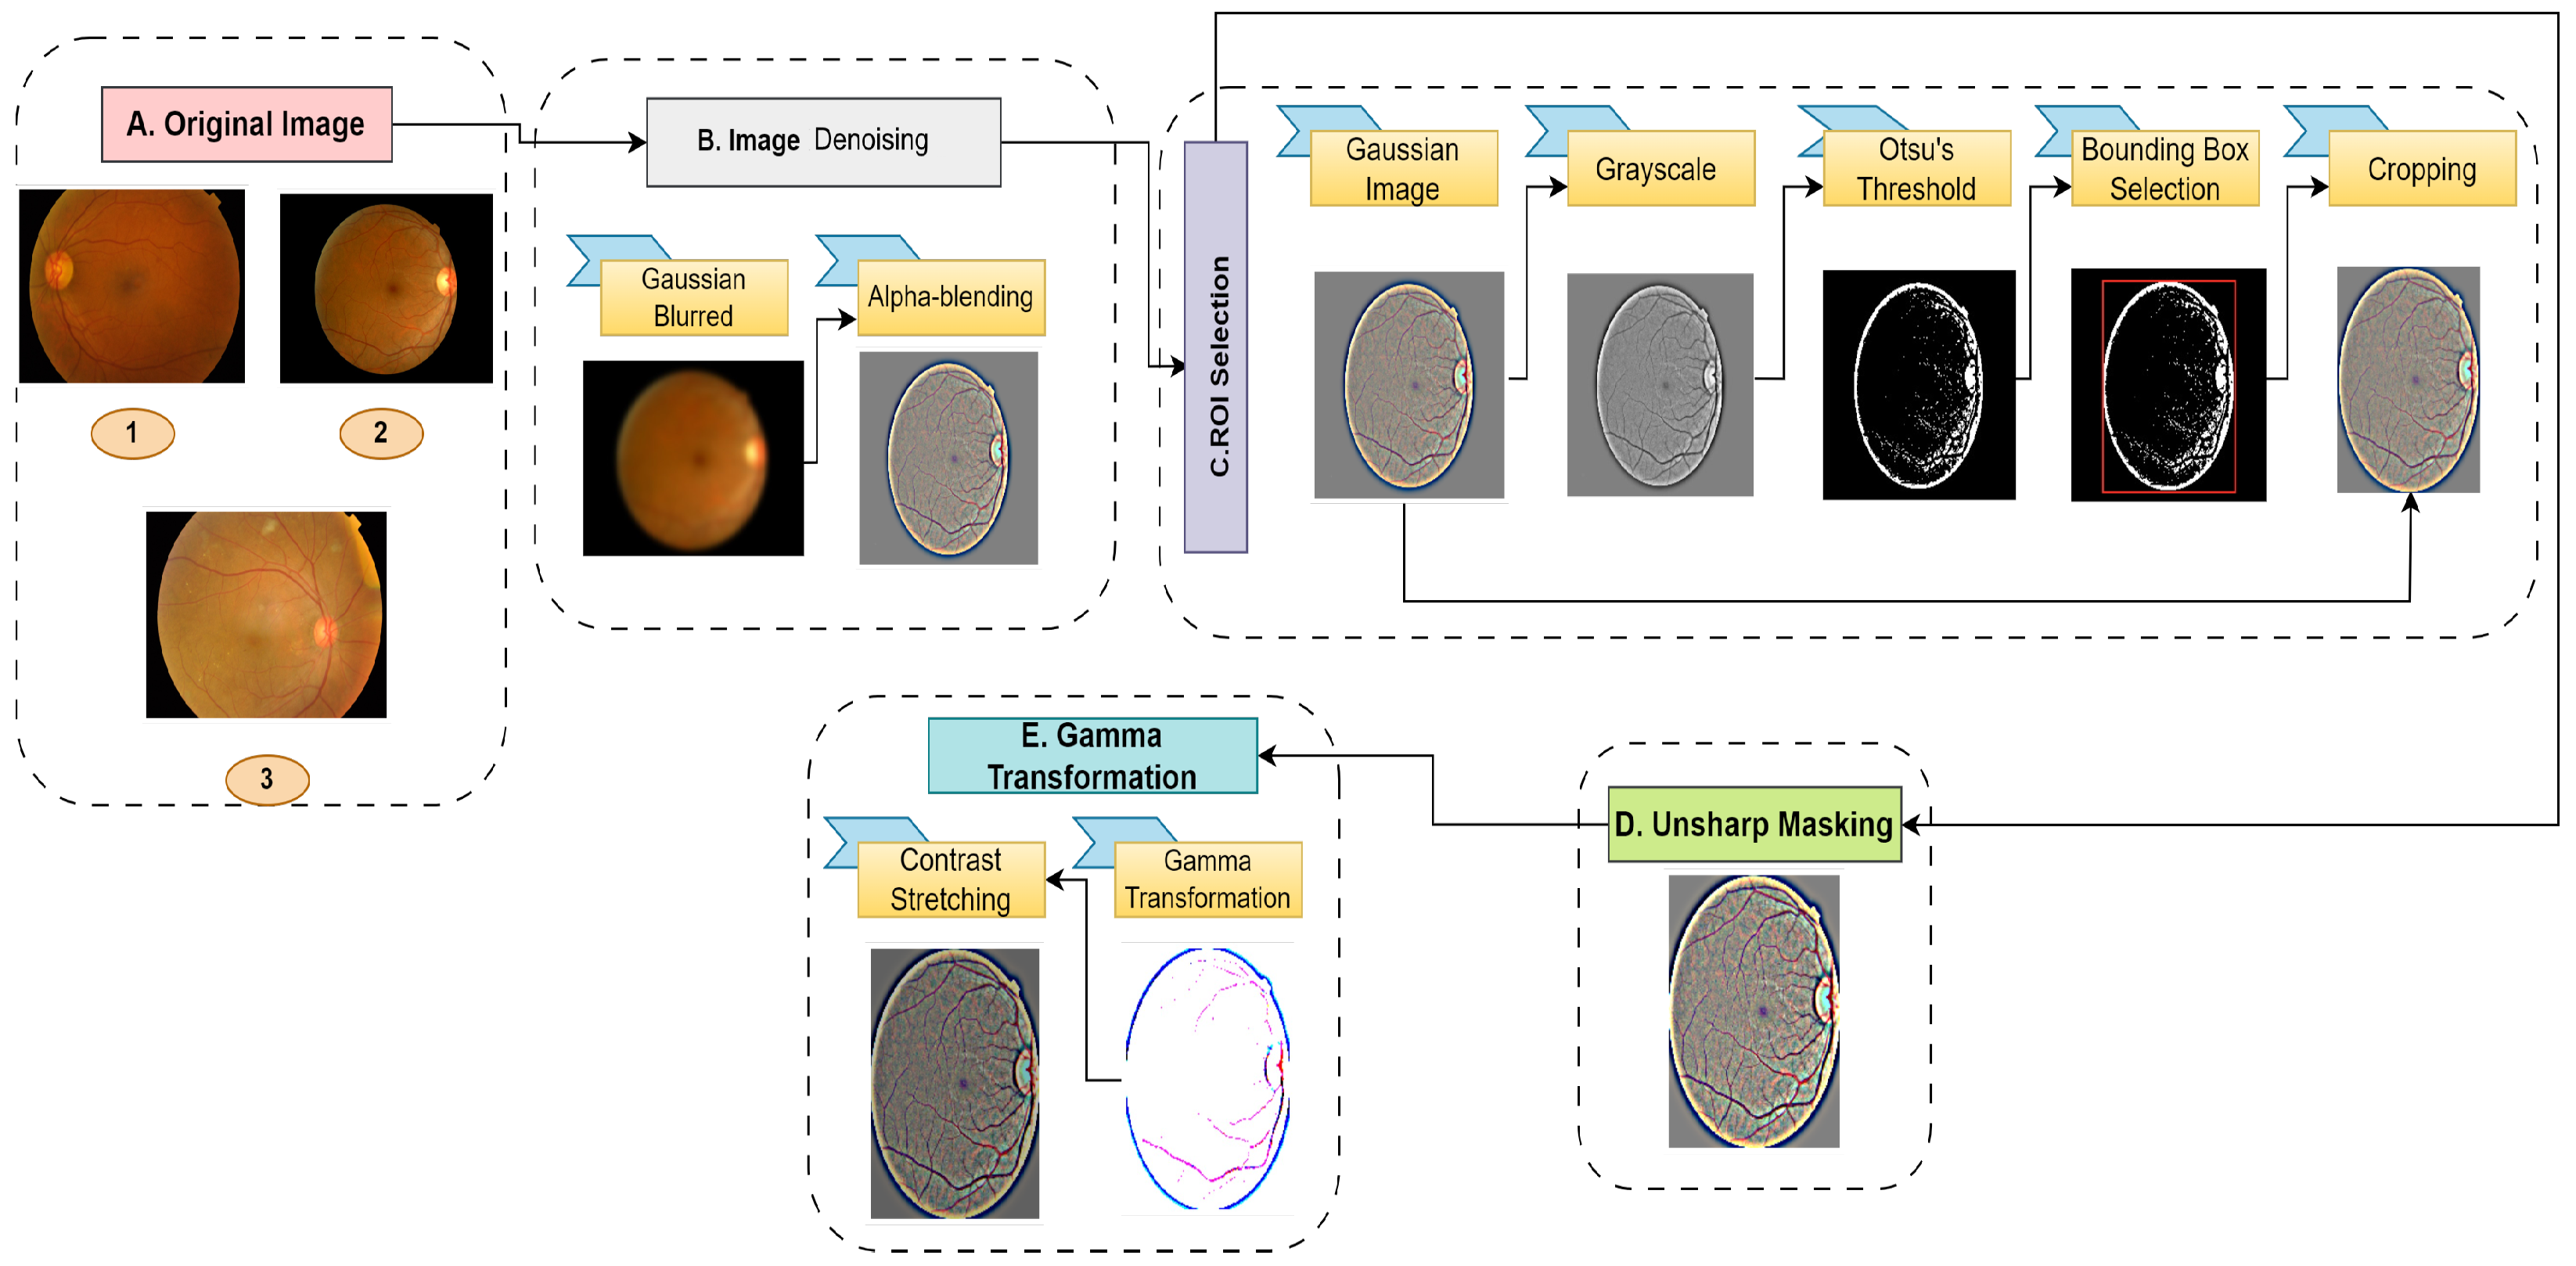
3.1. Data Preprocessing
3.1.1. Image Denoising
3.1.2. ROI Selection
3.1.3. Unsharp Masking
3.1.4. Gamma Transformation
3.2. Model Construction
3.2.1. Teacher Model
3.2.2. Student Model
3.2.3. Training the Student Model with Knowledge Distillation
3.3. Ablation Study
4. Results
4.1. Experimental Setup
4.2. Result Analysis
4.3. Comparison with Existing Works
4.4. Discussion
5. Conclusions
Author Contributions
Funding
Institutional Review Board Statement
Informed Consent Statement
Data Availability Statement
Conflicts of Interest
References
- Atwany, M.Z.; Sahyoun, A.H.; Yaqub, M. Deep learning techniques for diabetic retinopathy classification: A survey. IEEE Access 2022, 10, 28642–28655. [Google Scholar] [CrossRef]
- Usman, T.M.; Saheed, Y.K.; Ignace, D.; Nsang, A. Diabetic retinopathy detection using principal component analysis multi-label feature extraction and classification. Int. J. Cogn. Comput. Eng. 2023, 4, 78–88. [Google Scholar] [CrossRef]
- Choi, S.U.; Kim, Y.J.; Lee, J.Y.; Lee, J.; Yoon, Y.H. Qualitative and quantitative evaluation of diabetic choroidopathy using ultra-widefield indocyanine green angiography. Sci. Rep. 2023, 13, 2577. [Google Scholar] [CrossRef]
- Drinkwater, J.J.; Davis, T.M.; Turner, A.W.; Davis, W.A. Retinopathy prevalence, incidence and trajectories in type 2 diabetes: The Fremantle diabetes study phase II. Diabet. Med. 2023, 40, e15032. [Google Scholar] [CrossRef]
- Martinez-Zapata, M.J.; Salvador, I.; Martí-Carvajal, A.J.; Pijoán, J.I.; Cordero, J.A.; Ponomarev, D.; Kernohan, A.; Solà, I.; Virgili, G. Anti-vascular endothelial growth factor for proliferative diabetic retinopathy. Cochrane Database Syst. Rev. 2023, 3, CD008721. [Google Scholar] [PubMed]
- Arrigo, A.; Aragona, E.; Bandello, F. VEGF-targeting drugs for the treatment of retinal neovascularization in diabetic retinopathy. Ann. Med. 2022, 54, 1089–1111. [Google Scholar] [CrossRef]
- Kowluru, R.A. Cross talks between oxidative stress, inflammation and epigenetics in diabetic retinopathy. Cells 2023, 12, 300. [Google Scholar] [CrossRef]
- Jena, P.K.; Khuntia, B.; Palai, C.; Nayak, M.; Mishra, T.K.; Mohanty, S.N. A novel approach for diabetic retinopathy screening using asymmetric deep learning features. Big Data Cogn. Comput. 2023, 7, 25. [Google Scholar] [CrossRef]
- Gomułka, K.; Ruta, M. The role of inflammation and therapeutic concepts in diabetic retinopathy—A short review. Int. J. Mol. Sci. 2023, 24, 1024. [Google Scholar] [CrossRef]
- Nahiduzzaman, M.; Islam, M.R.; Goni, M.O.F.; Anower, M.S.; Ahsan, M.; Haider, J.; Kowalski, M. Diabetic retinopathy identification using parallel convolutional neural network based feature extractor and ELM classifier. Expert Syst. Appl. 2023, 217, 119557. [Google Scholar] [CrossRef]
- Kaur, G.; Sinha, R.; Tiwari, P.K.; Yadav, S.K.; Pandey, P.; Raj, R.; Vashisth, A.; Rakhra, M. Face mask recognition system using CNN model. Neurosci. Inform. 2022, 2, 100035. [Google Scholar] [CrossRef] [PubMed]
- Chattopadhyay, A.; Maitra, M. MRI-based brain tumour image detection using CNN based deep learning method. Neurosci. Inform. 2022, 2, 100060. [Google Scholar] [CrossRef]
- Xu, X.; Zhao, M.; Shi, P.; Ren, R.; He, X.; Wei, X.; Yang, H. Crack detection and comparison study based on faster R-CNN and mask R-CNN. Sensors 2022, 22, 1215. [Google Scholar] [CrossRef] [PubMed]
- Shen, Z.; Ramirez-Lopez, L.; Behrens, T.; Cui, L.; Zhang, M.; Walden, L.; Wetterlind, J.; Shi, Z.; Sudduth, K.A.; Baumann, P.; et al. Deep transfer learning of global spectra for local soil carbon monitoring. ISPRS J. Photogramm. Remote Sens. 2022, 188, 190–200. [Google Scholar] [CrossRef]
- Dhaene, A.P.; Loecher, M.; Wilson, A.J.; Ennis, D.B. Myocardial Segmentation of Tagged Magnetic Resonance Images with Transfer Learning Using Generative Cine-To-Tagged Dataset Transformation. Bioengineering 2023, 10, 166. [Google Scholar] [CrossRef]
- Hayati, M.; Muchtar, K.; Maulina, N.; Syamsuddin, I.; Elwirehardja, G.N.; Pardamean, B. Impact of CLAHE-based image enhancement for diabetic retinopathy classification through deep learning. Procedia Comput. Sci. 2023, 216, 57–66. [Google Scholar] [CrossRef]
- Zhou, K.; Tong, Y.; Li, X.; Wei, X.; Huang, H.; Song, K.; Chen, X. Exploring global attention mechanism on fault detection and diagnosis for complex engineering processes. Process. Saf. Environ. Prot. 2023, 170, 660–669. [Google Scholar] [CrossRef]
- Dosovitskiy, A.; Beyer, L.; Kolesnikov, A.; Weissenborn, D.; Zhai, X.; Unterthiner, T.; Dehghani, M.; Minderer, M.; Heigold, G.; Gelly, S.; et al. An image is worth 16 × 16 words: Transformers for image recognition at scale. arXiv 2020, arXiv:2010.11929. [Google Scholar]
- Manzari, O.N.; Ahmadabadi, H.; Kashiani, H.; Shokouhi, S.B.; Ayatollahi, A. MedViT: A robust vision transformer for generalized medical image classification. Comput. Biol. Med. 2023, 157, 106791. [Google Scholar] [CrossRef]
- Xiao, H.; Li, L.; Liu, Q.; Zhu, X.; Zhang, Q. Transformers in medical image segmentation: A review. Biomed. Signal Process. Control. 2023, 84, 104791. [Google Scholar] [CrossRef]
- Liu, Z.; Lin, Y.; Cao, Y.; Hu, H.; Wei, Y.; Zhang, Z.; Lin, S.; Guo, B. Swin transformer: Hierarchical vision transformer using shifted windows. In Proceedings of the IEEE/CVF International Conference on Computer Vision, Montreal, BC, Canada, 11–17 October 2021; pp. 10012–10022. [Google Scholar]
- He, T.; Zhang, Z.; Zhang, H.; Zhang, Z.; Xie, J.; Li, M. Bag of tricks for image classification with convolutional neural networks. In Proceedings of the IEEE/CVF Conference on Computer Vision and Pattern Recognition, Seoul, Republic of Korea, 27–28 October 2019; pp. 558–567. [Google Scholar]
- Liu, Z.; Mao, H.; Wu, C.Y.; Feichtenhofer, C.; Darrell, T.; Xie, S. A convnet for the 2020s. In Proceedings of the IEEE/CVF Conference on Computer Vision and Pattern Recognition, New Orleans, LA, USA, 18–24 June 2022; pp. 11976–11986. [Google Scholar]
- Gou, J.; Yu, B.; Maybank, S.J.; Tao, D. Knowledge distillation: A survey. Int. J. Comput. Vis. 2021, 129, 1789–1819. [Google Scholar] [CrossRef]
- Zhao, B.; Cui, Q.; Song, R.; Qiu, Y.; Liang, J. Decoupled knowledge distillation. In Proceedings of the IEEE/CVF Conference on Computer Vision and Pattern Recognition, New Orleans, LA, USA, 18–24 June 2022; pp. 11953–11962. [Google Scholar]
- Alahmadi, M.D. Texture attention network for diabetic retinopathy classification. IEEE Access 2022, 10, 55522–55532. [Google Scholar] [CrossRef]
- Farag, M.M.; Fouad, M.; Abdel-Hamid, A.T. Automatic severity classification of diabetic retinopathy based on densenet and convolutional block attention module. IEEE Access 2022, 10, 38299–38308. [Google Scholar] [CrossRef]
- Woo, S.; Park, J.; Lee, J.Y.; Kweon, I.S. Cbam: Convolutional block attention module. In Proceedings of the European Conference on Computer Vision (ECCV), Munich, Germany, 8–14 September 2018; pp. 3–19. [Google Scholar]
- Mondal, S.S.; Mandal, N.; Singh, K.K.; Singh, A.; Izonin, I. Edldr: An ensemble deep learning technique for detection and classification of diabetic retinopathy. Diagnostics 2022, 13, 124. [Google Scholar] [CrossRef]
- Menaouer, B.; Dermane, Z.; El Houda Kebir, N.; Matta, N. Diabetic Retinopathy Classification Using Hybrid Deep Learning Approach. SN Comput. Sci. 2022, 3, 357. [Google Scholar] [CrossRef]
- Mungloo-Dilmohamud, Z.; Heenaye-Mamode Khan, M.; Jhumka, K.; Beedassy, B.N.; Mungloo, N.Z.; Peña-Reyes, C. Balancing data through data augmentation improves the generality of transfer learning for diabetic retinopathy classification. Appl. Sci. 2022, 12, 5363. [Google Scholar] [CrossRef]
- Das, D.; Biswas, S.K.; Bandyopadhyay, S. Detection of diabetic retinopathy using convolutional neural networks for feature extraction and classification (DRFEC). Multimed. Tools Appl. 2022, 82, 1–59. [Google Scholar] [CrossRef]
- Attallah, O. DIAROP: Automated deep learning-based diagnostic tool for retinopathy of prematurity. Diagnostics 2021, 11, 2034. [Google Scholar] [CrossRef]
- Mustafa, H.; Ali, S.F.; Bilal, M.; Hanif, M.S. Multi-stream deep neural network for diabetic retinopathy severity classification under a boosting framework. IEEE Access 2022, 10, 113172–113183. [Google Scholar] [CrossRef]
- Raiaan, M.A.K.; Fatema, K.; Khan, I.U.; Azam, S.; ur Rashid, M.R.; Mukta, M.S.H.; Jonkman, M.; De Boer, F. A Lightweight Robust Deep Learning Model Gained High Accuracy in Classifying a Wide Range of Diabetic Retinopathy Images. IEEE Access 2023, 11, 42361–42388. [Google Scholar] [CrossRef]
- Attallah, O. GabROP: Gabor wavelets-based CAD for retinopathy of prematurity diagnosis via convolutional neural networks. Diagnostics 2023, 13, 171. [Google Scholar] [CrossRef] [PubMed]
- Rahman, Z.; Yi-Fei, P.; Aamir, M.; Wali, S.; Guan, Y. Efficient image enhancement model for correcting uneven illumination images. IEEE Access 2020, 8, 109038–109053. [Google Scholar] [CrossRef]
- Özbay, E. An active deep learning method for diabetic retinopathy detection in segmented fundus images using artificial bee colony algorithm. Artif. Intell. Rev. 2023, 56, 3291–3318. [Google Scholar] [CrossRef]
- Saranya, P.; Pranati, R.; Patro, S.S. Detection and classification of red lesions from retinal images for diabetic retinopathy detection using deep learning models. Multimed. Tools Appl. 2023, 82, 39327–39347. [Google Scholar] [CrossRef]
- Bilal, A.; Zhu, L.; Deng, A.; Lu, H.; Wu, N. AI-based automatic detection and classification of diabetic retinopathy using U-Net and deep learning. Symmetry 2022, 14, 1427. [Google Scholar] [CrossRef]
- Gu, Z.; Li, Y.; Wang, Z.; Kan, J.; Shu, J.; Wang, Q. Classification of diabetic retinopathy severity in fundus images using the vision transformer and residual attention. Comput. Intell. Neurosci. 2023, 2023, 1305583. [Google Scholar] [CrossRef]
- Yao, Z.; Yuan, Y.; Shi, Z.; Mao, W.; Zhu, G.; Zhang, G.; Wang, Z. FunSwin: A deep learning method to analysis diabetic retinopathy grade and macular edema risk based on fundus images. Front. Physiol. 2022, 13, 961386. [Google Scholar] [CrossRef]
- Dihin, R.A.; AlShemmary, E.N.; Al-Jawher, W.A.M. Automated Binary Classification of Diabetic Retinopathy by SWIN Transformer. J. AI-Qadisiyah Comput. Sci. Math. 2023, 15, 169. [Google Scholar] [CrossRef]
- Karthik; Maggie, S.D. APTOS 2019 Blindness Detection. 2019. Available online: https://www.kaggle.com/competitions/aptos2019-blindness-detection/ (accessed on 19 October 2023).
- Porwal, P.; Pachade, S.; Kamble, R.; Kokare, M.; Deshmukh, G.; Sahasrabuddhe, V.; Meriaudeau, F. Indian diabetic retinopathy image dataset (IDRiD): A database for diabetic retinopathy screening research. Data 2018, 3, 25. [Google Scholar] [CrossRef]
- Guan, Y.; Aamir, M.; Rahman, Z.; Dayo, Z.A.; Abro, W.A.; Ishfaq, M.; HU, Z. A dual-tree complex wavelet transform-based model for low-illumination image enhancement. Wuhan Univ. J. Nat. Sci. 2021, 26, 405–414. [Google Scholar]
- Dai, Q.; Pu, Y.F.; Rahman, Z.; Aamir, M. Fractional-order fusion model for low-light image enhancement. Symmetry 2019, 11, 574. [Google Scholar] [CrossRef]
- Rahman, Z.; Pu, Y.F.; Aamir, M.; Wali, S. Structure revealing of low-light images using wavelet transform based on fractional-order denoising and multiscale decomposition. Vis. Comput. 2021, 37, 865–880. [Google Scholar] [CrossRef]
- Nyo, M.T.; Mebarek-Oudina, F.; Hlaing, S.S.; Khan, N.A. Otsu’s thresholding technique for MRI image brain tumor segmentation. Multimed. Tools Appl. 2022, 81, 43837–43849. [Google Scholar] [CrossRef]
- Rahman, Z.; Aamir, M.; Ali, Z.; Saudagar, A.K.J.; AlTameem, A.; Muhammad, K. Efficient Contrast Adjustment and Fusion Method for Underexposed Images in Industrial Cyber-Physical Systems. IEEE Syst. J. 2023, 1–12. [Google Scholar] [CrossRef]
- Song, Y.; Li, C.; Xiao, S.; Xiao, H.; Guo, B. Unsharp masking image enhancement the parallel algorithm based on cross-platform. Sci. Rep. 2022, 12, 20175. [Google Scholar] [CrossRef]
- Rahman, Z.; Ali, Z.; Khan, I.; Uddin, M.I.; Guan, Y.; Hu, Z. Diverse image enhancer for complex underexposed image. J. Electron. Imaging 2022, 31, 41213. [Google Scholar] [CrossRef]
- Ma, D.; Hosseinzadeh Taher, M.R.; Pang, J.; Islam, N.U.; Haghighi, F.; Gotway, M.B.; Liang, J. Benchmarking and boosting transformers for medical image classification. In Proceedings of the MICCAI Workshop on Domain Adaptation and Representation Transfer, Singapore, 22 September 2022; pp. 12–22. [Google Scholar]
- He, K.; Zhang, X.; Ren, S.; Sun, J. Deep residual learning for image recognition. In Proceedings of the IEEE Conference on Computer Vision and Pattern Recognition, Las Vegas, NV, USA, 27–30 June 2016; pp. 770–778. [Google Scholar]
- Singh, B.; Patel, S.; Vijayvargiya, A.; Kumar, R. Analyzing the impact of activation functions on the performance of the data-driven gait model. Results Eng. 2023, 18, 101029. [Google Scholar] [CrossRef]
- Su, S.S.; Kek, S.L. An improvement of stochastic gradient descent approach for mean-variance portfolio optimization problem. J. Math. 2021, 2021, 8892636. [Google Scholar] [CrossRef]
- Chollet, F. Xception: Deep learning with depthwise separable convolutions. In Proceedings of the IEEE Conference on Computer Vision and Pattern Recognition, Honolulu, HI, USA, 21–26 July 2017; pp. 1251–1258. [Google Scholar]
- Howard, A.G.; Zhu, M.; Chen, B.; Kalenichenko, D.; Wang, W.; Weyand, T.; Andreetto, M.; Adam, H. Mobilenets: Efficient convolutional neural networks for mobile vision applications. arXiv 2017, arXiv:1704.04861. [Google Scholar]
- Zhao, S.; Wu, Y.; Tong, M.; Yao, Y.; Qian, W.; Qi, S. CoT-XNet: Contextual transformer with Xception network for diabetic retinopathy grading. Phys. Med. Biol. 2022, 67, 245003. [Google Scholar] [CrossRef]
- Saichua, P.; Surinta, O. Comparative Study between Ensemble and Fusion Convolutional Neural Networks for Diabetic Retinopathy Classification. ICIC Express Lett. 2022, 16, 401–408. [Google Scholar]
- Park, S.; Kim, G.; Oh, Y.; Seo, J.B.; Lee, S.M.; Kim, J.H.; Moon, S.; Lim, J.K.; Park, C.M.; Ye, J.C. Self-evolving vision transformer for chest X-ray diagnosis through knowledge distillation. Nat. Commun. 2022, 13, 3848. [Google Scholar] [CrossRef] [PubMed]
- Faramarzi, A.; Heidarinejad, M.; Stephens, B.; Mirjalili, S. Equilibrium optimizer: A novel optimization algorithm. Knowl.-Based Syst. 2020, 191, 105190. [Google Scholar] [CrossRef]
- Hicks, S.A.; Strümke, I.; Thambawita, V.; Hammou, M.; Riegler, M.A.; Halvorsen, P.; Parasa, S. On evaluation metrics for medical applications of artificial intelligence. Sci. Rep. 2022, 12, 5979. [Google Scholar] [CrossRef]
- Kobat, S.G.; Baygin, N.; Yusufoglu, E.; Baygin, M.; Barua, P.D.; Dogan, S.; Yaman, O.; Celiker, U.; Yildirim, H.; Tan, R.S.; et al. Automated diabetic retinopathy detection using horizontal and vertical patch division-based pre-trained DenseNET with digital fundus images. Diagnostics 2022, 12, 1975. [Google Scholar] [CrossRef]
- Mohanty, C.; Mahapatra, S.; Acharya, B.; Kokkoras, F.; Gerogiannis, V.C.; Karamitsos, I.; Kanavos, A. Using Deep Learning Architectures for Detection and Classification of Diabetic Retinopathy. Sensors 2023, 23, 5726. [Google Scholar] [CrossRef]
- Kumar, G.; Chatterjee, S.; Chattopadhyay, C. DRISTI: A hybrid deep neural network for diabetic retinopathy diagnosis. Signal Image Video Process. 2021, 15, 1679–1686. [Google Scholar] [CrossRef]
- Li, Y.; Song, Z.; Kang, S.; Jung, S.; Kang, W. Semi-supervised auto-encoder graph network for diabetic retinopathy grading. IEEE Access 2021, 9, 140759–140767. [Google Scholar] [CrossRef]
- Bhimavarapu, U.; Chintalapudi, N.; Battineni, G. Automatic Detection and Classification of Diabetic Retinopathy Using the Improved Pooling Function in the Convolution Neural Network. Diagnostics 2023, 13, 2606. [Google Scholar] [CrossRef]
- Alwakid, G.; Gouda, W.; Humayun, M. Enhancement of Diabetic Retinopathy Prognostication Using Deep Learning, CLAHE, and ESRGAN. Diagnostics 2023, 13, 2375. [Google Scholar] [CrossRef]
- Elswah, D.K.; Elnakib, A.A.; Moustafa, H.E.d. Automated diabetic retinopathy grading using resnet. In Proceedings of the 2020 37th National Radio Science Conference (NRSC), Cairo, Egypt, 8–10 September 2020; pp. 248–254. [Google Scholar]
- Li, X.; Hu, X.; Yu, L.; Zhu, L.; Fu, C.W.; Heng, P.A. CANet: Cross-disease attention network for joint diabetic retinopathy and diabetic macular edema grading. IEEE Trans. Med. Imaging 2019, 39, 1483–1493. [Google Scholar] [CrossRef] [PubMed]
- Bhardwaj, C.; Jain, S.; Sood, M. Hierarchical severity grade classification of non-proliferative diabetic retinopathy. J. Ambient. Intell. Humaniz. Comput. 2021, 12, 2649–2670. [Google Scholar] [CrossRef]
- Sakaguchi, A.; Wu, R.; Kamata, S.I. Fundus image classification for diabetic retinopathy using disease severity grading. In Proceedings of the 2019 9th International Conference on Biomedical Engineering and Technology, Tokyo, Japan, 28–30 March 2019; pp. 190–196. [Google Scholar]


| Paper | Method | Dataset | Accuracy | Limitation |
|---|---|---|---|---|
| Usman et al. [2] | ResNet152, PCA | DR and CSME | 93.67% | Experiment conducted on one dataset |
| Bilal et al. [40] | U-Net, Inception-V3 | Messidor-2, EyePACS-1, and DIARETDB0 | EyePACS-1: 97.92%, Messidor-2: 94.59%, DIARETDB0: 93.52% | Has a relatively high computational cost. |
| Dihin et al. [43] | Swin Transformer | APTOS | 96% (Binary Classification) | No comparison provided and works only on binary classification. |
| Yao et al. [42] | Swin Transformer | Messidor | 98.66% | Experiment limited to one dataset and lacks detailed experimental outcomes. |
| Gu et al. [41] | Vision Transformer | DDR, IDRiD | DDR: 91.54% IDRiD: 87.92% | Quadratic self-attention time. Therefore, resource-consuming. |
| Farag et al. [27] | CNN, DenseNet169 | APTOS | 82% | Low classification performance. |
| Mondal et al. [29] | GAN, DenseNet101, ResNext | APTOS | 86.08% | Low classification performance. |
| Menaouer et al. [30] | VGG with custom CNN | APTOS | 90% | High computation and results are biased toward the majority class. |
| Mustafa et al. [34] | ResNet50, DenseNet121, PCA | Messidor-2, EyePACS, APTOS, DDR | Messidor-2 95.58%, EyePACS: 89.20%, APTOS: 89%, DDR: 76.81% | High computation and lacks detailed comparison with existing methods. |
| Mungloo et al. [31] | ResNet50 | APTOS, Mauritian | APTOS: 82% Mauritian: 79% | Low classification performance |
| Das et al. [32] | EfficientNetB4 | EyePACS | 79.11% | Low classification performance |
| Alahmadi [26] | Custom two-stream CNN | APTOS | 85% | Low classification performance |
| Raiaan et al. [35] | Lightweight CNN architecture | Combined dataset (Messidor-2, IDRiD, and APTOS) | 98.65% | High number of trainable parameters. |
| Proposed | Xception, Knowledge Distillation | APTOS, IDRiD | APTOS: 99.04% IDRiD: 94.17% | Experiment conducted on two datasets only. |
| Grade | APTOS | IDRiD |
|---|---|---|
| Normal | 1805 | 168 |
| Mild | 370 | 25 |
| Moderate | 999 | 168 |
| Serve | 193 | 93 |
| Proliferative | 295 | 62 |
| Total | 3662 | 516 |
| Hyperparameter | Value | Accuracy on APTOS | Accuracy on IDRiD |
|---|---|---|---|
| Adam | 0.9843 | 0.9270 | |
| Optimizer | Adamax | 0.9861 | 0.9236 |
| RMSProp | 0.9702 | 0.9061 | |
| 0.1 | 0.9636 | 0.9346 | |
| Learning Rate | 0.005 | 0.9690 | 0.9308 |
| 0.001 | 0.9781 | 0.9383 | |
| 20 | 0.8256 | 0.8642 | |
| Epoch | 50 | 0.9411 | 0.9259 |
| 100 | 0.9904 | 0.9417 |
| Model | Size (MB) | Total Parameters | Trainable Parameters |
|---|---|---|---|
| Inception-ResNet-v2 | 216.5 | 54.35 M | 0.4 M |
| ViT Base | 350.1 | 87.46 M | 0.3 M |
| Inception-ResNet-v2 + ViT Base | 568.7 | 141.81 M | 0.9 M |
| ResNet152V2 + ViT Base | 584.4 | 145.81 M | 0.6 M |
| DenseNet121 + ViT Base | 379 | 94.51 M | 0.7 M |
| MobileNetV3Large + ViT Large | 1010.7 | 308.52 M | 0.7 M |
| ResNet152V2 + ViT Large | 1230.9 | 363.86 M | 1.2 M |
| ResNet152V2 + Swin Transformer | 1460.3 | 254.26 M | 1.4 M |
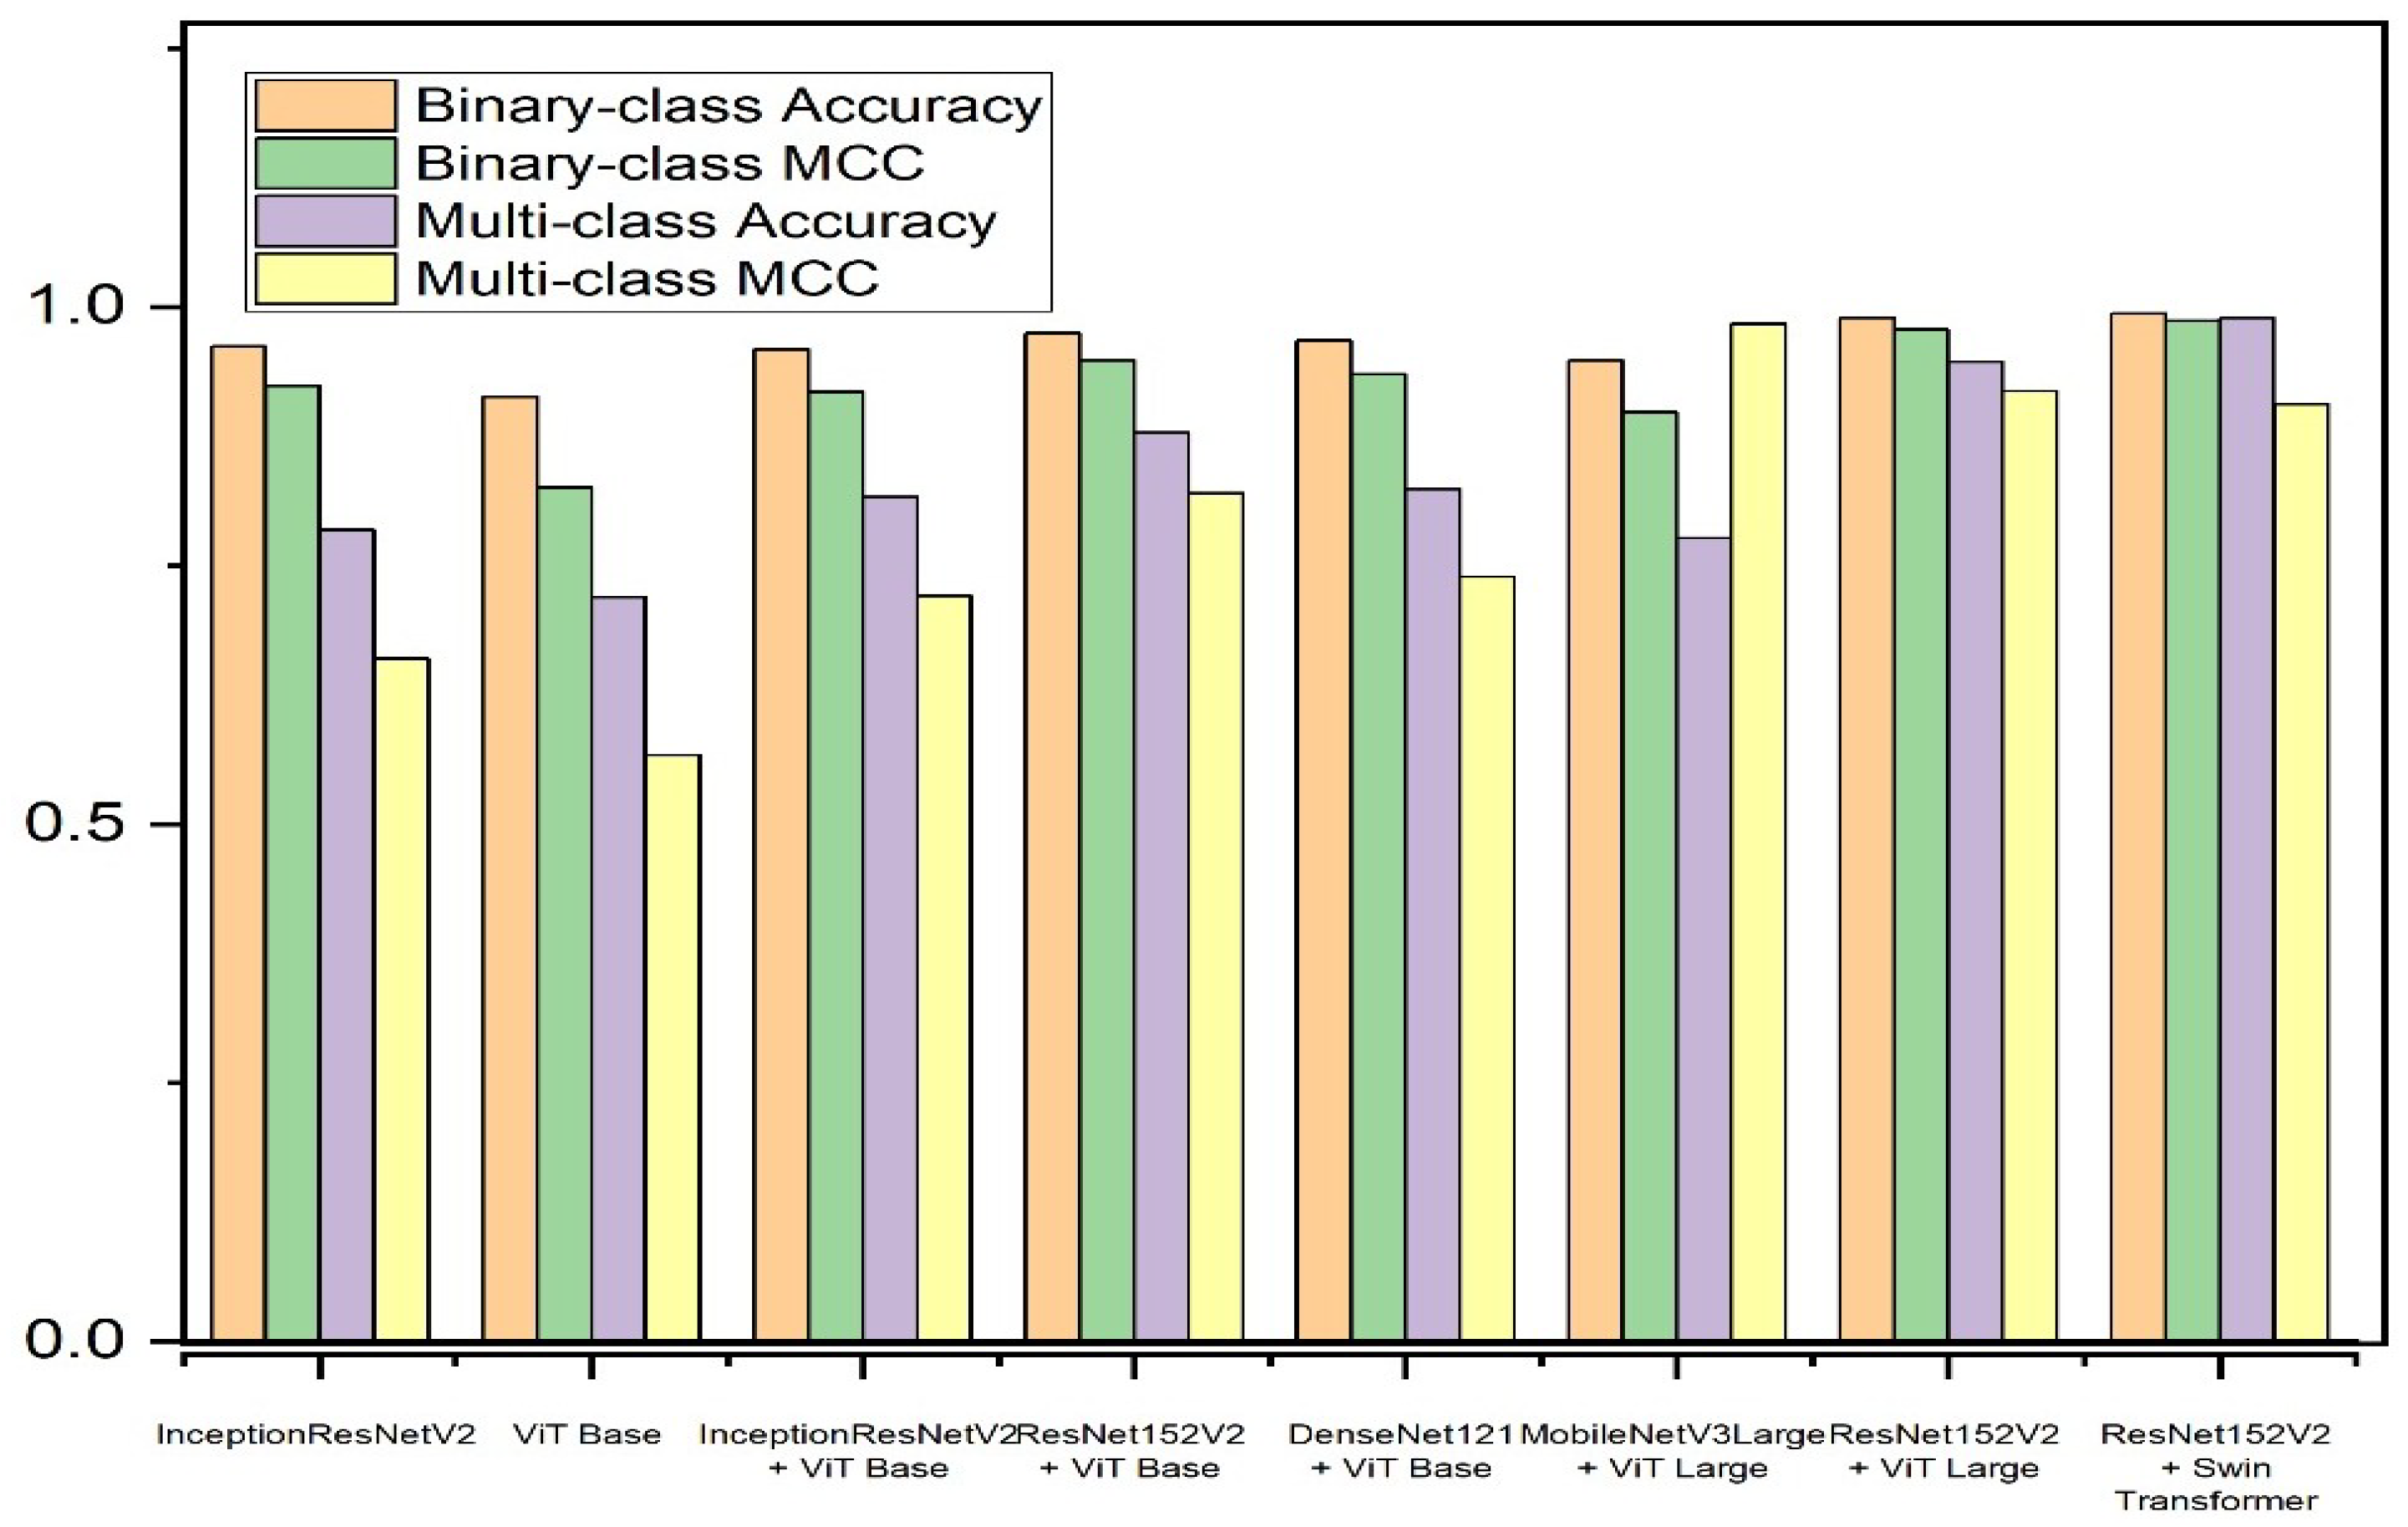
| Model | Binary Class Accuracy | Binary Class MCC | Multi-Class Accuracy | Multi-Class MCC |
|---|---|---|---|---|
| Inception-ResNet-v2 | 0.9618 | 0.9236 | 0.7844 | 0.6601 |
| ViT Base | 0.9127 | 0.8250 | 0.7190 | 0.5666 |
| Inception-ResNet-v2 + ViT Base | 0.9591 | 0.9180 | 0.8158 | 0.7207 |
| ResNet152V2 + ViT Base | 0.9741 | 0.9484 | 0.8786 | 0.8199 |
| DenseNet121 + ViT Base | 0.9673 | 0.9352 | 0.8240 | 0.7387 |
| MobileNetV3Large + ViT Large | 0.9482 | 0.8983 | 0.7763 | 0.9834 |
| ResNet152V2 + ViT Large | 0.9891 | 0.9781 | 0.9468 | 0.9186 |
| ResNet152V2 + Swin Transformer | 0.9932 | 0.9864 | 0.9891 | 0.9061 |
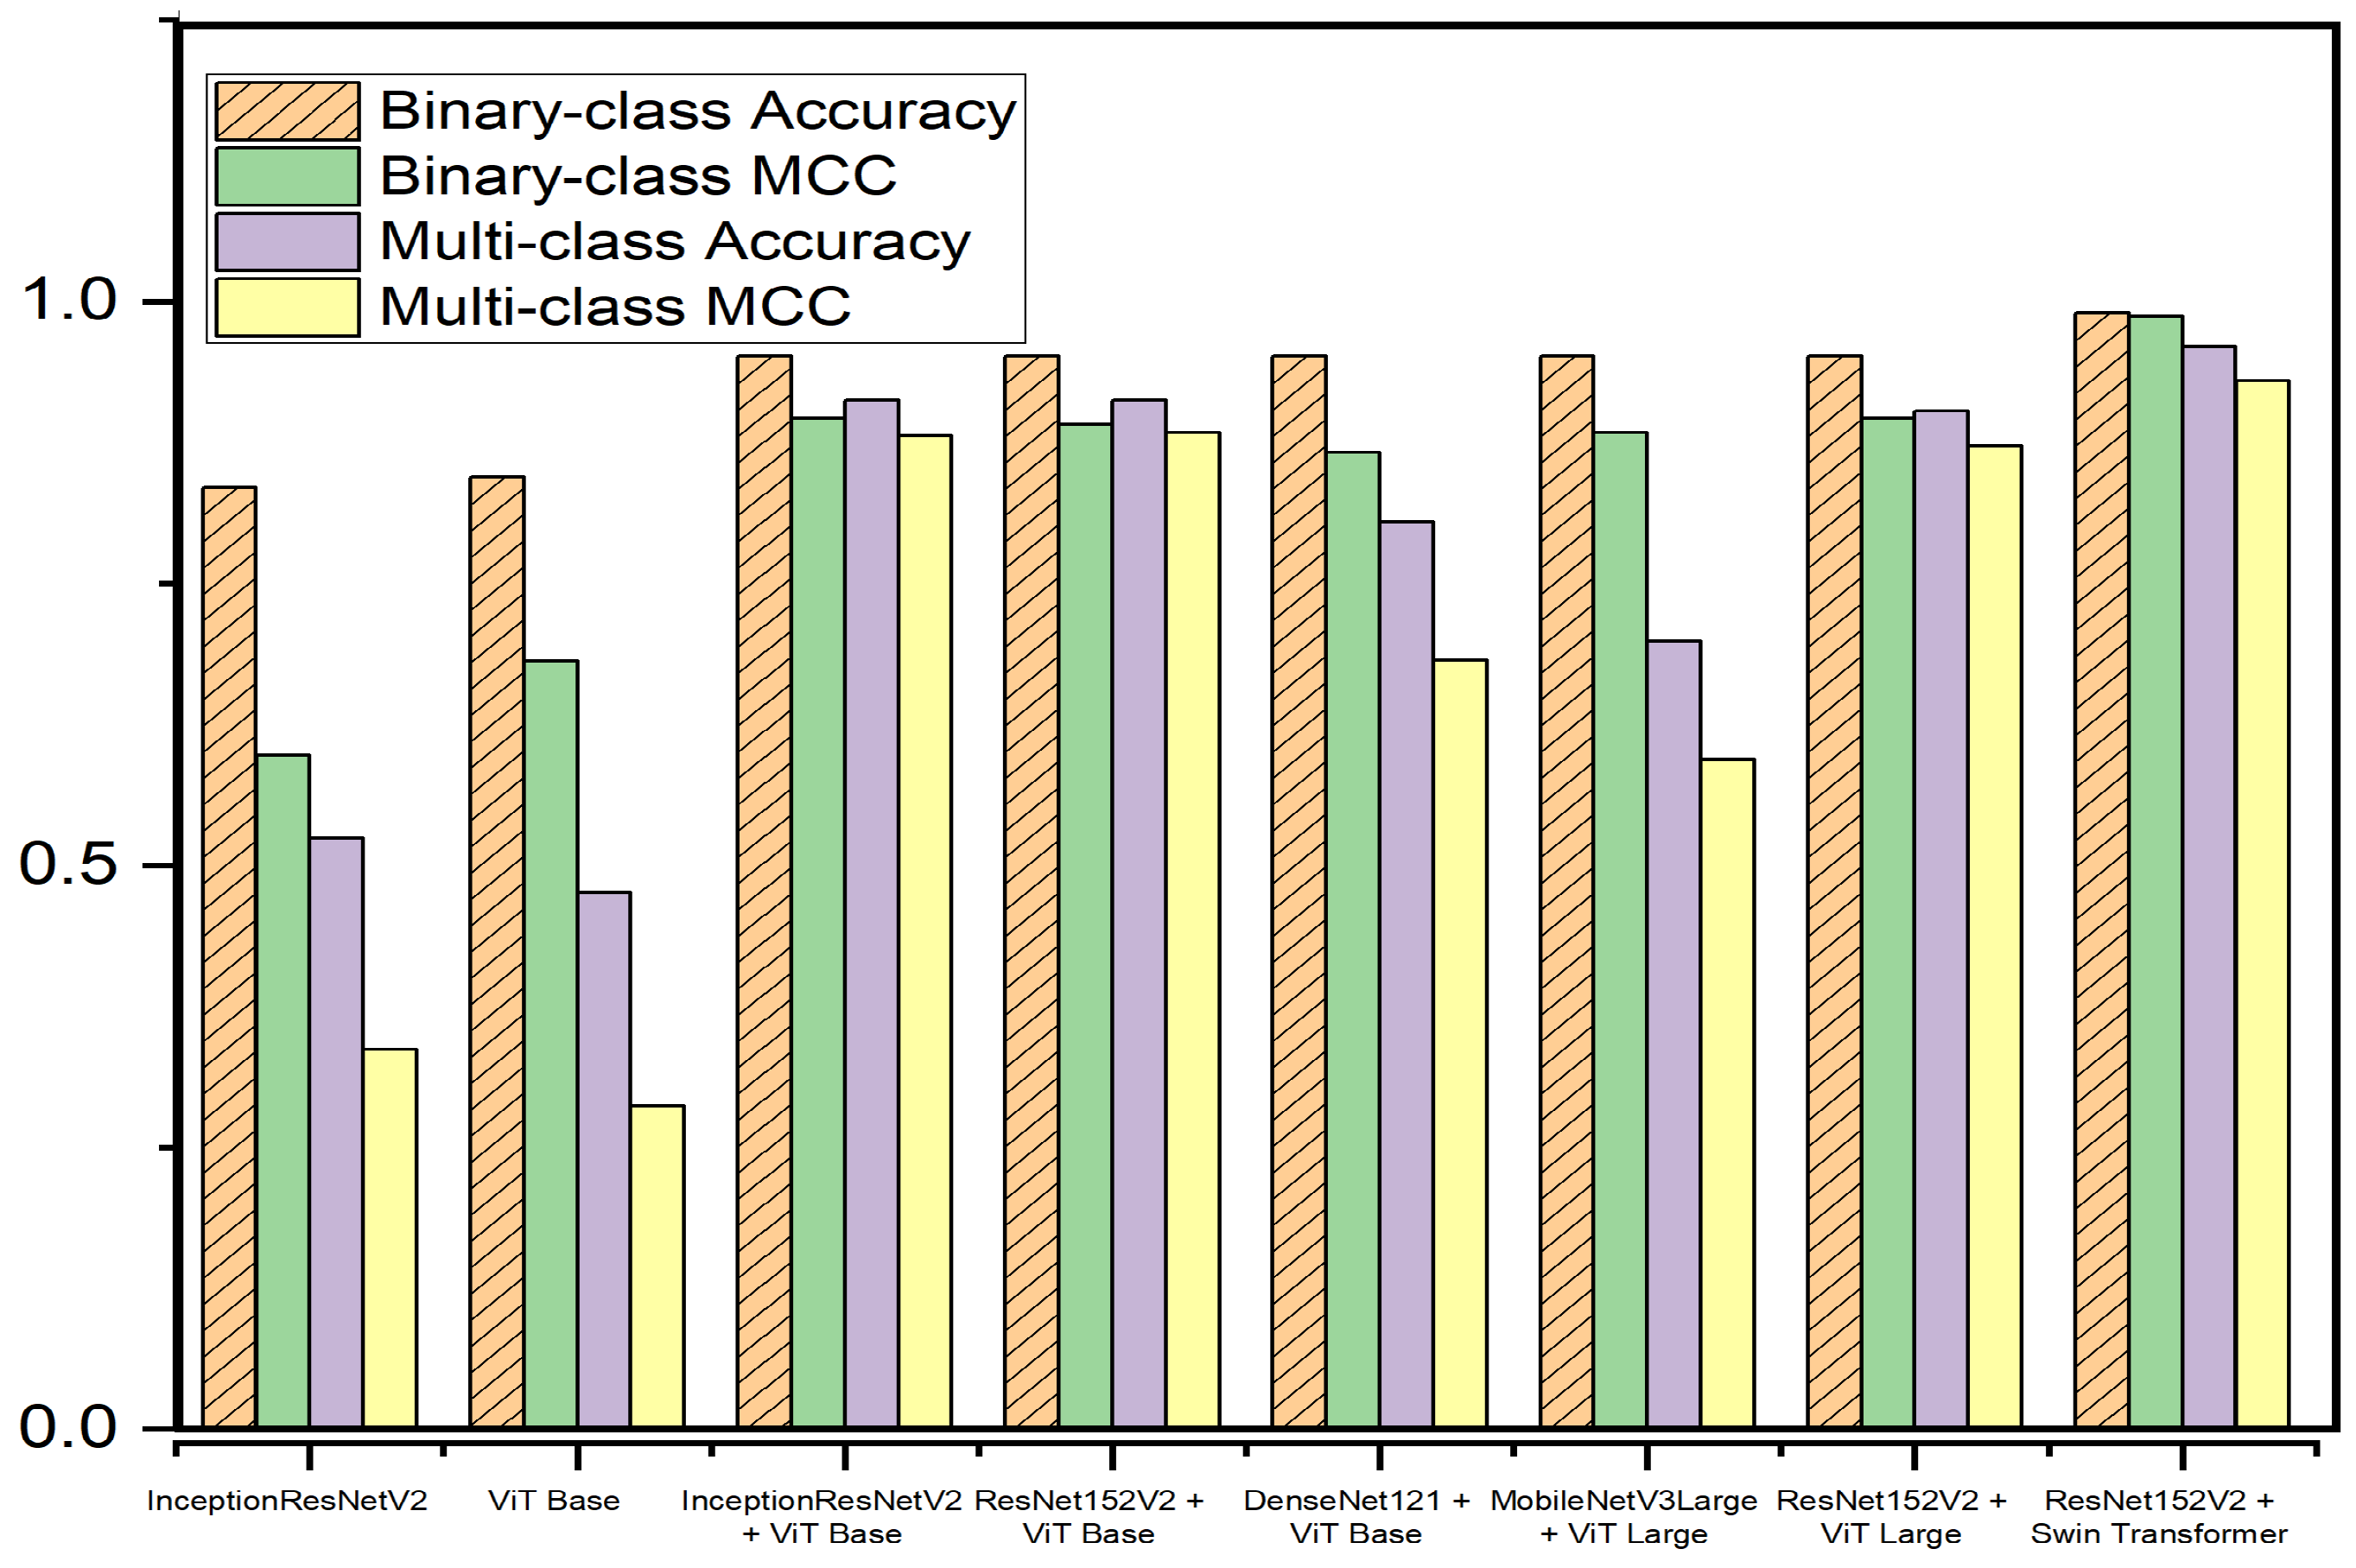
| Model | Binary Class Accuracy | Binary Class MCC | Multi-Class Accuracy | Multi-Class MCC |
|---|---|---|---|---|
| Inception-ResNet-v2 | 0.8350 | 0.5976 | 0.5243 | 0.3367 |
| ViT Base | 0.8447 | 0.6812 | 0.4757 | 0.2867 |
| Inception-ResNet-v2 + ViT Base | 0.9515 | 0.8970 | 0.9126 | 0.8809 |
| ResNet152V2 + ViT Base | 0.9515 | 0.8913 | 0.9126 | 0.8838 |
| DenseNet121 + ViT Base | 0.9519 | 0.8664 | 0.8046 | 0.6814 |
| MobileNetV3Large + ViT Large | 0.9515 | 0.8838 | 0.6990 | 0.5943 |
| ResNet152V2 + ViT Large | 0.9515 | 0.8970 | 0.9029 | 0.8721 |
| ResNet152V2 + Swin Transformer | 0.9903 | 0.9873 | 0.9601 | 0.9301 |
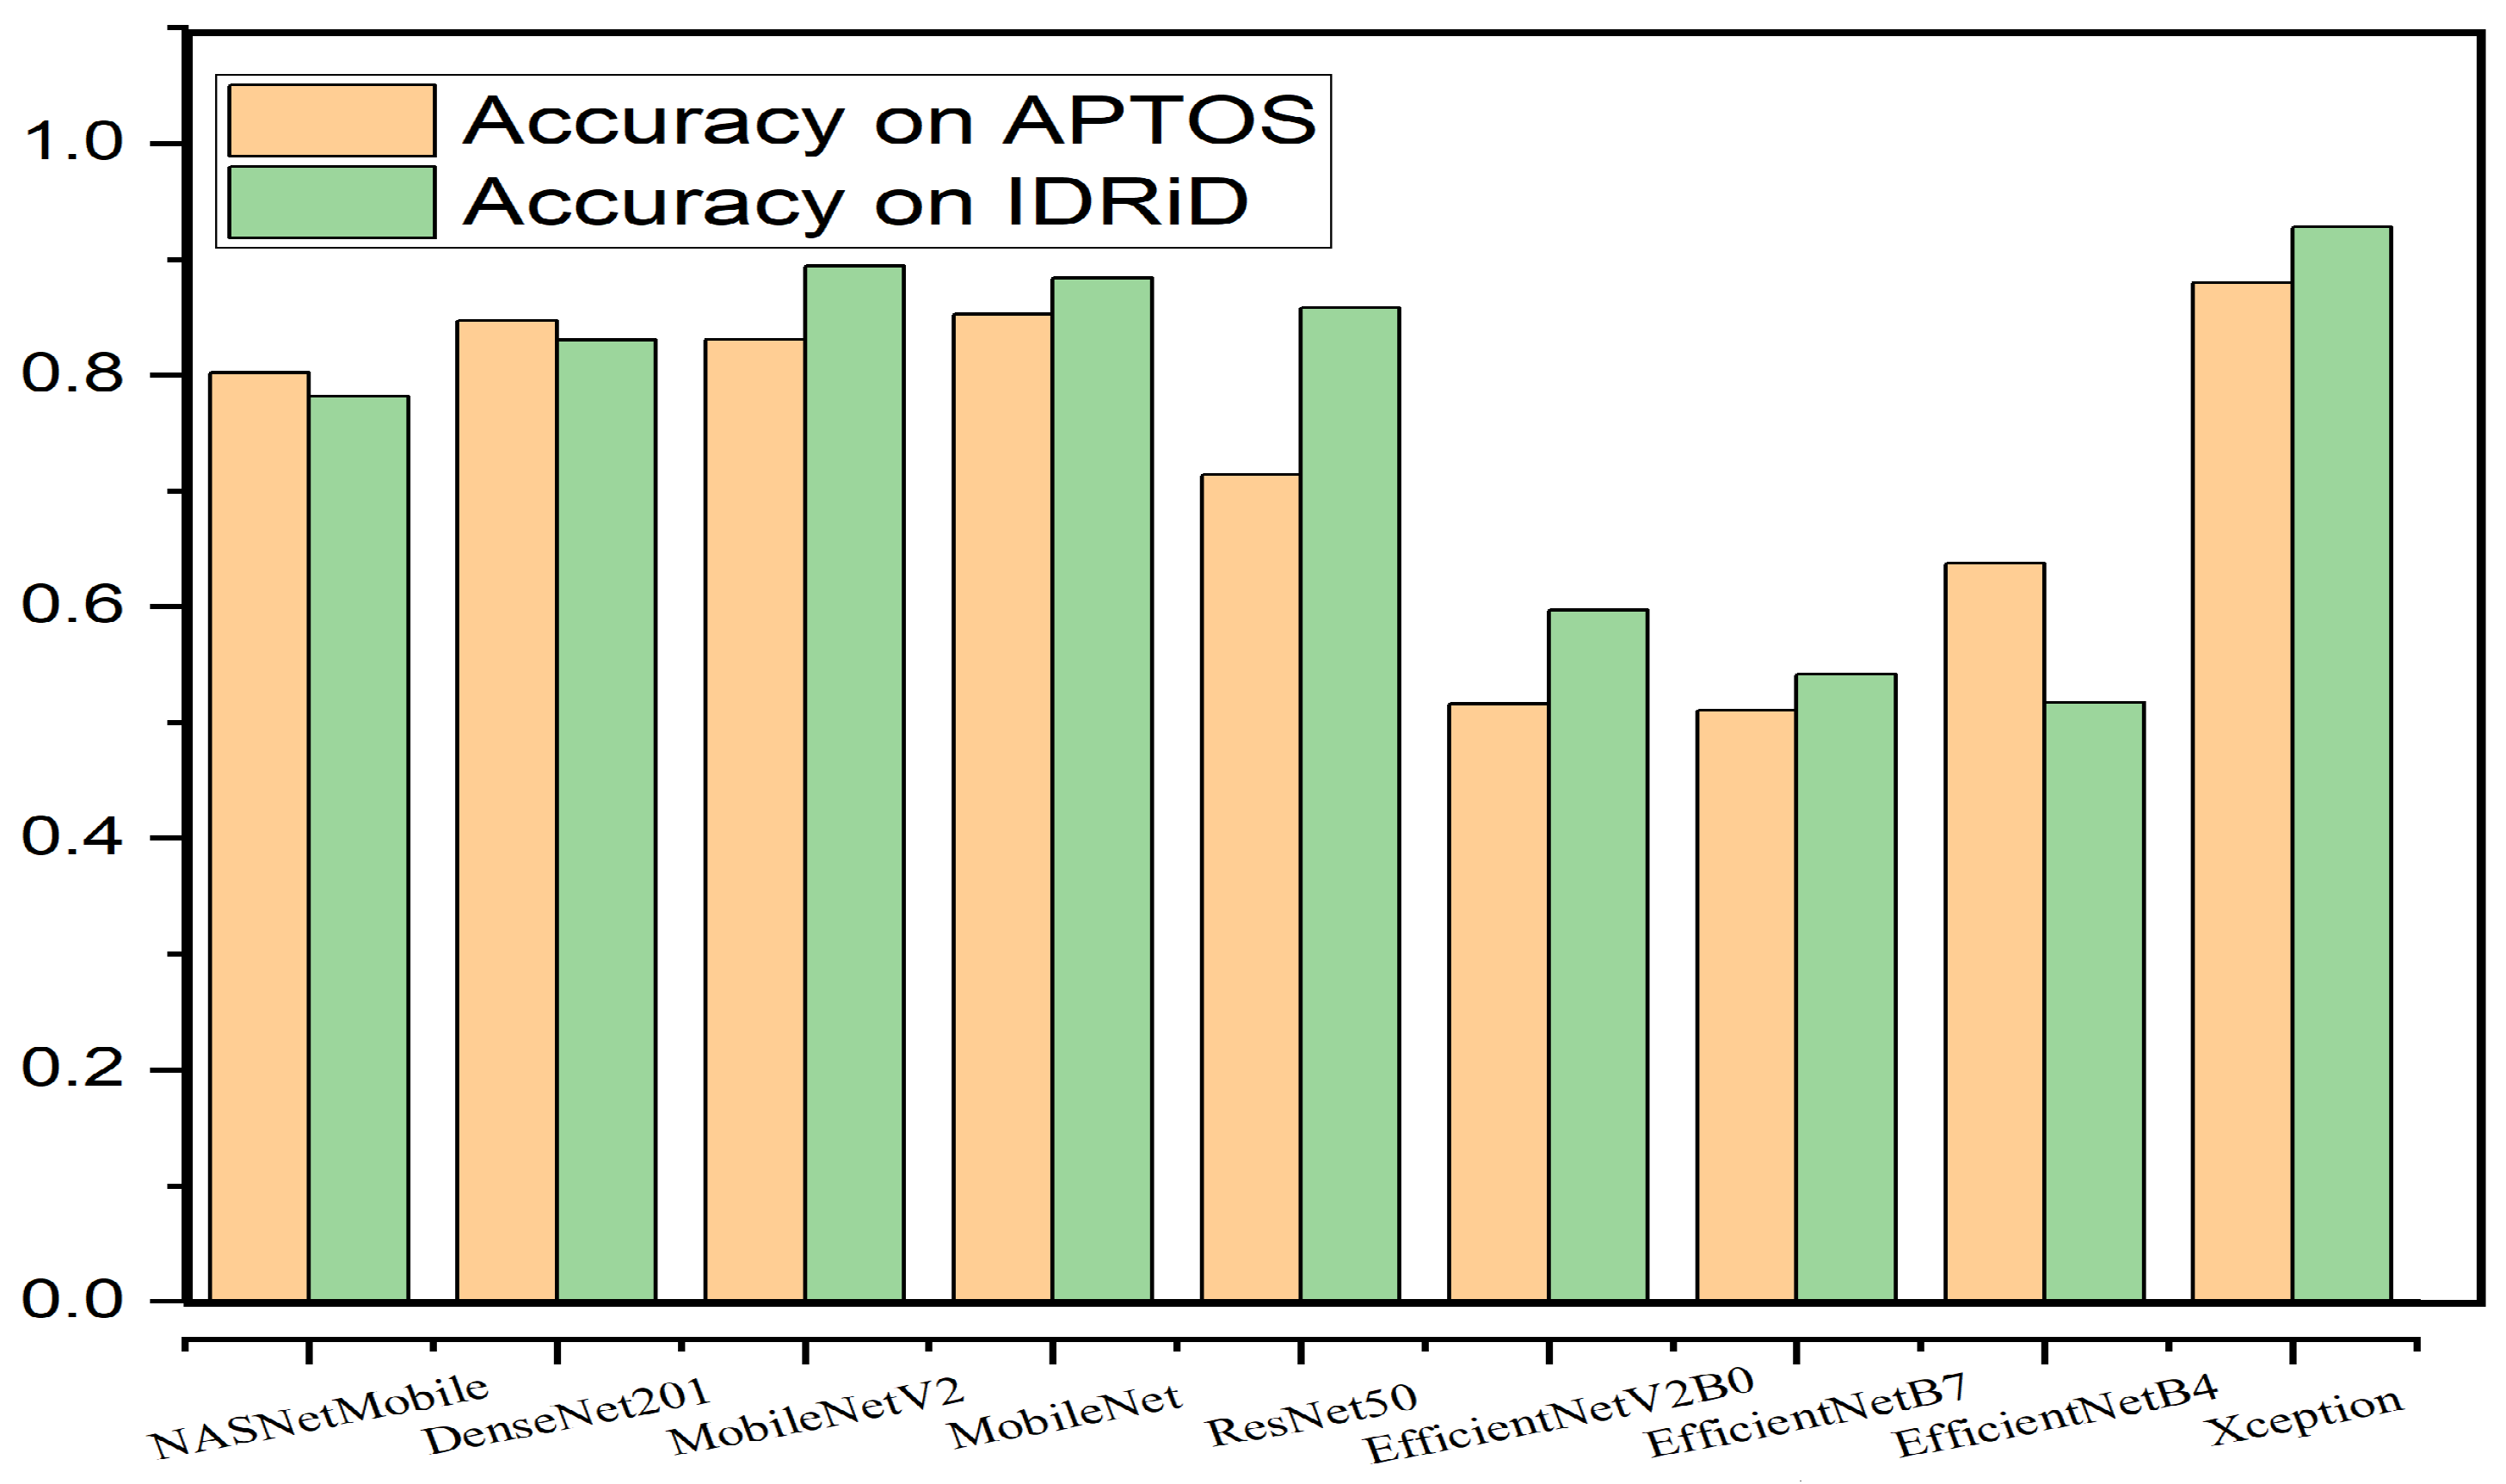
| Model | Size (MB) | Total Parameters | Trainable Parameters |
|---|---|---|---|
| NASNetMobile | 19.4 | 4.5 M | 0.2 M |
| DenseNet201 | 73.7 | 18.8 M | 0.4 M |
| MobileNetV2 | 10.4 | 2.6 M | 0.3 M |
| MobileNet | 13.6 | 3.5 M | 0.2 M |
| ResNet50 | 92.5 | 24.2 M | 0.5 M |
| EfficientNetV2B0 | 24.6 | 6.3 M | 0.3 M |
| EfficientNetB7 | 248.7 | 64.7 M | 0.6 M |
| EfficientNetB4 | 70.2 | 18.2 M | 0.4 M |
| Xception | 82 | 21.4 M | 0.5 M |
| Model | Multi-Class Accuracy (APTOS) | Multi-Class MCC (APTOS) | Multi-Class Accuracy (IDRiD) | Multi-Class MCC (IDRiD) |
|---|---|---|---|---|
| NASNetMobile | 0.8158 | 0.7134 | 0.7723 | 0.6363 |
| DenseNet201 | 0.8322 | 0.7523 | 0.8208 | 0.7190 |
| MobileNetV2 | 0.8022 | 0.6911 | 0.7903 | 0.5047 |
| MobileNet | 0.8336 | 0.7450 | 0.7894 | 0.6809 |
| ResNet50 | 0.7531 | 0.6152 | 0.6239 | 0.4216 |
| EfficientNetV2B0 | 0.4748 | 0.0000 | 0.5170 | 0.4003 |
| EfficientNetB7 | 0.4911 | 0.0000 | 0.4658 | 0.3583 |
| EfficientNetB4 | 0.6112 | 0.3917 | 0.5062 | 0.6419 |
| Xception | 0.8623 | 0.8194 | 0.9041 | 0.8850 |
| Model | Binary Class Accuracy | Binary Class MCC | Multi-Class Accuracy | Multi-Class MCC |
|---|---|---|---|---|
| NASNetMobile | 0.9591 | 0.9180 | 0.8022 | 0.7060 |
| DenseNet201 | 0.9673 | 0.9346 | 0.8472 | 0.7738 |
| MobileNetV2 | 0.9645 | 0.9298 | 0.8308 | 0.7408 |
| MobileNet | 0.9714 | 0.9429 | 0.8527 | 0.7747 |
| ResNet50 | 0.9372 | 0.8748 | 0.7135 | 0.5720 |
| EfficientNetV2B0 | 0.6985 | 0.4643 | 0.5157 | 0.0000 |
| EfficientNetB7 | 0.8226 | 0.6510 | 0.5102 | 0.0000 |
| EfficientNetB4 | 0.8663 | 0.7312 | 0.6371 | 0.4530 |
| Xception | 0.9673 | 0.9345 | 0.8799 | 0.8194 |
| Model | Binary Class Accuracy | Binary Class MCC | Multi-Class Accuracy | Multi-Class MCC |
|---|---|---|---|---|
| NASNetMobile | 0.9130 | 0.7980 | 0.7819 | 0.6696 |
| DenseNet201 | 0.9252 | 0.6341 | 0.8304 | 0.7507 |
| MobileNetV2 | 0.9530 | 0.8490 | 0.8941 | 0.8290 |
| MobileNet | 0.9158 | 0.4480 | 0.8836 | 0.6973 |
| ResNet50 | 0.8224 | 0.6020 | 0.8579 | 0.6138 |
| EfficientNetV2B0 | 0.7757 | 0.4583 | 0.5970 | 0.4801 |
| EfficientNetB7 | 0.7280 | 0.4561 | 0.5412 | 0.4397 |
| EfficientNetB4 | 0.7273 | 0.1267 | 0.5170 | 0.4003 |
| Xception | 0.9623 | 0.9094 | 0.9279 | 0.892 |
| Architecture | Accuracy | Precision | Recall | F1 Score |
|---|---|---|---|---|
| DenseNet201 [64] | 0.86 | - | - | 0.7251 |
| ResNet50 [31] | 0.82 | - | - | - |
| Texture attention, spatial attention [26] | 0.851 | - | 0.903 | 0.984 |
| DenseNet121 [65] | 0.9730 | - | - | - |
| Squeeze excitation-based dense network [65] | 0.86 | 0.77 | 0.7 | 0.73 |
| VGG16 and capsule network [66] | 0.99 | - | - | - |
| Semi-supervised auto-encoder graph network [67] | 0.944 | - | 0.84 | - |
| Improved ResNet-50 [68] | 0.9825 | 0.9986 | 0.9584 | 0.99856 |
| DenseNet-121 [69] | 0.9836 | 0.98 | 0.98 | 0.98 |
| Parallel CNN [10] | 0.9727 | 0.96 | 0.95 | 0.95 |
| Proposed | 0.9904 | 0.9906 | 0.9904 | 0.9903 |
Disclaimer/Publisher’s Note: The statements, opinions and data contained in all publications are solely those of the individual author(s) and contributor(s) and not of MDPI and/or the editor(s). MDPI and/or the editor(s) disclaim responsibility for any injury to people or property resulting from any ideas, methods, instructions or products referred to in the content. |
© 2023 by the authors. Licensee MDPI, Basel, Switzerland. This article is an open access article distributed under the terms and conditions of the Creative Commons Attribution (CC BY) license (https://creativecommons.org/licenses/by/4.0/).
Share and Cite
Islam, N.; Jony, M.M.H.; Hasan, E.; Sutradhar, S.; Rahman, A.; Islam, M.M. Toward Lightweight Diabetic Retinopathy Classification: A Knowledge Distillation Approach for Resource-Constrained Settings. Appl. Sci. 2023, 13, 12397. https://doi.org/10.3390/app132212397
Islam N, Jony MMH, Hasan E, Sutradhar S, Rahman A, Islam MM. Toward Lightweight Diabetic Retinopathy Classification: A Knowledge Distillation Approach for Resource-Constrained Settings. Applied Sciences. 2023; 13(22):12397. https://doi.org/10.3390/app132212397
Chicago/Turabian StyleIslam, Niful, Md. Mehedi Hasan Jony, Emam Hasan, Sunny Sutradhar, Atikur Rahman, and Md. Motaharul Islam. 2023. "Toward Lightweight Diabetic Retinopathy Classification: A Knowledge Distillation Approach for Resource-Constrained Settings" Applied Sciences 13, no. 22: 12397. https://doi.org/10.3390/app132212397
APA StyleIslam, N., Jony, M. M. H., Hasan, E., Sutradhar, S., Rahman, A., & Islam, M. M. (2023). Toward Lightweight Diabetic Retinopathy Classification: A Knowledge Distillation Approach for Resource-Constrained Settings. Applied Sciences, 13(22), 12397. https://doi.org/10.3390/app132212397